Abstract
This work presents a one-dimensional (1D) model for simulating the behavior of an FCC riser reactor processing bio-oil. The FCC riser is modeled as a plug-flow reactor, where the bio-oil feed undergoes vaporization followed by catalytic cracking reactions. The bio-oil droplets are represented using a Lagrangian framework, which accounts for their movement and evaporation within the gas-solid flow field, enabling the assessment of droplet size impact on reactor performance. The cracking reactions are modeled using a four-lumped kinetic scheme, representing the conversion of bio-oil into gasoline, kerosene, gas, and coke. The resulting set of ordinary differential equations is solved using a stiff, second- to third-order solver. The simulation results are validated against experimental data from a full-scale FCC unit, demonstrating good agreement in terms of product yields. The findings indicate that heat exchange by radiation is negligible and that the Buchanan correlation best represents the heat transfer between the droplets and the catalyst particles/gas phase. Another significant observation is that droplet size, across a wide range, does not significantly affect conversion rates due to the bio-oil’s high vaporization heat. The proposed reduced-order model provides valuable insights into optimizing FCC riser reactors for bio-oil processing while avoiding the high computational costs of 3D CFD simulations. The model can be applied across multiple applications, provided the chemical reaction mechanism is known. Compared to full models such as CFD, this approach can reduce computational costs by thousands of computing hours.
1. Introduction
The increasing demand for sustainable energy sources has driven significant research into the utilization of bio-oil in fluid catalytic cracking (FCC) reactors. Bio-oil, derived from biomass, presents a promising alternative to conventional fossil fuels due to its renewable nature and potential for reducing greenhouse gas emissions. Pilot-scale experimental tests have proven the feasibility of co-processing raw or pyrolysis bio-oils and attested to the presence of renewable carbon in the processed fuels [1,2]. However, the complex chemical composition and behavior of bio-oil in FCC processes require advanced modeling techniques to optimize reactor performance and product yields.
Several numerical studies have investigated FCC risers operating with gas oil [3,4], while only a few have focused on bio-oil operations [5,6], primarily using Computational Fluid Dynamics (CFD) methods. The pioneering works [7,8] provided an integrated understanding of catalyst performance and kinetic modeling in the upgrading of bio-oil. The first study experimentally evaluated a variety of catalysts—including zeolites and noble metals—showing that while HZSM-5 favored aromatic hydrocarbon production, it also led to higher coke formation, whereas noble metals offered better selectivity but come at greater cost. The second work advanced this work by developing a detailed kinetic model for HZSM-5-catalyzed upgrading, estimating parameters for key reactions such as deoxygenation and aromatization, and successfully predicting product yields across operating conditions. Together, they highlighted the trade-offs between catalyst efficiency and coke resistance, and emphasized the critical role of kinetic modeling in designing scalable, efficient bio-oil upgrading processes.
Ref. [5] provided a comprehensive analysis of two decades of research on integrating renewable oils—such as bio-oils from pyrolysis, vegetable oils, and animal fats—into conventional FCC processes. It highlighted the potential of co-processing these biomass-derived oils with petroleum feedstocks to reduce greenhouse gas emissions and leverage existing refinery infrastructure with minimal capital investment. However, it also underscored significant challenges, including the high oxygen content and chemical instability of bio-oils, catalyst deactivation, and compatibility issues that affect product yields and quality. They concluded that while co-processing is promising, further advancements in catalyst design, feedstock pre-treatment, and process optimization are essential for commercial viability.
Ref. [6] investigated the hydrodynamics and chemical conversion in a pilot-scale riser reactor. Using a 2D Eulerian–Eulerian model validated with experimental pressure and catalyst distribution data, they simulated the impact of gas-solid flow rates on catalyst residence time. A simplified five-product lumped kinetic model was used to simulate the upgrading reactions. While the physical behavior was well captured, the results underscore the limitations of current kinetic schemes in accurately modeling complex bio-oil chemistry.
Ref. [9] used the code MFIX-Exa to simulate a 2500-ton-per-day BFCC regenerator. The project focused on the kinetics of biogenic coke oxidation, catalyst regeneration, and reactor design optimization. They developed a new kinetic model for BFCC catalyst regeneration, investigated key parameters on reactor performance, and determined the air distributor configuration as well as other simulation parameters.
Despite significant advances in computer hardware and software, two- and three-dimensional CFD models remain computationally demanding. Consequently, developing alternative models that provide faster results without considerable loss of accuracy is of practical importance.
Recent advances in computing hardware have significantly enhanced fluid flow simulation capabilities. However, complex multiphase flows, such as those in circulating fluidized beds, remain challenging due to dominant spatial structures and intricate variable interactions that are difficult to capture. The oil atomization, droplet–particle collision, and multicomponent evaporation are some of the many complex phenomena that take place inside the reactor. The complete mathematical description of such physical behavior is yet to be accomplished. To support both design and control, accurate yet computationally efficient models are crucial.
A promising approach is the use of reduced-order models (ROMs), which extract dominant flow features and solve only for their corresponding weighting coefficients, thereby drastically reducing the number of degrees of freedom. Brenner et al. (2012) developed a ROM for non-isothermal flow based on full-order CFD simulations of a two-dimensional fluidized bed using a two-phase hydrodynamic model, demonstrating excellent agreement with high-fidelity results [10]. Huang et al. (2018) highlighted the potential of mathematically rigorous ROMs for efficiently and accurately simulating combustion dynamics. While projection-based ROMs significantly lower computational costs, their accuracy depends on capturing sharp gradients in temperature and species concentrations, which are key characteristics of reacting flows [11].
In this study, we present a reduced-order model (ROM) for FCC reactors operating with bio-oil feedstock. The model builds upon the approach proposed by [12] and is implemented in MATLAB, R2023b leveraging its computational efficiency to perform complex analyses within seconds. This rapid processing capability facilitates extensive parametric studies and optimization tasks, which are essential for the practical application of bio-oil in FCC units.
The proposed model employs a one-dimensional Eulerian framework for the gas phase, ensuring a simplified, yet accurate, representation of the reactor’s fluid dynamics. Simultaneously, catalyst particles and bio-oil droplets are treated using a Lagrangian approach, capturing their discrete nature and interactions with the gas flow. This hybrid modeling strategy enables a detailed analysis of multiphase flow behavior and reaction kinetics, offering valuable insights into FCC reactor performance and optimization for bio-oil processing.
The model’s reduced-order nature, combined with its high computational efficiency, makes it a valuable tool for both academic research and industrial applications, particularly in the preliminary design and analysis of more sustainable and optimized FCC processes handling bio-oil. Validation against experimental data confirms its reliability, with results showing good agreement with the findings of [13]. These results underscore the potential of reduced-order modeling in accurately capturing key flow characteristics while drastically reducing computational costs, providing a practical alternative to full CFD simulations for process analysis, optimization, and control. The model also facilitates the identification of challenges and issues associated with adapting existing FCC units for bio-oil processing. By providing rapid insights into fluid dynamics, reaction kinetics, and heat transfer, it helps pinpoint key operational limitations and optimization opportunities. These include factors such as steam, catalyst and feed flow rates, feedstock vaporization behavior, and potential modifications required to maintain efficiency. This capability makes the model a valuable tool for assessing feasibility and guiding practical adaptations in industrial FCC processes.
2. Mathematical Model
The simplified model used in this work is based on one-dimensional, steady-state conservation equations for the gas phase within a Eulerian framework. Catalyst particles and oil droplets are treated using a Lagrangian approach, modified to consider the axial direction of the riser. Specifically, the continuity and energy equations are solved for the gas phase, while the pressure gradient across the fluidized bed is determined by considering only the most relevant contributions, allowing gas movement. Regarding the droplets and particles, only drag, weight, and buoyancy effects are included. Additionally, heat exchange via convection and radiation between the gas and the particles, as well as between the gas and the droplets, is accounted for. Furthermore, heat transfer between the particles and droplets is incorporated into the mathematical model. Both droplets and particles are fed at the bottom of the riser and move upward through the reactor due to the drag of the gas phase.
2.1. Transport Equations
Gas continuity is given by
where denotes the gas volume fraction, is the gas density, and the gas velocity. On the RHS, represents the droplet number density, i.e., the actual number of droplets per total volume, and is the droplet vaporization rate.
The equations for gas energy are as follows:
If < and > 0,
and if = and > 0,
where is the boiling point of the liquid, is the heat capacity of the gas phase, is the gas temperature, is the convective heat transfer coefficient between the gas and the particles, is the surface area of the catalyst particle, represents the particle number density, i.e., the actual number of particles per total volume, is the particle temperature, is the convective heat transfer coefficient between the gas and the droplets, is the emissivity, is the Stefan–Boltzmann constant, and denotes the latent heat of vaporization of the droplets.
Vaporizing species continuity is represented as follows:
where is the molar concentration of the vaporization species (gas oil or bio-oil) in the gas phase, is its molecular weight, and is its reaction rate.
Other species continuity is represented as follows:
where is the molar concentration of species i in the gas phase and the total reaction rate.
Pressure gradient across the riser is as follows:
where P is pressure, and are friction factors, and D is the riser diameter.
Solid continuity is given as follows:
where represents the solid volume fraction, is the solid density, and is the solid velocity. Equation (7) is used to determine the gas volume fraction, , through the following relation:
Solid momentum is given by
where is the drag coefficient, is the particle diameter, and g is the gravity acceleration. To derive Equation (9), the following transformation was used:
Solid energy is given by
where is the heat capacity of the particle, is the solid density, is the solid temperature, and is the heat of the reaction due to the cracking reactions:
where i runs over all reactions included in the kinetic mechanism, is the reaction rate, and its respective enthalpy.
Droplet continuity is given by
with representing the droplet mass and the droplet velocity.
Droplet diameter is given by
Droplet momentum is given by
Droplet energy is represented as below.
If < ,
and if >= and < ,
and if = ,
where is the droplet heat capacity, and is the vaporization temperature. To derive the droplet equations above, the following transformation was used:
Auxiliary Relations
Drag Coefficient [14] is given below:
where and represent the particle and droplet Reynolds numbers, respectively:
and is the dynamic viscosity of the gas phase.
Gas density is given by
where the summation runs over all the species in the gas phase (oil, steam, light gas, gasoline and kerosene).
Heat transfer coefficients are as follows.
For gas-solid,
where is the Prandtl number as follows:
For gas-droplet, the Ranz–Marschall correlation is as follows:
and the Buchanan correlation is as follows:
where the effective Reynolds number is defined as follows:
It is worth mentioning that the effective Reynolds number used by Buchanan’s model considers the solid phase density instead of the gaseous, resulting in a higher heat transfer between the phases.
The vaporization rate is given as follows:
If ,
In such a temperature range, it is assumed that the mass transfer from the droplet to the surrounding gas is limited by convection. represents the gas oil or bio-oil vapor flux from the droplet surface to the gas phase and its respective molecular weight:
is the convective mass transfer coefficient, which can be calculated as follows:
the Schmidt number is given by
where is the effective diffusivity in the gas phase. and are the molar concentrations of the vaporizing species at the droplet–gas interface and in the bulk gas phase, respectively. Vapor–liquid equilibrium is assumed at the interface, with the saturation pressure given by
where is the saturation pressure at temperature . can be calculated as follows:
If , i.e., during the boiling phase, the vaporization rate reads as follows:
2.2. Reaction Mechanisms
2.2.1. Gas Oil Catalytic Cracking
All reaction rates are calculated as follows:
The variation of the kinetic constant with temperature is given by the Arrhenius equation:
where is the pre-exponential factor, and is the activation energy. The parameter represents the catalyst activity, which can reduce due to coke deposition [15]:
For the gas oil, the four-lumped scheme proposed by [15] was used (Figure 1), involving the following species: gas oil, gasoline, light gas and coke. Such a simplified reaction mechanism has been shown to provide satisfactory results as demonstrated in previous works [3]. Essentially, the gas oil cracking reactions are modeled as 2nd-order reactions (n = 2), while the gasoline cracking is modeled as 1st-order reactions (n = 1). Table 1 presents the pre-exponential factors, activation energies and heat of reaction for this model.
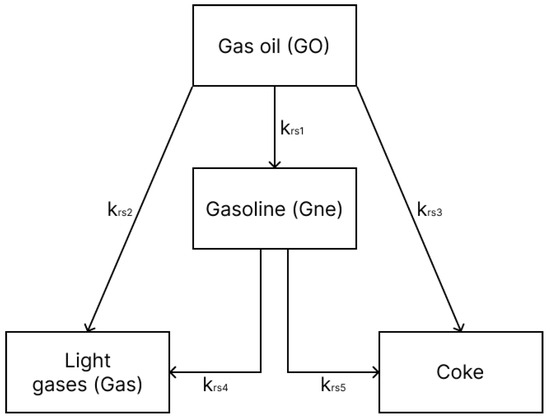
Figure 1.
Four-lump gas oil reaction mechanism.

Table 1.
Kinetic data for the four-lumped gas oil cracking mechanism. Reaction constants are from [15] and the remaining data are from [16].
Since [15] conducted the experiments at , it is necessary to correct the reaction constants at this temperature to arbitrary temperatures. Furthermore, they depend on the solid concentration. In order to make predictions at any temperature and catalyst concentration, the pre-exponential factor in the Arrhenius equation has been isolated and multiplied by the local solid concentration. Thus, the kinetic constants are recalculated as below:
2.2.2. Bio-Oil Catalytic Cracking
Generally speaking, bio-oil is a multicomponent mixture derived from biomass pyrolysis, consisting of oxygenated compounds such as phenols, furans, carboxylic acids, and ketones. Thus, simulating bio-oil catalytic cracking in an FCC riser model presents several challenges due to the complexity of bio-oil composition and reaction kinetics. Unlike conventional petroleum feedstocks, bio-oil has a wide molecular weight distribution and varying chemical reactivity, making it difficult to develop accurate kinetic models that capture the full spectrum of its cracking behavior.
The simulation of bio-oil catalytic cracking in an FCC riser reactor requires a representation of complex reaction kinetics, phase interactions, and thermal behaviors. While the fundamental computational approach has already been outlined, in this section the modifications required to simulate bio-oil conversion and the key parameters influencing reaction pathways and product yields are described.
To model the reactions, the simulation employs a lumped kinetic approach, in which bio-oil components are classified into representative species. Kinetic parameters are derived from experimental data and literature to ensure the accuracy of reaction rates under FCC conditions.
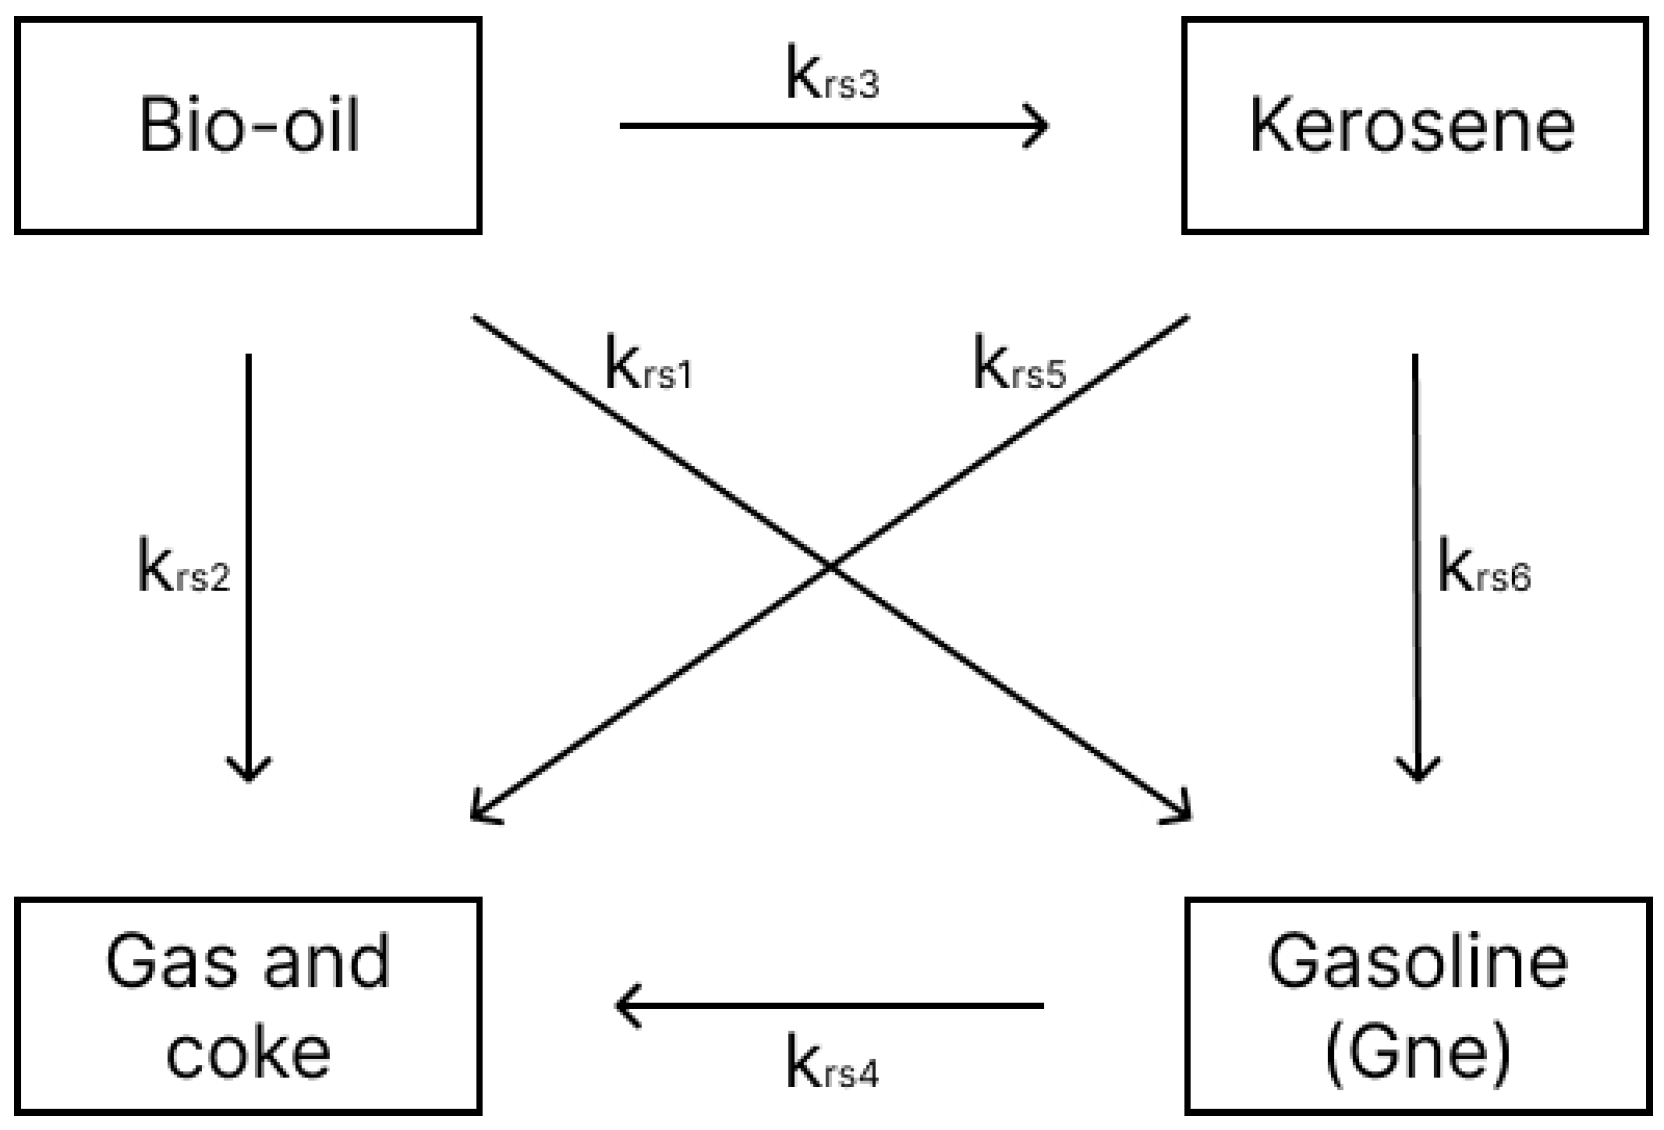
The kinetic model used in this study was developed by [17], who investigated the kinetics of palm oil cracking with a silica-alumina catalyst in a continuous fixed-bed reactor. Three models were proposed to represent the respective cracking reactions over a temperature range of 450–600 °C. To achieve a more accurate representation, Model 3 (Figure 2), which describes the catalytic cracking of bio-oil into kerosene, gasoline, and gas plus coke, was selected for this study. Table 2 presents the corresponding pre-exponential factors and activation energies. These values were obtained from a least squares fit conducted by the authors of this study, based on experiments performed by [17].

Figure 2.
Four-lump bio-oil reaction mechanism.
Table 2.
Kinetic data for the four-lumped bio-oil cracking mechanism from [17].
Analogous to gas oil kinetics, the pre-exponential factors in Table 2 must be multiplied by the catalyst bulk density to account for the influence of catalyst concentration on reaction rates. This adjustment ensures a more accurate representation of the catalytic cracking process, aligning the bio-oil kinetics with established models for hydrocarbon feedstocks:
All reactions in the aforementioned mechanism were assumed to follow first-order kinetics. Since certain bio-oil properties are not reported by [17], they were estimated based on the studies conducted by [18,19], ensuring consistency with established methodologies for hydrocarbon processing.
2.3. Numerical Solution of the Mathematical Model
The set of ordinary differential equations that compose the model was solved by the MATLAB routine ode23s, which can robustly handle stiff systems of ODEs.
3. Results and Discussion
3.1. Model Validation
Model predictions are validated against experimental results from a full-scale FCC riser operating with gas oil, as reported by [13]. The corresponding operating conditions are detailed in Table 3. Key performance indicators, including gas oil conversion and gasoline yield, are examined to evaluate the accuracy of the simulation. However, the droplet diameter distribution is not provided by the authors. To address this limitation, a sensitivity analysis will be conducted to assess its influence on conversion and yield rates, ensuring a comprehensive understanding of its potential impact on reactor performance.
Table 3.
Operating conditions for the riser reactor investigated by [13].
3.1.1. Impact of Heat Transfer Correlations/Mechanisms
Although previous investigations used fully three-dimensional models [3], the role of heat transfer mechanisms and correlations remains unclear. Unlike most prior FCC models, radiation effects are incorporated into the present work. However, preliminary analyses indicate that radiation is negligible in both the droplet evaporation process and conversion/yield predictions. Since conversion curves with and without radiation effects are nearly identical, they are omitted here for brevity.
Another key aspect worth exploring is the choice of heat transfer correlation. The vast majority of numerical studies on FCC risers, if not all, rely on the Ranz–Marshall correlation (Equation (27)). However, this correlation was originally developed for heat transfer modeling of a single droplet in an unbounded flow, making it well-suited for applications in internal combustion engines and turbines. In FCC risers, additional complexities arise because heat transfer is also influenced by catalyst particles. In this regard, the Buchanan correlation (Equation (28)) provides a more suitable alternative, as it accounts for feed droplet vaporization by considering direct contact, convective heat transfer, and radiative effects during droplet–particle collisions [20].
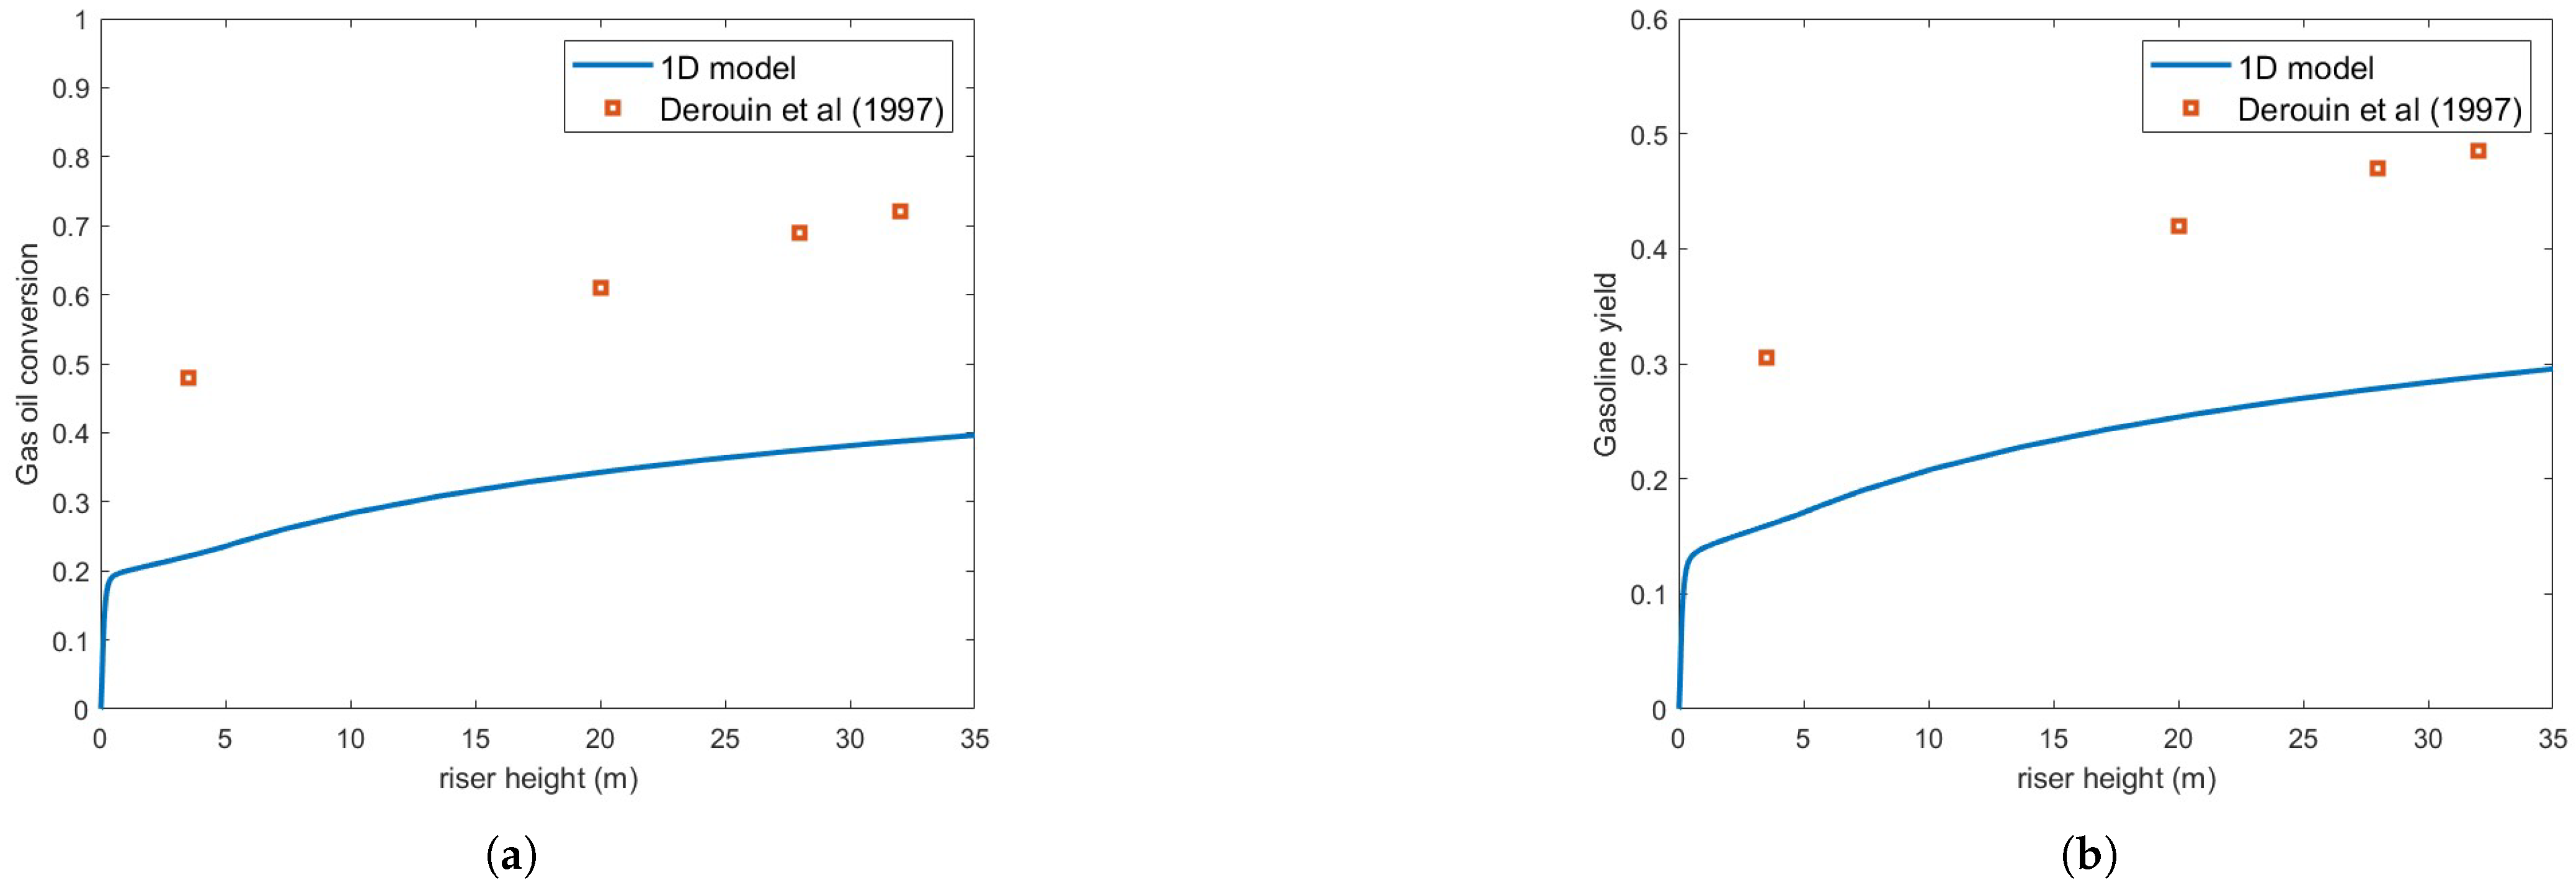
Figure 3 compares the predicted gas oil conversion and gasoline yield against the experimental results of [13] using the Ranz–Marshall correlation, assuming a droplet diameter of m. As seen in the figure, the predictions exhibit significant underestimation relative to experimental data. This contrasts with the findings of [3], who reported very good agreement with experimental conversion data. However, their simulations involved smaller droplets (m), which vaporize much more rapidly, and different operating conditions.
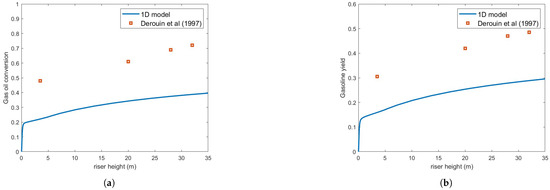
Figure 3.
(a) Gas oil conversion. (b) Gasoline yield. Predictions versus experiments using Ranz–Marschall correlation and droplet size = m [13].
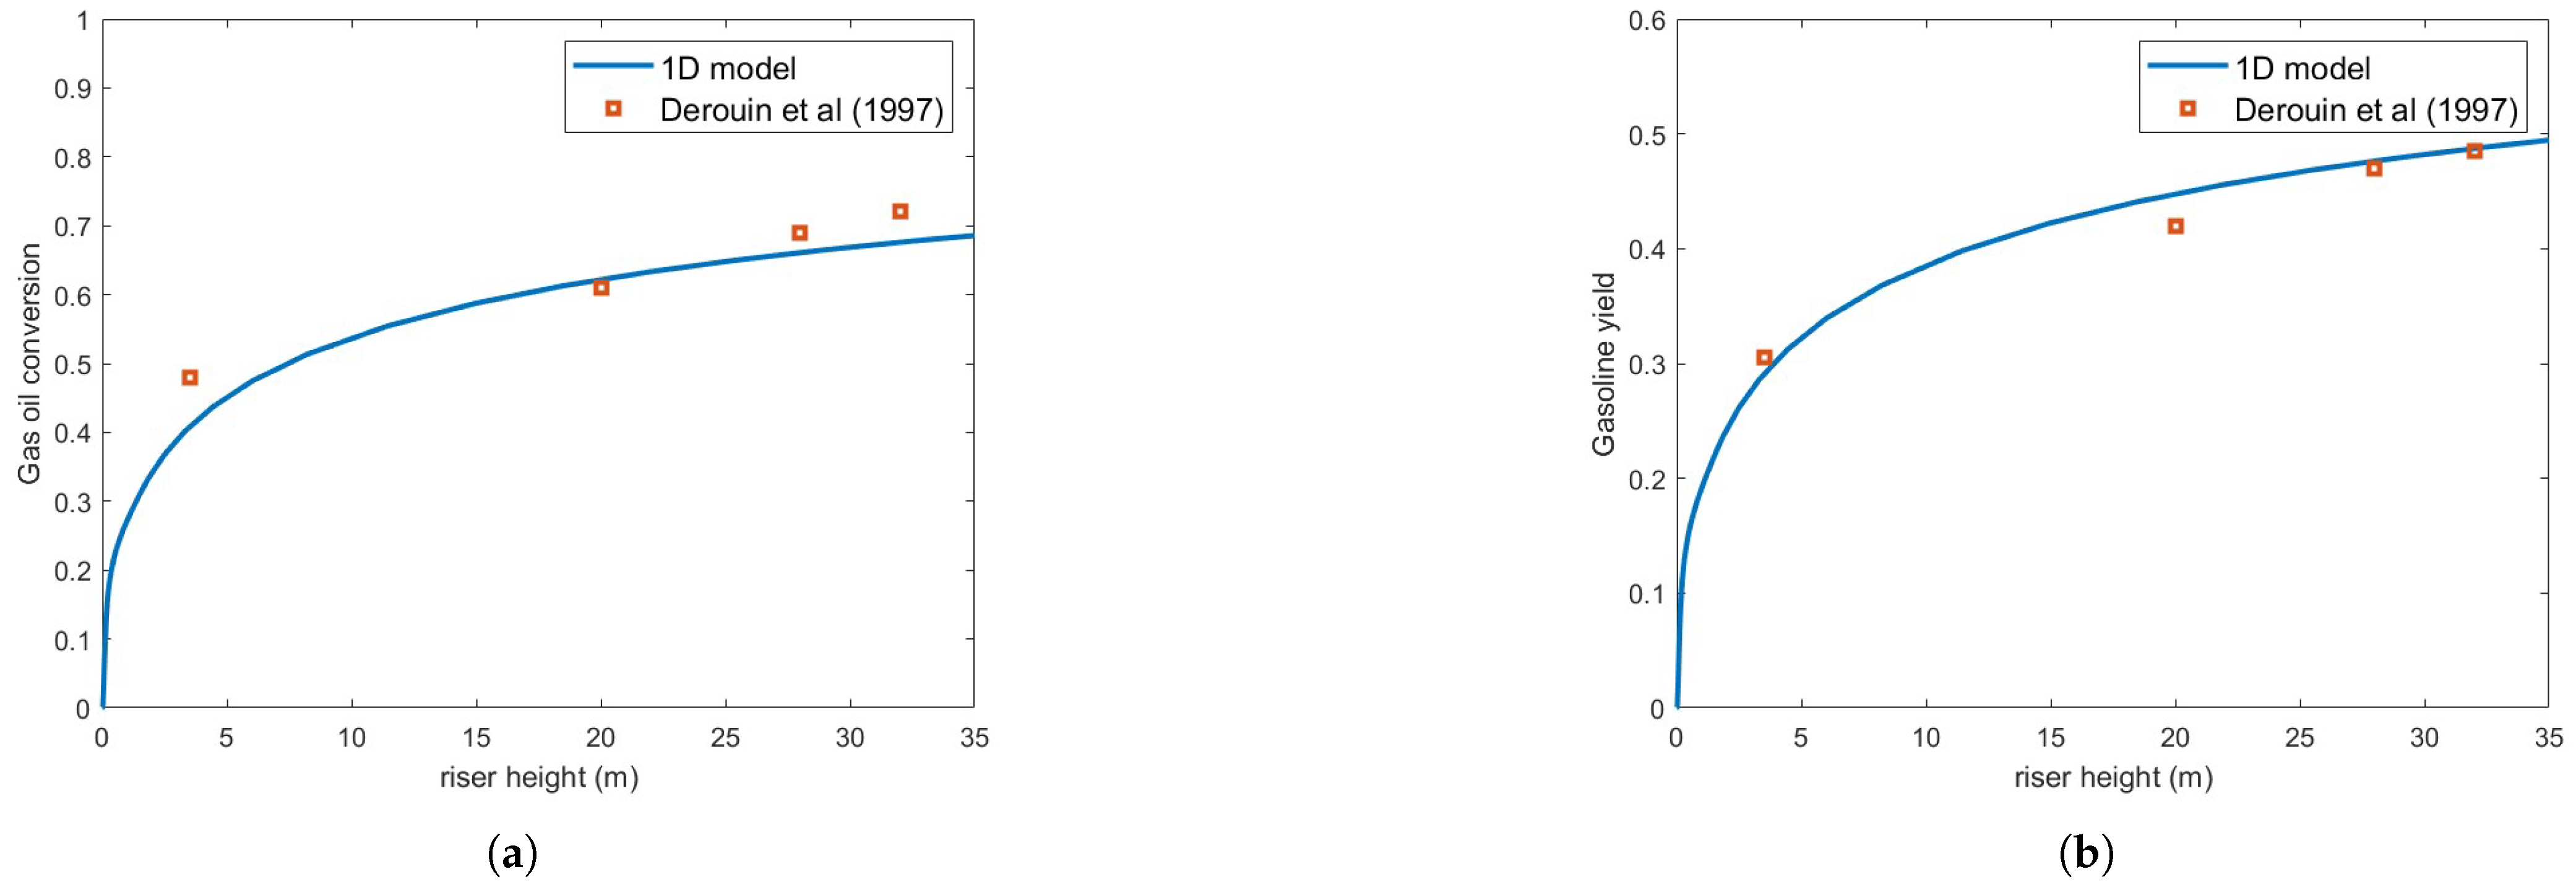
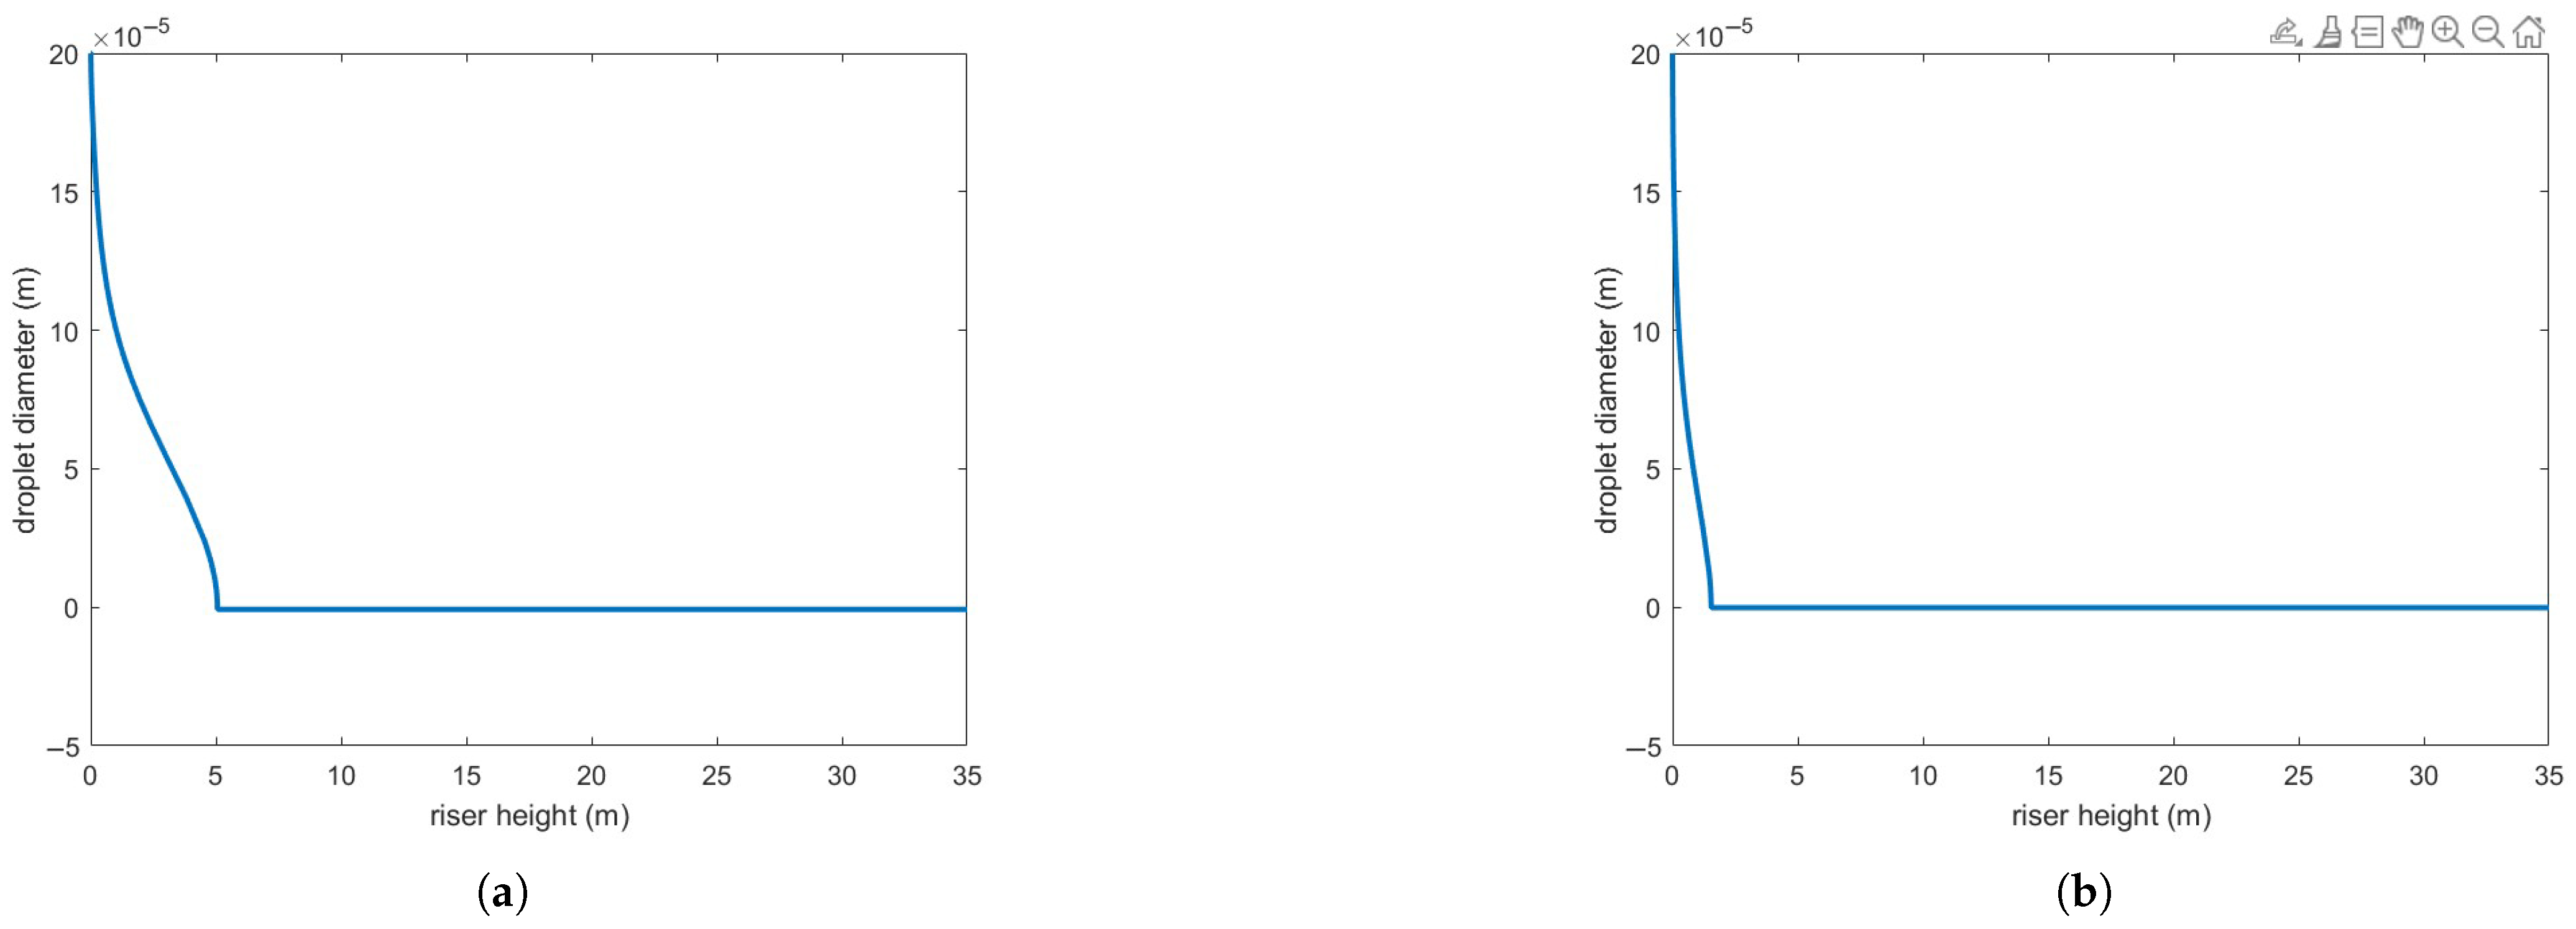
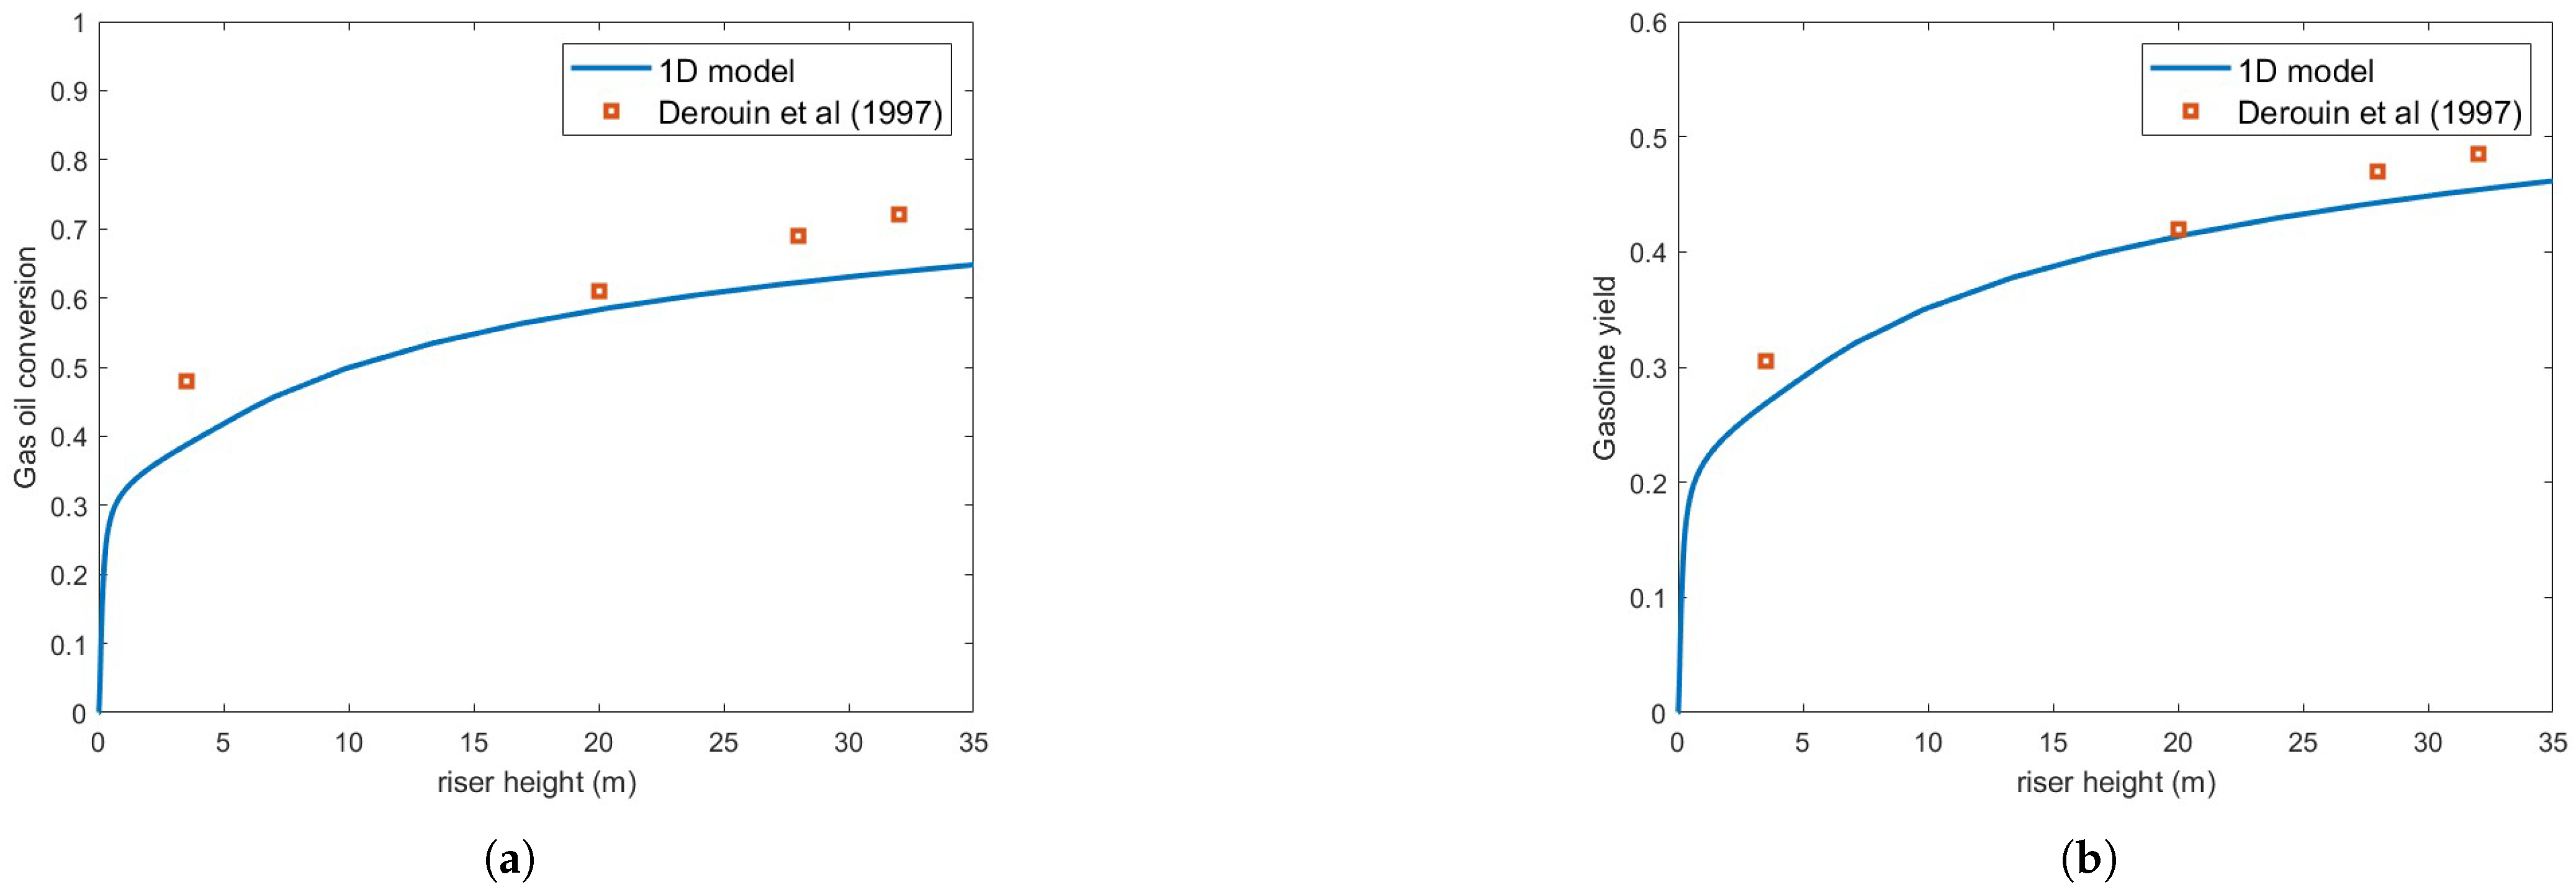
Figure 4 presents the same numerical setup but using the Buchanan correlation instead. Clearly, agreement with experimental results is notably improved. Figure 5 illustrates the variation in droplet size along the riser height for both heat transfer correlations. As expected, the Buchanan correlation predicts a much faster vaporization rate, which enhances chemical reaction rates.

Figure 4.
(a) Gas oil conversion. (b) Gasoline yield. Predictions versus experiments using Buchanan correlation and droplet size = m [13].
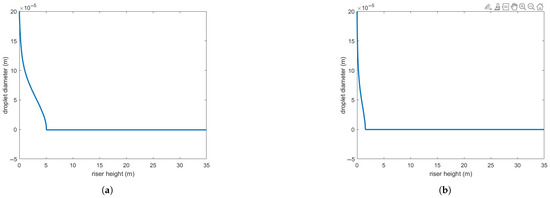
Figure 5.
(a) Droplet size reduction predicted by Ranz–Marschall correlation. (b) Droplet size reduction predicted by Buchanan correlation.
Interestingly, several studies that assume fully evaporated feedstock have successfully predicted conversion and yield. These findings suggest that, at least for relatively small droplets, this assumption may be reasonable. However, such models do not account for the impact of droplet size, which remains an important factor in reactor performance predictions.
3.1.2. Impact of Droplet Size
For the analyses presented in this section, the Buchanan model (Equation (28)) was used to calculate heat transfer between the droplets and the gas.
Figure 6 and Figure 7 show the gas oil conversion and gasoline yield for m and m droplets, respectively. The results indicate that droplet size significantly affects reaction rates, primarily because rapid feed vaporization is crucial for process efficiency.
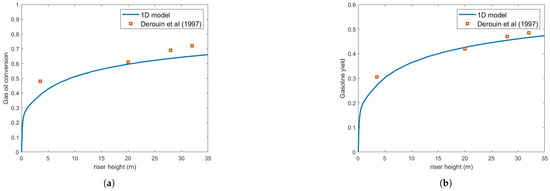
Figure 6.
(a) Gas oil conversion. (b) Gasoline yield. Predictions versus experiments using Buchanan correlation and droplet size = m [13].
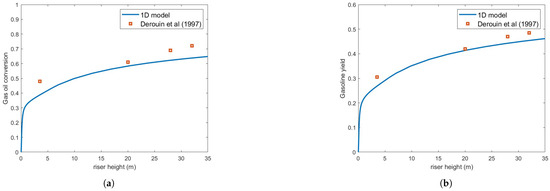
Figure 7.
(a) Gas oil conversion. (b) Gasoline yield. Predictions versus experiments using Buchanan correlation and droplet size = m [13].
3.2. Bio-Oil Simulation
To analyze the impact of operating conditions identical to those in the gas oil simulations, bio-oil catalytic cracking conversion and yield rates were initially investigated under the conditions specified in Table 3, with m diameter droplets injected.
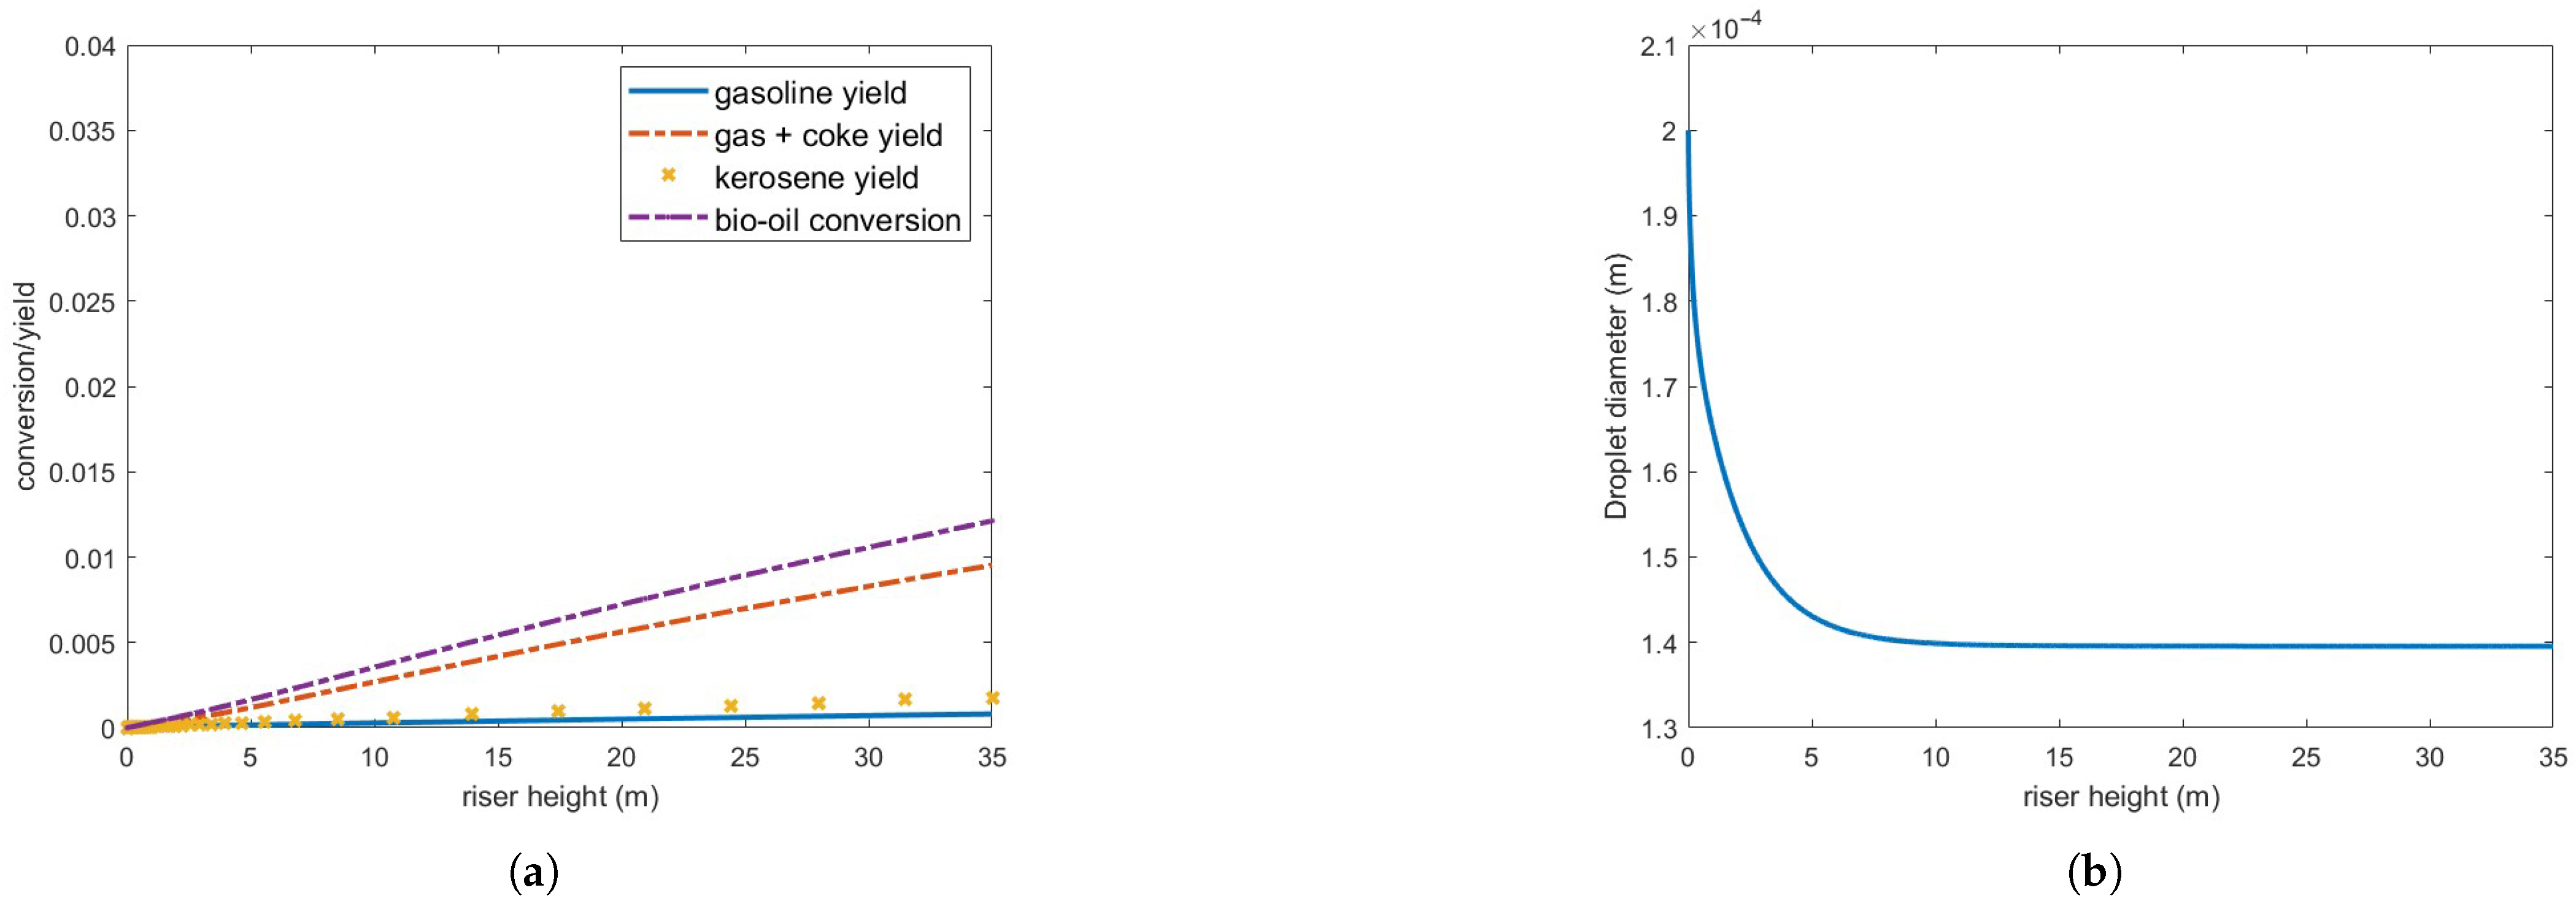
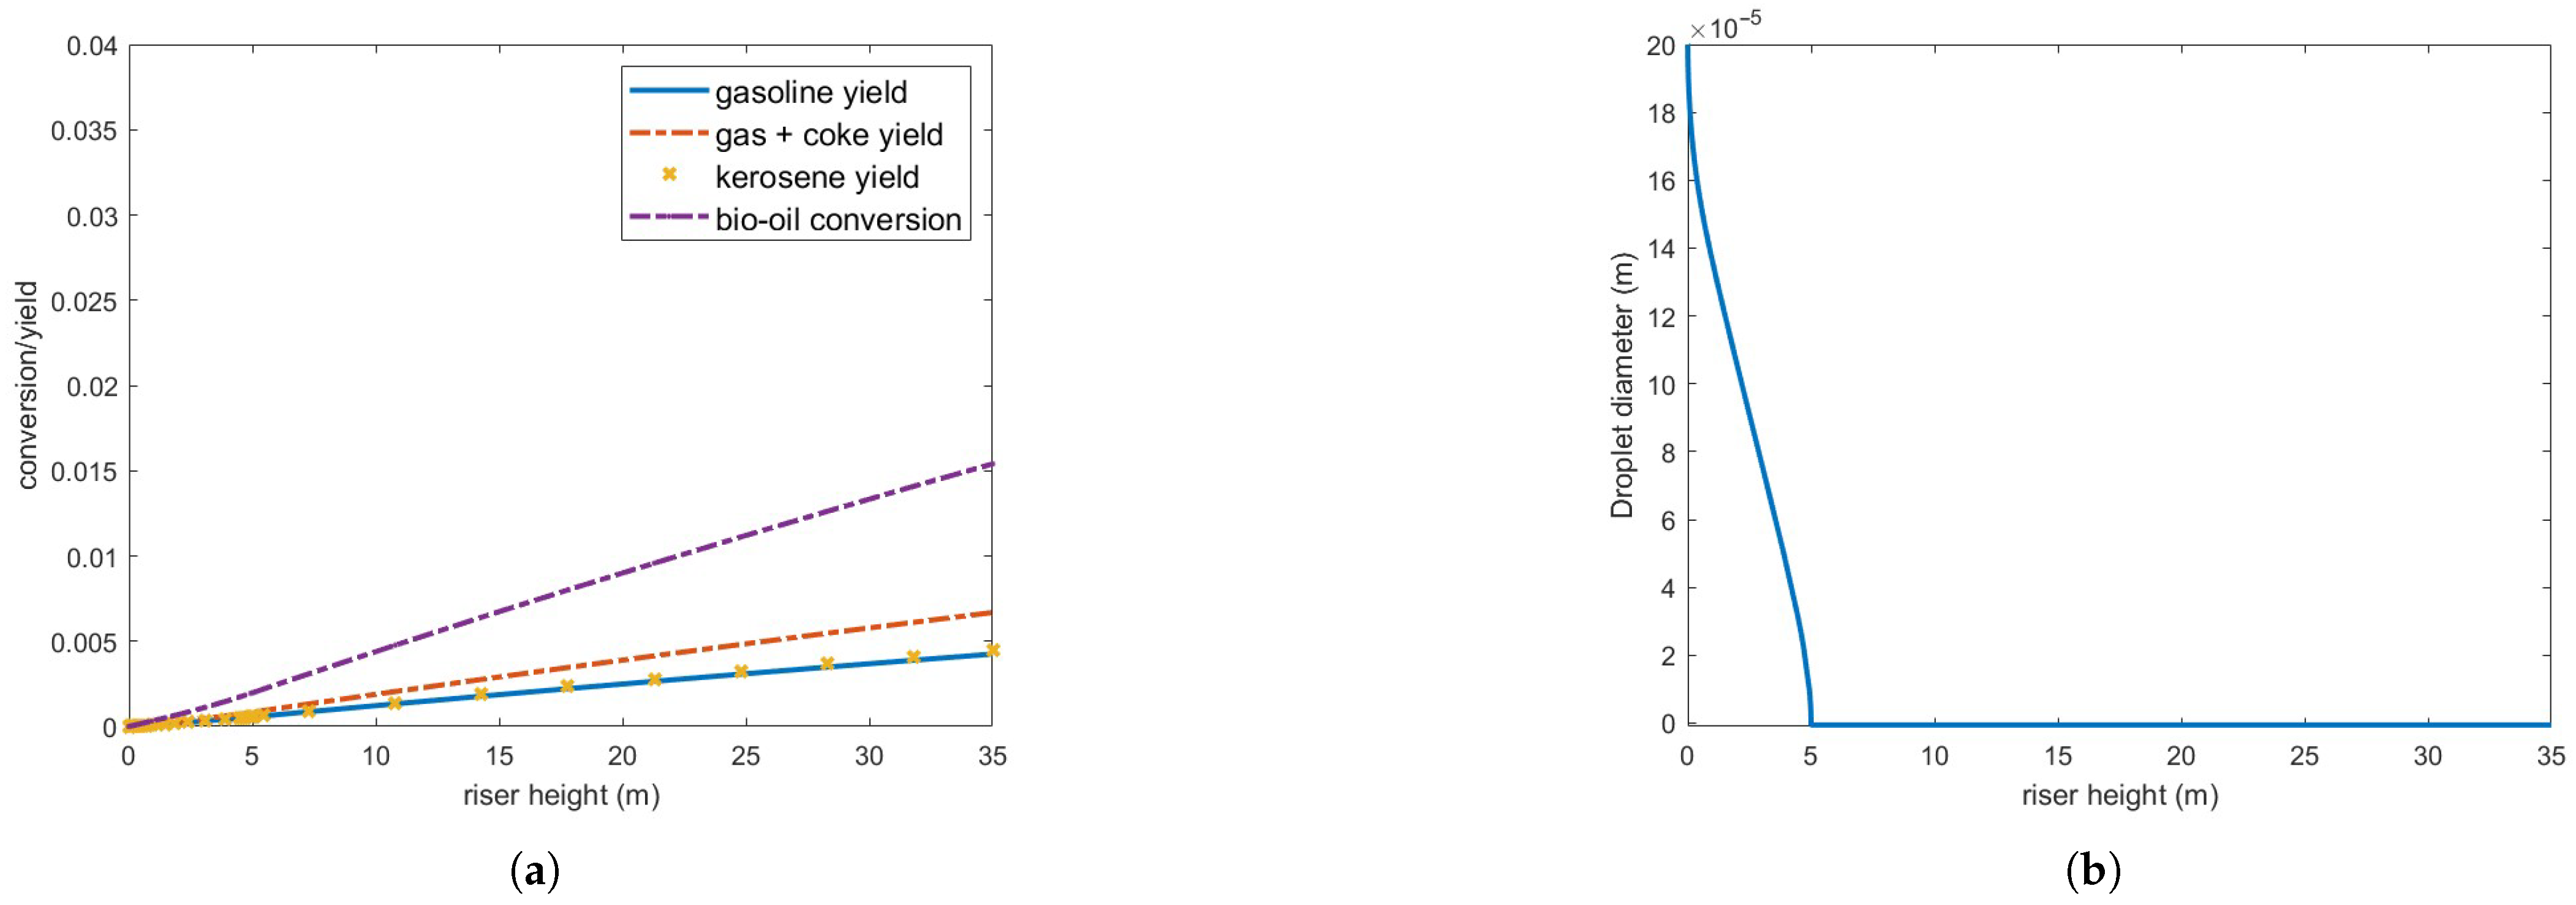
Figure 8 presents bio-oil conversion and yield for gas and coke, gasoline and kerosene, and droplet diameter in a 35 m riser operating under the defined conditions. As observed, bio-oil conversion is substantially lower than that of gas oil under the same conditions (Figure 4), and the droplets only partially vaporize. Furthermore, the vaporization process occurs at a significantly slower rate compared to gas oil droplets, as shown in Figure 5.
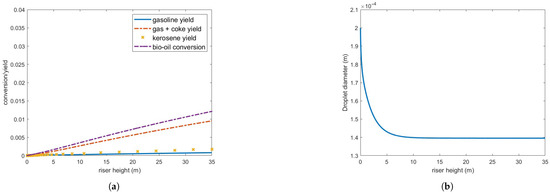
Figure 8.
(a) Bio-oil conversion and product yield in the operating conditions indicated in Table 3. (b) Bio-oil droplet diameter.
Although the vaporized bio-oil mass accounts for approximately 65.7 % of the injected feed, it is important to note that the calculated conversion/yield considers only the bio-oil in the gas phase. Consequently, the actual conversion to other products remains highly inefficient under these operating conditions.
These results can be partly explained by the bio-oil’s latent heat of vaporization, which is nearly an order of magnitude higher than that of gas oil (Table A1). Above approximately 10 m, the three phases—oil, gas, and catalyst particles—reach thermal equilibrium at the bio-oil boiling point, meaning a substantially higher energy input is required for complete feed vaporization. Reducing droplet size enhances heat transfer but does not significantly improve vaporization, as no additional energy is supplied to the reactor. Indeed, a further reduction in droplet diameter to m still resulted in incomplete feed vaporization and no significant improvements in conversion or yield.
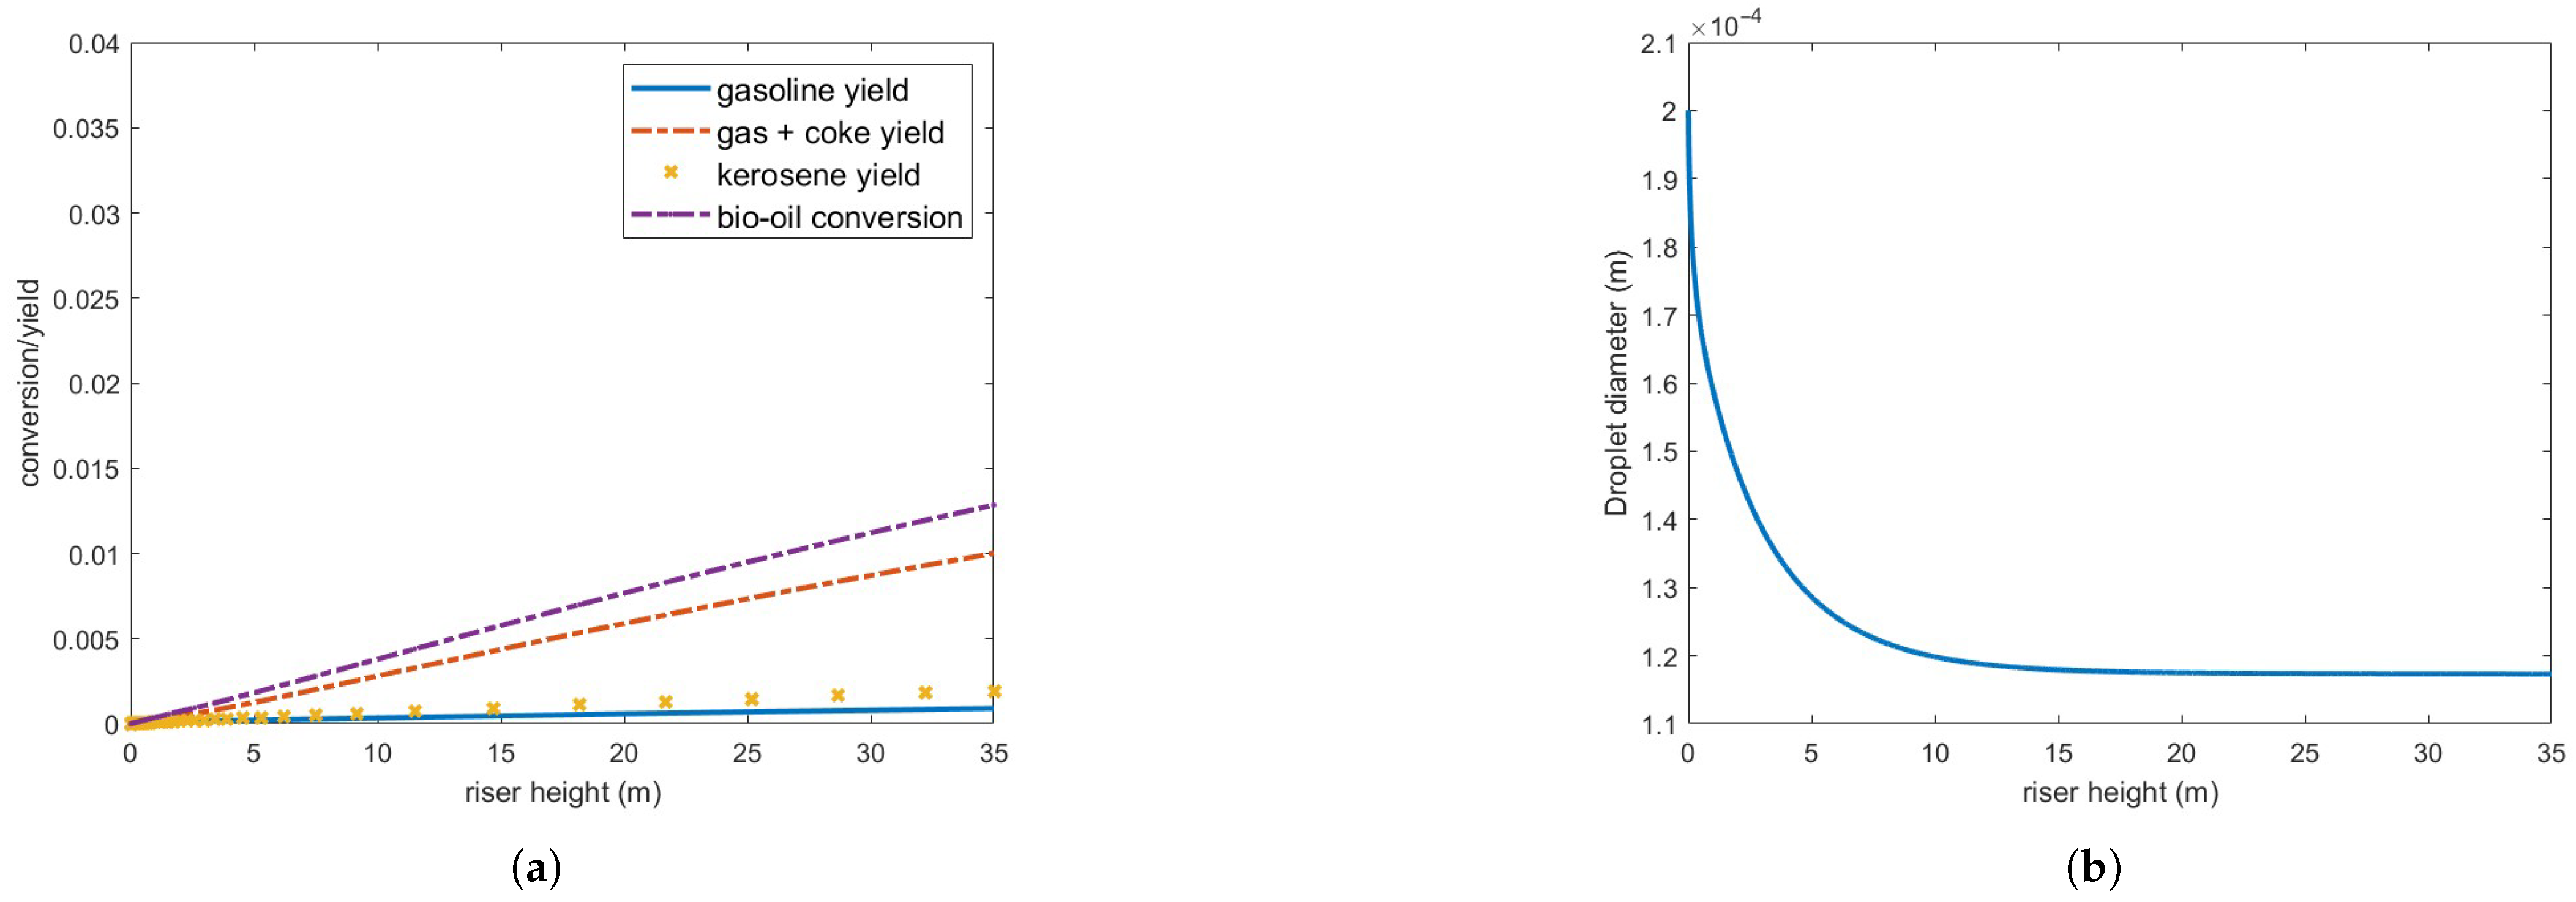
To explore potential performance enhancements, the catalyst-to-oil ratio (CTO) was increased to 7 while maintaining the steam and feed flow rates. Results, shown in Figure 9, indicate no improvement in conversion and yield, although more of the feed vaporizes, approximately 78%. Vaporization is even slower than the previous case, therefore consuming energy for the chemical reactions to occur efficiently.
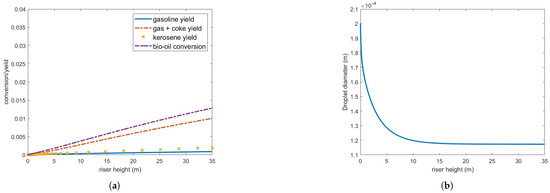
Figure 9.
(a) Bio-oil conversion and product yield in the operating conditions indicated in Table 3 but CTO = 7. (b) Bio-oil droplet diameter.
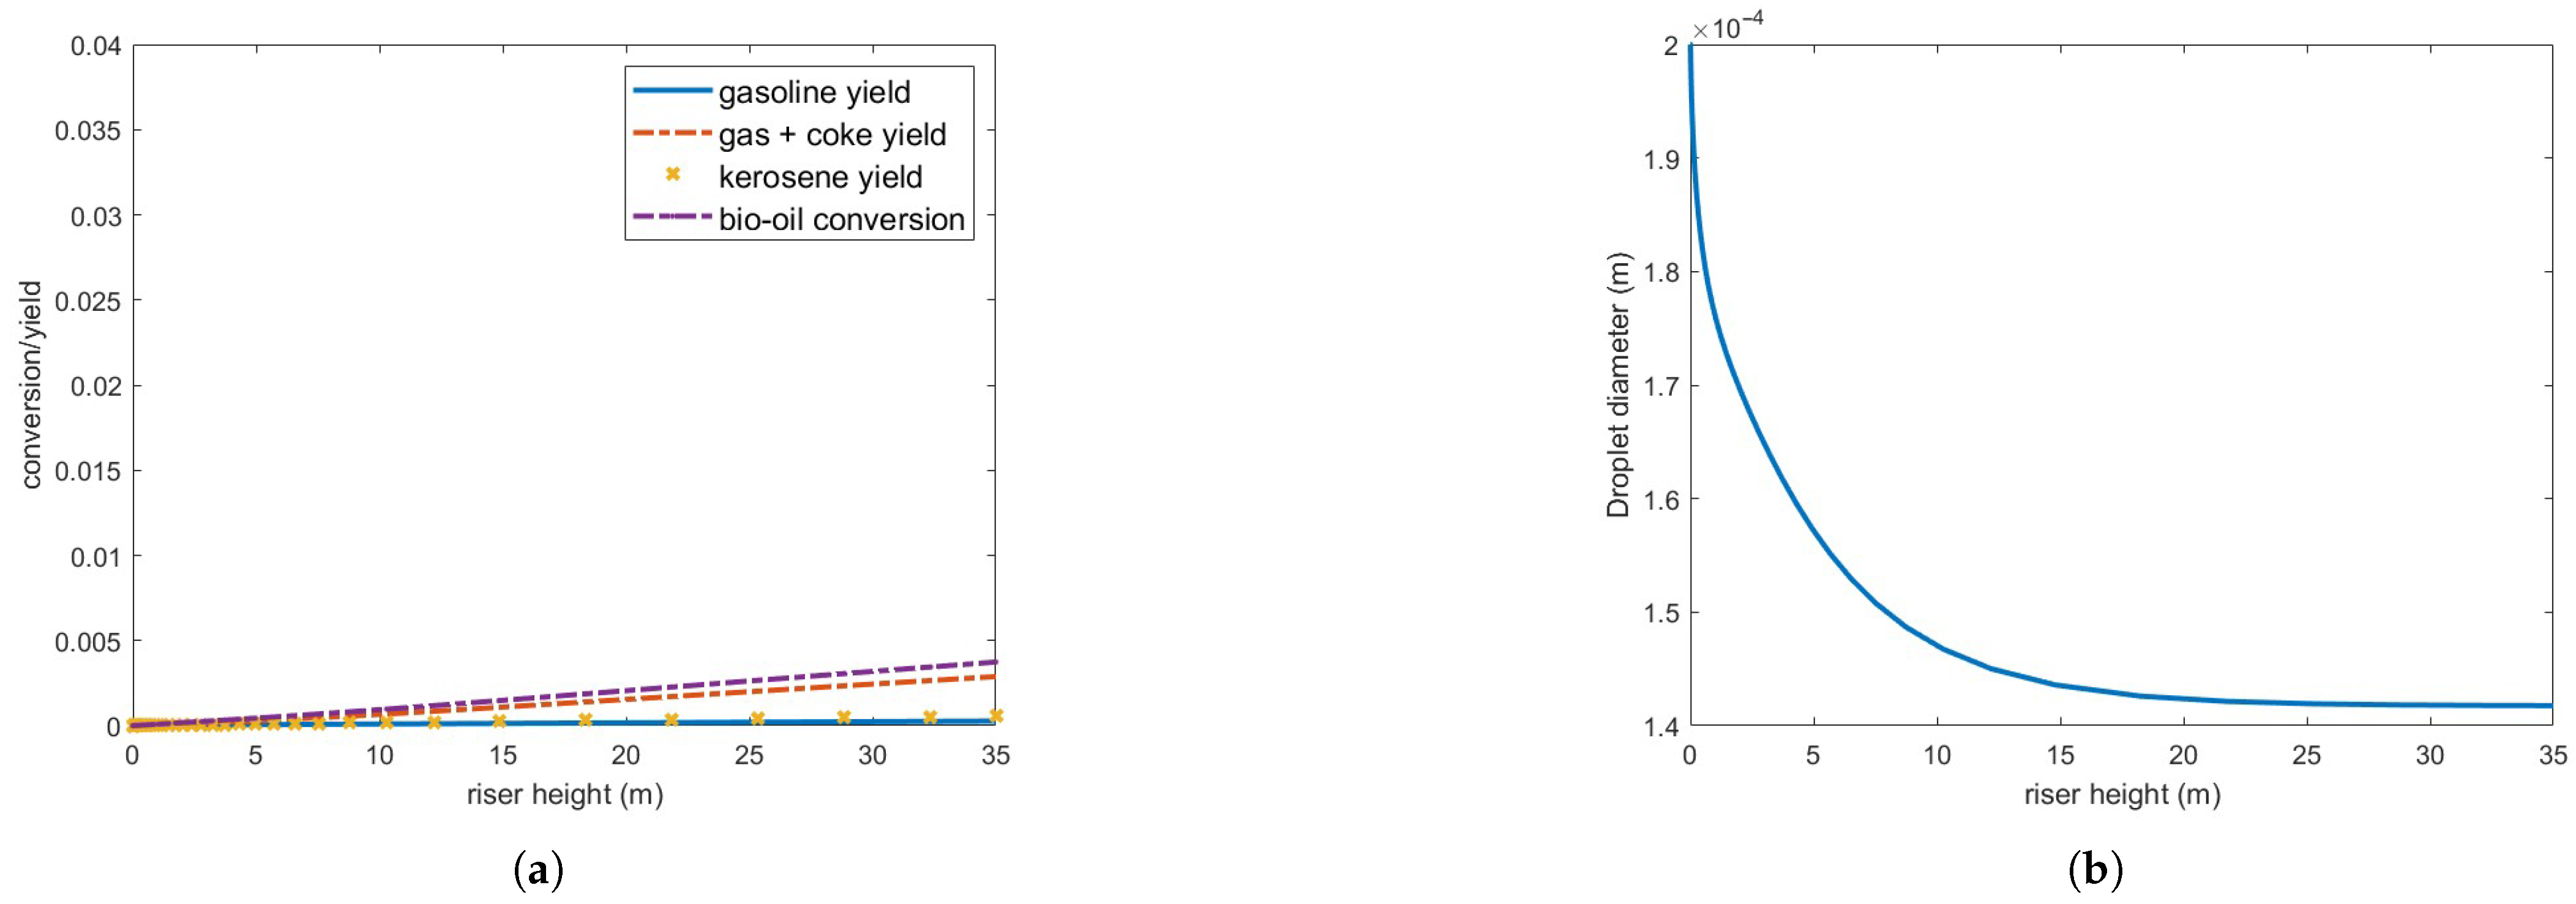
Figure 10 presents results obtained by doubling the steam flow rate while maintaining the other parameters from Table 3. Despite the increased energy input, conversion and yield decrease. This seemingly counterintuitive outcome is attributed to the higher gas velocity and poor vaporization rate, which reduces residence time and slows droplet vaporization. These findings indicate that the kinetics of bio-oil on the investigated catalyst is significantly slower than that of gas oil. While droplet vaporization is observed to be incomplete under the conditions studied so far, the rate of chemical reactions remains the limiting step in the overall catalytic conversion process. Indeed, the one-dimensional solution does not consider some flow particularities such as the core-annulus solid distribution and back-mixing that can modify the reaction dynamics. However, Ranganathan and Gu (2018) [6] also observed very low yield when simulating the catalytic cracking of pyrolysis vapors in a pilot-scale FCC riser using a two-dimensional CFD model.
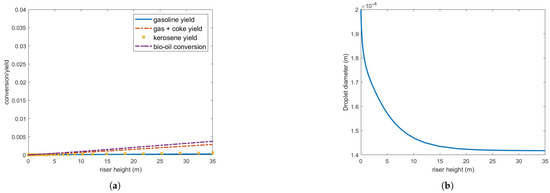
Figure 10.
(a) Bio-oil conversion and product yield in the operating conditions indicated in Table 3 but steam flow rate is 8.5 kg/s. (b) Bio-oil droplet diameter.
Another critical consideration in bio-oil processing is the maximum allowable steam and catalyst temperatures, as excessive heat can degrade the feedstock. While this aspect lies beyond the scope of the present study, such thermal limits represent additional constraints for efficient bio-oil FCC processing. No attempts were made to modify these parameters.
Given the inefficiency of bio-oil vaporization, the challenges of effectively increasing heat input, and the slow chemical kinetics involved, one potential strategy to enhance conversion and yield is to reduce the feed flow rate.
Figure 11 illustrates the results of processing an oil flow rate equivalent to 10% of the gas oil, while maintaining all other parameters as originally derived from Table 3.

Figure 11.
(a) Bio-oil conversion and product yield in the operating conditions indicated in Table 3 but feed flow rate is 8.5 kg/s. (b) Bio-oil droplet diameter.
Vaporization is now significantly more efficient, with complete vaporization occurring within 5 m above injection. However, despite some improvement compared to previous cases, conversion and yield remain quite low. Since feed vaporization is no longer the bottleneck in the cracking process, the observed conversion and yield must be influenced by other operating conditions, such as catalyst and steam inlet temperature. These test cases underscore the inherent challenges of processing bio-fuels with vaporization properties and chemical reaction mechanisms that differ significantly from those of gas oil within current FCC operating ranges.
Another important finding is that, across all analyzed scenarios, the primary products were coke and gas, aligning with the results reported by [17]. Due to the consistently low overall conversion across all scenarios, catalyst deactivation was negligible, as coke formation also remained minimal.
Ideally, the results of the bio-oil simulations should be validated against experimental data. However, experimental validation has proven to be highly challenging. Comprehensive experimental data on the processing of bio-oil in full-scale FCC risers is virtually nonexistent in the open literature. Since the model depends heavily on numerous parameters—such as catalyst characteristics, bio-oil properties, and specific chemical kinetics—accurately simulating the catalytic process remains difficult, as most experimental studies do not report these details. Currently, measurements are being collected at Petrobras SIX in a full-scale FCC riser, which may eventually support the assessment of the model’s reliability.
With respect to model reliability, the core issue lies in the fidelity of the chemical kinetics. While processes such as fuel vaporization and gas-solid flow are well understood and can be accurately modeled, the chemical reactions involved in bio-fuel cracking remain under active investigation due to their complexity.
In conclusion, these analyses highlight the usefulness of the reduced-order model in identifying challenges associated with adapting existing FCC facilities for bio-oil processing. The simplified yet representative mathematical framework provides rapid insights into fundamental bottlenecks, reinforcing the need for further research into FCC riser performance when handling gas oil/bio-oil blends.
4. Conclusions
A reduced-order model for simulating FCC risers operating with bio-oil is introduced, enabling a rapid assessment of reactor performance under such conditions. The main conclusions of this study can be summarized as follows:
- Thermal radiation effects on droplet evaporation, and consequently on reactor performance, are negligible under the investigated operating conditions.
- The Ranz–Marschall correlation underestimates droplet vaporization, leading to an underprediction of conversion and yield. In contrast, the Buchanan correlation provides a more accurate representation of the complex heat transfer mechanisms within FCC risers.
- The vaporization heat of palm bio-oil requires significantly higher heat input for complete vaporization compared to gas oil under identical operating conditions. This is due to its vaporization heat being nearly an order of magnitude greater than that of gas oil.
- FCC reactor performance is largely insensitive to bio-oil droplet diameter, primarily as a natural consequence of its substantially higher vaporization heat and slow chemical kinetics.
- Optimal operating conditions for processing bio-oil—i.e., maximizing the production of higher-value products—differ from conventional gas oil conditions. Indeed, most decarbonization efforts in the oil industry focus on processing blends of bio-oils and gas oil, rather than pure bio-oil.
- The proposed model can be effectively utilized to optimize FCC units operating with bio-fuels and bio-oil/gas oil blends, provided that the necessary cracking kinetics data is available.
It is important to emphasize that this model, like other models based on transport and conservation equations, relies heavily on accurate physical and chemical property data. Future research should prioritize precise measurements, particularly given the wide variations in bio-oil composition.
Author Contributions
Conceptualization, F.J.d.S., J.U., G.d.N., A.C.R., H.d.B.R. and H.F.M.; methodology, F.J.d.S., J.U., G.d.N., A.C.R., H.d.B.R. and H.F.M.; software, F.J.d.S., J.U., G.d.N., A.C.R., H.d.B.R. and H.F.M.; validation, F.J.d.S., J.U., G.d.N., A.C.R., H.d.B.R. and H.F.M.; formal analysis, F.J.d.S., J.U., G.d.N., A.C.R., H.d.B.R. and H.F.M.; investigation, F.J.d.S., J.U., G.d.N., A.C.R., H.d.B.R. and H.F.M.; resources, F.J.d.S., J.U., G.d.N., A.C.R., H.d.B.R. and H.F.M.; data curation, F.J.d.S., J.U., G.d.N., A.C.R., H.d.B.R. and H.F.M.; writing—original draft preparation, F.J.d.S., J.U., G.d.N., A.C.R., H.d.B.R. and H.F.M.; writing—review and editing, F.J.d.S., J.U., G.d.N., A.C.R., H.d.B.R. and H.F.M.; visualization, F.J.d.S., J.U., G.d.N., A.C.R., H.d.B.R. and H.F.M.; supervision, F.J.d.S., J.U., G.d.N., A.C.R., H.d.B.R. and H.F.M.; project administration, J.U.; funding acquisition, J.U. and H.F.M. All authors have read and agreed to the published version of the manuscript.
Funding
This research was funded by Petrobras Project BIOMIST+RESIDMIST (cooperation term 0050.0127779.24.9), CAPES and CNPq.
Data Availability Statement
The datasets presented in this article are not readily available because they are part of an ongoing study. Requests to access the datasets should be directed to the corresponding author.
Conflicts of Interest
The authors declare no conflicts of interest.
Appendix A
Here we provide the physical/transport properties adopted in the model for repeatability purposes.
Table A1.
Physical properties of species.
Table A1.
Physical properties of species.
| Property | Value |
|---|---|
| Gas heat capacity | 2 kJ/(kg.K) |
| Solid density | 1500 kg/m3 |
| Solid heat capacity | 1.090 kJ/(kg.K) |
| Gas oil molecular weight | 371 kg/kmol |
| Gas oil vaporizing temperature | 530 K |
| Gas oil boiling point | 560 K |
| Gas oil vaporization latent heat | 250 kJ/kg |
| Gas oil density | 925.9 kg/m3 |
| Gas oil diffusion coefficient | 3.79 × 10⁻⁶ m2/s |
| Gas dynamic viscosity | 1.72 × 10⁻⁵ kg/(m.s) |
| Gas thermal conductivity | 0.045 W/(m.K) |
| Emissivity | 0.9 |
| Gasoline molecular weight | 106 kg/kmol |
| Kerosene molecular weight | 170 kg/kmol |
| Light gas molecular weight | 40 kg/kmol |
| Coke molecular weight | 371 kg/kmol |
| Bio-oil molecular weight | 810 kg/kmol |
| Bio-oil vaporizing temperature | 530 K |
| Bio-oil boiling point | 560 K |
| Bio-oil vaporization latent heat | 2760 kJ/kg |
| Bio-oil density | 800 kg/m3 |
| Bio-oil diffusion coefficient | 3.79 × 10⁻⁶ m2/s |
References
- Pinho, A.R.; Almeida, M.B.; Mendes, F.L.; Casavechia, L.C.; Talmadge, M.S.; Kinchin, C.M.; Chum, H.L. Fast pyrolysis oil from pinewood chips co-processing with vacuum gas oil in an FCC unit for second generation fuel production. Fuel 2017, 188, 462–473. [Google Scholar] [CrossRef]
- Eschenbacher, A.; Myrstad, T.; Bech, N.; Duusd, J.Ø.; Li, C.; Jensen, P.A.; Henriksen, U.B.; Ahrenfeldt, J.; Mentzel, U.V.; Jensen, A.D. Co-processing of wood and wheat straw derived pyrolysis oils with FCC feed—Product distribution and effect of deoxygenation. Fuel 2020, 260, 116312. [Google Scholar] [CrossRef]
- Lopes, G.; Rosa, L.; Mori, M.; Nunhez, J.; Martignoni, W. Three-dimensional modeling of fluid catalytic cracking industrial riser flow and reactions. Comput. Chem. Eng. 2011, 35, 2159–2168. [Google Scholar] [CrossRef]
- Nayak, S.V.; Joshi, S.L.; Ranade, V.V. Modeling of vaporization and cracking of liquid oil injected in a gas–solid riser. Chem. Eng. Sci. 2005, 60, 6049–6066. [Google Scholar] [CrossRef]
- Al-Sabawi, M.; Chen, J.; Ng, S. Fluid Catalytic Cracking of Biomass-Derived Oils and Their Blends with Petroleum Feedstocks: A Review. Energy Fuels 2012, 26, 5355–5372. [Google Scholar] [CrossRef]
- Ranganathan, P.; Gu, S. Numerical simulation of catalytic upgrading of biomass pyrolysis vapours in a FCC riser. Fuel Process. Technol. 2018, 171, 162–172. [Google Scholar] [CrossRef]
- Adjaye, J.; Bakhshi, N. Production of hydrocarbons by catalytic upgrading of a fast pyrolysis bio-oil. Part I: Conversion over various catalysts. Fuel Process. Technol. 1995, 45, 161–183. [Google Scholar] [CrossRef]
- Adjaye, J.; Bakhshi, N. Catalytic conversion of a biomass-derived oil to fuels and chemicals II: Chemical kinetics, parameter estimation and model predictions. Biomass Bioenergy 1995, 8, 265–277. [Google Scholar] [CrossRef]
- Xu, Y.; Musser, J.; Shahnam, M. Numerical Simulation of a Biogenic Fluid Catalytic Cracking (BFCC) Regenerator with MFIX-Exa; National Energy Technology Laboratory (NETL): Pittsburgh, PA, USA; Morgantown, WV, USA; Albany, OR, USA, 2024. [Google Scholar] [CrossRef]
- Brenner, T.A.; Fontenot, R.L.; Cizmas, P.G.; O’Brien, T.J.; Breault, R.W. A reduced-order model for heat transfer in multiphase flow and practical aspects of the proper orthogonal decomposition. Comput. Chem. Eng. 2012, 43, 68–80. [Google Scholar] [CrossRef]
- Huang, C.; Duraisamy, K.; Merkle, C. Challenges in reduced order modeling of reacting flows. In Proceedings of the 2018 Joint Propulsion Conference, Cincinnati, OH, USA, 9–11 July 2018; p. 4675. [Google Scholar]
- Selalame, T.W.; Patel, R.; Mujtaba, I.M.; John, Y.M. The Effects of Vaporisation Models on the FCC Riser Reactor. Energies 2023, 16, 4831. [Google Scholar] [CrossRef]
- Derouin, C.; Nevicato, D.; Forissier, M.; Wild, G.; Bernard, J.R. Hydrodynamics of Riser Units and Their Impact on FCC Operation. Ind. Eng. Chem. Res. 1997, 36, 4504–4515. [Google Scholar] [CrossRef]
- Schiller, L.; Naumann, A. A Drag Coefficient Correlation. Z. Des Vereins Dtsch. Ingenieure 1935, 77, 318–320. [Google Scholar]
- Farag, H.; Blasetti, A.; de Lasa, H. Catalytic Cracking with FCCT Loaded with Tin Metal Traps. Adsorption Constants for Gas Oil, Gasoline and Light Gases. Ind. Eng. Chem. Res. 1994, 33, 3131–3140. [Google Scholar] [CrossRef]
- Han, I.S.; Chung, C.B. Dynamic modeling and simulation of a fluidized catalytic cracking process. Part II: Property estimation and simulation. Chem. Eng. Sci. 2001, 56, 1973–1990. [Google Scholar] [CrossRef]
- Sunarno, S.; Mulyono, P.; Aziz, M.; Budiman, A. Kinetic study of catalytic cracking of bio-oil over silica-alumina catalyst. BioResources 2018, 13, 1917–1929. [Google Scholar] [CrossRef]
- Terrell, E. Estimation of Fuel Properties for the Heavy Fraction of Biomass Pyrolysis Oil Consisting of Proposed Structures for Pyrolytic Lignin and Humins. Energies 2024, 17, 2011. [Google Scholar] [CrossRef]
- Chempro. Available online: https://chempro.in/palmoilproperties.htm (accessed on 4 June 2025).
- Buchanan, J.S. Analysis of heating and vaporization of feed droplets in fluidized catalytic cracking risers. Ind. Eng. Chem. Res. 1994, 33, 12. [Google Scholar] [CrossRef]


Disclaimer/Publisher’s Note: The statements, opinions and data contained in all publications are solely those of the individual author(s) and contributor(s) and not of MDPI and/or the editor(s). MDPI and/or the editor(s) disclaim responsibility for any injury to people or property resulting from any ideas, methods, instructions or products referred to in the content. |
© 2025 by the authors. Licensee MDPI, Basel, Switzerland. This article is an open access article distributed under the terms and conditions of the Creative Commons Attribution (CC BY) license (https://creativecommons.org/licenses/by/4.0/).