Abstract
Smectite clay minerals are known to readily form thixotropic physical gels in aqueous media, even at low volume fractions. Although the rheological properties of these gels are closely related to the microstructure of the network, the influence of the clay’s physicochemical characteristics remains insufficiently understood. In this study, we systematically investigated the relationships between particle size, cation exchange capacity, and zeta potential, and the rheological behavior of aqueous dispersions of four synthetic smectites. After thorough deionization, dispersions were prepared at controlled NaCl concentrations. We found that the zeta potential strongly correlates with the fineness of the network structure and governs macroscopic rheological responses such as viscosity, yield stress, and gelation behavior. Even under identical conditions, gel transparency and structural coarseness varied significantly among clay types. Furthermore, the storage modulus was influenced not only by network density but also by the intrinsic stiffness of the clay branches. These findings demonstrate that zeta potential serves as a unified indicator of structure and function in smectite dispersions and offer useful insights for gel design in colloidal and soft matter systems.
1. Introduction
Smectite 2:1 clays dispersed in water have been studied for several decades [1]. Aqueous dispersions of various clay minerals are known to form thixotropic physical gels even at very low clay concentrations (volume fraction ϕ of a few percent) [2,3,4,5]. These physical gels behave elastically under static conditions but begin to flow when the applied stress exceeds a certain yield point. Upon removal of stress, they return to their original elastic state. Even at lower clay volume fractions, the sol-to-gel transition can occur over time, and deionization leads to an increase in gel transparency (Tr) [6]. This suggests that layered clay stacks in water gradually exfoliate over time [7], and deionization accelerates this exfoliation process [8,9]. These physical gels can incorporate and disperse substances in various states—solid, liquid, or gas—making smectite clays valuable components in cosmetics, paints, and pharmaceuticals, as well as in a range of industrial applications.
The origin of these physical gels has often been attributed to the formation of an isotropic “house-of-cards” structure by clay sheets. This is due to the negative permanent charge on the face surfaces of the clay sheets and the presence of hydroxyl groups on the edges that can acquire positive or negative charges depending on the pH of the dispersion. Generally, the edge surfaces of smectite clays exhibit pH-dependent surface charge characteristics. Under acidic conditions (low pH), aluminol groups (≡Al–OH) on the edges are protonated to form ≡Al–OH2+, resulting in positive edge charges. Under alkaline conditions (high pH), silanol (≡Si–OH) and aluminol groups are deprotonated to ≡Si–O− and ≡Al–O−, respectively, leading to negatively charged edges [10,11,12]. Although this structural model has inspired numerous theoretical studies [13], recent experimental research has not been able to fully confirm it. Other interesting models have also been proposed, such as fractal aggregation through diffusion-limited cluster formation [14,15], and equilibrium gel structures stabilized by electrostatic repulsion among charged particles [16]. However, the detailed microstructure of the gel and the nature of the sol–gel transition remain insufficiently understood. The rheological properties of these physical gels have been explored by many researchers. For example, experiments using montmorillonite suspensions have shown that gels exhibit high storage modulus (G′) under acidic conditions, while increasing pH leads to a decrease in yield stress (σy) and more viscous behavior [17]. Other studies have evaluated rheological properties and interparticle interaction energy based on pH and the extended DLVO (Derjaguin–Landau–Verwey–Overbeek) theory [18]. It has also been reported that increasing electrolyte concentration initially increases yield stress and elasticity, which then decrease beyond a certain threshold [19,20]. These observations underscore the importance of the electric double layer that forms around clay particles. Many studies, including those cited above, have focused on the charge characteristics of both the face and edge surfaces of clay sheets [21].
The authors have previously demonstrated that macroscopic properties such as the transparency (Tr) of smectite clay aqueous dispersions, the transparency of dried droplet films, and their resulting drying patterns are strongly influenced by the type of clay used [6,22]. In both our earlier and present studies, all dispersions were prepared under alkaline conditions (pH ~7.6–8.9), in which the edge surfaces of the clay sheets bear negative charges. Therefore, the clay sheets are uniformly negatively charged, including their face surfaces. The rheological properties of such clay dispersions are expected to be governed by the balance between van der Waals forces (specifically, London dispersion forces) and electrostatic repulsion among the particles. One of the key indicators for capturing the overall characteristics of the gel network structure is the transparency of the physical gel. In our previous work, we compared the Tr of gels formed from dispersions of four different types of clay, under fixed clay volume fractions and NaCl concentrations. Regardless of ϕ, Tr sharply decreased with increasing NaCl concentration. As ϕ increased, the differences in Tr between clay types became more pronounced [6]. For instance, under deionized conditions at ϕ = 0.01, the transparency exceeded 90% for fluorinated hectorite (Ht-F), hectorite (Ht), and stevensite (Stv), while saponite (Sap) exhibited only ~35%. At ϕ = 0.017, Tr remained above 90% for Ht-F, dropped to ~55% for Stv, and decreased to ~20% for both Ht and Sap. When we summarized the experimental results across varying ϕ and NaCl concentrations, the transparency (Tr) ranking among the clay types was as follows:
Ht-F > Stv ≈ Ht > Sap (in terms of Tr)
The relative ordering of Stv and Ht varied depending on the experimental conditions. The Tr ranking observed in gel-state dispersions was also applicable to sol-state dispersions. Furthermore, this ranking was consistent with the transparency of the films formed by drying droplets of these dispersions. One of the most significant factors influencing Tr is the thickness of the branches constituting the three-dimensional network formed by the clay particles, denoted dbranch. Aggregates with sizes ranging from a few to several tens of micrometers are often compared to mist or clouds, as they induce Mie scattering and thus appear turbid. As the aggregate size decreases, transparency increases, and when the size falls below several tens of nanometers, Rayleigh scattering becomes dominant, resulting in a transparent appearance. In our previous study, we reported the visual appearance of dispersions exhibiting either Mie or Rayleigh scattering, and also investigated dbranch using cryo-SEM imaging [6]. Regardless of the ϕ, dbranch increased with rising NaCl concentration, and the differences in dbranch among clay types became more pronounced under higher salt concentrations. For example, at ϕ = 0.01 under deionized conditions, dbranch was largest for Sap (0.63 μm), followed by Ht (0.48 μm), and both Stv and Ht-F showed similar values of approximately 0.35 μm. Under 0.1 mol/L NaCl, dbranch increased substantially, reaching 14 μm for Sap, 11 μm for Ht, 4.8 μm for Stv, and 2.9 μm for Ht-F. When we examined the results across varying ϕ and [NaCl], the ranking of clay types based on dbranch was found to be the reverse of that based on Tr:
Sap > Stv ≈ Ht > Ht-F (in terms of dbranch)
The results clearly indicate that the branch thickness (dbranch) of the network structures formed by each clay in water is closely related to the Tr of the dispersion. Assuming a fixed ϕ and a similar fractal dimension across samples, differences in dbranch directly affect the number of branches in the network—that is, the number density of crosslinking points. When dbranch is small, the density of crosslinking points becomes higher, leading to a finer network. In contrast, larger dbranch values result in a lower crosslinking density and a coarser network. Despite numerous studies, the influence of clay physicochemical properties—such as particle diameter (d), cation exchange capacity (CEC), and zeta potential (ζ)—on the rheological behavior of physical gels in clay aqueous dispersions remains not fully understood. To the best of our knowledge, reports on the rheological properties of aqueous stevensite dispersions are extremely limited. In this study, we aimed to provide a unified interpretation of the relationships between the rheological properties and physicochemical characteristics of four types of clay aqueous dispersions, using a consistent experimental system with samples prepared under highly deionized conditions, and the controlled concentrations of a 1:1 electrolyte.
2. Materials and Methods
Four types of synthetic smectite clay minerals, supplied by KUNIMINE INDUSTRIES CO., LTD. (Tokyo, Japan), were used in this study: fluorinated hectorite (Ht-F), stevensite (Stv), hectorite (Ht), and saponite (Sap). Their chemical compositions are as follows:
Ht-F: Na0.33(Mg2.67Li0.33)Si4O10(F,OH)2
Stv: Na0.16Mg2.92Si4O10(OH)2
Ht: Na0.33(Mg2.67Li0.33)Si4O10(OH)2
Sap: Na0.33Mg3(Si3.67Al0.33)O10(OH)2
Ht-F is a modified form of hectorite in which approximately 50% of the hydroxyl (OH) groups at the edges of the clay nanosheets are substituted for by fluorine atoms. Table 1, presented below, summarizes the size-related information along with physicochemical properties such as CEC and ζ. The clays are listed in order of increasing particle size, from top to bottom. The monolayer thickness of the clay nanosheets was 1 nm for all samples, and the density of each clay was uniformly 2.5 g/cm3. The particle size of each clay sample was measured by dynamic light scattering (DLS), using a nanoPartica SZ-100 Z2 instrument (HORIBA, Ltd., Kyoto, Japan). The dispersions were prepared in distilled water at a clay concentration of 0.05 wt%, and subjected to ultrasonic treatment at 40 kHz for 5 min prior to measurement. Measurements were performed at a detection angle of 90°, using the instrument’s built-in 10 mW, 532 nm diode-pumped frequency-doubled laser as the light source. The obtained autocorrelation functions were analyzed using the cumulant method to determine the average particle diameter. Each sample was measured three times, and the mean value was reported, along with the variation within ±5%. CEC was determined using a Quick Ammonia Meter (AT-200, Chuo Kagaku Co., Ltd., Tokyo, Japan) equipped with an ammonium ion-selective electrode. Each clay sample (0.5 mg) was treated with 100 mL of 1 mol/L ammonium acetate solution and stirred for more than 1 h; this was followed by centrifugation. The resulting precipitate was resuspended in an 80 vol% ethanol–water solution, stirred again, and centrifuged. The supernatant was discarded, and this washing procedure was repeated two more times. Subsequently, the cleaned precipitate was resuspended in 50 mL of 10 wt% KCl solution, stirred for 1 h, and centrifuged again. The supernatant was collected, and the same KCl treatment was repeated once more. The two batches of supernatant (~100 mL total) were combined and used for CEC measurement. Each sample was measured in triplicate, and the mean value was reported, along with the variation within ±1%.

Table 1.
Particle size (d), cation exchange capacity (CEC), and absolute value of zeta potential (|ζ|) at 25 °C for each type of smectite clay. Note, (*1) ϕ = 0.001, [NaCl] = 0.
The clay was carefully dispersed in ultrapure water (Milli-Q Advantage A10, Millipore Co., Burlington, MA, USA), after which ion exchange resin (AG501-X8 (D), Bio-Rad Laboratories, Inc., Hercules, CA, USA) was added at approximately one-eighth of the total dispersion volume. The dispersions were subjected to deionization treatment for over three months and used as stock solutions. The ϕ of clay in the stock ranged from 0.018 to 0.019. Sample dispersions were subsequently prepared by diluting the stock solution with ultrapure water and sodium chloride solution to achieve ϕ values from 0.001 to 0.017 and NaCl concentrations ranging from 0.001 to 0.1 mol/L. Smectite clay dispersions require a certain aging period to reach a quasi-equilibrium state in terms of properties such as ζ and σy [4,23,24,25,26,27,28]. Therefore, all samples were left to rest for at least one day after preparation and used for rheological measurements within one week. It is known that the rheological properties of clay dispersions, particularly at higher concentrations, are sensitive to temperature [29]. In this study, all rheological measurements, as well as other experimental procedures, were conducted at 25 °C.
The ζ was measured using a Zetasizer Nano ZS instrument (Malvern Panalytical Ltd., Malvern, UK). Samples with ϕ = 0.001 were loaded into capillary cells at a volume of 1 mL per measurement. Electrical conductivity (κ) was determined using a portable meter (LAQUAact D-74, HORIBA, Ltd., Kyoto, Japan). The electrode was inserted into a test tube containing the sample, left to stabilize for one minute, and then the measurement was performed. The theoretical electrical conductivity (κ, in mS/m) of NaCl solutions was calculated using the following equation:
Here, c is the molar concentration (mol/L), and Λm is the molar conductivity (mS·m2·mol−1). The value of Λm is based on the theoretical treatment incorporating Onsager’s relaxation effect and electrophoretic effect [30], and at 25 °C, it can be approximated using the following equation [31].
Λ0 represents the limiting molar conductivity of NaCl at infinite dilution. Based on Kohlrausch’s law, the limiting molar conductivities of Na+ and Cl− (5.01 and 7.63 mS·m2·mol−1, respectively) were used to obtain Λ0 = 12.64 mS·m2·mol−1 [32].
Rheological measurements were conducted using a concentric double-cylinder rotational rheometer (Rheosol-G2000W-GF, UBM Co., Ltd., Kyoto, Japan). The gap between the inner and outer cylinders was 0.5 mm. Steady shear flow and dynamic oscillatory deformation were applied to the sample by rotating and oscillating the outer cylinder. Torque was detected via rotation of the inner cylinder, which was connected to a torsion wire. Under steady shear conditions, the shear rate () was varied from 0.032 to 132 s−1. For oscillatory measurements, the strain amplitude (γ) was fixed at 0.002, which ensured that all samples remained within the linear viscoelastic region. The dependence of the storage modulus (G′) and loss modulus (G″) on angular frequency (ω) was measured over a range from 0.13 to 6.3 rad/s.
3. Results and Discussion
3.1. Cation Exchange Capacity, Zeta Potential, and Electrical Conductivity of Dispersions
The particle size (d), cation exchange capacity (CEC), and zeta potential (ζ) of the clay samples are summarized in Table 1 below.
CEC represents the maximum quantity of exchangeable cations that a clay mineral can retain per unit mass. CEC serves as an indicator of the clay’s ability to exchange cations on its surface, which arises from negatively charged sites that attract surrounding cations and allow their exchange with other cations in the medium. CEC is an experimentally determined value and is influenced by factors such as the surface area of the clay, the distribution of layer charges, the pH, and the ionic strength of the solution. Nevertheless, it is one of the key properties that reflects the overall charge density of the clay. The ranking of CEC values among the four clay types was as follows:
Sap ≈ Ht-F > Ht > Stv (in terms of CEC)
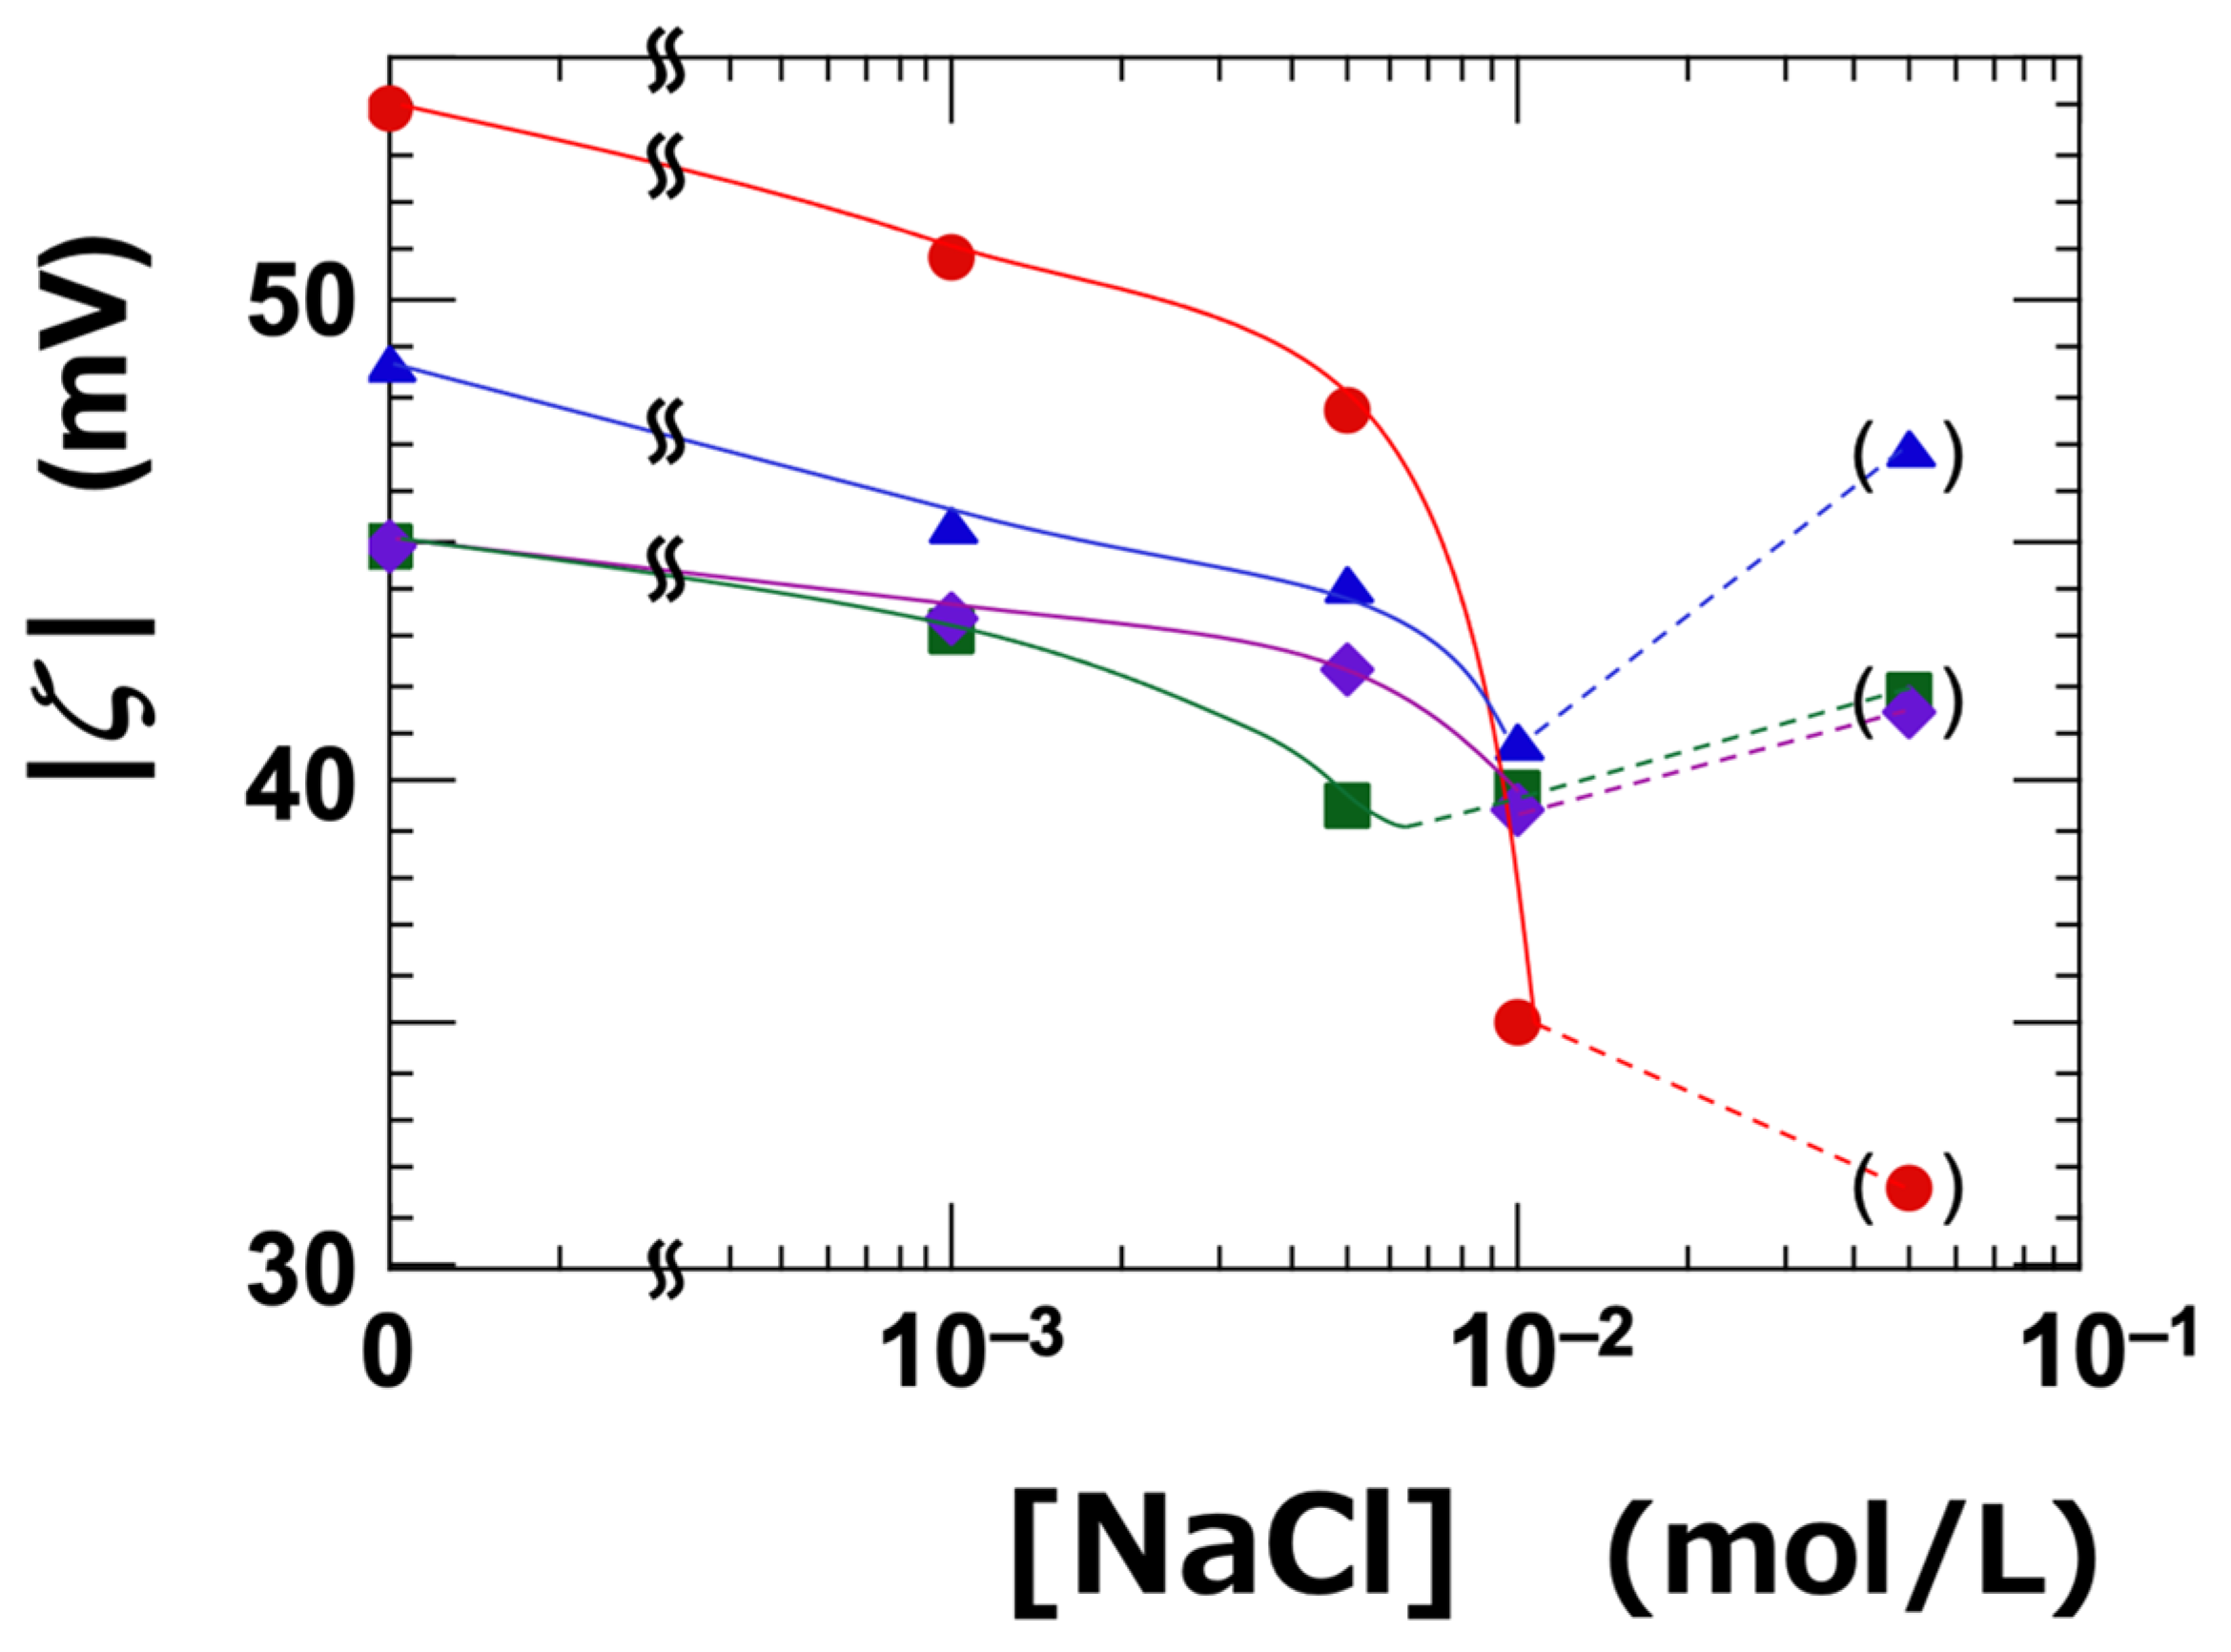
The dependence of ζ on NaCl concentration was investigated (Table 1 and Figure 1). The ζ-value represents the electrostatic potential at the slipping plane, which is located at a certain distance from the surface of the clay nanosheet. All types of clay exhibited negative zeta potentials, regardless of NaCl concentration. It is well established that the absolute value of the zeta potential decreases with increasing electrolyte concentration [33]. The absolute value of the zeta potential (|ζ|) was highest for Ht-F, and the ranking among the clay types was as follows:
Ht-F > Ht > Stv ≈ Sap (in terms of |ζ|)
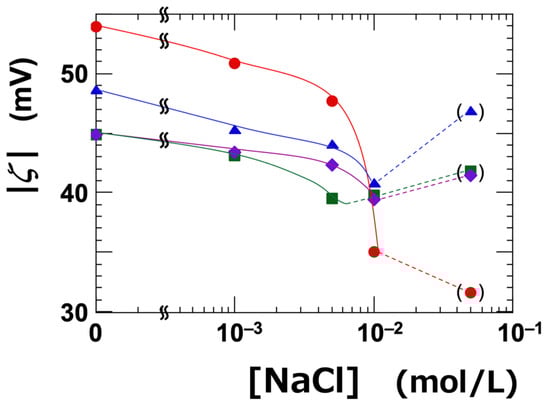
Figure 1.
Dependence of the absolute value of zeta potential (|ζ|) on NaCl concentration ([NaCl]) for smectite clay aqueous dispersions at 25 °C. ϕ = 0.001. ●: Ht-F, ▲: Ht, ■: Stv, ◆: Sap.
Since the clay dispersions were alkaline, the variable edge charges of the clay sheets were also negative—similar to the fixed charges on the face surfaces. Therefore, the zeta potential can be considered as primarily originating from the face surfaces. The ranking of the absolute value of the zeta potential among the clay types was consistent with that of the cation exchange capacity (CEC), except for saponite (Sap). In this study, the clay stock solutions were thoroughly deionized to promote exfoliation. Our previous research demonstrated that such deionization significantly enhances the transparency of clay aqueous dispersions, suggesting that exfoliation proceeds effectively under these conditions [6]. Therefore, under the assumptions of sufficient exfoliation and constant electrolyte concentration, a higher CEC—indicating a greater structural negative charge—would generally result in a higher negative zeta potential (i.e., a larger absolute value). However, ζ does not follow a simple proportional relationship with CEC, as it is also influenced by other factors such as particle size, surface charge distribution, and the position of the slipping plane. It has been reported that |ζ| increases when exfoliation leads to an increase in surface area [34,35], or when the particle size is small [36]. In this study, Sap had a larger particle size compared to the other clays, which likely explains why it exhibited the smallest |ζ| among the four samples. Moreover, previous studies have reported that Sap tends to exfoliate less readily than other clays, which may be attributed to strong adsorption of cations near the surface [37] and its relatively high layer charge density [38,39].
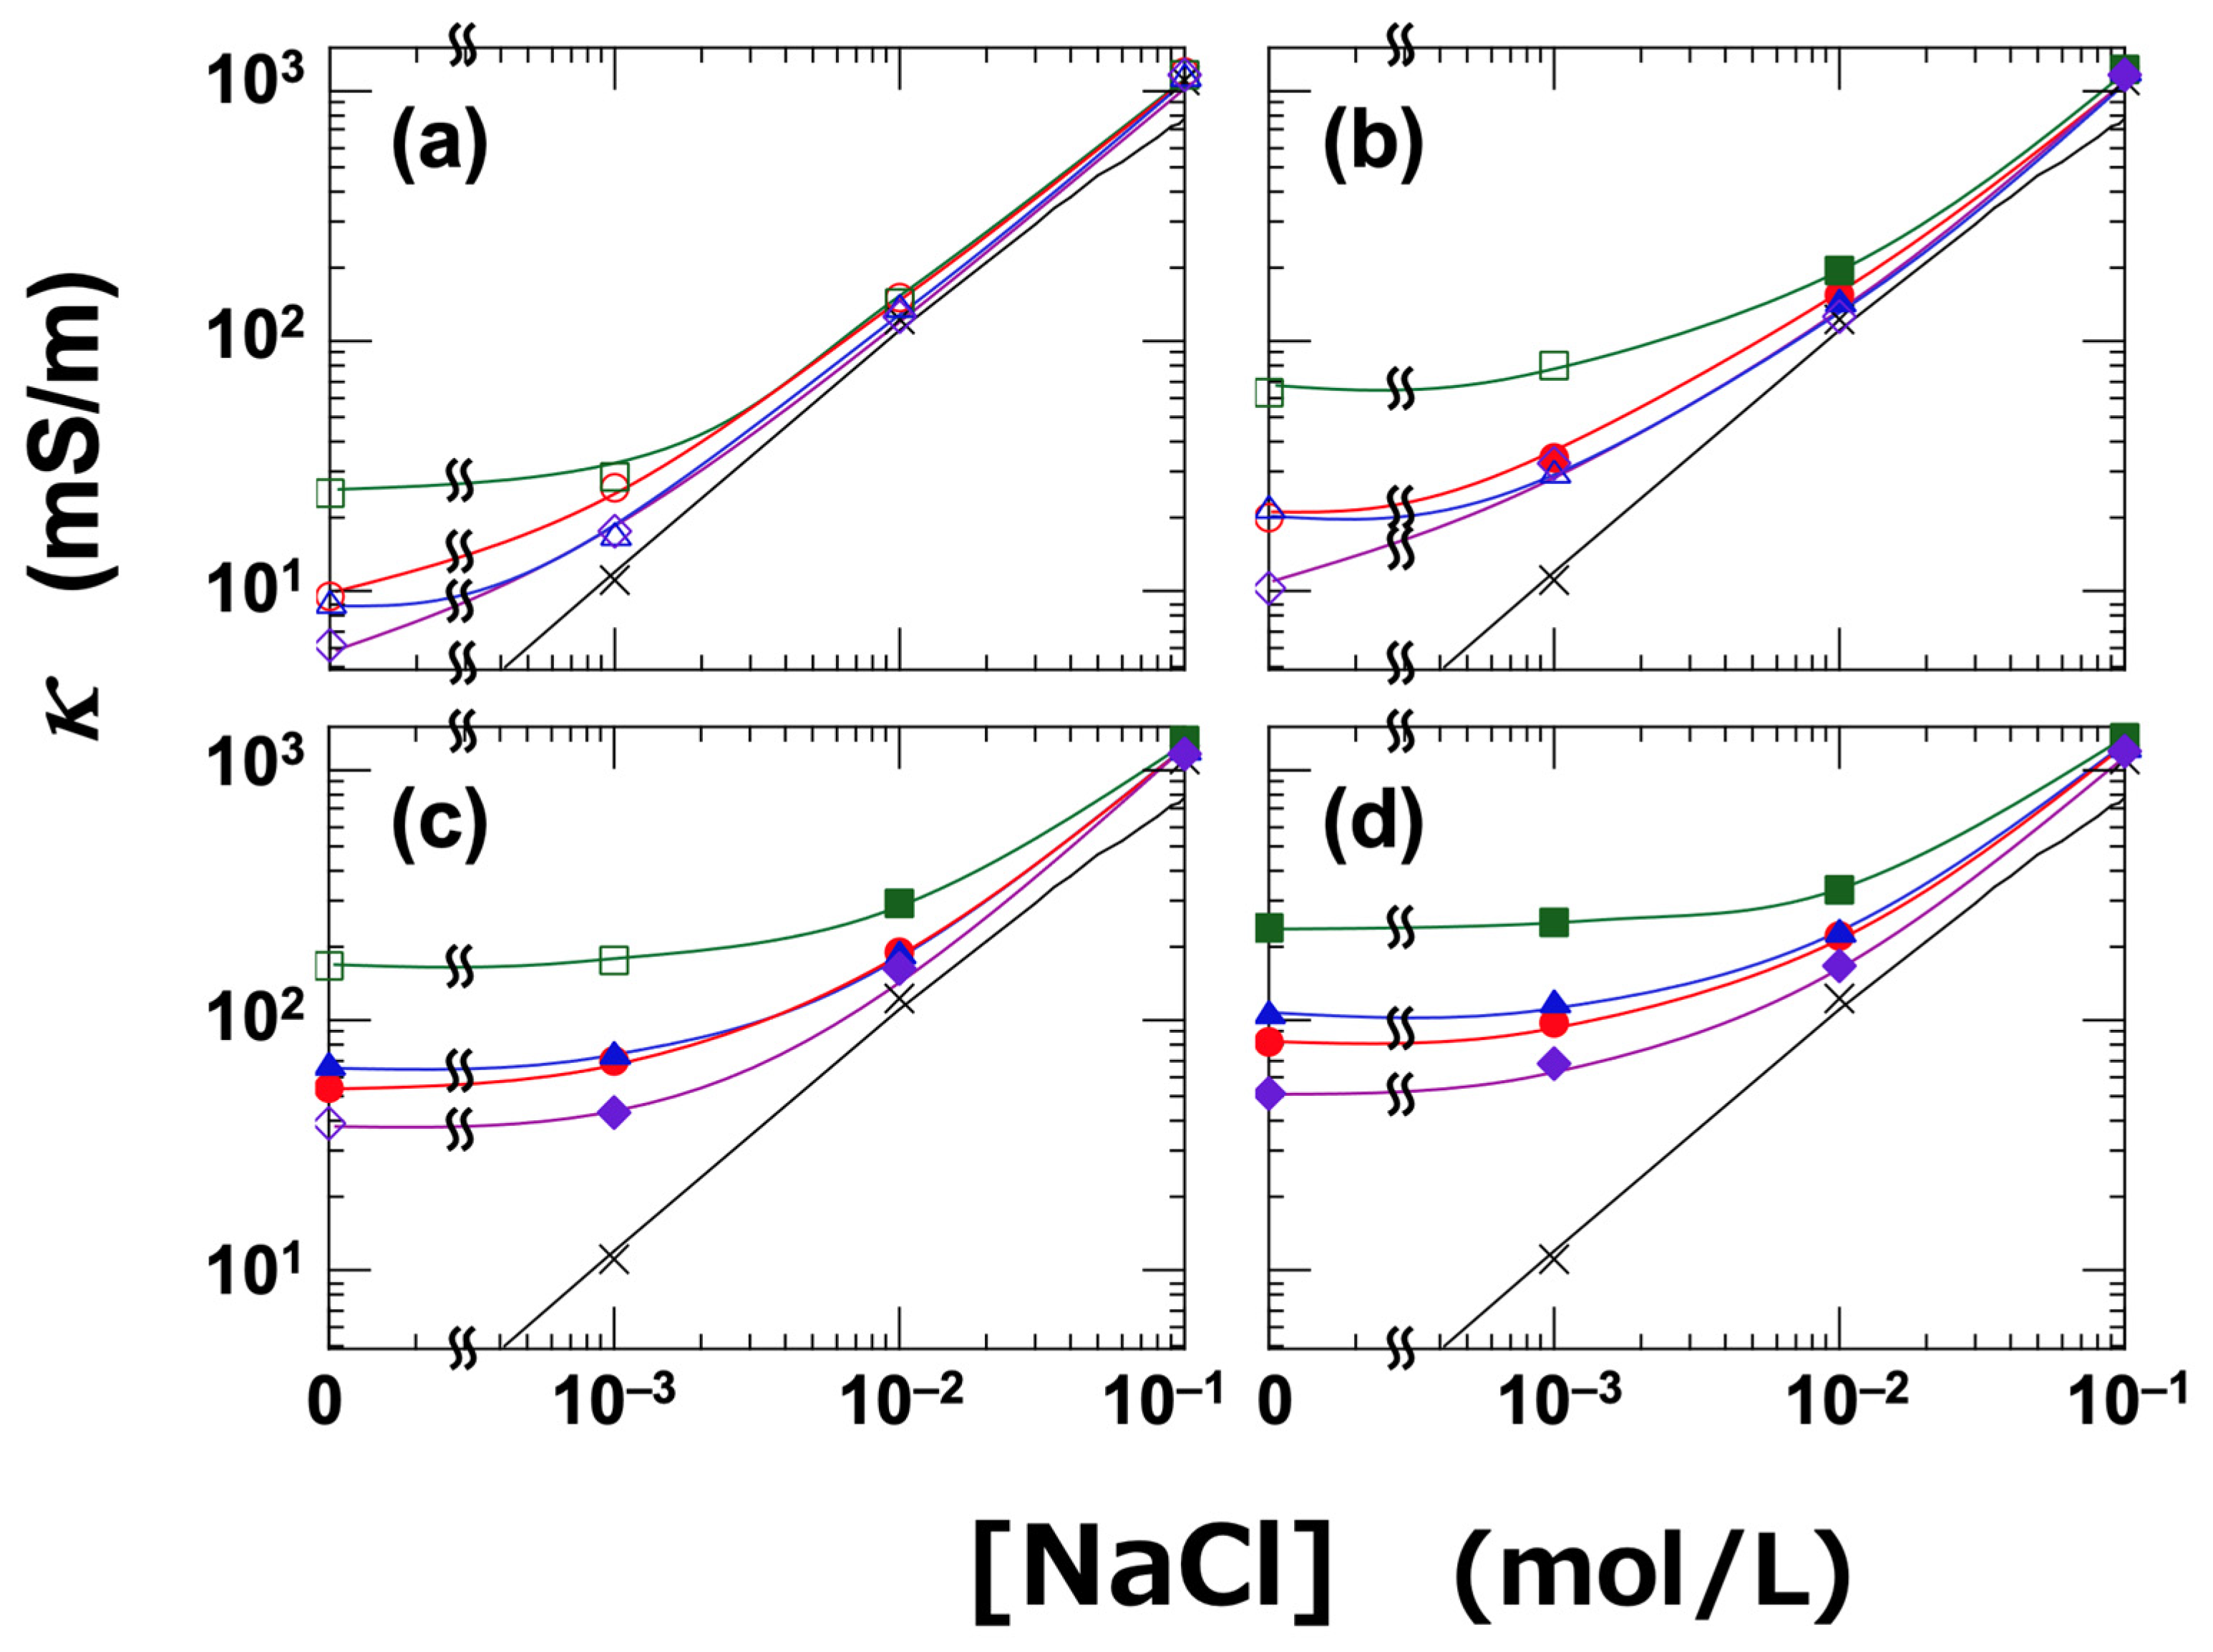
The dependence of κ on NaCl concentration was investigated for the four clay dispersions (Figure 2). At higher NaCl concentrations, κ increased with increasing [NaCl], indicating that ionic conduction was the dominant mechanism under these conditions. The theoretical values of κ for NaCl solutions, calculated using Equations (1) and (2), are shown as black solid lines in Figure 2. The measured values were in good agreement with the theoretical predictions. Under low-salt conditions (i.e., [NaCl] ≤ 0.01 mol/L), the κ values of the clay dispersions were clearly higher than those of the NaCl solutions, and the influence of clay type became more pronounced. In this low-salt regime, surface conduction becomes the dominant mechanism. Regardless of the ϕ, κ was highest for Stv and lowest for Sap. Ht and Ht-F exhibited intermediate values, and their relative positions varied depending on ϕ. Interestingly, this ranking was not affected by whether the dispersion was in a sol or gel state. The order of electrical conductivity among the clays was as follows:
Stv > Ht ≈ Ht-F > Sap (in terms of κ)
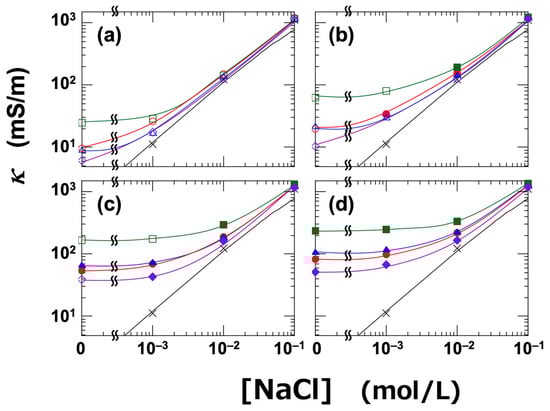
Figure 2.
Electrical conductivity (κ) of smectite clay aqueous dispersions as a function of NaCl concentration ([NaCl]) at 25 °C. ●: Ht-F, ▲: Ht, ■: Stv, ◆: Sap. Open symbols indicate sol states, and closed symbols indicate gel states. (a) ϕ = 0.001, (b) ϕ = 0.003, (c) ϕ = 0.01, (d) ϕ = 0.015. Solid line: theoretical values for NaCl solution; ×: measured values for NaCl solution.
The formation of an electric double layer around clay particles contributes directly to the increase in κ via surface conduction. In non-deionized dispersions, a higher CEC typically results in a greater number of free ions, thereby increasing κ. However, because the dispersions in this study were thoroughly deionized, the observed κ values were more strongly influenced by the “effective surface area” of the clay flocs or network structures. The fact that stevensite has the lowest CEC among the four types of clay, and thus the lowest layer charge, supports the idea that it is the most readily exfoliated [39]. Interestingly, the ranking of κ among the clay types was found to be the reverse of that for CEC. It was unexpected that Ht-F, despite forming the finest network structure—as also evidenced by its high Tr—should exhibit the lowest κ. Ht-F has the smallest particle size, and partial substitution of its edge hydroxyl groups by fluorine atoms may lead to denser aggregation due to stronger London dispersion forces between sheets. This could result in a more compact network with a reduced total surface area. Nevertheless, given that Ht-F shows the highest Tr, it is evident that it forms the finest network structure among the samples. Taken together, the |ζ| serves as a direct indicator of the network fineness or coarseness, reflecting factors such as particle size and degree of exfoliation. Moreover, as will be discussed later, the ranking of |ζ| clearly correlates with macroscopic properties such as rheological behavior and gelation domain.
3.2. DLVO Potential Curves for Clay Particles in Aqueous Media
The |ζ| sharply decreased at NaCl concentrations above 0.01 mol/L and appeared to increase again at concentrations above 0.1 mol/L. These results suggest the involvement of particle aggregation and sol–gel transition behavior. Therefore, DLVO potential curves were constructed to describe the electrostatic interactions between the clay particles in water. The DLVO theory—named after Derjaguin, Landau, Verwey, and Overbeek—describes the total interparticle potential as the sum of the electrostatic repulsion and van der Waals attractive forces. In this study, clay particles dispersed in water were assumed to exist as individual nanosheets due to the long-term deionization treatment. To apply the theory, the disk-like clay nanosheets were approximated as spheres, and their Stokes diameter (dStokes) was calculated using the following equation [40]:
Here, d is the diameter of the clay disk, and is the aspect ratio, defined as d divided by the disk thickness. In this analysis, we compared the behavior of Ht-F and Sap in aqueous media. The calculated Stokes diameter (dStokes) was 9.6 nm for Ht-F and 15.9 nm for Sap. To evaluate the aggregation behavior of clay particles in water, the following equation was used [41,42]:
Here, the symbols represent the following parameters: V is the total interaction potential, VR is the electrostatic repulsive potential, VA is the van der Waals attractive potential, dStokes is the Stokes diameter of the clay particle, ε is the dielectric constant of water, Ψ0 is the surface potential of the particle, H is the interparticle distance, AH is the Hamaker constant, and LD is the Debye length. In most cases, the ζ is used in place of Ψ0. Since the NaCl concentration used in this study was ≥0.005 mol/L, corresponding to a Debye length (LD) of ≤4.3 nm, we adopted an expression for VR that is applicable under the condition dStokes > LD [43]. Assuming that only 1:1 type electrolytes are present in the aqueous medium, the Debye length (LD) can be calculated using the following equation [44]:
Here, kB is the Boltzmann constant, T is the absolute temperature, e is the elementary charge, c is the electrolyte concentration, and NA is Avogadro’s number. At 25 °C, the Debye length (LD) as a function of electrolyte strength c (mol/L) is given by the following expression:
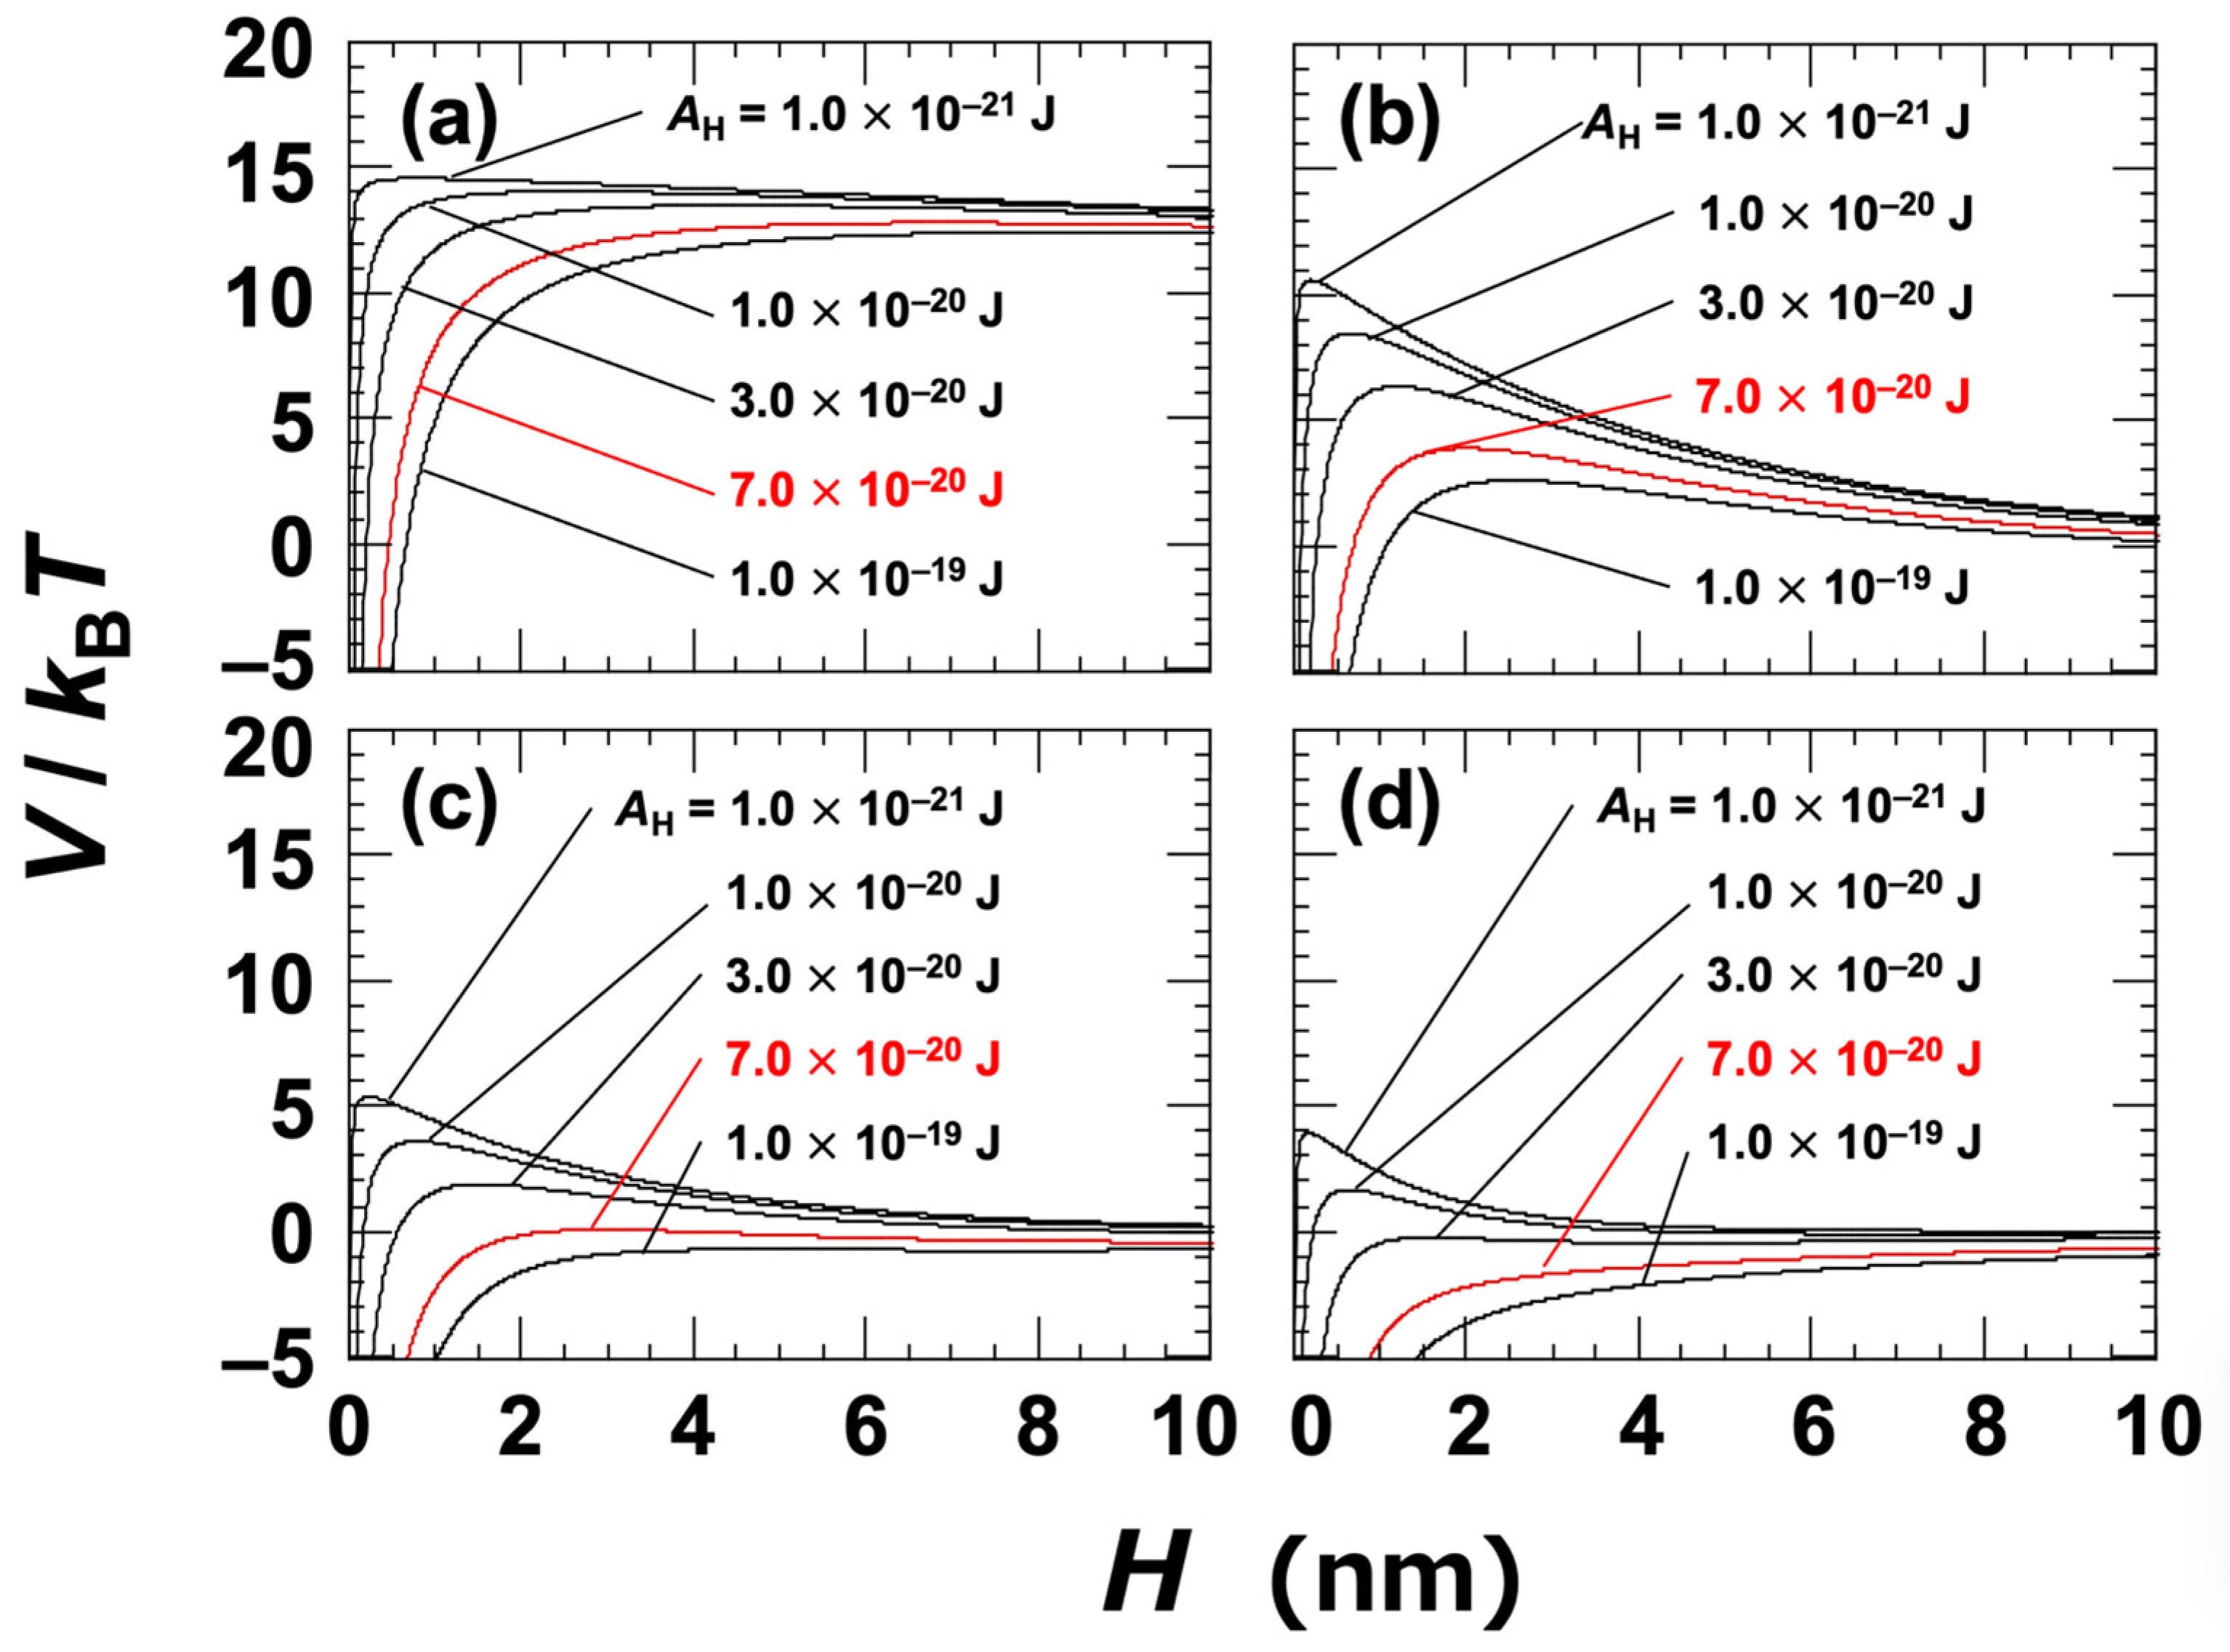
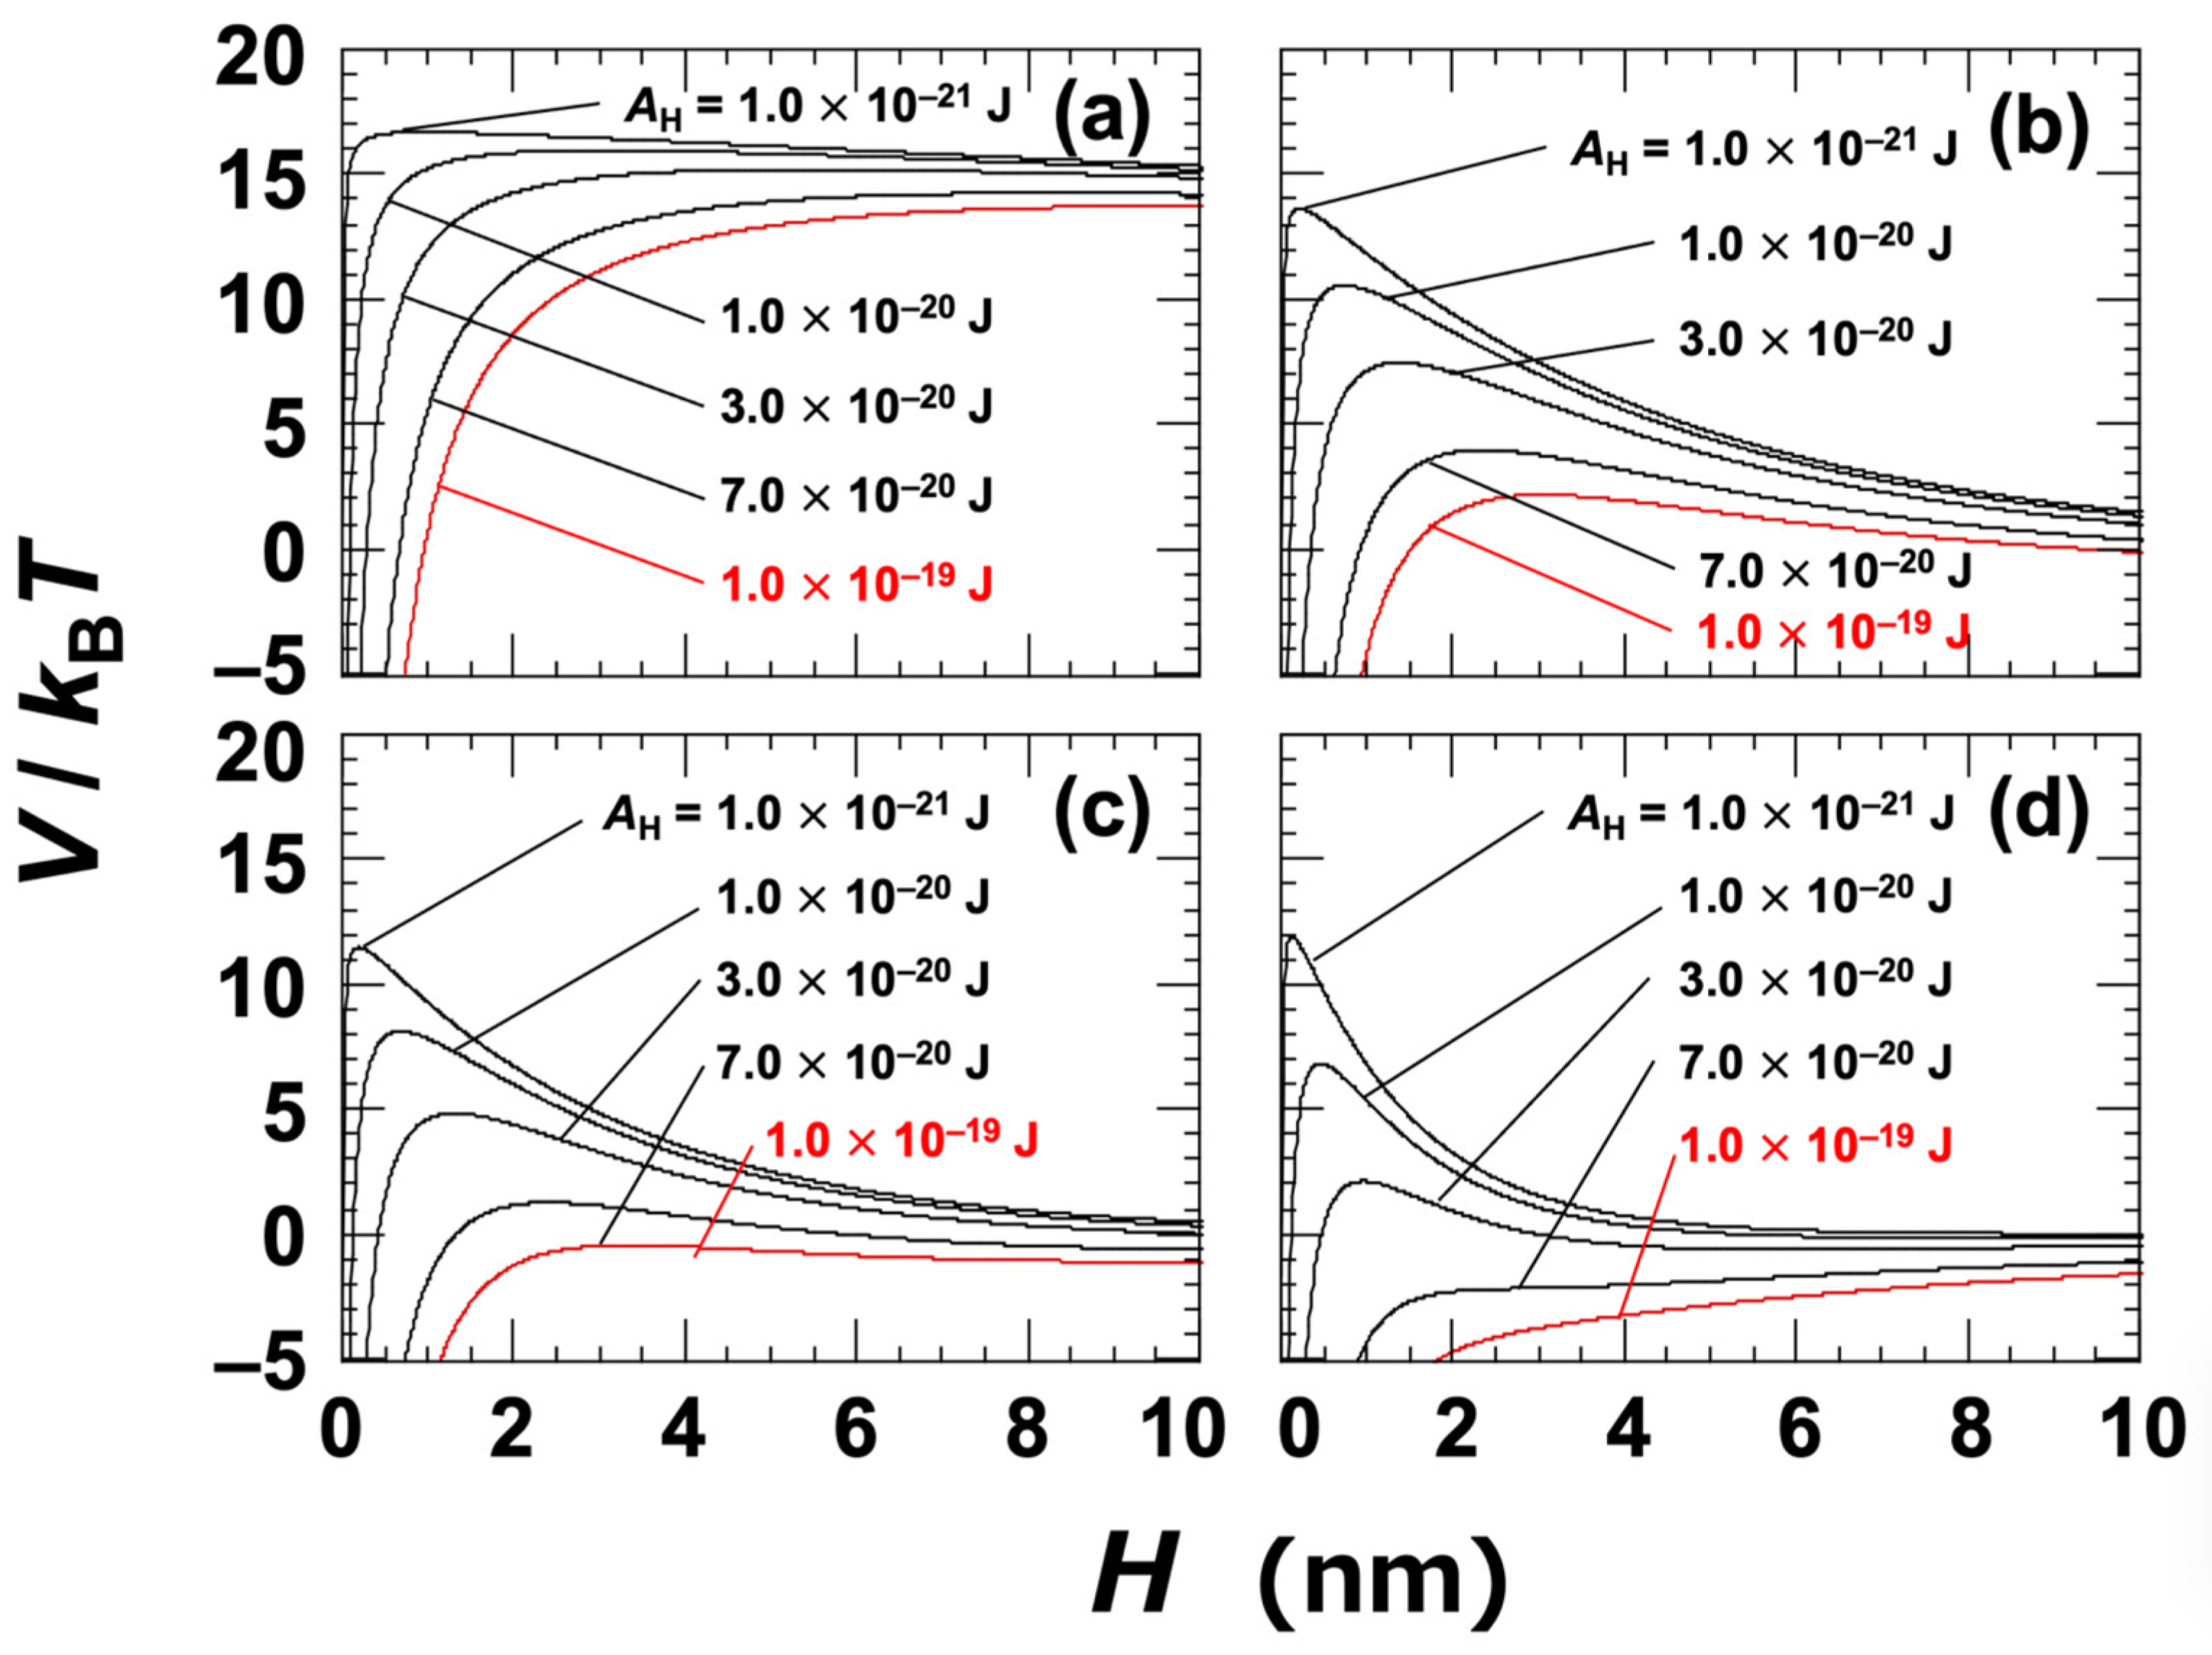
At a NaCl concentration of 0 mol/L, the Debye length (LD) was assumed to be 96 nm; this was estimated based on the electrical conductivity of the ultrapure water used in the experiment [45]. The Hamaker constant (AH) for the clay particles in water was not directly determined in this study. Instead, several representative values were selected within the range typically associated with general materials, namely, AH = 1.0 × 10⁻²¹ to 1.0 × 10⁻¹⁹ J. It has also been reported that the Hamaker constants of inorganic materials are typically on the order of 10−20 J [1,44]. The DLVO potential curves for Ht-F are shown in Figure 3. In general, when the energy barrier in the potential curve exceeds approximately 25 kBT, particles do not aggregate upon approaching one another [46]. In the case of clay dispersions, the energy barriers were found to be relatively low, suggesting that changes in electrolyte concentration or clay volume fraction can have a significant impact on aggregation behavior. Based on the zeta potential results (Figure 1), it was inferred that aggregation would occur at NaCl concentrations ≥ 0.01 mol/L. At this concentration (Figure 3c), the energy barrier became nearly zero for AH = 7.0 × 10⁻²⁰ J, which was regarded as being the apparent value for Ht-F. Similarly, for Sap (Figure 4c), the apparent AH was estimated to be 1.0 × 10⁻¹⁹ J. It should be noted that rigorous estimation of the Hamaker constant for clay in water requires consideration of non-DLVO forces, such as hydration interactions [17,44,47]. Therefore, the values presented here should be interpreted as approximate. Nevertheless, the observation that Sap has a larger apparent AH than Ht-F helps to explain the trends observed in various experimental results.
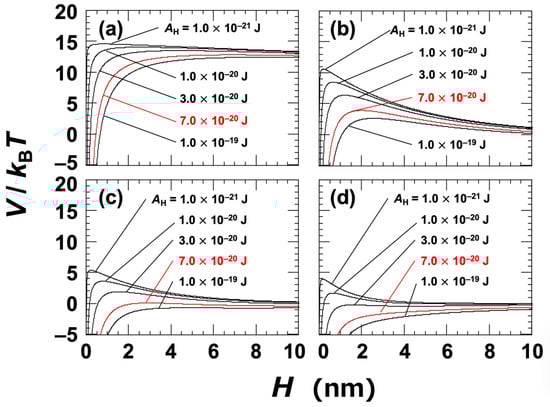
Figure 3.
DLVO potential curves for smectite clay (Ht-F) dispersed in water at 25 °C. Several Hamaker constants (AH) ranging from 1.0 × 10⁻²¹ J to 1.0 × 10⁻¹⁹ J are shown. (a) [NaCl] = 0, c = 10−5 mol/L; (b) [NaCl] = c = 0.005 mol/L; (c) [NaCl] = c = 0.01 mol/L; (d) [NaCl] = c = 0.05 mol/L. The red solid line representing AH = 7.0 × 10⁻²⁰ J corresponds to the estimated value under the assumption that aggregation occurs at [NaCl] = 0.01 mol/L.
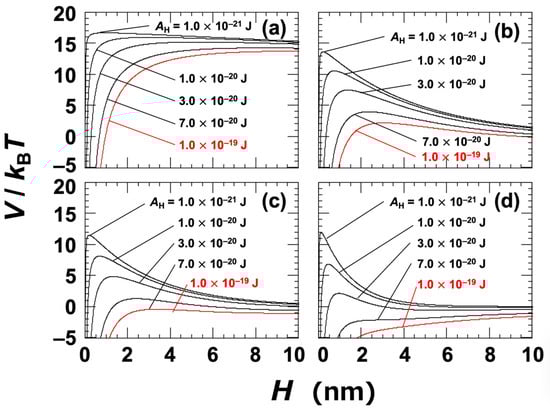
Figure 4.
DLVO potential curves for smectite clay (Sap) dispersed in water at 25 °C. Several Hamaker constants (AH) ranging from 1.0 × 10⁻²¹ J to 1.0 × 10⁻¹⁹ J are shown. (a) [NaCl] = 0, c = 10−5 mol/L; (b) [NaCl] = c = 0.005 mol/L; (c) [NaCl] = c = 0.01 mol/L; (d) [NaCl] = c = 0.05 mol/L. The red solid line representing AH = 1.0 × 10⁻¹⁹ J corresponds to the estimated value under the assumption that aggregation occurs at [NaCl] = 0.01 mol/L.
3.3. Rheological Measurements
3.3.1. Steady-State (Static) Shear Measurements
Flow curves were obtained for the four types of clay dispersions by varying the ϕ and NaCl concentration ([NaCl]). Figure 5 shows a representative example using the stevensite (Stv) dispersion. When the dispersion had a low volume fraction (ϕ = 0.001) and was fully deionized ([NaCl] = 0), it exhibited Newtonian behavior, clearly indicating a sol state. Despite the low ϕ value, the viscosity was significantly higher than that of pure water, suggesting that strong interparticle interactions were present even in such dilute conditions. At a higher volume fraction (ϕ = 0.01), the flow curves varied markedly depending on the salt concentration. In the deionized state, the shear stress (σ) remained nearly constant regardless of the shear rate (). At [NaCl] = 0.001 mol/L, σ decreased at low and then increased in a stepwise manner with increasing , showing a distinct nonlinear behavior. Around = 1.0 s−1, a dilatant (shear-thickening) response was also observed. As the salt concentration increased further, σ increased correspondingly, and at [NaCl] = 0.1 mol/L, σ remained nearly constant across the range. These results indicate that both ϕ and [NaCl] have a substantial influence on the rheological behavior of the dispersions. While the flow curves provide valuable insights—such as stress enhancement induced by flow—they do not fully capture the sol–gel transition characteristics of the system.
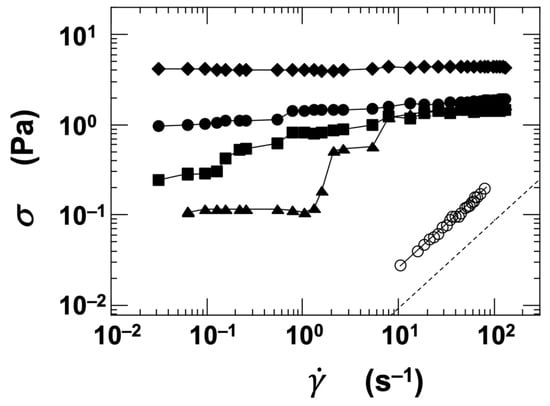
Figure 5.
Flow curves of stevensite (Stv) aqueous dispersions at 25 °C. Open symbols: ϕ = 0.001; closed symbols: ϕ = 0.01. ○, ●: [NaCl] = 0, ▲: 0.001 mol/L, ■: 0.01 mol/L, ◆: 0.1 mol/L. Dashed line: reference value for pure water.
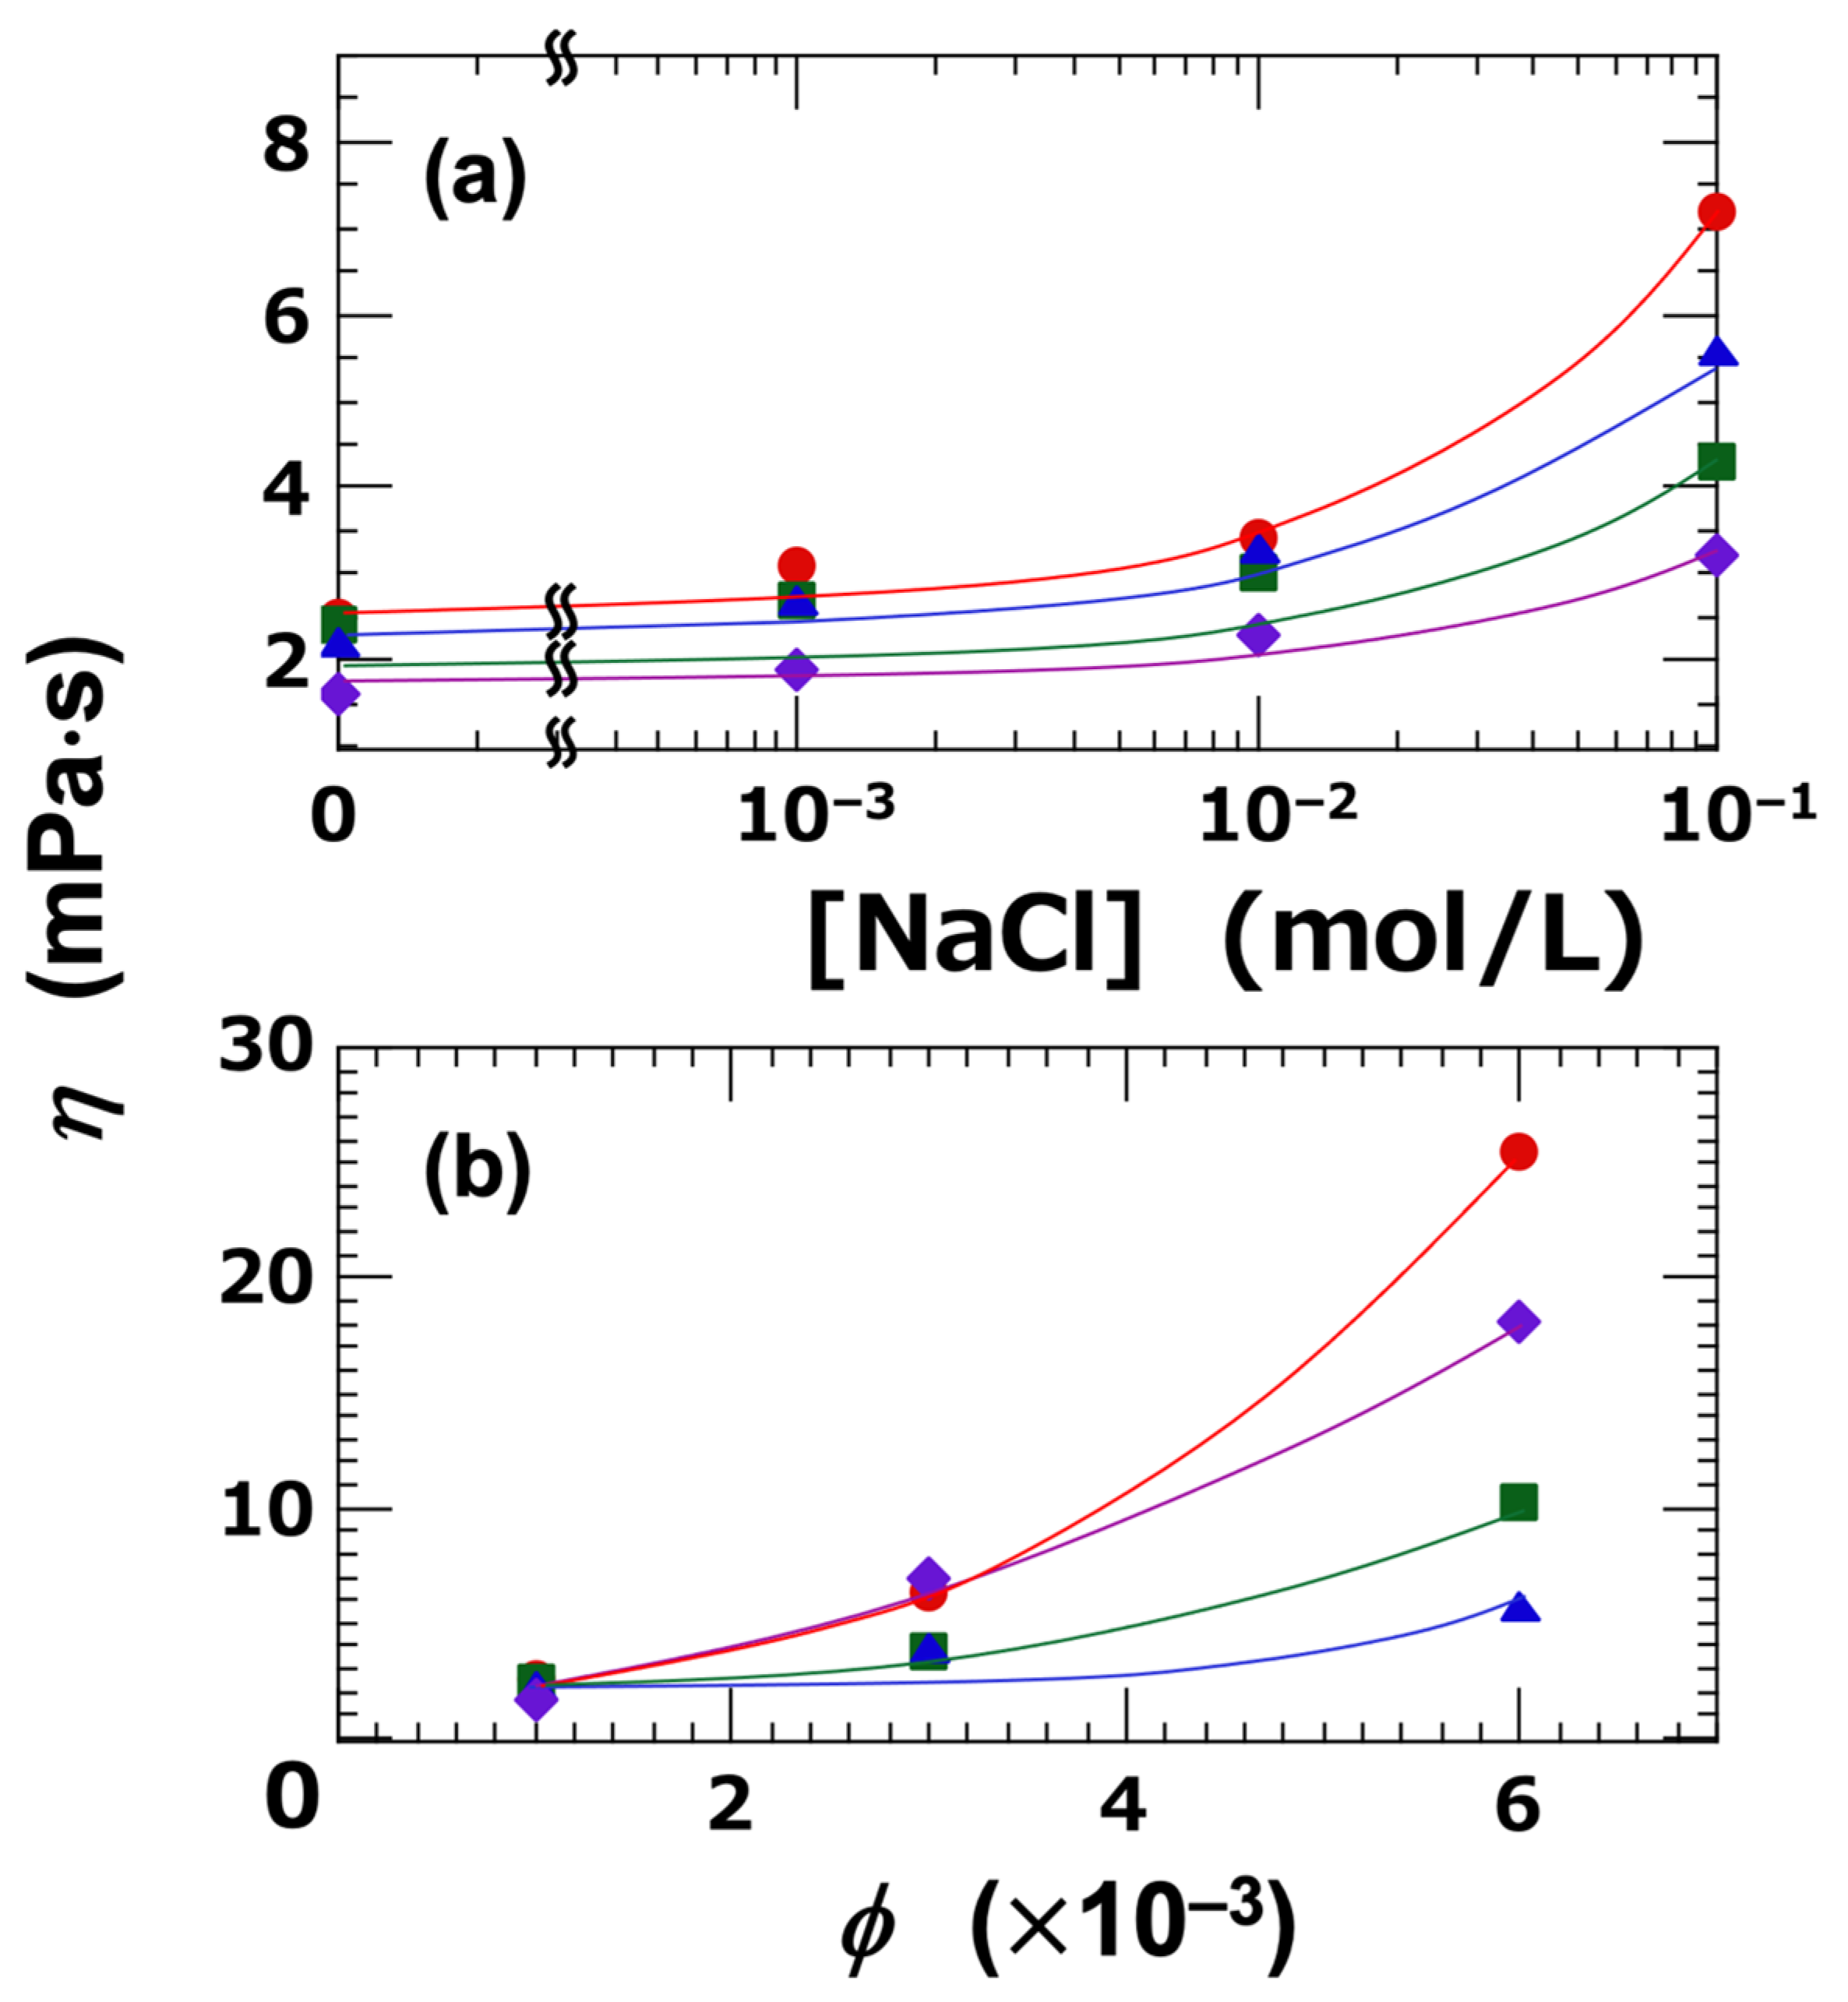
In the sol state, the flow curves of the clay dispersions exhibited Newtonian behavior when both the ϕ and [NaCl] were sufficiently low. The effects of ϕ and [NaCl] on the resulting viscosity (η) are summarized in Figure 6. At the lowest volume fraction, ϕ = 0.001 (Figure 6a), η increased markedly with increasing [NaCl], particularly when [NaCl] exceeded 0.01 mol/L. This behavior can be clearly attributed to particle aggregation, a determination which is also supported by the DLVO (Derjaguin–Landau–Verwey–Overbeek) potential curves discussed earlier. Among the four clay types, Ht-F exhibited the highest viscosity. The ranking according to η reflected the size and extent of the clay aggregates, and was as follows:
Ht-F > Ht > Stv > Sap (in terms of η, ϕ = 0.001, [NaCl] = 0.1 mol/L)
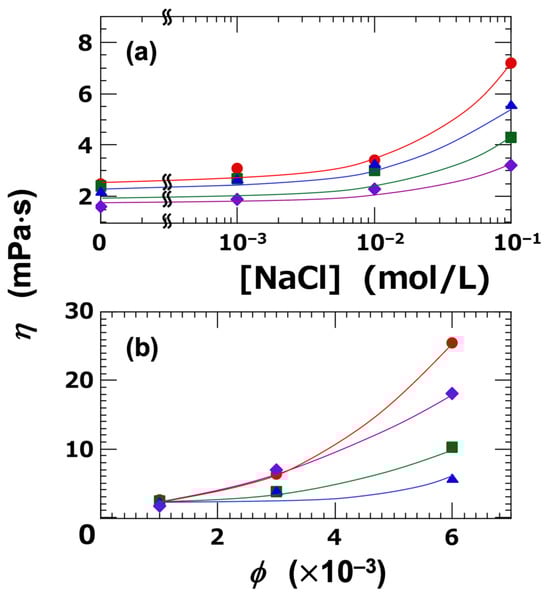
Figure 6.
Newtonian viscosity of smectite clay aqueous dispersions at 25 °C. (a) Dependence on NaCl concentration ([NaCl]) at ϕ = 0.001. (b) Dependence on clay volume fraction (ϕ) at [NaCl] = 0. ●: Ht-F, ▲: Ht, ■: Stv, ◆: Sap.
Next, the dependence of viscosity (η) on ϕ was investigated under deionized conditions (Figure 6b). As ϕ increased, η also increased accordingly. Notably, at higher ϕ values, the ranking of η changed, and the order was as follows:
Ht-F > Sap > Stv > Ht (in terms of η, ϕ = 0.006, [NaCl] = 0)
While Ht-F maintained the highest η value, the ranking of the other clays changed; notably, Sap exhibited the second-highest η, following Ht-F. Sap dispersions showed the lowest transparency, indicating a strong tendency towards particle aggregation. These results suggest that the η is governed not only by the spatial extent of the clay aggregates, but also by the interplay between their size and the attractive forces between clay particles, such as London dispersion forces.
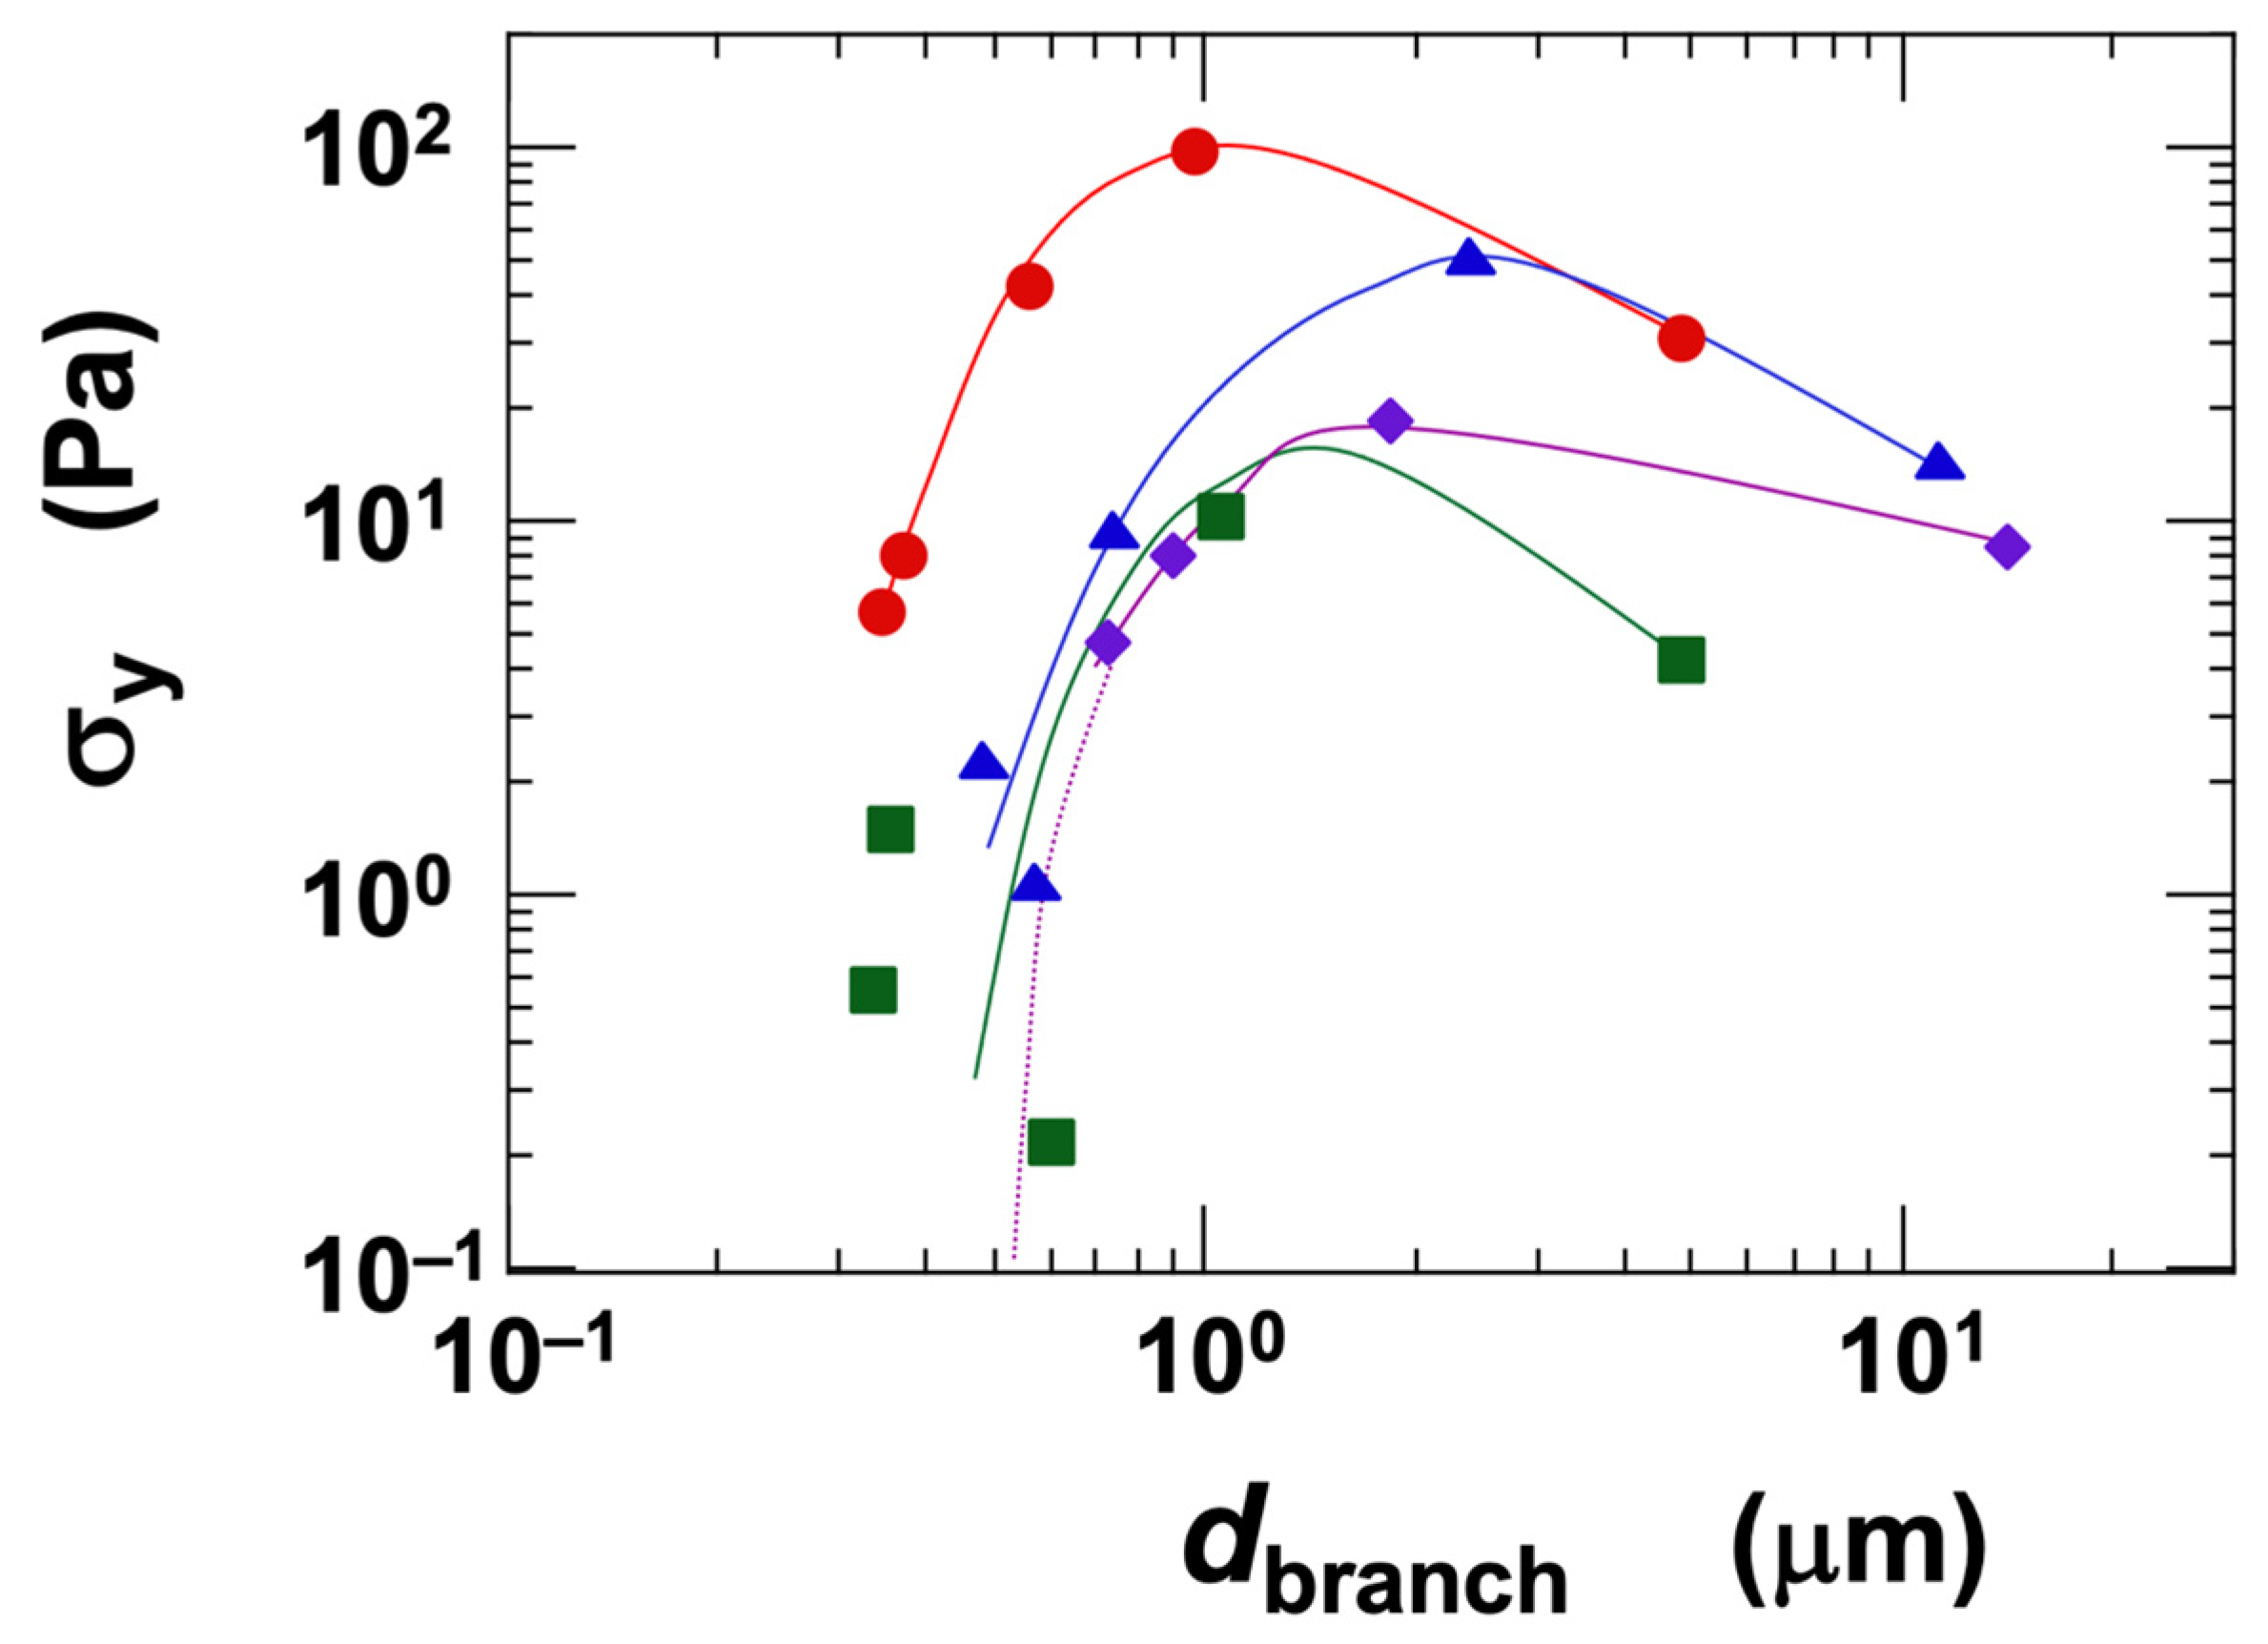
In the gel state of the clay dispersions, a yield stress (σy) was observed. There has been ongoing debate regarding the physical existence of yield stress, with an intriguing study reporting that, under low-stress conditions, materials may behave as highly viscous Newtonian fluids [48]. Such insights have been enabled by recent advances in measurement technology. However, under the typical observational time scales employed in this study, the dispersions clearly exhibited the characteristics of a solid. Regarding colloidal gel formation, Sciortino et al. [49] reported that the competition between short-range attractions and long-range repulsions significantly influences both cluster growth and the formation of the final network. In our experiments, σy tended to increase with both clay volume fraction and NaCl concentration. The ranking of σy among the clay types varied in a complex manner, which—similar to the behavior observed for viscosity (η)—is likely due to the competition between the tendency towards network expansion and the attractive forces such as London dispersion interactions. To further investigate this, we analyzed the influence of the network branch diameter (dbranch) on σy, under a fixed condition of ϕ = 0.01 (Figure 7). The measured dbranch ranged approximately from 0.3 μm to 10 μm. As dbranch increased, σy first increased and then reached a maximum. It is known that dbranch increases with [NaCl] when ϕ is held constant [6,19]. Beyond a certain salt concentration, both σy and the elastic modulus decrease, a phenomenon also reported by several other researchers [20]. Furthermore, Abend and Lagaly [50] showed that attractive gels formed from sodium montmorillonite dispersions can collapse and precipitate when the interparticle interactions become too strong. When comparing the clays at equivalent dbranch values, the ranking of σy was as follows:
Ht-F > Ht > Stv ≈ Sap (in terms of σy, for dbranch < ~1 μm)
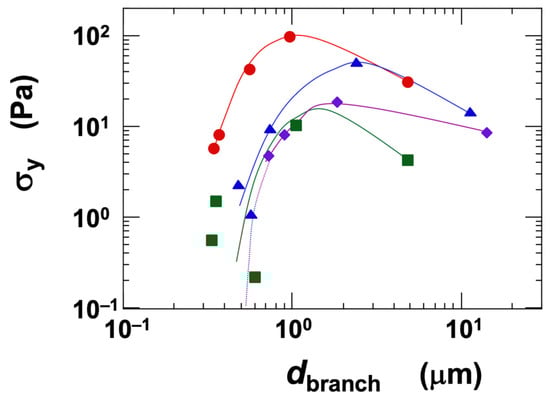
Figure 7.
Dependence of yield stress (σy) on the skeleton diameter of the three-dimensional network structure in smectite clay aqueous dispersions at 25 °C. Skeleton diameter data are taken from a previous study [6]. ϕ = 0.01. ●: Ht-F, ▲: Ht, ■: Stv, ◆: Sap.
Since the volume fraction was held constant, the observed σy ranking likely reflects differences in the magnitude of electrostatic attractive forces among the clays. For example, Ht-F tends to form finer networks, and to achieve the same dbranch as the other clays, it requires a higher NaCl concentration. At elevated [NaCl], the electric double layer surrounding the clay particles becomes compressed, leading to stronger electrostatic attractions between them. In contrast, Sap inherently forms coarser networks and can exhibit larger dbranch values even at lower salt concentrations. Therefore, when compared at the same dbranch, Sap exhibited the lowest σy among the clays. Moreover, the fact that the σy of Sap does not decrease significantly even at high salt concentrations further supports the interpretation that electrostatic attractions are stronger in Sap, under equivalent conditions, compared to the other clay types.
3.3.2. Dynamic (Oscillatory) Rheological Measurements
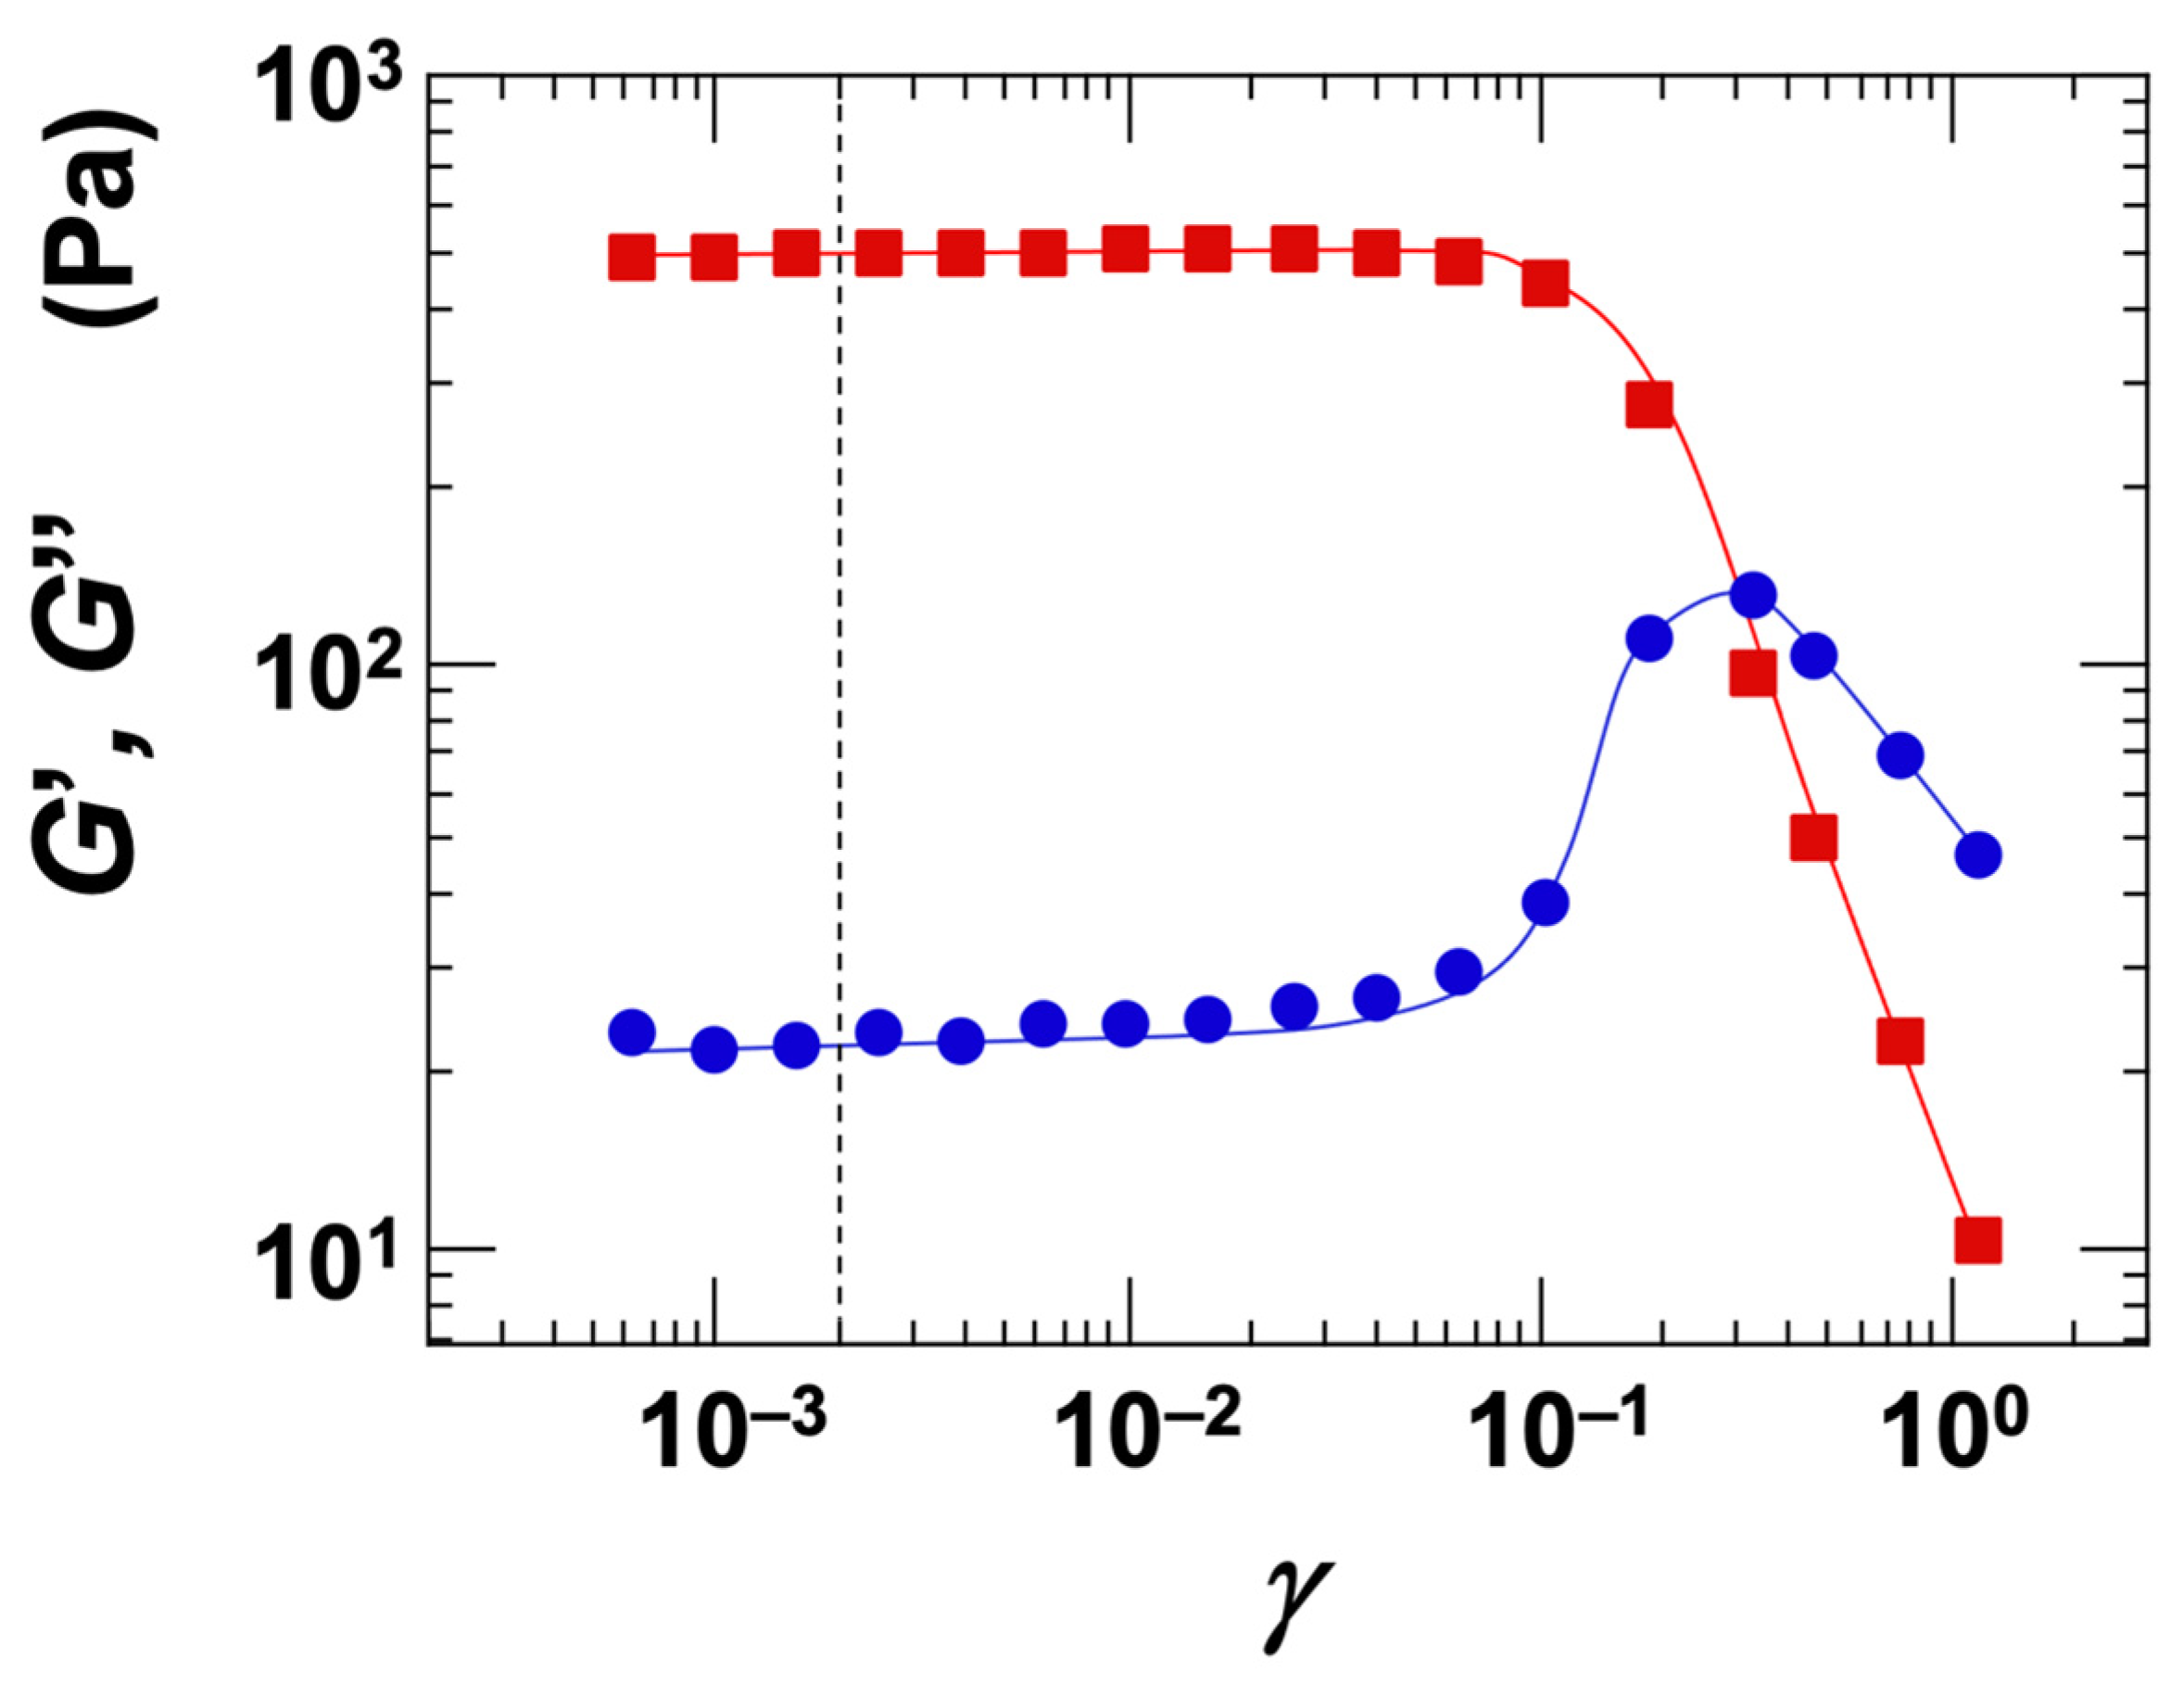
The strain dependence of the storage modulus (G′) and loss modulus (G″) was investigated for the Ht-F dispersion (Figure 8). Under the conditions of ϕ = 0.01 and [NaCl] = 0, the Stv dispersion exhibited gel-like behavior. At strain amplitudes (γ) below approximately 0.1, G′ exceeded G″, indicating that the dispersion remained within the linear viscoelastic (LVE) region. In this study, all dynamic rheological measurements were conducted using a small strain amplitude of γ = 0.002 to ensure accurate measurements within the LVE regime.

Figure 8.
Strain dependence of storage modulus (G′) and loss modulus (G″) for a fluorinated hectorite (Ht-F) aqueous dispersion at 25 °C. ϕ = 0.01, [NaCl] = 0. ■: G′, ●: G″. The dotted line indicates the set strain value of 0.002.
The dependence of the G′ and G″ on angular frequency (ω) was investigated (Figure 9). Representative measurement examples are presented here. For the Sap dispersion at ϕ = 0.006 and [NaCl] = 0 (Figure 9a), both G′ and G″ increased with increasing ω, with G″ consistently greater than G′. This behavior was interpreted as characteristic of the sol regime. In the case of the Ht-F dispersion at ϕ = 0.006 and [NaCl] = 0.001 mol/L (Figure 9b), G′ exhibited a minimum with respect to ω, while G″ increased monotonically. As a result, G′ was greater than G″ at low frequencies, whereas G″ exceeded G′ at high frequencies. Such a crossover between G′ and G″ depending on ω is a hallmark of the vicinity of the sol–gel transition. For the Ht-F dispersion at ϕ = 0.017 and [NaCl] = 0 (Figure 9c), both G′ and G″ remained nearly constant across the frequency range, and G′ consistently exceeded G″. This indicates that the dispersion was in the gel regime.
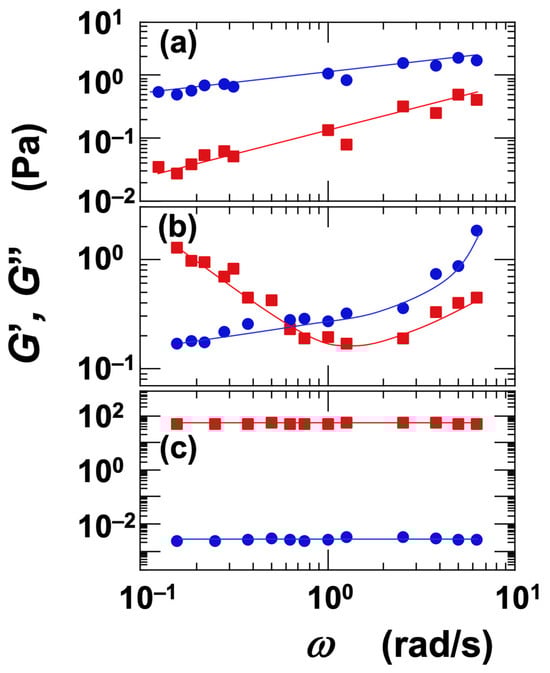
Figure 9.
Angular frequency dependence of storage modulus (G′) and loss modulus (G″) for smectite clay aqueous dispersions at 25 °C. ■: G′, ●: G″. (a) Saponite (Sap), ϕ = 0.006, [NaCl] = 0. Sol region. (b) Fluorinated hectorite (Ht-F), ϕ = 0.006, [NaCl] = 0.001 mol/L. Near sol–gel transition region. (c) Fluorinated hectorite (Ht-F), ϕ = 0.017, [NaCl] = 0. Gel region.
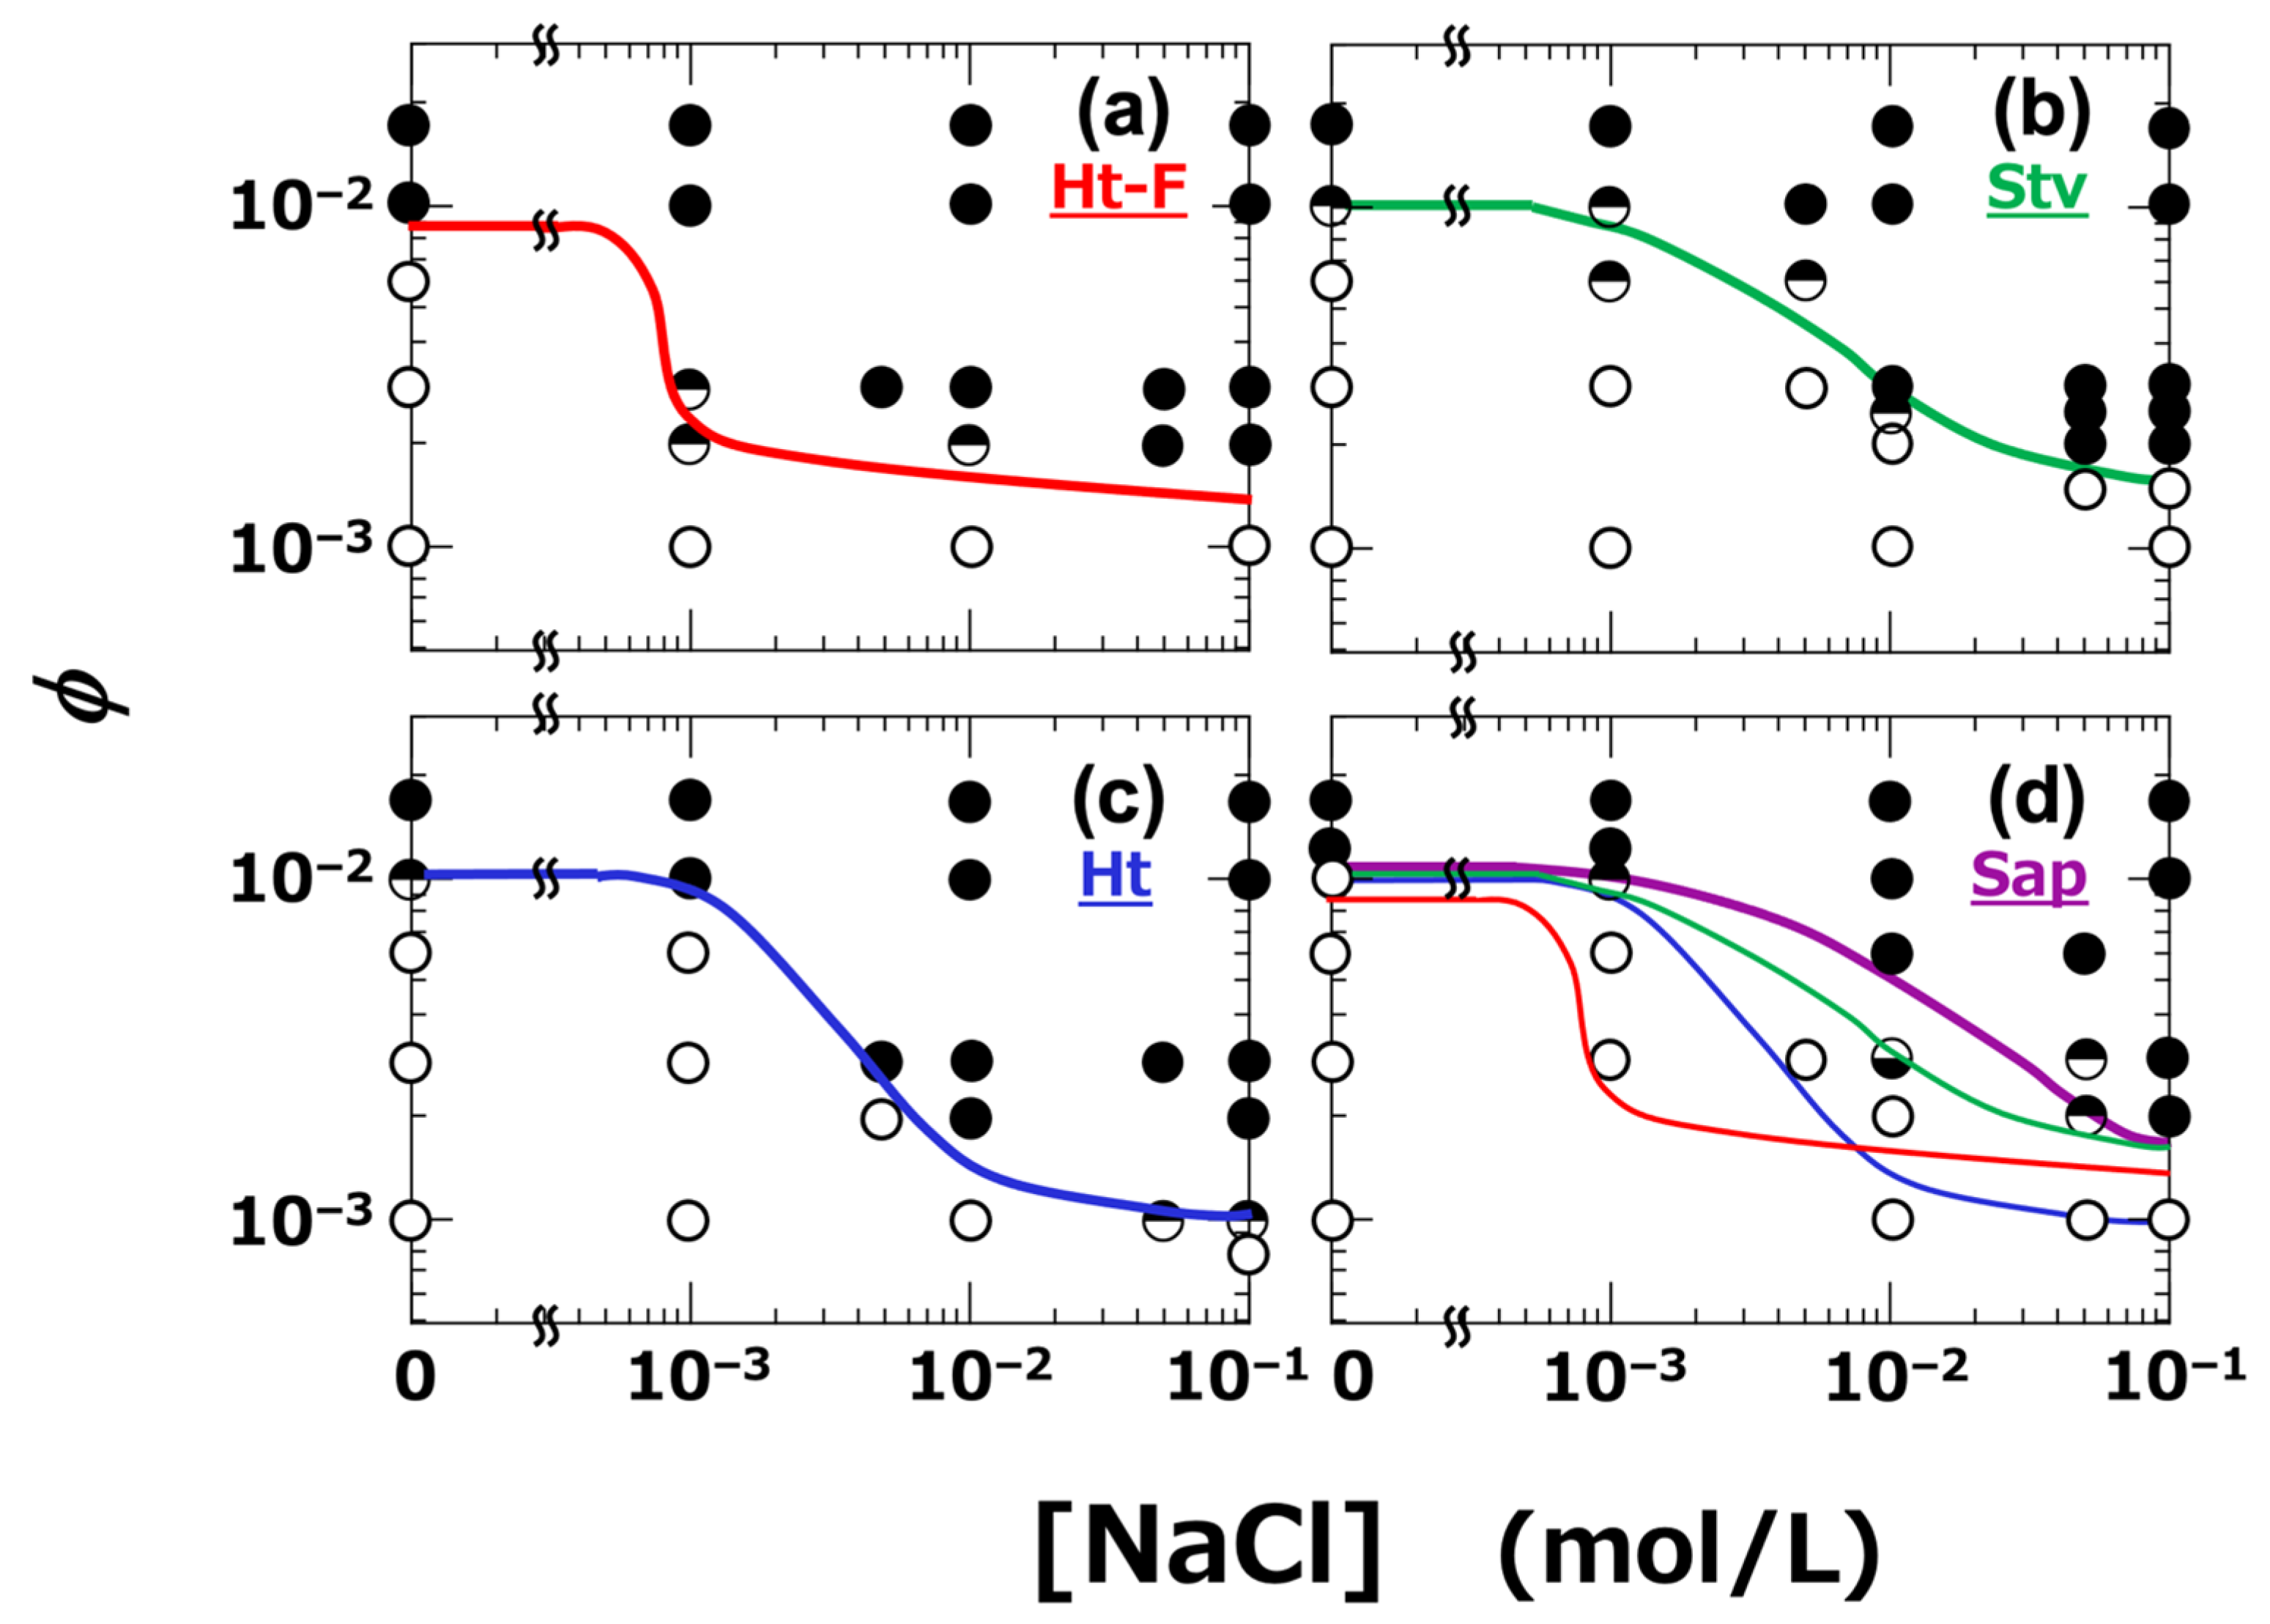
All dispersions were analyzed, and their viscoelastic behavior was classified based on the relative magnitudes of G′ and G″. Specifically, conditions where G′ > G″ were defined as the gel regime, those where G″ > G′ as the sol regime, and conditions in which G′ and G″ crossed over depending on ω were considered as indicating the vicinity of the sol–gel transition. Based on this classification, a sol–gel state diagram was constructed (Figure 10). The boundary between the sol and gel regimes is indicated by solid lines. It was clearly observed that gelation occurred when ϕ exceeded a certain threshold. Importantly, the gel region expanded with increasing NaCl concentration, and the extent of this expansion varied depending on the type of clay. Among the four clays, Ht-F exhibited the broadest gel region. The ranking of gelation domain size among the clays was as follows:
Ht-F > Ht > Stv > Sap (in terms of gelation domain size)
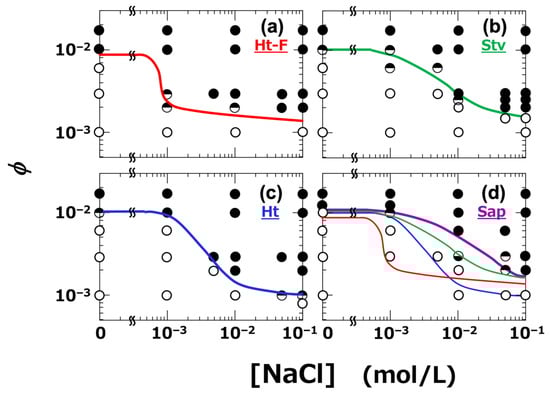
Figure 10.
Sol–gel state diagrams of smectite clay aqueous dispersions at 25 °C. (a) Ht-F, (b) Stv, (c) Ht, (d) Sap. Sol–gel states were determined by dynamic rheological measurements. Set strain amplitude: γ = 0.002; angular frequency: ω = 6.3 × 10⁻³ to 6.3 rad/s. ○: sol state (tan δ > 1), ●: gel state (tan δ < 1), ◒: tan δ < 1 at low ω and >1 at high ω, ◓: tan δ > 1 at low ω and <1 at high ω. Solid lines indicate boundaries between sol and gel regions. In panel (d), the variously colored lines indicate the boundaries from the other clay types for comparison.
The size of the gel region directly reflects the ease of gelation. Ht-F, which tends to form fine network structures, exhibited the highest gelation tendency. Notably, the ranking of the clay types with respect to gelation domain size, viscosity (η), and yield stress (σy) was found to be consistent across all these properties. Compared to the previously reported sol–gel state diagram determined at a strain amplitude of γ = 0.088 [6], the diagram constructed in this study at γ = 0.002 showed a narrower gel region for Ht and Sap, while the gelation behavior of Ht-F and Stv remained largely unchanged. This difference may be attributed to the fact that clay dispersions often exhibit dilatant behavior [20], and under large deformation, the dispersions may become more elastic during oscillatory measurements. In general, large amplitude oscillatory shear (LAOS) tests for thixotropic dispersions can induce rupture and reformation of higher-order structures within each oscillation cycle, leading to nonlinear viscoelastic responses [51]. Nevertheless, the ranking of gelation domain size among the clays remained unchanged, regardless of the applied strain amplitude.
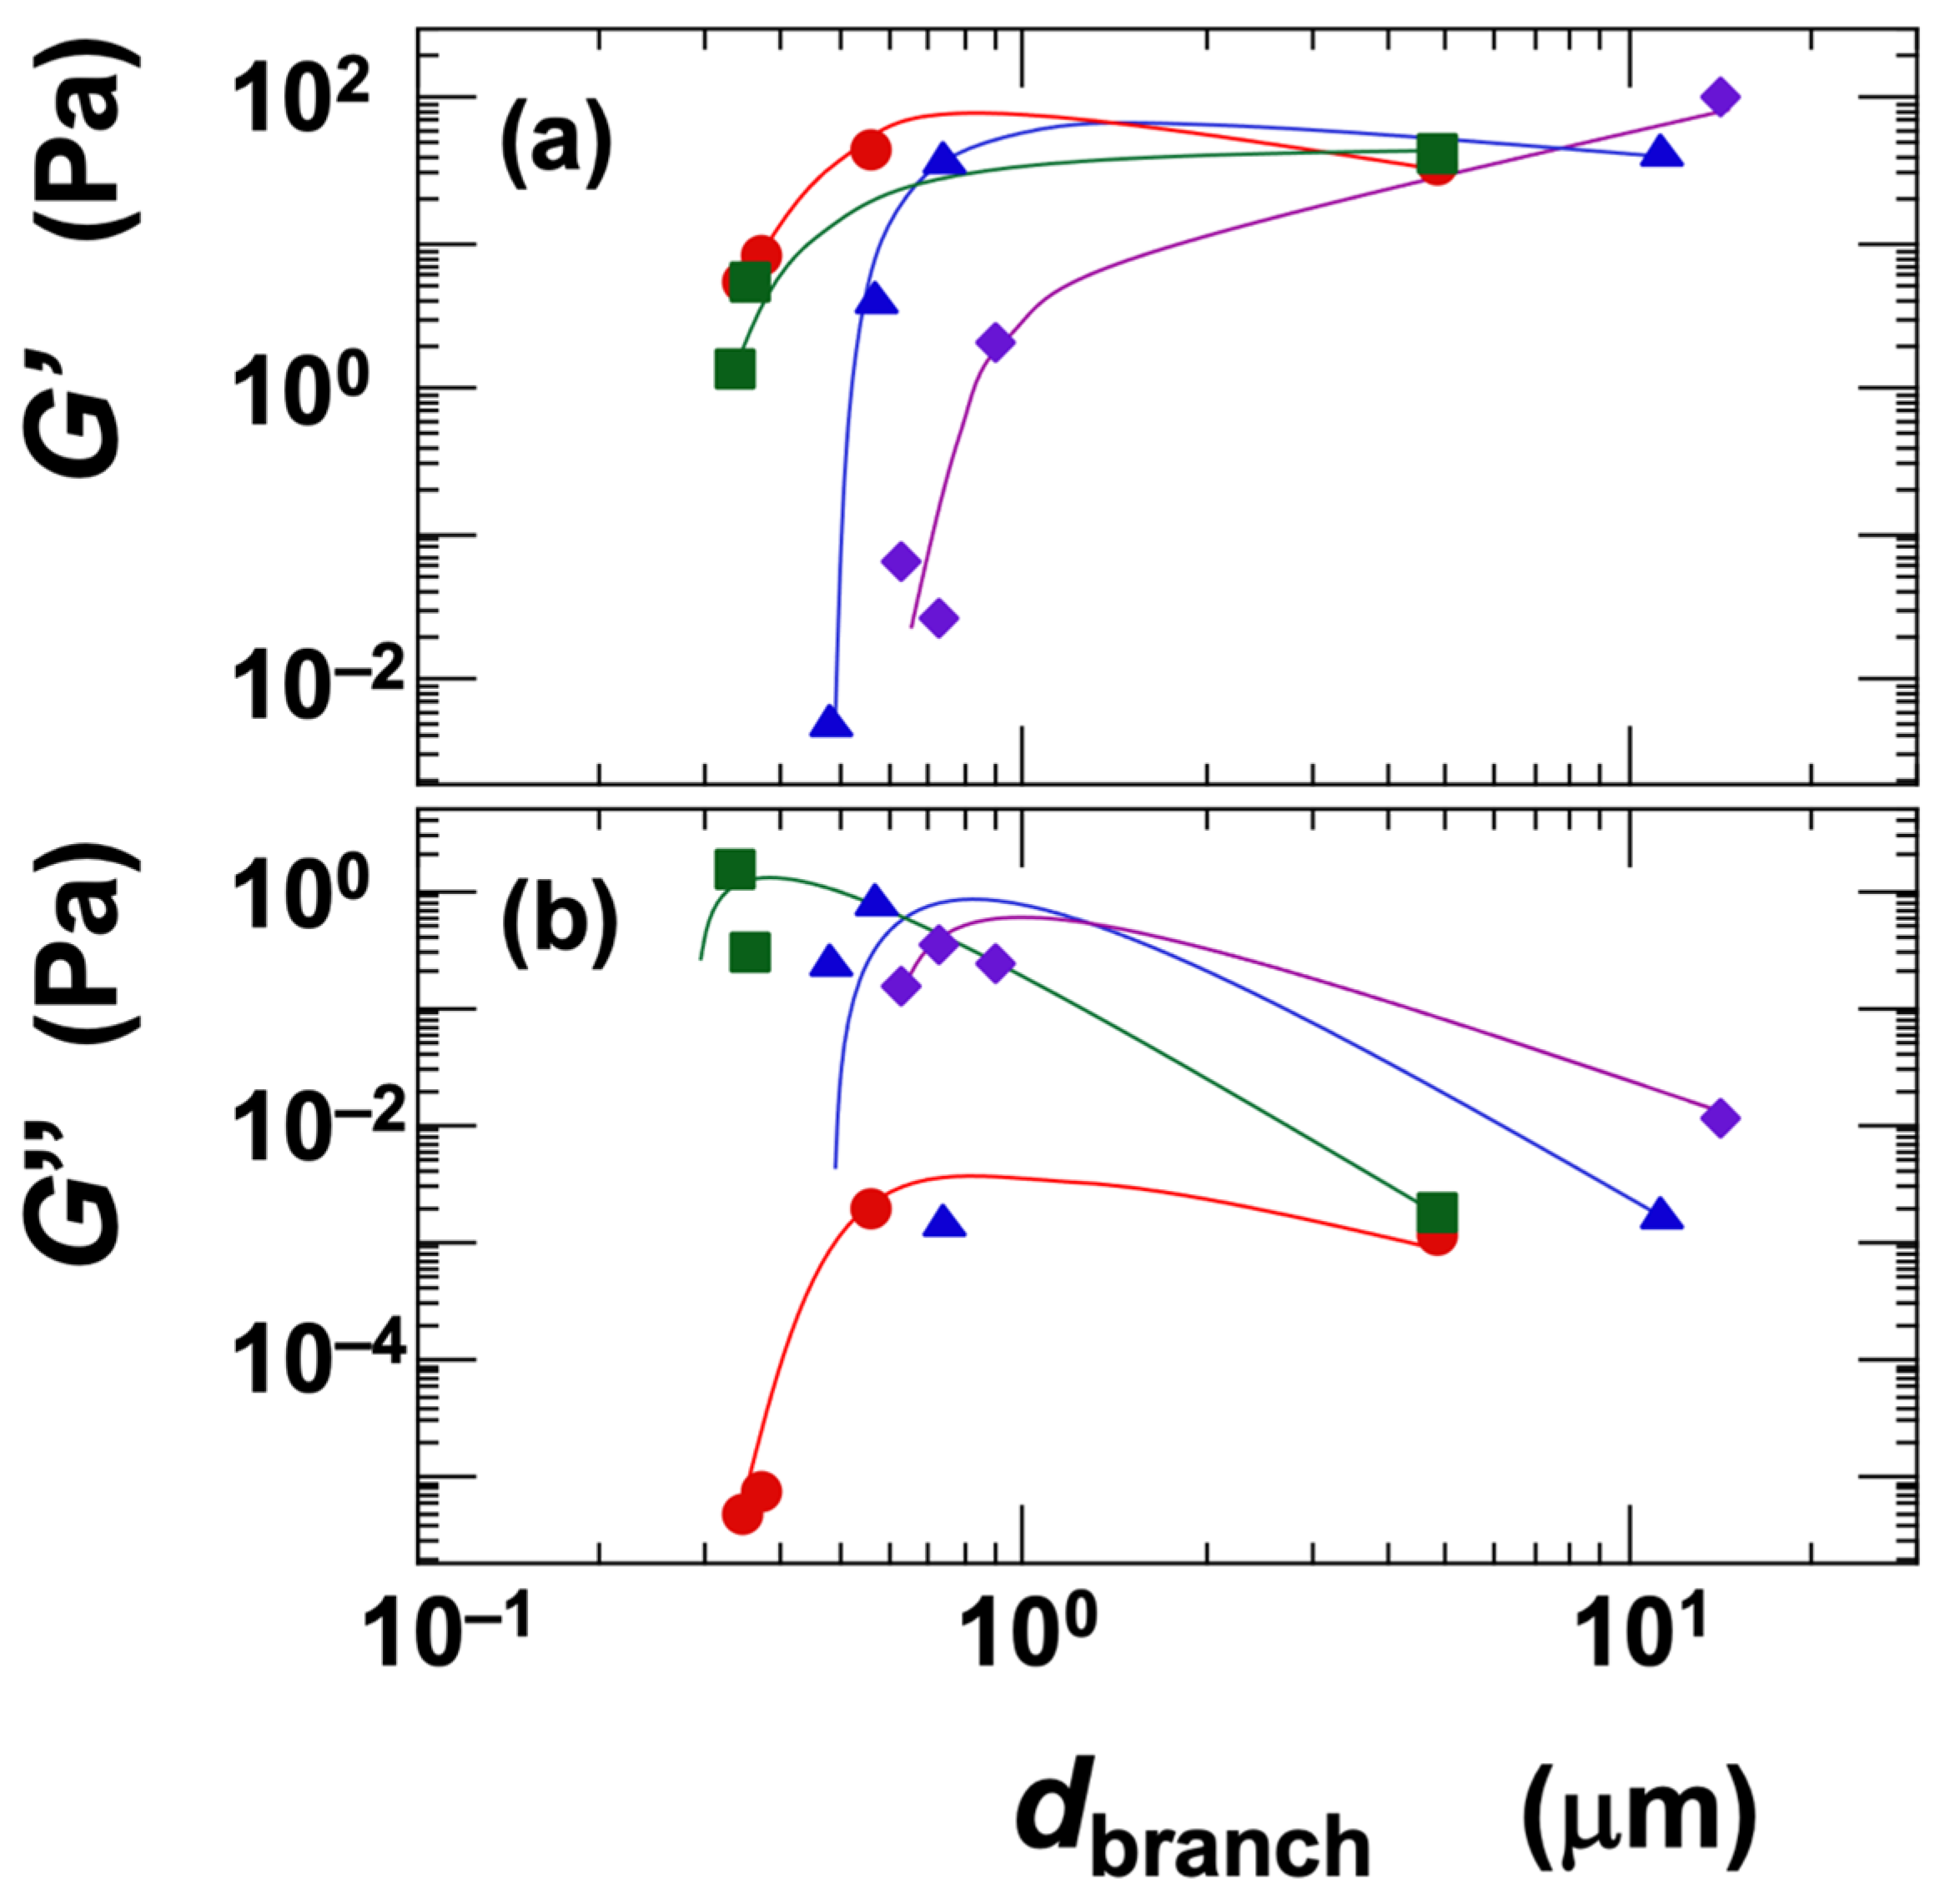
Next, the influence of the network branch diameter (dbranch) on the storage modulus (G′) and loss modulus (G″) was examined under the identical conditions of ϕ = 0.01 (Figure 11). Since the dispersions in this analysis were in the gel state, G′ values were consistently higher than G″, indicating that the elastic component was dominant. For all clays except Sap, the G′ increased with increasing dbranch and reached a plateau (Figure 11a). The reason G′ did not exhibit a peak, unlike the σy, is likely that σy represents a material property under large deformation (steady shear), whereas G′ reflects the material’s response under small deformation (oscillatory shear). In the case of Sap, G′ continued to increase significantly with increasing dbranch. This behavior, consistent with its yield stress trend, suggests that Sap forms a network structure with stronger electrostatic attractions and lower energy dissipation compared to the other clays. The ranking of clays based on G′ was as follows:
Ht-F > Stv ≈ Ht > Sap (in terms of G′, for dbranch < ~1 μm)
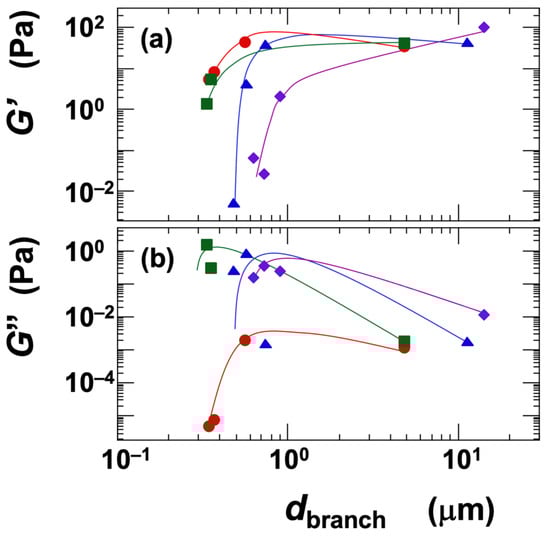
Figure 11.
Dependence of (a) storage modulus (G′) and (b) loss modulus (G″) on the skeleton diameter of smectite clay aqueous dispersions at 25 °C. Skeleton diameter data are taken from a previous study [6]. ϕ = 0.01. ●: Ht-F, ▲: Ht, ■: Stv, ◆: Sap.
The ranking of clays in terms of G′ was consistent with those for gelation domain size, viscosity (η), and yield stress (σy) with respect to Ht-F and Sap. It is reasonable that fine network structures, which are associated with a higher density of crosslinking points, result in larger G′ values. Interestingly, the ranking of Stv and Ht was reversed compared to other properties, which is noteworthy. When the crosslinking point density is assumed to be similar, the magnitude of the G′ may reflect the intrinsic shear modulus (G) of the network branches themselves. This intrinsic modulus is likely influenced by the number density of the clay platelets within the branches [52,53]. Therefore, Stv, which has smaller particle size, may exhibit a higher G′ than Ht. The loss modulus (G″) showed an approximately inverse relationship to G′ across clay types (Figure 11b). Ht-F had the lowest G″ and also exhibited a peak similar to that observed in σy, which aligns well with the interpretation of G″ as a measure of viscous dissipation.
As shown in Table 2, the macroscopic properties obtained in this study—including the absolute value of zeta potential (|ζ|), viscosity (η), yield stress (σy), and the extent of the gelation domain—strongly depended on the network structure formed by the clay particles. Adachi et al. [54] investigated the rheological properties of dilute sodium montmorillonite dispersions and reported that both η and σy were affected by the electric double layer, which is consistent with the findings of this study. At the same clay volume fraction, dispersions with smaller dbranch tended to exhibit higher crosslinking point densities and finer structures, which corresponded to greater macroscopic property values. For the G′, the results suggest an influence from the clay number density within the network branches, which reflects the structural rigidity associated with the particle size and layer charge density. While the zeta potential is affected by physicochemical properties such as particle size and CEC, it was also shown to be a unifying indicator of both network formation and macroscopic rheological response. These findings deepen the understanding of structure–function relationships in clay aqueous dispersions and provide useful guidelines for designing materials with controlled dispersion stability and gelation capability.
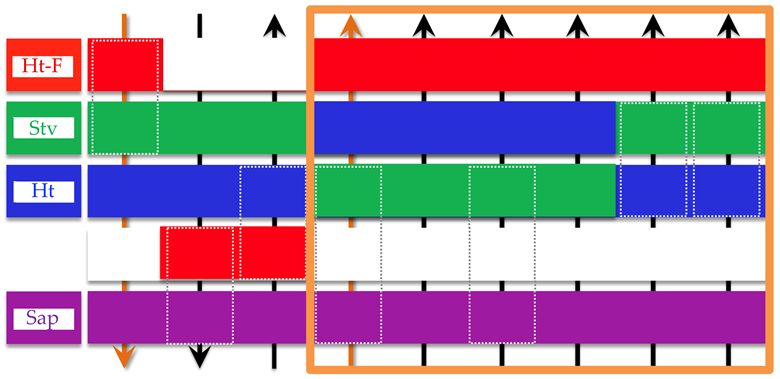
Table 2.
Ranking of various physicochemical and macroscopic rheological properties among the four smectite clay types. Upward or downward arrows indicate the relative magnitude of each indicator. Note, (*1) ϕ = 0.001, [NaCl] = 0; (*2) ϕ = 0.001, [NaCl] = 0.1 mol/L; (*3) ϕ = 0.01. The dashed line box indicates that the enclosed clay types have equivalent ranks.
4. Conclusions
In this study, we systematically investigated the effects of physicochemical properties—namely particle size, cation exchange capacity (CEC), and zeta potential—on the rheological behavior of aqueous dispersions of four smectite clays, including stevensite, under a unified experimental framework. By precisely controlling deionization and electrolyte concentration, we were able to tune the dispersion state and network structure, revealing correlations with various macroscopic properties such as sol–gel transition, viscosity, yield stress, storage modulus, and electrical conductivity. A unified interpretation of the differences in network structure density (as indicated by transparency) and gelation behavior among the different clay types was achieved using DLVO theory. Among these properties, the zeta potential was found to strongly reflect the fineness of the network structure and was closely related to the resulting macroscopic rheological parameters such as yield stress and elasticity. Smaller network branch diameters led to finer structures that favored gelation and pronounced elastic behavior. Furthermore, comparison among the clay types at the same network branch diameter revealed that local structural stiffness—influenced by factors such as particle size and layer charge density—also affected both storage modulus and yield stress. These results demonstrate that the zeta potential can serve as a key indicator of both network formation ability and rheological response in smectite clay dispersions. They also highlight the importance of physicochemical-property-based structural design in the functional control of aqueous dispersion systems.
Author Contributions
Conceptualization, H.K.; methodology, H.K.; validation, H.K.; investigation, H.K., H.T. and S.S.; resources, H.K., H.T. and S.S.; data curation, H.K.; writing—original draft preparation, H.K.; writing—review and editing, H.K.; visualization, H.K.; supervision, H.K.; project administration, H.K. All authors have read and agreed to the published version of the manuscript.
Funding
H.K. received research funding in the form of a donation from KUNIMINE INDUSTRIES Co., Ltd. H.T. and S.S. are employees of KUNIMINE INDUSTRIES Co., Ltd. These affiliations had no role in the design, execution, interpretation, or reporting of the study.
Data Availability Statement
The data are contained within the article.
Acknowledgments
The authors are grateful to T. Numata and S. Ikeno for their support in the conducting of the experiments. This research was partly supported by the Division of Instrumental Analysis, Life Science Research Center, Gifu University. This research did not receive any specific grant from funding agencies in the public, commercial, or nonprofit sectors.
Conflicts of Interest
Authors Haruka Tanabe and Susumu Shinoki were employed by the company KUNIMINE INDUSTRIES Co., Ltd. The remaining authors declare that the research was conducted in the absence of any commercial or financial relationships that could be construed as a potential conflict of interest.
References
- Van Olphen, H. An Introduction to Clay Colloid Chemistry, 2nd ed.; Wiley: New York, NY, USA, 1977. [Google Scholar]
- Freundlich, H. About thixotropy (Über Thixotropie). Kolloid-Z. 1928, 46, 289–299. (In German) [Google Scholar] [CrossRef]
- Mourchid, A.; Delville, A.; Levitz, P. Sol–gel transition of colloidal suspensions of anisotropic particles of laponite. Faraday Discuss. 1995, 101, 275–285. [Google Scholar] [CrossRef]
- Kroon, M.; Vos, W.L.; Wegdam, G.H. Structure and formation of a gel of colloidal discs. Phys. Rev. E 1998, 57, 1962–1970. [Google Scholar] [CrossRef]
- Larson, R.G.; Wei, Y. A review of thixotropy and its rheological modeling. J. Rheol. 2019, 63, 477–501. [Google Scholar] [CrossRef]
- Kimura, H. Deionization-induced colorless transparency in physical gels formed by clay aqueous dispersions. Appl. Clay Sci. 2024, 249, 107261. [Google Scholar] [CrossRef]
- Kleinfeld, E.R.; Ferguson, G.S. Stepwise formation of multilayered nanostructural films from macromolecular precursors. Science 1994, 265, 370–373. [Google Scholar] [CrossRef] [PubMed]
- Thompson, D.W.; Butterworth, J.T. The nature of Laponite and its aqueous dispersions. J. Colloid Interface Sci. 1992, 151, 236–243. [Google Scholar] [CrossRef]
- Wang, B.; Zhang, W.; Jin, X.; Su, G. A diffusion model for the swelling of compacted Na–montmorillonite in water. Appl. Clay Sci. 2021, 214, 106301. [Google Scholar] [CrossRef]
- Liu, X.; Lu, X.; Sprik, M.; Cheng, J.; Meijer, E.J.; Wang, R. Acidity of edge surface sites of montmorillonite and kaolinite. Clay Miner. 2011, 46, 209–228. [Google Scholar] [CrossRef]
- Tournassat, C.; Davis, J.A.; Chiaberge, C.; Grangeon, S.; Bourg, I.C. Modeling the acid–base properties of montmorillonite edge surfaces. Environ. Sci. Technol. 2016, 50, 13436–13445. [Google Scholar] [CrossRef]
- Gao, P.; Liu, X.; Guo, Z.; Tournassat, C. Acid–base properties of cis-vacant montmorillonite edge surfaces: A combined first-principles molecular dynamics and surface complexation modeling approach. Environ. Sci. Technol. 2023, 57, 1342–1352. [Google Scholar] [CrossRef] [PubMed]
- Dijkstra, M.; Hansen, J.-P.; Madden, P.A. Statistical model for the structure and gelation of smectite clay suspensions. Phys. Rev. E 1997, 55, 3044–3053. [Google Scholar] [CrossRef]
- Pignon, F.; Piau, J.M.; Magnin, A. Structure and pertinent length scale of a discotic clay gel. Phys. Rev. Lett. 1996, 76, 4857–4860. [Google Scholar] [CrossRef] [PubMed]
- Pignon, F.; Magnin, A.; Piau, J.M.; Cabane, B.; Lindner, P.; Diat, O. Yield stress thixotropic clay suspension: Investigations of structure by light, neutron, and X-ray scattering. Phys. Rev. E 1997, 56, 3281–3289. [Google Scholar] [CrossRef]
- Ramsey, J.D.F. Colloidal properties of synthetic hectorite clay dispersions: I. Rheology. J. Colloid Interface Sci. 1986, 109, 441–447. [Google Scholar] [CrossRef]
- Durán, J.D.G.; Ramos-Tejada, M.M.; Arroyo, F.J.; González-Caballero, F. Rheological and electrokinetic properties of sodium montmorillonite suspensions: I. Rheological properties and interparticle energy of interaction. J. Colloid Interface Sci. 2000, 229, 107–117. [Google Scholar] [CrossRef]
- Tombácz, E.; Szekeres, M. Colloidal behavior of aqueous montmorillonite suspensions: The specific role of pH in the presence of indifferent electrolytes. Appl. Clay Sci. 2004, 27, 75–94. [Google Scholar] [CrossRef]
- Ali, S.; Bandyopadhyay, R. Effect of electrolyte on the microstructure and yielding of aqueous dispersions of colloidal clay. Soft Matter 2015, 11, 5774–5782. [Google Scholar] [CrossRef]
- Lin, Y.; Qin, H.; Guo, J.; Chen, J. Rheology of bentonite dispersions: Role of ionic strength and solid content. Appl. Clay Sci. 2021, 214, 106275. [Google Scholar] [CrossRef]
- Schofield, R.K. Ionic forces in thick films of liquid between charged surfaces. Trans. Faraday Soc. 1946, 42, 219–228. [Google Scholar] [CrossRef]
- Kimura, H. Influence of sol–gel state in smectite aqueous dispersions on drying patterns of droplets. Materials 2024, 17, 2891. [Google Scholar] [CrossRef] [PubMed]
- Bonn, D.; Tanaka, H.; Wegdam, G.; Kellay, H.; Meunier, J. Aging of a colloidal “Wigner” glass. Europhys. Lett. 1998, 45, 52–57. [Google Scholar] [CrossRef]
- Mourchid, A.; Levitz, P. Long-term gelation of Laponite aqueous dispersions. Phys. Rev. E 1998, 57, R4887–R4890. [Google Scholar] [CrossRef]
- Cummins, H.Z. Liquid, glass, gel: The phases of colloidal Laponite. J. Non-Cryst. Solids 2007, 353, 3891–3905. [Google Scholar] [CrossRef]
- Abu-Jdayil, B. Rheology of sodium and calcium bentonite–water dispersions: Effect of electrolytes and aging time. Int. J. Miner. Process. 2011, 98, 208–213. [Google Scholar] [CrossRef]
- Au, P.-I.; Leong, Y.-K. Surface chemistry and rheology of Laponite dispersions: Zeta potential, yield stress, ageing, fractal dimension and pyrophosphate. Appl. Clay Sci. 2015, 107, 36–45. [Google Scholar]
- Leong, Y.K.; Clode, P.L. Time-dependent clay gels: Stepdown shear rate behavior, microstructure, ageing, and phase state ambiguity. Phys. Fluids 2023, 35, 123329. [Google Scholar] [CrossRef]
- Lin, Y.; Cheah, L.K.-J.; Phan-Thien, N.; Khoo, B.C. Effect of temperature on rheological behavior of kaolinite and bentonite suspensions. Colloids Surf. A 2016, 506, 1–5. [Google Scholar] [CrossRef]
- Robinson, R.A.; Stokes, R.H. Electrolyte Solutions, 2nd ed.; Butterworths: London, UK, 1959. [Google Scholar]
- Yamamoto, M. Derivation of Onsager’s equation for the electrical conductivity of strong electrolytes. Rev. Polarogr. 2022, 68, 47–50. (In Japanese) [Google Scholar]
- Atkins, P.W. Physical Chemistry, 5th ed.; Oxford University Press: Oxford, UK, 1994. [Google Scholar]
- Jiang, C.; Wang, Y.; Wang, D.; Zhang, G. Effects of inorganic and organic anions on the stability of illite and quartz soil colloids in Na-, Ca- and mixed Na–Ca systems. Colloids Surf. A Physicochem. Eng. Asp. 2012, 415, 134–141. [Google Scholar] [CrossRef]
- Luckham, P.F.; Rossi, S. The colloidal and rheological properties of bentonite suspensions. Adv. Colloid Interface Sci. 1999, 82, 43–92. [Google Scholar] [CrossRef]
- Mpofu, P.; Addai-Mensah, J.; Ralston, J. Interfacial chemistry, particle interactions and improved dewatering behaviour of smectite clay dispersions. Int. J. Miner. Process. 2005, 75, 155–174. [Google Scholar] [CrossRef]
- Chorom, M.; Rengasamy, P. Dispersion and zeta potential of pure clays as related to net particle charge under varying pH, electrolyte concentration and cation type. Eur. J. Soil Sci. 1995, 46, 657–665. [Google Scholar] [CrossRef]
- Marry, V.; Le Crom, S.; Ferrage, E.; Michot, L.; Farago, B.; Delville, A.; Dubois, E. Role of cationic organization on water dynamics in saponite clays. J. Phys. Chem. C 2024, 128, 4233–4244. [Google Scholar] [CrossRef]
- Yoonessi, M.; Toghiani, H.; Kingery, W.L.; Pittman, C.U., Jr. Preparation, characterization, and properties of exfoliated/delaminated organically modified clay/dicyclopentadiene resin nanocomposites. Macromolecules 2004, 37, 2511–2518. [Google Scholar] [CrossRef]
- Stöter, M.; Rosenfeldt, S.; Breu, J. Tunable exfoliation of synthetic clays. Annu. Rev. Mater. Res. 2015, 45, 129–151. [Google Scholar] [CrossRef]
- Jennings, B.R.; Parslow, K. Particle size measurement: The equivalent spherical diameter. Proc. R. Soc. Lond. Ser. A Math. Phys. Sci. 1988, 419, 137–149. [Google Scholar]
- Derjaguin, B.; Landau, L.D. Theory of the stability of strongly charged lyophobic sols and of the adhesion of strongly charged particles in solutions of electrolytes. Acta Physicochim. URSS 1941, 14, 633–662. [Google Scholar] [CrossRef]
- Verwey, E.J.W.; Overbeek, J.T.G. Theory of the Stability of Lyophobic Colloids; Elsevier: Amsterdam, The Netherlands, 1948. [Google Scholar]
- Hunter, R.J. Foundations of Colloid Science, 2nd ed.; Oxford University Press: New York, NY, USA, 2001. [Google Scholar]
- Israelachvili, J.N. Intermolecular and Surface Forces, 3rd ed.; Academic Press: London, UK, 2011. [Google Scholar]
- Kimura, H. Influence of alternating electric field on electrorheological effect of aqueous dispersions of stevensite. Appl. Clay Sci. 2024, 254, 107393. [Google Scholar] [CrossRef]
- Tadros, T. General principles of colloid stability and the role of surface forces. In Colloid Stability: The Role of Surface Forces; Wiley-VCH: Weinheim, Germany, 2011; pp. 1–45. [Google Scholar]
- Yoon, R.-H.; Kwon, T. The effect of non-DLVO forces on the stability of colloidal suspensions. Colloids Surf. A 1996, 114, 267–276. [Google Scholar]
- Barnes, H.A. The yield stress—A review or ‘panta roi’—Everything flows? J. Non-Newtonian Fluid Mech. 1999, 81, 133–178. [Google Scholar] [CrossRef]
- Sciortino, F.; Buldyrev, S.V.; De Michele, C.; Foffi, G.; Ghofraniha, N.; La Nave, E.; Moreno, A.; Mossa, S.; Saika-Voivod, I.; Tartaglia, P.; et al. Routes to colloidal gel formation. Comput. Phys. Commun. 2005, 169, 166–171. [Google Scholar] [CrossRef]
- Abend, S.; Lagaly, G. Sol–gel transitions of sodium montmorillonite dispersions. Appl. Clay Sci. 2000, 16, 201–227. [Google Scholar] [CrossRef]
- Armstrong, M.J.; Beris, A.N.; Rogers, S.A.; Wagner, N.J. Dynamic shear rheology of a thixotropic suspension: Comparison of an improved structure-based model with large amplitude oscillatory shear experiments. J. Rheol. 2016, 60, 433–450. [Google Scholar] [CrossRef]
- Trappe, V.; Weitz, D.A. Scaling of the viscoelasticity of weakly attractive particles. Phys. Rev. Lett. 2000, 85, 449–452. [Google Scholar] [CrossRef]
- Zaccarelli, E. Colloidal gels: Equilibrium and non-equilibrium routes. J. Phys. Condens. Matter 2007, 19, 323101. [Google Scholar] [CrossRef]
- Adachi, Y.; Tsujimoto Kawashima, Y.; Ghazali, M.E.B. Rheology and sedimentation of aqueous suspension of Na-montmorillonite in the very dilute domain. KONA Powder Part. J. 2020, 37, 145–165. [Google Scholar] [CrossRef]


Disclaimer/Publisher’s Note: The statements, opinions and data contained in all publications are solely those of the individual author(s) and contributor(s) and not of MDPI and/or the editor(s). MDPI and/or the editor(s) disclaim responsibility for any injury to people or property resulting from any ideas, methods, instructions or products referred to in the content. |
© 2025 by the authors. Licensee MDPI, Basel, Switzerland. This article is an open access article distributed under the terms and conditions of the Creative Commons Attribution (CC BY) license (https://creativecommons.org/licenses/by/4.0/).