Abstract
Sarcomyxa edulis is a characteristic edible and medicinal mushroom found in Northeast China that is highly valued by consumers for its tender texture, pleasant flavor, and high nutritional value. To gain a deeper understanding of the molecular mechanisms underlying the development of S. edulis fruiting bodies, this study utilized the Illumina NovaSeq platform to perform transcriptome sequencing at three growth and development stages of S. edulis strain SE8, namely primordia (SE8–P), fruiting body differentiation (SE8–F), and mature fruiting body (SE8–M). A total of 54.67 Gb of clean data was obtained, with a GC content of around 51%. After assembly, 36,423 Unigenes were obtained. Functional annotation was performed on the Unigenes, resulting in 21,206 Unigene annotation results. Differential expression gene analysis showed that 79,606 and 523 DEGs were annotated in at least one database during the SE8–P vs. SE8–F, SE8–F vs. SE8–M, and SE8–P vs. SE8–M processes, respectively. Among these, the genes encoding aldehyde dehydrogenase and fungal hydrophobins were consistently downregulated, playing a negative regulatory role in the growth and development of S. edulis. The genes encoding glycoside hydrolase and AB hydrolase superfamily proteins were consistently upregulated, playing a positive regulatory role in growth and development. Among these, the genes encoding aldehyde dehydrogenase were annotated to the Tryptophan metabolism (ko00380) pathway through KEGG, suggesting that aldehyde dehydrogenase regulates indoacetate formation in the fruiting body of S. edulis. The accuracy of RNA–Seq and DEG analysis was validated using quantitative PCR. This study enriches our knowledge of the genetic information and provides a theoretical basis for the molecular mechanisms of fruiting body development of S. edulis.
1. Introduction
Sarcomyxa edulis are widely distributed in the Northern Hemisphere, especially in the forests of Northeast China, where they are most abundant [1]. Their fruiting bodies are fleshy and delicious, with extremely high nutritional and medicinal value [2,3,4]. Currently, a lot of work has been carried out in the breeding of excellent S. edulis strains [5,6,7,8] and genetic mechanism research [9,10,11].
The fruiting body is the main edible part of S. edulis and an important structure for growth and development. Its developmental regulation mechanisms have important research value. Currently, there is relatively little research on the formation mechanisms of fruiting bodies in S. edulis, and only Duan [12] has conducted a systematic analysis of different growth and development stages. The development of fruiting bodies is an extremely complex process, which is regulated not only by environmental factors but also by genetic factors [13]. Although growth and development mechanisms have been studied in various fungi, their molecular mechanisms are still not fully understood. However, through the unremitting efforts of researchers in various countries, a large number of functional genes related to fruiting body development have been discovered and identified [14]. Pelkmans [15] found in a study on Schizophyllum commune that Bri1 and Hom1 play a role in the later stages of development, while Wc–2, Hom2, and Fst4 play a role in the early stages of development. Ohm [16] also found that, in S. commune, seven genes, including hom1, hom2, c2h2, gat1, bri1, fst3, and fst4, play a role in the development of primordia and fruiting bodies. Boulianne [17] found that cgl1 and cgl2 genes regulate the formation of fruiting bodies during the development of Coprinus cinereus. cgl2 was expressed during hyphal formation, while cgl1 was expressed during primordia and subsequent development. Wagemaker [18] found that hydrophobic protein genes, urease genes, and mannitol dehydrogenase genes were involved in the formation process of Agaricus bisporus fruiting bodies at different developmental stages. Meanwhile, Wu [19] discovered various amino acid synthases, transcription factors, GTP-binding proteins, etc., in A. bisporus, which were key genes related to fruiting body development. In addition, Almási [20] and Krizsán [21] found that heat shock proteins, small secreted proteins, kinases, F-Box proteins, and genes related to cell wall remodeling may be involved in the development of fruiting bodies in other basidiomycetes. Pei [22] discovered and identified a gene, g13394, in Pleurotus ostreatus that can promote hyphal growth and accelerate fruiting body development.
S. edulis, as a characteristic low-temperature edible and medicinal mushroom found in Northeast China, has great development prospects. Our team has been engaged in genetic breeding and cultivation research. We have collected and evaluated the germplasm resources of S. edulis, optimized cultivation formulas and techniques, analyzed the biological characteristics of core germplasm, optimized the SRAP–PCR reaction system, and obtained and analyzed the whole genome sequence (to be published). On this basis, this study performed transcriptome sequencing on samples from three growth and development stages: primordia (SE8–P), fruiting body differentiation (SE8–F), and mature fruiting body (SE8–M). The transcriptome sequence of the S. edulis strain was obtained using Illumina NovaSeq platform technology. By comparing different growth and development stages, DEGs were obtained and enriched for analysis to screen genes and metabolic pathways that may be involved in the growth and development of S. edulis. The discovery of these genes and metabolic pathways can not only improve and enrich the transcriptome data of S. edulis but also provide some assistance for the study of the growth and development mechanism of S. edulis and other edible mushrooms and provide a theoretical basis for genetic breeding research of edible mushrooms.
2. Materials and Methods
2.1. Strain and Collection of Samples at Different Developmental Stages
The strain used for transcriptome sequencing of S. edulis was SE8, characterized by a yellow–brown cap. It was collected from Baishan City, Jilin Province, and preserved at Jilin Agricultural Science and Technology College. The strain was inoculated into a sawdust culture medium (sawdust 78%, wheat bran 20%, lime 1%, gypsum 1%, pH 6.0), with 250 g of dry material per bag, cultivation temperature of 15 °C, humidity of 90%, and natural light. Samples were collected during the three stages of primordia (the 5th day of fruiting), fruiting body differentiation (the 10th day of fruiting), and mature fruiting body (the 15th day of fruiting) (Figure 1), with three biological replicates per stage. The samples were mixed evenly according to the same location and stored in a −80 °C freezer for transcriptome sequencing.
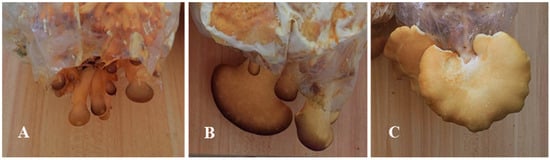
Figure 1.
Development stage of S. edulis strain SE8. (A): Primordia (SE8–P). (B) Fruiting body differentiation (SE8–F). (C) Mature fruiting body (SE8–M).
2.2. RNA Isolation, Library Construction, and Sequencing
To summarize the gene expression profile of S. edulis at three developmental stages, cDNA samples were prepared from the primordia (SE8–P), fruiting body differentiation (SE8–F), and mature fruiting body (SE8–M). The libraries were sequenced on an Illumina NovaSeq platform to generate 150 bp paired-end reads, according to the manufacturer’s instructions. Total RNA was extracted from the sample using a Tiangen DP441 assay kit (Tiangen Biotechnology, Beijing, China). Nanodrop 2000 (Thermo Fisher Scientific, Wilmington, DE, USA) and Agilent 2100 (Agilent Technologies, Santa Clara, CA, USA) were used to detect the concentration and integrity of extracted RNA. Each stage was sampled in triplicate, resulting in a total of 9 libraries. The raw data has been submitted to NCBI with the login number PRJNA1267801.
2.3. Analysis of Differentially Expressed Genes (DGEs)
Using Trinity software (2.14.0) [23], clean data were assembled into sequences to obtain the Unigene library of S. edulis and obtain transcriptome data. DIAMOND (v2.0.4) [24] software was used to combine the Unigene sequence with Swiss–Prot [25], NR [26], COG [27], KOG, GO [28], eggNOG4.5 [29], and KEGG [30,31] to compare with the database to obtain annotation information for Unigene. Using Bowtie [32], the reads obtained from sequencing were compared with the Unigene library. Based on the comparison results, RSEM (v1.2.19) was used to estimate the expression level, and FPKM values were used to represent the expression abundance of corresponding Unigenes [33]. Differential analysis was performed using DESeq2 software (1.30.1), and the screening criteria for differential genes were FDR < 0.01 and |log2 FC| ≥ 2. Functional annotation of DEGs in the database was performed using the database [34].
2.4. Validation of DEGs by qRT–PCR
Primer validation was a good practice for confirming the efficiency of qRT–PCR primers. To ensure the accuracy of RNA–Seq data, six representative DEGs were selected for qRT–PCR. The RNA used for qRT–PCR validation was the same RNA aliquots used for transcriptome sequencing. The FPKM values of these genes were available and showed significant changes in the transcriptional expression data of 9 samples. According to RNA seq data, the expression of the Actin gene was stable at three developmental stages and was therefore used as an internal reference gene (Table S1). Primer v5.0 was also used to design specific primers for internal reference genes and DEGs (Table S2). RNA extraction was performed using the RNAprep Pure polysaccharide polyphenol plant total RNA extraction kit (DP441) manufactured by Tengen (Wenzhou, China), and PrimeScript provided by Takara was used. The RT reagent kit with gDNA Eraser (Perfect Real Time) synthesis kit was used to synthesize cDNA. Specific primer pairs were obtained from transcriptome data and subsequently used for qRT–PCR. qRT–PCR was performed using the C1000 real-time PCR detection system (Bio–Rad, Hercules, CA, USA) in triplicate. The reaction mixture consisted of 10 μL, which included 5 μL of 1 × ChamQ Blue Universal SYBR qPCR Master Mix (Novozymes, Bagsværd, Denmark), 3 μL of diluted cDNA, and 1 μL of specific forward and reverse primers each. The 2 −ΔΔCt method was used to analyze gene expression data [35].
3. Results
3.1. Global Transcriptomic Analysis
Transcriptome sequencing was performed on nine samples from three distinct growth and development stages of S. edulis strains, yielding a total of 54.67 Gb of clean data. The clean data for each sample reached 5.91 Gb, with a GC content of approximately 51% and a Q30 base percentage of 95.22% or higher. The data indicators performed well, providing a reliable data basis for subsequent analysis (Table S3). Following assembly, a total of 36,423 Unigenes were obtained, with an N50 of 2335. Of these, 8986 Unigenes were longer than 1 kb (Figure 2a). Functional annotation of the Unigene sequences was conducted, resulting in 21,206 annotated Unigenes. Among these, 3277 genes were shared across annotations, with the distribution of genes in each annotation category illustrated in the petals (Table 1, Figure 2b)
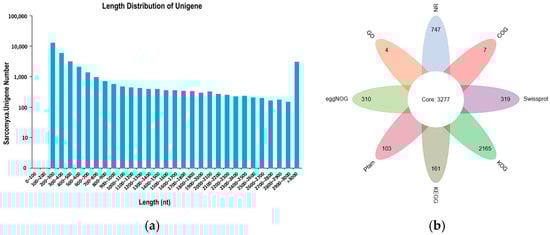
Figure 2.
Transcriptomic analysis of SE8. (a) Unigene length distribution map. The horizontal axis represents the different length intervals of Unigene; the vertical axis represents the number of Unigenes within a certain length interval. (b) Unigene annotation petal diagram.

Table 1.
Unigene annotation statistics table.
3.2. Gene Expression Level Analysis
The analysis of gene expression levels showed that the density of the nine samples was relatively concentrated, with log10 (FPKM) values ranging from −1.09 to 3.17 (Figure 3a). Principal component analysis and Spearman correlation coefficient rho analysis showed good sample repeatability, significant inter-group differences among samples at different developmental stages, and clear clustering among samples at the same developmental stage. These results demonstrate the stability and reliability of the test data. A stable data foundation for subsequent differential gene screening and enrichment analysis is provided (Figure 3b,c, Table S4).
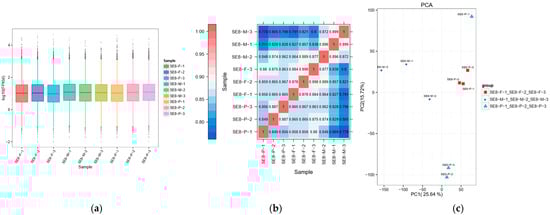
Figure 3.
Gene expression level analysis of SE8. (a) Box plot of gene expression level distribution (FPKM) in different samples. The horizontal axis in the figure represents different samples; the vertical axis represents the logarithmic value of the sample expression level FPKM. This graph measures the expression levels of each sample from the perspective of the overall dispersion of expression levels. The vertical axis of the point represents the probability density. The peak of the distribution curve represents the region with the highest concentration of gene expression in the entire sample. (b) Correlation heatmap of different sample types. The horizontal and vertical axes in the figure are sample numbers, and the colors reflect the correlation between the samples. The corresponding relationship is shown in the legend on the left. (c) Principal Component Analysis Diagram. The coordinates PC1 and PC2 in the figure represent the principal components of different samples, and percentages represent the contribution values of corresponding principal components to sample differences. Each point represents a sample, and samples from different groups were represented by different colors and shapes.
3.3. Identification of DEGs Across Various Developmental Stages
This study identified DEGs in the SE8 strain at three stages: primordia (SE8–P), fruiting body differentiation (SE8–F), and mature fruiting body (SE8–M). There were 87 DEGs between SE8–P and SE8–F, with 44 genes upregulated and 43 genes downregulated. There were 715 DEGs between SE8–F and SE8–M, with 532 genes upregulated and 183 genes downregulated. There were 636 DEGs between SE8–P and SE8–M, with 444 genes upregulated and 192 genes downregulated (Figure 4a). To visually demonstrate the overlap of DEGs between different comparison groups, this study conducted a Venn diagram analysis on the DEGs of different comparison combinations. Among them, there were 6 common genes, 28 unique DEGs in SE8–P vs. SE8–F, 298 unique DEGs in SE8–F vs. SE8–M, and 198 unique DEGs in SE8–P vs. SE8–M (Table 2, Figure 4b).
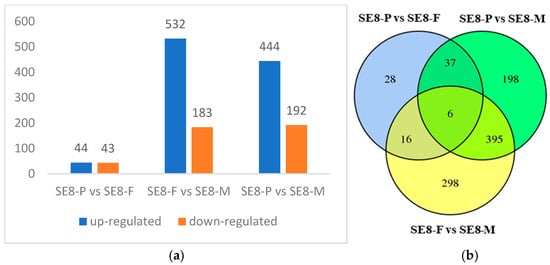
Figure 4.
Differentially expressed genes of SE8. (a) Statistics of differentially expressed genes. (b) Venn diagram of a differentially expressed gene.
Table 2.
Information on differentially expressed genes in three stages.
3.4. KOG Functional Classification of DEGs
This study performed KOG functional annotation on DEGs from the SE8 strain at various developmental stages. General function predictions only were made according to KOG annotations, post-translational modification, protein turnover, chaperones, energy production and conversion, coenzyme transport and metabolism, lipid transport and metabolism, secondary metabolite biosynthesis, transport, and catabolism. There was a high enrichment in the three stages of SE8–P vs. SE8–F, SE8–F vs. SE8–M, and SE8–P vs. SE8–M, which were mainly related to the synthesis, transportation, and metabolism of organic matter (Figure 5).
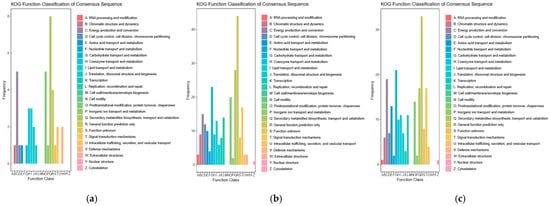
Figure 5.
Statistical chart of KOG annotation classification for DEGs. (a) SE8–P vs. SE8–F, (b) SE8–F vs. SE8–M, (c) SE8–P vs. SE8–M.
3.5. GO Annotation Analysis of DEGs
The GO annotation includes three categories: Molecular Function (MF), Cellular Component (CC), and Biological Process (BP). The GO analysis during the growth process of the S. edulis strain is shown in Figure 6, and the results indicate that DEGs were involved in various biologically significant processes. In the comparison of SE8–P vs. SE8–F, SE8–F vs. SE8–M, and SE8–P vs. SE8–M, the significantly enriched terms were almost the same. The differential gene numbers enriched in the metabolic process and cellular process in BP, cellular anatomical entity and intracellular in CC, and catalytic activity and binding entries in MF were significantly higher than those in the other entries.
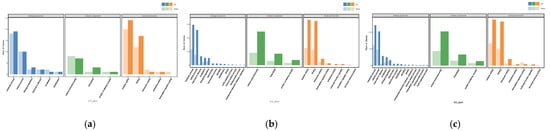
Figure 6.
GO annotation of DEGs. (a) SE8–P vs. SE8–F, (b) SE8–F vs. SE8–M, (c) SE8–P vs. SE8–M.
During the differentiation stage of primordia and fruiting bodies (SE8–P vs. SE8–F), 60 DEGs were annotated, of which 29 genes were upregulated and 31 genes were downregulated. These DEGs were distributed among 34 BP, 7 CC, and 54 MF components. The enriched BP terms include Sphingomyelin catabolic process, Polyphosphate metabolic process, plasma membrane selenite transport, Cyanamide metabolic process, Carnitine biosynthetic process, and Nitrile metabolic process. This was related to the decomposition, synthesis, and metabolism of compounds. The enriched CC terms include Integral component of plasma membrane, Integral component of membrane, Host cell nucleus, Nucleus, and Cytoplasm. This was related to the formation of the nucleus, cytoplasm, and membrane. The enriched MF terms include Oxidoreductase activity, Monooxygenase activity, Heme binding, and Iron ion binding, this was related to oxidative stress response and reactant binding.
During the differentiation and maturation stages of the fruiting body (SE8–F vs. SE8–M), 425 DEGs were annotated, with 312 genes upregulated and 113 genes downregulated. These DEGs were distributed among 741 BP, 122 CC, and 260 MF components. The enriched BP terms include Vitamin biosynthetic process, Water-soluble vitamin metabolic process, Regulation of protein serine/threonine kinase activity, and Phospholipid catabolic process. This was related to vitamin biosynthesis and metabolism, as well as amino acid kinase activity. The enriched CC terms include Integral component of membrane, Nucleosome, Host cell nucleus, Extracellular space, and Cyclin-dependent protein kinase holoenzyme complex. This was related to the formation of the cell nucleus, membrane, and protein kinase complexes. Enriched MF is a term that includes Oxidoreductase activity, 5′–flap endonuclease activity, FAD binding, Carboxy–lyase activity, Zinc ion binding, monooxygenase activity, and Iron ion binding. This was related to oxidative stress response and reactant binding.
In total, 372 DEGs were annotated during the maturation stages of primordia and fruiting bodies (SE8–P vs. SE8–M), with 252 genes upregulated and 120 genes downregulated. These DEGs were distributed among 712 BP, 112 CC, and 240 MF components. The enriched BP terms include Vitamin biosynthetic process, Water-soluble vitamin biosynthetic process, Vitamin metabolic process, Xenobiotic metabolic process, Response to xenobiotic stimulus, and Nitrile metabolic process. This was related to compound metabolism, vitamin biosynthesis metabolism, and stress response. The enriched CC terms include Protein kinase complex, Cyclin-dependent protein kinase holoenzyme complex, Serine/threonine protein kinase complex, Host cell nucleus, and Incipient cellular bud site; this was related to protein kinase complexes and cell formation. The enriched MF terms include Cyanamide hydratase activity, Monooxygenase activity, Iron ion binding, Peroxidase activity, Oxidoreductase activity, and Glucan 1,4–alpha–glucosidase activity. This was related to oxidative stress response and reactant binding (Figure 6).
3.6. KEGG Annotation Analysis of DEGs
In order to further elucidate the biological pathways associated with DEGs, the top 20 enriched pathways were selected for KEGG enrichment analysis of DEGs in the three stages (Figure 7); 53 DEGs were annotated between SE8–P and SE8–F, and these DEGs were annotated into 29 KEGG entries. The most significantly enriched pathways included Tryptophan metabolism, Histidine metabolism, Lysine degradation, Riboflavin metabolism, Ascorbate and aldarate metabolism, Pyruvate metabolism, Fatty acid degradation, and beta–Alanine metabolism. These enriched pathways indicate that during the process from the primordium to the cap formation stage, the formation of the cap may be promoted by regulating amino acid metabolism activity. A total of 330 DEGs were annotated between SE8–F and SE8–M, and these DEGs were annotated into 88 KEGG entries. The most significantly enriched pathways included Riboflavin metabolism, Tryptophan metabolism, Lysine degradation, Pyruvate metabolism, Pentose and glucuronate interconversions, Starch and sucrose metabolism, Biotin metabolism, and Propanoate metabolism. The enrichment of these pathways suggests that during the formation of fruiting bodies, cells may accumulate substances and promote fruiting body maturation by participating in the synthesis of carbohydrate compounds and various amino acid metabolism activities. A total of 288 DEGs were annotated between SE8–P and SE8–M, and these DEGs were annotated into 87 KEGG entries. The most significantly enriched pathways included Riboflavin metabolism, Lysine degradation, Tryptophan metabolism, Fatty acid degradation, Pyruvate metabolism, beta–Alanine metabolism, Starch and sucrose metabolism, and Pantothenate and CoA biosynthesis. The enrichment of these pathways indicates that during the formation stage of fruiting bodies, substance accumulation and fruiting body maturation can be promoted by coordinating the synthesis and metabolism of various secondary metabolites, carbohydrate compounds, amino acid biosynthesis, and degradation.
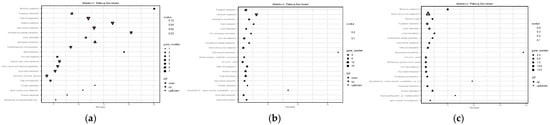
Figure 7.
Classification of differentially expressed genes KEGG. (a) SE8–P vs. SE8–F, (b) SE8–F vs. SE8–M, (c) SE8–P vs. SE8–M.
This study conducted KEGG enrichment analysis on three stages: primordia (SE8–P vs. SE8–F), mature fruiting body (SE8–F vs. SE8–M), and primordia towards mature fruiting body (SE8–P vs. SE8–M). The statistical results showed that a total of 28 pathways were enriched in all three stages (Table 3). Among them, Tryptophan metabolism (ko00380), Starch and sucrose metabolism (ko00500), Carbon metabolism (ko01200), Riboflavin metabolism (ko00740), Lysine degradation (ko00310), Pyruvate metabolism (ko00620), and Glycerolipid metabolism (ko00561), which were eight pathways related to substance metabolism and degradation, have a relatively large number of enriched genes, with upregulation and downregulation of DEGs in each stage. In Pantothenate and CoA biosynthesis (ko00770), DEGs showed a downregulation trend in all three stages, while in Atrazine degradation (ko00791), DEGs showed an upregulation trend in all three stages. In addition, Basal transcription factors (ko03022), Ubiquitin-mediated proteolysis (ko04120), Ribosome (ko03010), and Phosphatidylinositol signaling system (ko04070) were the four pathways that only appeared in the SE8–F vs. SE8–M stage. Selenocompound metabolism (ko00450) and Mitophagy yeast (ko04139) pathways only appear in the SE8–P vs. SE8–M stage.
Table 3.
Statistical analysis of common pathways in the three developmental stages of SE8.
3.7. Tryptophan Metabolism
KEGG enrichment analysis showed that Tryptophan metabolism (ko00380) contained the highest number of DEGs across the three developmental stages, with more genes downregulated than upregulated during growth and development (Table S5, Figure 8). During primordia-to-fruiting body differentiation (SE8–P vs. SE8–F), a total of seven DEGs were detected, including two upregulated genes, mainly encoding cytochrome P450 monooxygenases, and five downregulated genes, primarily encoding tryptamine 4–monooxygenase, NADPH–cytochrome P450 reductase, and aldehyde dehydrogenases. In the transition from fruiting body differentiation to the mature fruiting body (SE8–F vs. SE8–M), 16 DEGs were identified, with 6 upregulated genes, mainly encoding acetamidase, MFS-type transporter OryC, FAD-linked oxidoreductase, L–tyrosine:2–oxoglutarate aminotransferase (Amt1), and cytochrome P450 monooxygenases, while 10 downregulated genes mainly encoded multifunctional cytochrome P450 monooxygenases, cytochrome P450 monooxygenases, aldehyde dehydrogenases, aspirochlorine biosynthesis protein N, tryptamine 4–monooxygenase, and β–apo–4′–carotenal oxidase. During the primordia-to-mature fruiting body transition (SE8–P vs. SE8–M), 12 DEGs were detected, including 5 upregulated genes, mainly encoding cytochrome P450 monooxygenases, MFS-type transporter OryC, and cyanide hydratase, and seven downregulated genes, primarily encoding cytochrome P450 monooxygenases, bifunctional cytochromes, tryptamine 4–monooxygenase, aldehyde dehydrogenases, and aspirochlorine biosynthesis protein N. According to Table 4 and Figure 8, it can be seen that in Tryptophan metabolism, aldehyde dehydrogenase coordinates with Aldehyde oxidase to convert 5–hydroxyindoleacetate to 5–hydroxyindoleacetate, and it coordinates with indole–3–acetaldehyde oxidase to convert Indole3–acetaldehyde to Indooleacetate. In this study, the gene encoding aldehyde dehydrogenase showed a downregulation trend with the growth and development of the fruiting body of the S. edulis, and the two were negatively correlated. It was preliminarily inferred that aldehyde dehydrogenase plays a negative regulatory role in the growth of the S. edulis. Related studies have shown that indoacetate was involved in regulating cell division and elongation in different parts of the fruiting body, affecting the length, thickness, and normal expansion and size of the stem cap. Its mechanism of action was similar to that of promoting stem node elongation in plants [36,37,38].
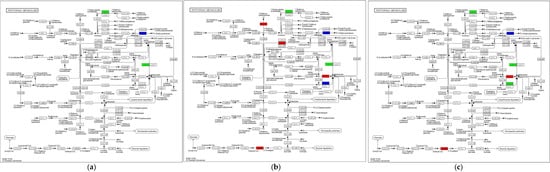
Figure 8.
The DEGs in SE8–P vs. SE8–F, SE8–F vs. SE8–M, and SE8–P vs. SE8–M were mapped to Tryptophan metabolism (ko00380). The red represents upregulation, the green represents downregulation, and the purple represents upregulation and downregulation. (a) SE8–P vs. SE8–F, (b) SE8–F vs. SE8–M, (c) SE8–P vs. SE8–M.
Table 4.
Genes and proteins are potentially critical for the growth and development of S. edulis.
3.8. qRT–PCR Validation of DEGs at Different Growth and Development Stages
In order to confirm the transcriptome data, this study screened six highly expressed genes for qRT–PCR to examine the expression patterns of genes related to the growth and development of S. edulis. The qRT–PCR results were consistent with the RNA–Seq results, demonstrating the reliability of the RNA–Seq data through the consistency between the two methods (Figure 9). The TRINITYDN1480uc1_g1 gene was a common gene among the three growth and development stages and shows significant expression. According to the annotation library, the gene mainly encodes aldehyde dehydrogenase, which shows a decreasing trend in FPKM value during the three growth and development processes of S. edulis.
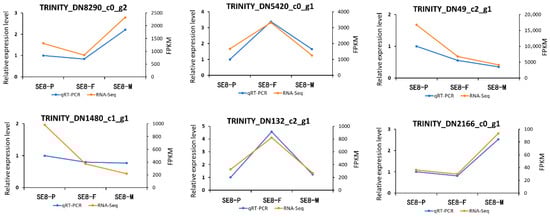
Figure 9.
Verifies the expression profile of genes related to the growth and development of S. edulis through qRT–PCR analysis.
3.9. Genes and Proteins Potentially Critical for Growth and Development of S. edulis
The analysis of DEGs during the growth and development of S. edulis (Table 4) showed that, compared with the fruiting body formation stage (SE8–P vs. SE8–F), the gene encoding AB hydrolase superfamily protein was upregulated in the primordium stage, while the gene encoding aldehyde dehydrogenase family was downregulated. Compared with the mature stage of the fruiting body (SE8–F vs. SE8–M), the genes encoding AB hydrolase superfamily protein, aldehyde dehydrogenase family, and Thaumatin family were downregulated during the formation stage of the fruiting body, while the genes encoding glycoside hydrolase family, Aldo/keto reductase family, and Eukaryotic aspartyl protease were upregulated. Upregulation of the Amidohydrolase gene was also noted. In the DEGs between the primordium stage and the fruiting body maturation stage (SE8–P vs. SE8–M), the genes encoding the glycoside hydrolase family were upregulated, while the genes encoding the fungal hydrophobin were downregulated. These proteins can promote the growth and development of S. edulis [39].
4. Discussion
4.1. Comparative Analysis of the Transcriptome of Edible Fungi
Transcriptome sequencing technology can comprehensively and quickly obtain mRNA sequence information transcribed by specific tissues or organs of a species in a certain state and study gene expression levels and structures at the overall level, revealing molecular mechanisms in specific biological processes. Non-parametric transcriptome sequencing technology has the characteristics of high throughput, high resolution, wide applicability, high sensitivity, and quantitative dynamics and was the foundation and starting point for gene function and structure research. In recent years, with the popularization of high-throughput sequencing technology, transcriptome research on edible fungi has shifted from single-species functional annotation to cross-species comparative analysis. At present, relevant research has been conducted on typical edible mushrooms such as Auricularia auricula, Ganoderma lucidum, Hericium erinaceus, Dictyophora indusiata, Lentinula edodes, Pleurotus ostreatus, and Flammulina velutipes. The main research focuses on the gene expression differences in the growth and development, environmental adaptation, secondary metabolism, and morphogenesis of edible fungi under different developmental stages, strains, and environmental stresses [40,41]. These findings provide valuable insights into the evolutionary strategies and functional differentiation of edible fungi. Wen [42] conducted multi-omics sequencing on D. indusiata balls and mature D. indusiata, and the results showed that the key to the morphological development of D. indusiata balls after harvesting was stem elongation, with the fastest elongation rate in the middle of the stem. Fu [43] conducted comparative transcriptomic analysis on the mycelium, primordia, and fruiting bodies of Pleurotus Nebrodensi, identifying DEGs involved in morphogenesis, primary carbohydrate metabolism, cold stimulation, and blue light response. Tang [44] conducted transcriptomic studies on three treatments of L. edodes hyphae (light avoidance culture for 30 days, light avoidance culture for 80 days, and light avoidance for 30 days plus 50 days), revealing the molecular mechanism of light-induced L. edodes color transformation. It was found that photosensitive genes, light signal transduction pathways, and pigment-forming genes were involved in L. edodes color transformation. Wang [45] identified a total of 8495 Unigenes, 4047 proteins, and 30 metabolites in the de novo sequencing analysis of Morchella importuna. These results provide a basis for understanding the taste formation, texture regulation, and color changes in fruiting bodies. Wang [46] subjected the hyphae, primordia, fruiting bodies, and spores of P. ostreatus to high-temperature stress, H2O2 stress, NaCl stress, and pH stress to detect the expression levels of peroxidase (CAT). The results showed that CAT responded most significantly to high-temperature stress; however, the response mechanisms of different CAT to high temperatures were different. Zhang [47] found through transcriptome KEGG enrichment analysis of the growth and development stages of Hypsizygus marmoreus fruiting bodies that the color transition stage was associated with MAPK, cAMP, and blue light signaling pathways. Light affects the expression of genes related to the initiation of H. marmoreus fruiting bodies, and nitrogen stress may enhance fruiting body maturation. Zhou [48] analyzed the DEGs between the hyphae and fruiting bodies of Auricularia polytricha and found that tyrosinase had the highest expression level in the fruiting bodies, which may be an important regulatory gene in pigment synthesis in A. polytricha fruiting bodies. Ma [49,50] analyzed the pigment synthesis pathway of Auricularia cornea through multiple omics studies and identified the main pigments (γ–glutamyl–3,4–dihydroxybenzoate), major intermediates (α–D–glucose–1P, citrate, 2–oxogluconate, and glutamate), and key enzymes, such as phenoloxidase, in the fruiting body of A. cornea. Li [51] used corn cob and tobacco straw as two different substrates to cultivate P. ostreatus. Based on this, the DEGs and metabolic pathways of P. ostreatus at different developmental stages were analyzed. The results revealed the transcriptome adaptation of P. ostreatus to tobacco straw and provided new insights for the molecular mechanism of biomass conversion by edible bacteria using straw. Duan [12] studied S. edulis mycelium growing to a half bag (B1), mycelium in cold stimulation after a full bag (B2), mycelium in primordia appearing (B3) and primordia (B4), mycelium at the harvest stage (B5), and mature fruiting body (B6). They performed transcriptome sequencing for the six growth and development stages of S. edulis to screen for genes related to lignin degradation. The materials used in this study were S. edulis strains collected from the field, and transcriptome sequencing was performed by sampling tissues from three typical stages: primordia (SE8–P), fruiting body differentiation (SE8–F), and mature fruiting body (SE8–M). The results of this study showed significant differences in DEGs among different tissue types, especially in the SE8–F vs. SE8–M stage, where the number of DEGs was significantly higher than in the SE8–P vs. SE8–F stage and SE8–P vs. SE8–M stage. GO and KEGG enrichment analysis of DEGs between different tissue types showed the same functional distribution trend of DEGs (Figure 5, Figure 6 and Figure 7), confirming that mature fruiting bodies were the main gene expression tissues in the formation process. This study preliminarily speculated that the genes encoding aldehyde dehydrogenase and fungal hydrophobin play a negative regulatory role in the growth and development of S. edulis through GEG screening and KEGG enrichment analysis between different growth and development stages. Related studies have shown that the aldehyde dehydrogenase gene was an important gene discovered in recent years that can regulate plant branching (tillering). It metabolizes endogenous and exogenous aliphatic and aromatic aldehyde molecules into corresponding carboxylic acids [52,53]. Fungal hydrophobin was crucial for the formation of fungal aerial hyphae, but it has a negative regulatory effect on the development of fruiting bodies [54,55], which was consistent with the results of this study. The genes encoding glycoside hydrolase and AB hydrolase superfamily proteins play a positive regulatory role. Related studies have shown that the GH16 family contains multiple glycoside hydrolases, and its members have activity towards various glycosidic bonds of pectin; these hydrolases play a role in the degradation of lignocellulose [56]. The AB hydrolase superfamily protein assists in disrupting the structure of plant cell walls, creating conditions for glycoside hydrolase to degrade cellulose and hemicellulose, allowing hyphae to absorb and utilize nutrients and promote the growth and development of fruiting bodies. Although both this study and Duan’s [12] used S. edulis strains, there were differences in the source of the strains and the transcriptome sequencing techniques used, as well as different research purposes, resulting in certain differences in the research results. This also provides a data reference for the genetic diversity analysis of S. edulis and enriches its genetic information.
4.2. Signal Pathways Involved in the Development of Fruiting Bodies in S. edulis
The development of fruiting bodies was one of the most critical stages in the life cycle of edible fungi, involving complex metabolic regulatory networks. This process was regulated by multiple metabolic pathways, including various carbohydrate metabolism, signal transduction, synthesis of secondary metabolites, and cell wall remodeling. During the developmental stage of the fruiting body, a large amount of carbon sources and energy was required, among which glycolysis and the tricarboxylic acid cycle were core energy metabolism pathways [57,58]. The genes encoding hexokinase [59], phosphofructokinase (PFK) [60], and trehalose–6–phosphate synthase (TPS) [61] were crucial for hyphal development and fruiting body formation. In addition, the development of fruiting bodies was also regulated by environmental signals (such as light and temperature) and intracellular signaling pathways, including cAMP and MAPK [62]. In Agaricus bisporus, MAPK signaling promotes the aggregation of fungal filaments into primordia by inhibiting hyphal branching-related genes. In A. bisporus, MAPK signaling promotes the aggregation of fungal filaments into primordia by inhibiting hyphal branching-related genes [63]. During the development of fruiting bodies, a large number of secondary metabolites were synthesized, including terpenes [64,65,66], polyphenols [67], and sterols [68], which can promote cap differentiation and may also affect spore release. The morphological construction of sub-entities relies on the dynamic remodeling of cell wall polysaccharides. Chitin synthase (CHS) and β–β–glucan synthase (FKS) genes promote the formation of the cell wall cytoskeleton [69]. Lignin-degrading enzymes (such as laccase and manganese peroxidase MnP) enhance the mechanical strength of organelles by modifying the cross-linked structure of cell walls [70]. In this study, a total of 28 pathways appeared in all three stages of S. edulis growth and development. The pathways with more enriched genes were mostly related to substance metabolism and degradation, including tryptophan metabolism, starch and sucrose metabolism, carbon metabolism, riboflavin metabolism, lysine degradation, pyruvate metabolism, glycerolipid metabolism, and glycolysis/gluconeogenesis. In addition, the Pantothenate and CoA biosynthesis pathways showed a downregulation trend of DEGs in all three growth and development stages, while the Atrazine degradation pathway showed an upregulation trend of DEGs in all three growth and development stages. The discovery of these pathways provides a valuable reference for research on the development of S. edulis fruiting bodies. At present, although relevant pathways have been discovered, further analysis of the genes and metabolites related to the pathways has not been carried out. Further in-depth analysis should be conducted in combination with metabolomics and proteomics.
4.3. The Role of Tryptophan in Edible Fungi
Tryptophan was a precursor of bioactive substances such as niacin, serotonin, melatonin, etc. It not only participates in the synthesis and metabolic regulation of proteins in the body but also affects the metabolism of nutrients such as proteins, sugars, and fats. It can also participate in the growth and development of plants, thereby affecting the development of edible mushroom fruiting bodies [71,72]. Tryptophan plays multiple roles in the growth and development of edible fungi. It not only participates in protein synthesis as an essential amino acid but also acts as a precursor for secondary metabolites. It affects hyphal growth, fruiting body differentiation, and stress resistance by regulating signaling pathways [73,74]. Yan [75] conducted comparative transcriptome analysis on different forms of L. edodes fruiting bodies and found that amino acid metabolism pathways, such as trypsin metabolism, were significantly enriched in malformed L. edodes fruiting bodies. Genes encoding heat shock proteins, G proteins, and β –1,3–glucanase in the GH5 family were involved in the development of L. edodes fruiting bodies. Duan [76] conducted transcriptome sequencing on the five growth and development stages of D. indusiata, and the results showed that the cap was the main source of indole–3–acetic acid synthesis, confirming the importance of tryptophan metabolism in the differentiation of D. indusiata fruiting bodies. At the same time, three new genes related to the tryptophan metabolism pathway, IAA synthesis, were identified in the cap. In this study, five genes encoding aldehyde dehydrogenase were screened in Tryptophan metabolism. These genes were negatively correlated with the growth and development of the fruiting body of the S. edulis and showed significant expression of aldehyde dehydrogenase in the primary stage, which may promote the formation of hyphal tangles. As the fruiting body matures, the expression level of Aldehyde dehydrogenase was downregulated, suggesting that it may promote stem elongation and cap formation by regulating the formation of indoacetate, leading to a shift in the development of the fruiting body from the cap growth stage to the fruiting body maturity stage of S. edulis. Aldehyde dehydrogenase was an important enzyme class in the process of clearing reactive oxygen species in organisms, which can catalyze the oxidation of toxic aldehydes and the rapid dehydrogenation of toxic aldehydes, further enhancing the cell’s aldehyde detoxification defense mechanism [77,78]. It can also regulate the growth and development of microorganisms and has been reported in various microorganisms such as Escherichia coli [79], Saccharomyces cerevisiae [80], Tricholoma vaccinum [81], P. ostreatus [82], and Pleurotus geesteranu [83]. At present, this study has only preliminarily screened the gene and has not yet verified its function. In the future, the gene can be accurately identified and further analyzed based on metabolomics and proteomics data to elucidate its mechanism of action in the growth and development of S. edulis.
5. Conclusions
The completion of transcriptome sequencing provides an effective means for studying the genetic mechanism and molecular breeding of S. edulis. This study obtained 54.67 GB of clean data and 21,206 Unigene annotation results. Functional annotation and enrichment of DEGs between the three growth and development stages of primordia (SE8–P), fruiting body differentiation (SE8–F), and mature fruiting body (SE8–M) were performed using GO and KEGG. At the same time, highly differentially expressed aldehyde dehydrogenase, fungal hydrophobin, glycoside hydrolase, and AB hydrolase superfamily protein genes were identified. Among them, the gene encoding aldehyde dehydrogenase was annotated into the trypsin metabolism (ko00380) pathway through KEGG, and it was preliminarily speculated that aldehyde dehydrogenase forms S. edulis fruiting bodies by regulating indoacetate. The accuracy of RNA–Seq and DEG analysis was validated using quantitative PCR. The above research results provide valuable information on the molecular mechanisms of S. edulis fruiting body development. This study aims to provide accurate genetic data on the molecular mechanisms of growth and development and enrich the genetic database of S. edulis. Although this study identified differential genes that may be related to the growth and development of S. edulis, only qRT–PCR was performed. Further functional validation and cloning of the screened differential genes were needed to clarify their mechanisms of action in growth and development. At the same time, this study used non-parametric transcriptome sequencing, which has the characteristics of wide applicability, high sensitivity, and quantitative dynamics. However, compared with parametric transcriptome sequencing, its accuracy was poorer. Future studies will integrate and analyze transcriptome data based on whole-genome data to improve the accuracy of the results.
Supplementary Materials
The following supporting information can be downloaded at https://www.mdpi.com/article/10.3390/jof11100750/s1. Table S1: Internal reference gene sequence information; Table S2: Primer sequences for internal reference genes and DEGs genes; Table S3: Statistical able of sequencing data evaluation of three strains at different development stages; Table S4: Comparison of correlation between transcriptome samples; Table S5: DEGs encoding annotation results of Tryptophan metabolism (ko00380) at three growth and development stages.
Author Contributions
Conceptualization, W.J. and J.X.; methodology, X.H. and P.W.; formal analysis, B.A. and T.Y.; resources, P.W.; data curation, Z.W. and T.R.; writing—original draft preparation, W.J.; writing—review and editing, W.J., X.H. and J.X. All authors have read and agreed to the published version of the manuscript.
Funding
This research was funded by the Science and Technology Department of Jilin Province, grant number 20230202117NC.
Institutional Review Board Statement
Not applicable.
Informed Consent Statement
Not applicable.
Data Availability Statement
The transcriptome data presented in this study have been deposited in the National Center for Biotechnology Information Sequence Read Archive under accession number PRJNA1267801: https://dataview.ncbi.nlm.nih.gov/object/PRJNA1267801?reviewer=mjt1amaerauoilo1h6f60ic9or (accessed on 27 May 2025).
Conflicts of Interest
The authors declare no conflicts of interest.
Abbreviations
| COG | Cluster of Orthologous Groups of proteins |
| GO | Gene Ontology |
| KEGG | Kyoto Encyclopedia of Genes and Genomes |
| KOG | Clusters of orthologous groups for eukaryotic complete genomes |
| Pfam | Protein Families Database |
| TrEMBL | Translation of EMBL nucleotide sequence database |
| eggNOG | evolutionary genealogy of genes: Non-supervised Orthologous Groups |
| NR | Non-Redundant Protein Database |
| DEG | Differentially expressed gene |
| SE8–P | Primordia |
| SE8–F | Fruiting body differentiation |
| SE8–M | Mature fruiting body |
| MF | Molecular Function |
| CC | Cellular Component |
| BP | Biological Process |
| A. bisporus | Agaricus bisporus |
| C. cinereus | Coprinus cinereus |
| S. edulis | Sarcomyxa edulis |
| S. commune | Schizophyllum commune |
| P. ostreatus | Pleurotus ostreatus |
| D. indusiata | Dictyophora indusiata |
| L. edodes | Lentinula edodes |
| M. importuna | Morchella importuna |
| H. marmoreus | Hypsizygus marmoreus |
| A. polytricha | Auricularia polytricha |
References
- Wang, G.S.; Cai, Q.; Hao, Y.J.; Bau, T.; Chen, Z.H.; Li, M.X.; David, N.; Kraisitudomsook, N.; Yang, Z.L. Phylogenetic and taxonomic updates of Agaricales, with an emphasis on Tricholomopsis. Mycology 2023, 15, 180–209. [Google Scholar] [CrossRef]
- Sui, Y.; Shu, F.; Cui, S.; Yang, S.R.; Liu, Y.; Wang, Q. Characteristics and antioxidant activities of polysaccharides from Sarcomyxa edulis. Acta Edulis Fungi 2021, 28, 48–56. [Google Scholar]
- Zhang, R.; Zhao, L.Y.; Wang, H.X.; Ng, T.B. A novel ribonuclease with antiproliferative activity toward leukemia and lymphoma cells and HIV-1 reverse transcriptase inhibitory activity from the mushroom, Hohenbuehelia serotina. Int. J. Mol. Med. 2014, 33, 209–214. [Google Scholar] [CrossRef]
- Li, X.Y.; Wang, L.; Wang, Z.Y. Radioprotective activity of neutral polysaccharides isolated from the fruiting bodies of Hohenbuehelia serotina. Phys. Medica 2015, 31, 352–359. [Google Scholar] [CrossRef]
- Qiu, T.M.; Wang, H.T.; Yu, Y.N.; Xu, L.L.; Lu, X.H. Domestication and nutritional composition analysis of a wild Panellus edulis strain. Edible Fungi China 2022, 41, 19–29. [Google Scholar]
- Jiang, W.Z.; Miao, L.; Wang, P. Biological characteristics and domestication cultivation analysis of wild Sarcomyxa edulis strain. J. Jilin Agric. Sci. Technol. Univ. 2024, 33, 1–8. [Google Scholar]
- Wang, P.; Yao, F.J.; Fang, M.; Jiu, L.D.; Zhai, Y.; Yuan, W.D. A new Panellus edulis cultivar ‘Qidong 1’. Acta Hortic. Sin. 2015, 42, 605–606. [Google Scholar]
- Jiu, L.D.; Yao, F.J.; Zhang, Y.M.; Zhao, N.; Zhu, M.Q. Study on the basidiospore germination characteristics and mycelia growth characteristics of Panellus edulis. Edible Fungi China 2015, 34, 10–12. [Google Scholar]
- Tian, M.X.; Rong, C.B.; Niu, Y.R.; Song, S.; Liu, Y.; Chen, Q.J. ISSR and SRAP analysis of genetic diversity of Hohenbuehelia serotina. Jiangsu Agric. Sci. 2018, 46, 43–47. [Google Scholar]
- Tian, F.H.; Li, C.T.; Li, Y. Genomic analysis of Sarcomyxa edulis reveals the basis of its medicinal properties and evolutionary relationships. Front. Microbiol. 2021, 12, 1614. [Google Scholar] [CrossRef]
- Duan, C.; Tian, F.H.; Yao, L.; Lv, J.H.; Jia, C.W.; Li, C.T. Comparative transcriptome and WGCNA reveal key genes involved in lignocellulose degradation in Sarcomyxa edulis. Sci. Rep. 2022, 12, 18379. [Google Scholar] [CrossRef]
- Duan, C.; Yao, L.; Lv, J.H.; Jia, C.W.; Tian, F.H.; Li, C.T. Systematic analysis of changes across different developmental stages of the mushroom Sarcomyxa edulis. Gene 2022, 824, 146450. [Google Scholar] [CrossRef] [PubMed]
- Song, L.L.; Xing, X.K.; Guo, S.X. Morphological process and regulation mechanisms of fruiting body differentiation in macrofungi:A review. Mycosystema 2018, 37, 671–684. [Google Scholar]
- Shen, N.; Zhang, J.C.; Wang, C.C.; Bian, Y.B.; Xiao, Y. Studies on transcriptome during fruiting body development of Lentinula edodes. Acta Hortic. Sin. 2022, 49, 801–815. [Google Scholar]
- Pelkmans, J.F.; Patil, M.B.; Gehrmann, T.; Reinders, M.J.T.; Wösten, H.A.B.; Lugones, L.G. Transcription factors of Schizophyllum commune involved in mushroom formation and modulation of vegetative growth. Sci. Rep. 2017, 7, 310. [Google Scholar] [CrossRef] [PubMed]
- Ohm, R.A.; Jong, J.F.D.; Bekker, C.D.; Han, A.B.W.; Lugones, L.G. Transcription factor genes of Schizophyllum commune involved in regulation of mushroom formation. Mol. Microbiol. 2011, 81, 1433–1445. [Google Scholar] [CrossRef]
- Boulianne, R.P.; Liu, Y.; Aebi, M.; Lu, B.C.; Kües, U. Fruiting body development in Coprinus cinereus: Regulated expression of two galectins secreted by a nonclassical pathway. Microbiology 2000, 146, 1841–1853. [Google Scholar] [CrossRef] [PubMed]
- Wagemaker, M.J.; Eastwood, D.C.; Van, D.D.C.; Jetten, M.S.; Burton, K.; Van Griensven, L.J.; Hj, O.D.C. Expression of the urease gene of Agaricus bisporus: A tool for studying fruit body formation and post-harvest development. Appl. Microbiol. Biotechnol. 2006, 71, 486–492. [Google Scholar]
- Wu, X.M.; Zhang, X.; Li, N.Y. Transcriptome analysis of Agaricus bisporus fruiting at different stages. Mycosystema 2017, 36, 193–203. [Google Scholar]
- Almási, E.; Sahu, N.; Krizsán, K.; Bálint, B.; Kovács, G.M.; Kiss, B.; Cseklye, J.; Drula, E.; Henrissat, B.; Nagy, I.; et al. Comparative genomics reveals unique wood-decay strategies and fruiting body development in the Schizophyllaceae. New Phytol. 2019, 224, 902–915. [Google Scholar] [CrossRef]
- Krizsánk, K.; Almási, E.; Merényi, Z.; Sahu, N.; Virágh, M.; Kószó, T.; Mondo, S.; Kiss, B.; Bálint, B.; Kües, U.; et al. Transcriptomic atlas of mushroom development reveals conserved genes behind complex multicellularity in fungi. Proc. Natl. Acad. Sci. USA 2019, 116, 7409–7418. [Google Scholar] [CrossRef] [PubMed]
- Pei, J.Q.; Zhao, M.R.; Huang, C.Y.; Wu, X.L. Discovery and verification of a functional gene influencing the growth and development of Pleurotus ostreatus. Biotechnol. Bull. 2025, 41, 327–334. [Google Scholar]
- Grabherr, M.G.; Haas, B.J.; Yassour, M.; Levin, J.Z.; Thompson, D.A.; Amit, I.; Adiconis, X.; Fan, L.; Raychowdhury, R.; Zeng, Q.D.; et al. Full-length transcriptome assembly from RNA Seq data without a reference genome. Nat. Biotechnol. 2011, 29, 644–652. [Google Scholar] [CrossRef]
- Buchfink, B.; Xie, C.; Huson, D.H. Fast and Sensitive Protein Alignment Using Diamond. Nat. Methods 2015, 12, 59–60. [Google Scholar] [CrossRef]
- Boeckmann, B.; Bairoch, A.M.; Apweiler, R.; Blatter, M.; Estreicher, A.; Gasteiger, E.; Martin, M.; Michoud, K.; Odonovan, C.; Phan, I.; et al. The SWISS- PROT protein knowledgebase and its supplement TrEMBL in 2003. Nucleic Acids Res. 2003, 31, 365–370. [Google Scholar] [CrossRef] [PubMed]
- Deng, Y.Y.; Li, J.Q.; Wu, S.F.; Zhu, Y.P.; Chen, Y.W.; He, F.C. Integrated nr Database in Protein Annotation System and Its Localization. Comput. Eng. 2006, 32, 71–72. [Google Scholar]
- Tatusov, R.L.; Galperin, M.Y.; Natale, D.A. The COG database: A tool for genome scale analysis of protein functions and evolution. Nucleic Acids Res. 2000, 28, 33–36. [Google Scholar] [CrossRef]
- Ashburner, M.; Ball, C.A.; Blake, J.A.; Botstein, D.; Butler, H.L.; Cherry, J.M.; Davis, A.P.; Dolinski, K.; Dwight, S.S.; Eppig, J.T.; et al. Gene ontology: Tool for the unification of biology. Nat. Genet. 2000, 25, 25–29. [Google Scholar] [CrossRef]
- Huerta-Cepas, J.; Szklarczyk, D.; Forslund, K.; Cook, H.; Heller, D.; Walter, M.C.; Rattei, T.; Mende, D.R.; Sunagawa, S.; Kuhn, M.; et al. eggNOG 4.5: A hierarchical orthology framework with improved functional annotations for eukaryotic, prokaryotic and viral sequences. Nucleic Acids Res. 2016, 44, 286–293. [Google Scholar] [CrossRef]
- Kanehisa, M.; Goto, S.; Kawashima, S.; Okuno, Y.; Hattori, M. The KEGG resource for deciphering the genome. Nucleic Acids Res. 2004, 32, 277–280. [Google Scholar] [CrossRef]
- Kanehisa, M.; Goto, S.; Hattori, M.; Aokikinoshita, K.F.; Itoh, M.; Kawashima, S.; Katayama, T.; Araki, M.; Hirakawa, M. From genomics to chemical genomics: New developments in KEGG. Nucleic Acids Res. 2006, 34, 354–357. [Google Scholar] [CrossRef] [PubMed]
- Langmead, B.; Trapnell, C.; Pop, M.; Salzberg, S. Ultrafast and memory-efficient alignment of short DNA sequences to the human genome. Genome Biol. 2009, 10, R25. [Google Scholar] [CrossRef] [PubMed]
- Li, B.; Colin, N.D. RSEM: Accurate transcript quantification from RNA Seq data with or without a reference genome. BMC Bioinform. 2011, 4, 323. [Google Scholar] [CrossRef]
- Love, M.I.; Huber, W.; Anders, S. Moderated estimation of fold change and dispersion for RNA-seq data with DESeq2. Genome Biol. 2014, 15, 550. [Google Scholar] [CrossRef]
- Li, X.; Wang, F.; Liu, Q.; Li, Q.P.; Qian, Z.M.; Zhang, X.L.; Li, K.; Li, W.J.; Dong, C.H. Developmental transcriptomics of Chinese cordyceps reveals gene regulatory network and expression pro les of sexual development-related genes. BMC Genom. 2019, 20, 337. [Google Scholar]
- Müller, D.; Leyser, O. Auxin, cytokinin and the control of shoot branching. Ann. Bot. 2011, 107, 1203–1212. [Google Scholar] [CrossRef]
- Dhale, D.A.; Ankita, P.; Rathod, M.C. Production of IAA by endophytic fungi as Phyllanthus emblica Linn. Curr. Agric. Res. J. 2023, 11, 881–889. [Google Scholar]
- Cui, X.; Kong, W.L. Research progress of auxin IAA on the growth and development of edible fungi. China Cucurbits Veg. 2024, 37, 8–14. [Google Scholar]
- Jiang, X.L.; Huang, Q.X.; Li, H.; Zhao, J.P. A review of advances in plant thaumatin-like proteins. J. Zhejiang A&F Univ. 2012, 29, 279–287. [Google Scholar]
- Yang, Y.; Hu, X. A chromosome-scale genome of Trametes versicolor and transcriptome-based screening for light-induced genes that promote triterpene biosynthesis. J. Fungi 2025, 11, 81. [Google Scholar] [CrossRef] [PubMed]
- Zhang, J.X.; Li, Y.X.; Mao, Y.F.; Zhang, Y.S.; Zhou, B.T.; Liu, W.; Wang, W.; Zhang, C. Integrated transcriptomic and proteomic analyses reveal molecular mechanism of response to heat shock in Morchella sextelata. J. Fungi 2025, 11, 76. [Google Scholar] [CrossRef]
- Wen, X.F. Molecular Mechanism of Post-Harvest Morphological Development of Dictyophora indusiate. Master’s Thesis, Chengdu University, Chendu, China, 2022. [Google Scholar]
- Fu, Y.P.; Dai, Y.T.; Yang, C.T.; Wei, P.; Song, B.; Yang, Y.; Sun, L.; Zhang, Z.W.; Li, Y. Comparative transcriptome analysis identified candidate genes related to Bailinggu mushroom formation and genetic markers for genetic analyses and breeding. Sci. Rep. 2017, 7, 9266. [Google Scholar] [CrossRef]
- Tang, L.H.; Jian, H.H.; Song, C.Y.; Bao, D.P.; Shang, X.D.; Wu, D.Q.; Tan, Q.; Zhang, X.H. Transcriptome analysis of candidate genes and signaling pathways associated with light-induced brown film formation in Lentinula edodes. Appl. Microbiol. Biotechnol. 2013, 97, 4977–4989. [Google Scholar] [CrossRef]
- Wang, J.Q.; Ye, H.L.; Liang, D.W.; Liu, D.Y.; Geng, F.; Li, X. De novo sequencing and transcriptome analysis of Morchella importuna fruiting body. Food Sci. 2018, 39, 81–87. [Google Scholar]
- Wang, L.N. Characterization and Function Analysis of Catalase Genes in Pleurotus ostreatus. Ph.D. Thesis, Chinese Academy of Agricultural Sciences, Beijing, China, 2019. [Google Scholar]
- Zhang, J.J.; Ren, A.; Chen, H.; Zhao, M.W.; Shi, L.; Chen, M.G.; Wang, H.; Feng, Z.Y. Transcriptome analysis and its application in identifying genes associated with fruiting body development in basidiomycete Hypsizygus marmoreus. PLoS ONE 2015, 10, e0123025. [Google Scholar] [CrossRef] [PubMed]
- Zhou, Y.; Chen, L.F.; Fan, X.Z.; Bian, Y.B. De novo assembly of Auricularia polytricha transcriptome using Illumina sequencing for gene discovery and SSR marker identification. PLoS ONE 2014, 9, e91740. [Google Scholar] [CrossRef] [PubMed]
- Ma, X.X.; Lu, L.S.; Zhang, Y.M.; Fang, M.; Shao, K.S.; Sun, X.; Yao, F.J. Velvet family members regulate pigment synthesis of the fruiting bodies of Auricularia cornea. J. Fungi 2023, 9, 412. [Google Scholar] [CrossRef]
- Ma, X.X.; Lu, L.X.; Yao, F.J.; Fang, M.; Wang, P.; Meng, J.J.; Shao, K.S.; Sun, X.; Zhang, Y.M. High-quality genome assembly and multi-omics analysis of pigment synthesis pathway in Auricularia cornea. Front. Microbiol. 2023, 14, 1211795. [Google Scholar] [CrossRef] [PubMed]
- Li, X.R.; Luo, L.; Wang, X.Y.; Zhu, M. Further insights into the molecular mechanisms underlying tobacco straw cultivation of Pleurotus ostreatus by comparative transcriptome analyses. Genomics 2025, 117, 110992. [Google Scholar] [CrossRef]
- Xu, D.; Liu, Q.; Chen, G.; Yan, Z.; Hu, H. Aldehyde dehydrogenase ALDH3F1 involvement in flowering time regulation through histone acetylation modulation on FLOWERING LOCUS C. J. Integr. Plant Biol. 2020, 62, 1080–1092. [Google Scholar] [CrossRef]
- Tola, A.J.; Jaballi, A.; Germain, H.; Missihoun, T.D. Recent development on plant aldehyde dehydrogenase enzymes and their functions in plant development and stress signaling. Genes 2020, 12, 51. [Google Scholar] [CrossRef]
- Li, X.B.; Qin, Y.; Kong, Y.F.; Karunarathna, S.C.; Liang, Y.; Xu, J.Z. Optimization of protoplast preparation conditions in Lyophyllum decastes and transcriptomic aunctional analysis of hydrophobin genes in sexual development of Botrytis cinerea. J. Fungi 2024, 10, 886. [Google Scholar] [CrossRef] [PubMed]
- Terhem, R.B.; van Kan, J.A. Functional analysis of hydrophobin genes in sexual development of Botrytis cinerea. Fungal Genet. Biol. 2014, 71, 42–51. [Google Scholar] [CrossRef]
- Li, X.; Liu, M.; Dong, C. Hydrophobin Gene Cmhyd4 negatively regulates fruiting body development in edible fungi Cordyceps militaris. Int. J. Mol. Sci. 2023, 24, 13. [Google Scholar] [CrossRef]
- Arnold, P.K.; Finley, L.W.S. Regulation and function of the mammalian tricarboxylic acid cycle. J. Biol. Chem. 2023, 299, 102838. [Google Scholar] [CrossRef]
- Fernie, A.R.; Carrari, F.; Sweetlove, L.J. Respiratory metabolism: Glycolysis, the TCA cycle and mitochondrial electron transport. Curr. Opin. Plant Biol. 2004, 7, 254–261. [Google Scholar] [CrossRef]
- Qian, L.; Zhang, Z.J.; Chen, X.M.; Li, S.F.; Luo, Y.; Liu, J.H. Polysaccharides content and activity of enzymes related to sugar metabolism from the fruiting bodies of Ganoderma lucidum at different growth stages. Storage Process 2019, 19, 128–131. [Google Scholar]
- Liu, P.H.; Xie, B.G.; Deng, Y.J.; Jiang, Y.J. Cloning, structural analyses and expression levels of phosphofructokinase gene in different strains of Volvariella volvacea. Mycosystema 2013, 32, 253–260. [Google Scholar]
- Xu, C.T.; Li, Z.H.; Pan, J.L.; Li, H.K.; Hu, Q.X.; Zou, Y.J.; Chen, X.H.; Mi, C.X. Cloning and expression analysis of Trehalose-6-Phosphate Synthase from Sanghuangporus vaninii. Acta Edulis Fungi 2024, 31, 45–52. [Google Scholar]
- Bhadoriya, P.; Jain, M.; Kaicker, G.; Saidullah, B.; Saran, S. Deletion of Htt cause alterations in cAMP signaling and spatial patterning in Dictyostelium discoideum. J. Cell. Physiol. 2019, 234, 18858–18871. [Google Scholar] [CrossRef]
- Bai, S.; Zhou, Z.C.; Mariga, A.M.; Shang, X.L.; Ma, N.; Fang, D.L.; Yang, W.J.; Hu, Q.H.; Gao, H.Y.; Chen, H.J.; et al. CA-g-CS/PLA film packaging improved storage stability through the MAPK signaling pathway of postharvest Agaricus bisporus. Postharvest Biol. Technol. 2024, 209, 112688. [Google Scholar] [CrossRef]
- Agger, S.; Gallego, F.L.; Dannert, C.S. Diversity of sesquiterpene synthases in the basidiomycete Coprinus cinereus. Mol. Microbiol. 2009, 72, 1181–1195. [Google Scholar] [CrossRef]
- Bezmenova, A.V.; Zvyagina, E.A.; Fedotova, A.V.; Kasianov, A.S.; Neretina, T.V.; Penin, A.A.; Bazykin, G.A.; Kondrashov, A.S. Rapid accumulation of mutations in growing mycelia of a hypervariable fungus Schizophyllum commune. Mol. Biol. Evol. 2020, 37, 2279–2286. [Google Scholar] [CrossRef]
- Masunaga, N.; Kitaoka, T.; Ichinose, H. Biocatalyst collection and heterologous expression of sesquiterpene synthases from basidiomycetous fungi: Discovery of a novel. Microb. Biotechnol. 2023, 16, 632–644. [Google Scholar] [CrossRef]
- Abdelshafy, A.M.; Belwal, T.; Liang, Z.; Wang, L.; Li, D.; Luo, Z.S.; Li, L. A comprehensive review on phenolic compounds from edible mushrooms: Occurrence, biological activity, application and future prospective. Crit. Rev. Food Sci. Nutr. 2022, 62, 6204–6224. [Google Scholar] [CrossRef]
- Hu, C.C.; Yu, P.J.; Li, S.J. Regulatory mechanisms of ergosterol biosynthesis in fungi. J. Fungal Res. 2019, 17, 138–146. [Google Scholar]
- Tartar, A.; Shapiro, A.M.; Scharf, D.W.; Boucias, D.G. Differential expression of chitin synthase (CHS) and glucan synthase (FKS) genes correlates with the formation of a modified, thinner cell wall in in vivo-produced beauveria bassiana cells. Mycopathologia 2005, 160, 303–314. [Google Scholar] [CrossRef]
- Janusz, G.; Kucharzyk, K.H.; Pawlik, A.; Staszczak, M.; Paszczynski, A.J. Fungal laccase, manganese peroxidase and lignin peroxidase: Gene expression and regulation. Enzym. Microb. Technol. 2013, 52, 1–12. [Google Scholar] [CrossRef] [PubMed]
- Li, W.P.; Zhang, Z.; Wu, R.Y.; Mao, M.Y.; Ji, Y.K.; Wang, X.N.; Dou, S.G.; Yan, M.; Chen, W.T. Fusobacterium nucleatum-derived outer membrane vesicles promote immunotherapy resistance via changes in tryptophan metabolism in tumour-associated Macrophages. J. Extracell. Vesicles 2025, 14, e70070. [Google Scholar] [CrossRef] [PubMed]
- Wang, S.; Schooten, F.J.V.; Jin, H.; Jonkers, D.; Godschalk, R. The involvement of intestinal tryptophan metabolism in inflammatory bowel disease identified by a meta-analysis of the transcriptome and a systematic review of the metabolome. Nutrients 2023, 15, 19. [Google Scholar] [CrossRef]
- Nutaratat, P.; Srisuk, N.; Arunrattiyakorn, P.; Limtong, S. Indole-3-acetic acid biosynthetic pathways in the basidiomycetous yeast Rhodosporidium paludigenum. Arch. Microbiol. 2016, 198, 429–437. [Google Scholar] [CrossRef]
- Sun, S.L.; Yang, W.L.; Fang, W.W.; Zhao, Y.X.; Guo, L.; Dai, Y.J. The plant growth-promoting rhizobacterium variovorax boronicumulans CGMCC 4969 regulates the level of Indole-3-acetic acid synthesized from Indole-3-acetonitrile. Appl. Environ. Microbiol. 2018, 84, e00298-18. [Google Scholar] [CrossRef] [PubMed]
- Yan, D.; Gao, Q.; Rong, C.B.; Liu, Y.; Song, S.; Yu, Q.Y.; Zhou, K.X.; Liao, Y.L. Comparative transcriptome analysis of abnormal cap and healthy fruiting bodies of the edible mushroom Lentinula edodes. Fungal Genet. Biol. 2021, 156, 103614. [Google Scholar] [CrossRef]
- Duan, M.Z.; Long, S.F.; Wu, X.J.; Feng, B.; Qin, S.Q.; Li, Y.J.; Li, X.; Li, C.N.; Zhao, C.G.; Wang, L.Q.; et al. Genome, transcriptome, and metabolome analyses provide new insights into the resource development in an edible fungus Dictyophora indusiate. Front. Microbiol. 2023, 14, 1137159. [Google Scholar] [CrossRef]
- Skibbe, D.S.; Liu, F.; Wen, T.J.; Yandeau, M.D.; Cui, X.Q.; Cao, J.; Simmons, C.R.; Schnable, P.S. Characterization of the aldehyde dehydrogenase gene families of Zea mays and Arabidopsis. Plant Mol. Biol. 2002, 48, 751–764. [Google Scholar] [CrossRef]
- Singh, S.; Brocker, C.; Koppaka, V.; Chen, Y.; Jackson, B.C.; Matsumoto, A.; Thompson, D.C.; Vasiliou, V. Aldehyde dehydrogenases in cellular responses to oxidative/electrophilic stress. Free. Radic. Biol. Med. 2012, 56, 89–101. [Google Scholar] [CrossRef]
- Jozefczuk, S.; Klie, S.; Catchpole, G.; Szymanski, J.; CuadrosInostroza, A.; Steinhauser, D.; Selbig, J.; Willmitzer, L. Metabolomic and transcriptomic stress response of Escherichia coli. Mol. Syst. Biol. 2010, 6, 364. [Google Scholar] [CrossRef] [PubMed]
- Jiang, S.; Wang, H.; He, Y.H.; Chen, Y.F.; Deng, Q.B.; Guo, X.W.; Xiao, D.G. Effect of Saccharomyces cerevisiae overexpressing acetaldehyde dehydrogenase genes on reducing higher alcohols in Huangjiu. China Brew. 2020, 39, 153–159. [Google Scholar]
- Asiimwe, T.; Krause, K.; Schlunk, I.; Kothe, E. Modulation of ethanol stress tolerance by aldehyde dehydrogenase in the mycorrhizal fungus Tricholoma vaccinum. Mycorrhiza 2012, 22, 471–484. [Google Scholar] [CrossRef]
- Qi, Y.C.; Liu, Y.D.; Sun, X.K.; Zhang, M.L.; Zhang, Q.; Wen, Q.; Qiu, L.Y.; Shen, J.W. Cloning and expression analysis of Pleurotus ostreatus aldehyde dehydrogenase gene PoALDH1 under abiotic stresses. Mycosystema 2017, 36, 1121–1131. [Google Scholar]
- Song, X.L. Characterizations of Mycelium Polysaccharides from Pleurotus geesteranus and the Mechanisms on Improving the Alcoholic Liver Disease in Mice. Ph.D. Thesis, Shandong Agricultural University, Tai’an, China, 2022. [Google Scholar]
Disclaimer/Publisher’s Note: The statements, opinions and data contained in all publications are solely those of the individual author(s) and contributor(s) and not of MDPI and/or the editor(s). MDPI and/or the editor(s) disclaim responsibility for any injury to people or property resulting from any ideas, methods, instructions or products referred to in the content. |
© 2025 by the authors. Licensee MDPI, Basel, Switzerland. This article is an open access article distributed under the terms and conditions of the Creative Commons Attribution (CC BY) license (https://creativecommons.org/licenses/by/4.0/).