
Identification of Food Spoilage Fungi Using MALDI-TOF MS: Spectral Database Development and Application to Species Complex


Abstract
1. Introduction
2. Materials and Methods
2.1. Fungal Strains
2.2. Strains Inoculation and Cultivation
2.3. Mold Sample Preparation
2.4. Spectra Acquisition
2.5. Spectra Quality Control Procedure
2.6. Non-Supervised Analysis of Spectra from Species within Species Complexes
2.7. Development of Spectral Database
2.8. Evaluation of Identification Performance by Cross-Validation
2.9. Evaluation of Identification Performance by External Validation
3. Results
3.1. Performance Estimation by Cross-Validation and Database Validation
3.1.1. Performance Evaluation by Cross-Validation
3.1.2. Database Validation
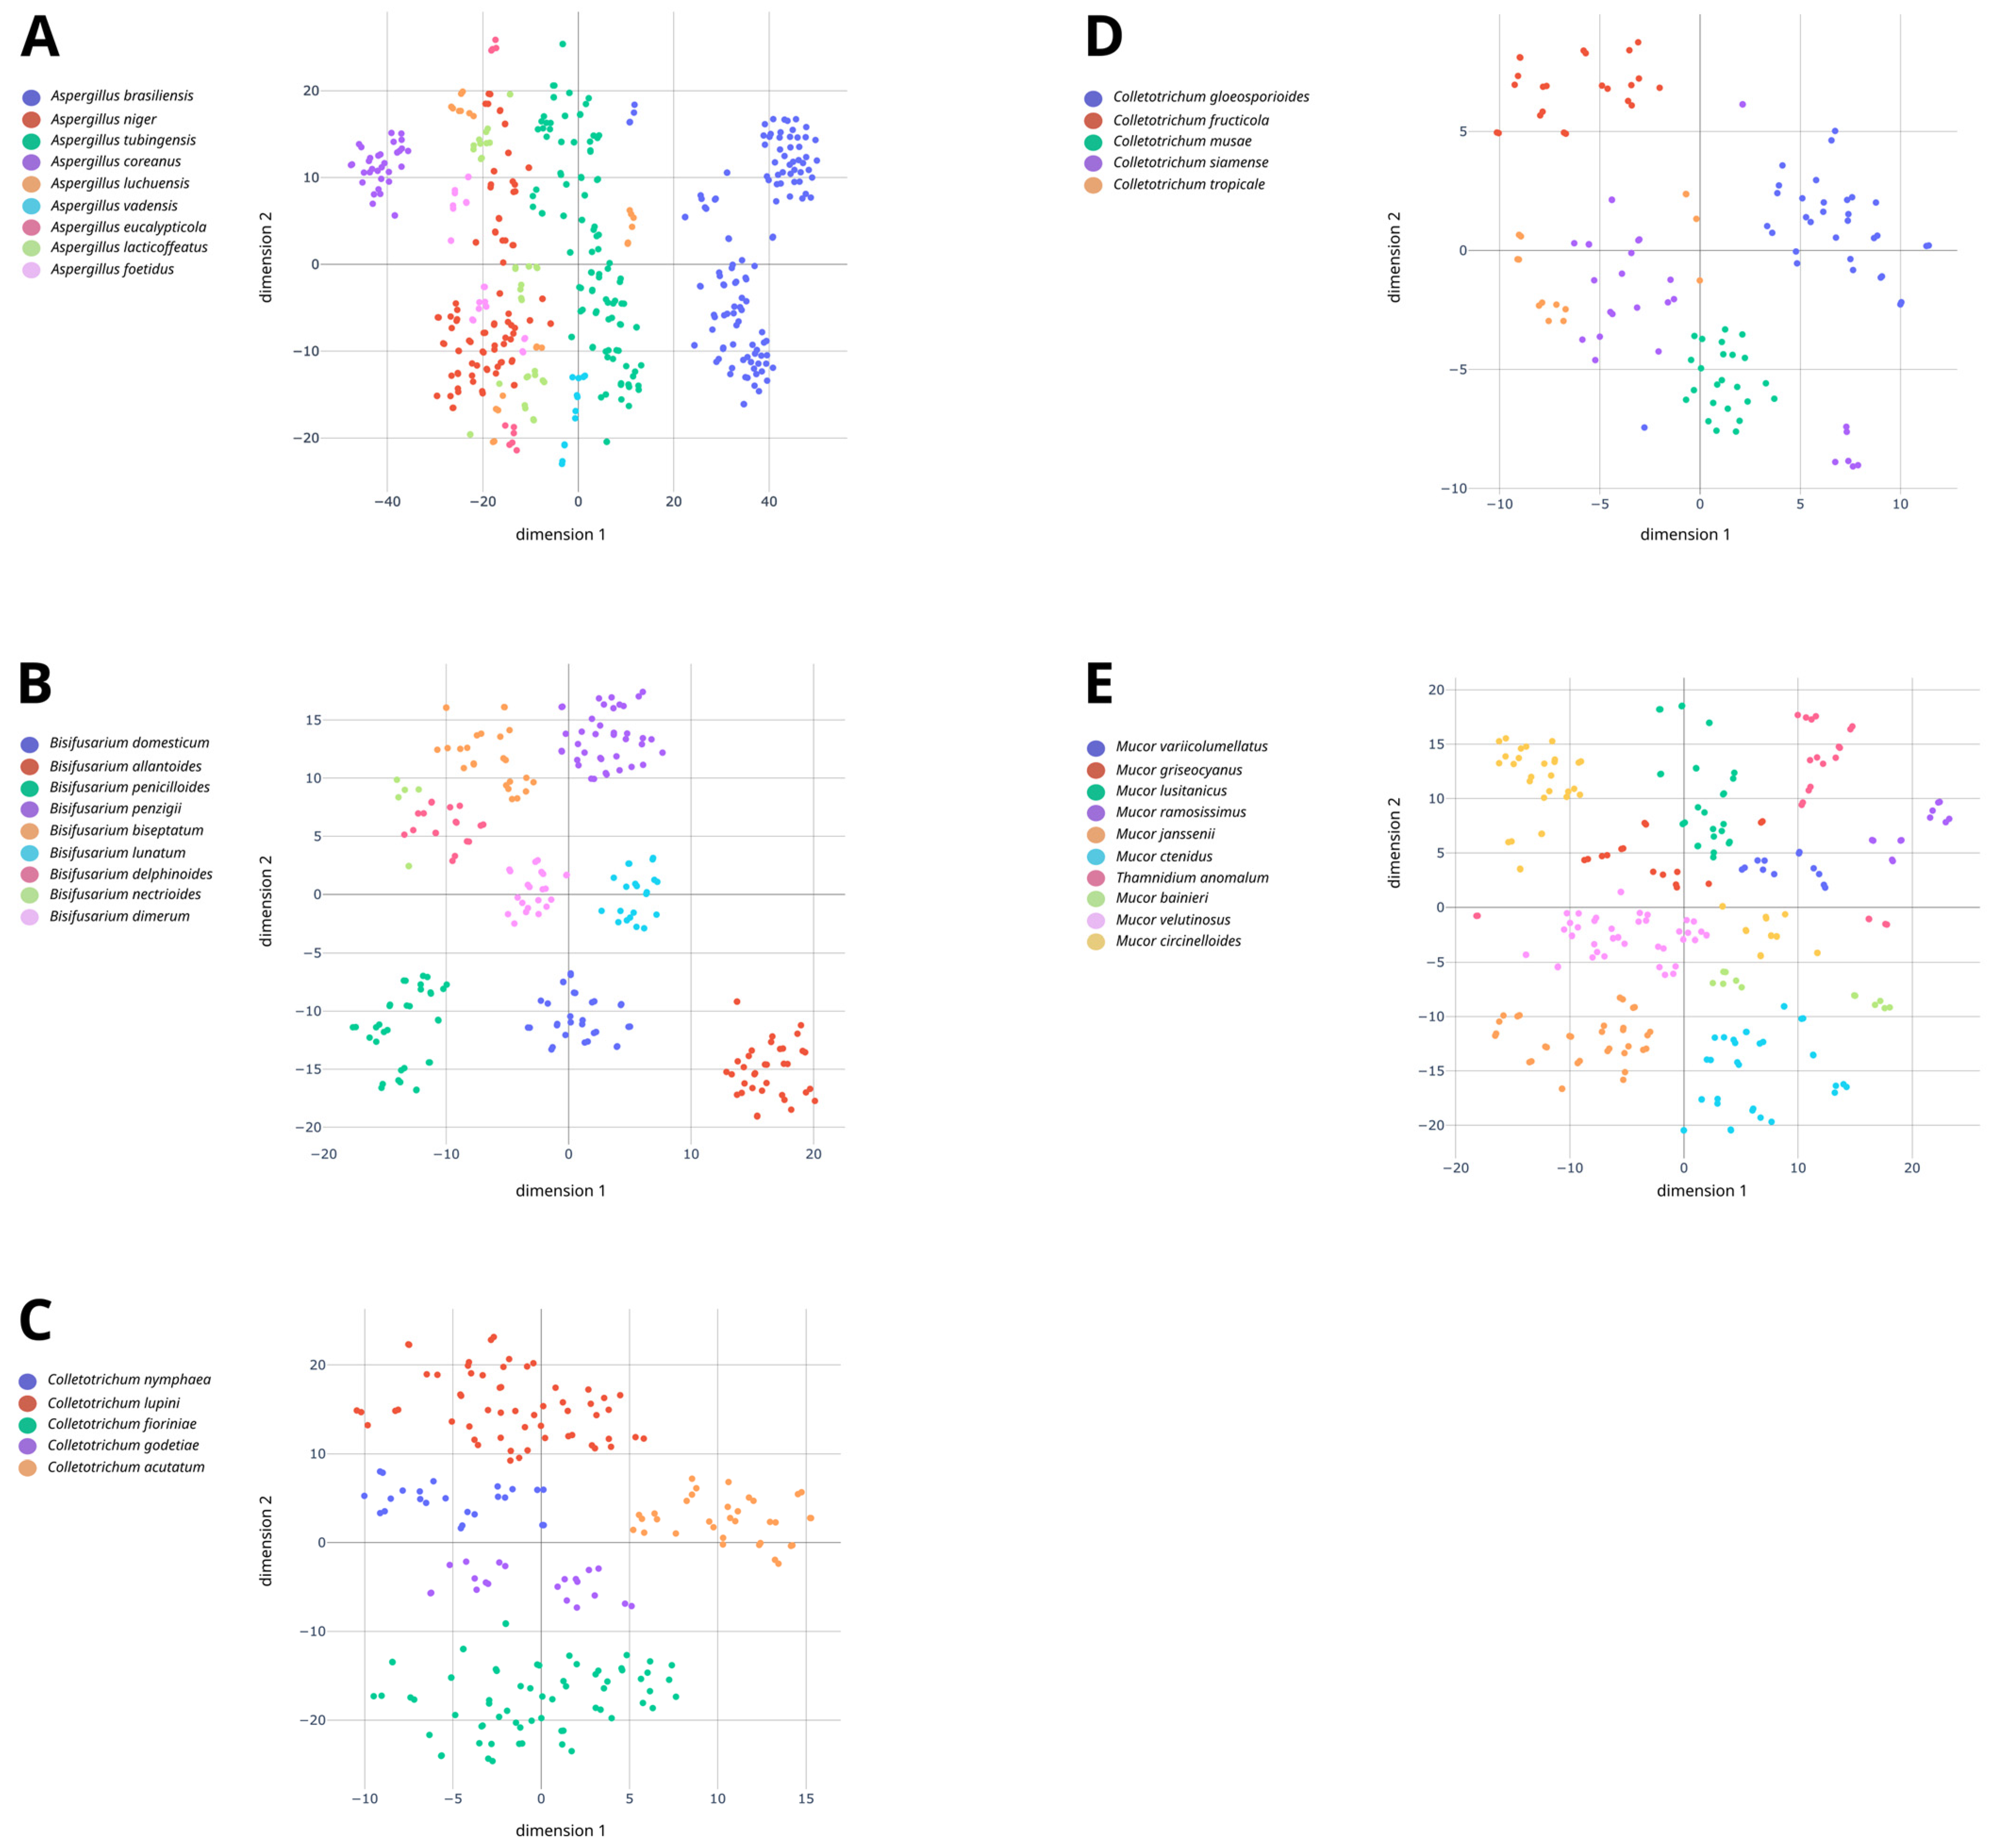
3.2. Performance Evaluation of MALDI-TOF MS for Species Complex Differentiation
4. Discussion
4.1. Performance Estimation by Cross-Validation and Database Validation
4.2. Performance Evaluation of MALDI-TOF MS for Species Complex Differentiation
5. Conclusions
Supplementary Materials
Author Contributions
Funding
Institutional Review Board Statement
Informed Consent Statement
Data Availability Statement
Acknowledgments
Conflicts of Interest
References
- Hawksworth, D.L.; Lücking, R. Fungal Diversity Revisited: 2.2 to 3.8 Million Species. Microbiol. Spectr. 2017, 5. [Google Scholar] [CrossRef] [PubMed]
- Chalupová, J.; Raus, M.; Sedlářová, M.; Šebela, M. Identification of Fungal Microorganisms by MALDI-TOF Mass Spectrometry. Biotechnol. Adv. 2014, 32, 230–241. [Google Scholar] [CrossRef] [PubMed]
- Amara, A.A.; El-Baky, N.A. Fungi as a Source of Edible Proteins and Animal Feed. J. Fungi 2023, 9, 73. [Google Scholar] [CrossRef] [PubMed]
- Nout, M.J.R. The Colonizing Fungus as a Food Provider. In Food Mycology: A Multifaceted Approach to Fungi and Food; CRC Press: Boca Raton, FL, USA, 2007; pp. 335–352. [Google Scholar]
- Pitt, J.I.; Hocking, A.D. Fungi and Food Spoilage, 3rd ed.; Springer: New York, NY, USA, 2009; ISBN 978-0-387-92206-5. [Google Scholar]
- Food and Agriculture Organization of the United Nations (FAO). Pertes et Gaspillages Alimentaires. Available online: https://www.fao.org/news/story/fr/item/196443/icode/ (accessed on 27 June 2023).
- Akimowicz, M.; Bucka-Kolendo, J. MALDI-TOF MS—Application in Food Microbiology. Acta Biochim. Pol. 2020, 67, 327–332. [Google Scholar] [CrossRef] [PubMed]
- Lücking, R.; Aime, M.C.; Robbertse, B.; Miller, A.N.; Ariyawansa, H.A.; Aoki, T.; Cardinali, G.; Crous, P.W.; Druzhinina, I.S.; Geiser, D.M.; et al. Unambiguous Identification of Fungi: Where Do We Stand and How Accurate and Precise Is Fungal DNA Barcoding? IMA Fungus 2020, 11, 14. [Google Scholar] [CrossRef]
- Agence Française de Sécurité Sanitaire Des Aliments (AFSSA). Évaluation Des Risques Liés à La Présence de Mycotoxines Dans Les Chaînes Alimentaires Humaine et Animale; Agence Française de Sécurité Sanitaire Des Aliments: Paris, France, 2009; p. 308.
- Smith, M.-C.; Madec, S.; Coton, E.; Hymery, N. Natural Co-Occurrence of Mycotoxins in Foods and Feeds and Their In Vitro Combined Toxicological Effects. Toxins 2016, 8, 94. [Google Scholar] [CrossRef] [PubMed]
- Alshannaq, A.; Yu, J.-H. Occurrence, Toxicity, and Analysis of Major Mycotoxins in Food. Int. J. Environ. Res. Public Health 2017, 14, 632. [Google Scholar] [CrossRef]
- Köhler, J.R.; Hube, B.; Puccia, R.; Casadevall, A.; Perfect, J.R. Fungi That Infect Humans. Microbiol. Spectr. 2017, 5. [Google Scholar] [CrossRef]
- Latgé, J.-P.; Calderone, R. Host–Microbe Interactions: Fungi Invasive Human Fungal Opportunistic Infections. Curr. Opin. Microbiol. 2002, 5, 355–358. [Google Scholar] [CrossRef]
- Filtenborg, O.; Frisvad, J.C.; Thrane, U. Moulds in Food Spoilage. Int. J. Food Microbiol. 1996, 33, 85–102. [Google Scholar] [CrossRef]
- Pinheiro, D.; Monteiro, C.; Faria, M.A.; Pinto, E. Vitek® MS v3.0 System in the Identification of Filamentous Fungi. Mycopathologia 2019, 184, 645–651. [Google Scholar] [CrossRef] [PubMed]
- Rokas, A. Evolution of the Human Pathogenic Lifestyle in Fungi. Nat. Microbiol. 2022, 7, 607–619. [Google Scholar] [CrossRef] [PubMed]
- Houbraken, J.; Samson, R.A. Current Taxonomy and Identification of Foodborne Fungi. Curr. Opin. Food Sci. 2017, 17, 84–88. [Google Scholar] [CrossRef]
- Quéro, L. Développement de La Spectrométrie de Masse MALDI-TOF Pour l’identification Des Champignons Filamenteux d’intérêt Alimentaire et Étude de Leur Résistance Aux Molécules Biocides. Ph.D. Thesis, Université de Bretagne Occidentale, Brest, France, 2018. [Google Scholar]
- Antil, S.; Abraham, J.S.; Sripoorna, S.; Maurya, S.; Dagar, J.; Makhija, S.; Bhagat, P.; Gupta, R.; Sood, U.; Lal, R.; et al. DNA Barcoding, an Effective Tool for Species Identification: A Review. Mol. Biol. Rep. 2023, 50, 761–775. [Google Scholar] [CrossRef] [PubMed]
- Schoch, C.L.; Seifert, K.A.; Huhndorf, S.; Robert, V.; Spouge, J.L.; Levesque, C.A.; Chen, W.; Fungal Barcoding Consortium; Fungal Barcoding Consortium Author List; Bolchacova, E.; et al. Nuclear Ribosomal Internal Transcribed Spacer (ITS) Region as a Universal DNA Barcode Marker for Fungi. Proc. Natl. Acad. Sci. USA 2012, 109, 6241–6246. [Google Scholar] [CrossRef]
- Girard, V.; Monnin, V.; Rolland, N.; Mounier, J.; Jany, J.-L. Identification of Mold Species and Species Complex from the Food Environment Using MALDI-TOF MS. In Microbiological Identification Using MALDI-TOF and Tandem Mass Spectrometry; John Wiley & Sons, Ltd.: Hoboken, NJ, USA, 2023; pp. 497–513. ISBN 978-1-119-81408-5. [Google Scholar]
- Culebras, D.E. Chapter Fifteen—Application of MALDI-TOF MS in Bacterial Strain Typing and Taxonomy. In The Use of Mass Spectrometry Technology (MALDI-TOF) in Clinical Microbiology; Cobo, F., Ed.; Academic Press: Cambridge, MA, USA, 2018; pp. 213–233. ISBN 978-0-12-814451-0. [Google Scholar]
- Fan, W.-T.; Qin, T.-T.; Bi, R.-R.; Kang, H.-Q.; Ma, P.; Gu, B. Performance of the Matrix-Assisted Laser Desorption Ionization Time-of-Flight Mass Spectrometry System for Rapid Identification of Streptococci: A Review. Eur. J. Clin. Microbiol. Infect. Dis. 2017, 36, 1005–1012. [Google Scholar] [CrossRef] [PubMed]
- Deak, E.; Charlton, C.L.; Bobenchik, A.M.; Miller, S.A.; Pollett, S.; McHardy, I.H.; Wu, M.T.; Garner, O.B. Comparison of the Vitek MS and Bruker Microflex LT MALDI-TOF MS Platforms for Routine Identification of Commonly Isolated Bacteria and Yeast in the Clinical Microbiology Laboratory. Diagn. Microbiol. Infect. Dis. 2015, 81, 27–33. [Google Scholar] [CrossRef] [PubMed]
- Patel, R. A Moldy Application of MALDI: MALDI-ToF Mass Spectrometry for Fungal Identification. J. Fungi 2019, 5, 4. [Google Scholar] [CrossRef] [PubMed]
- Quéro, L.; Courault, P.; Cellière, B.; Lorber, S.; Jany, J.-L.; Puel, O.; Girard, V.; Vasseur, V.; Nodet, P.; Mounier, J. Application of MALDI-TOF MS to Species Complex Differentiation and Strain Typing of Food Related Fungi: Case Studies with Aspergillus Section Flavi Species and Penicillium Roqueforti Isolates. Food Microbiol. 2020, 86, 103311. [Google Scholar] [CrossRef]
- Gautier, M.; Ranque, S.; Normand, A.-C.; Becker, P.; Packeu, A.; Cassagne, C.; L’Ollivier, C.; Hendrickx, M.; Piarroux, R. Matrix-Assisted Laser Desorption Ionization Time-of-Flight Mass Spectrometry: Revolutionizing Clinical Laboratory Diagnosis of Mould Infections. Clin. Microbiol. Infect. 2014, 20, 1366–1371. [Google Scholar] [CrossRef]
- Girard, V.; Mailler, S.; Welker, M.; Arsac, M.; Cellière, B.; Cotte-Pattat, P.-J.; Chatellier, S.; Durand, G.; Béni, A.-M.; Schrenzel, J.; et al. Identification of Mycobacterium Spp. and Nocardia Spp. from Solid and Liquid Cultures by Matrix-Assisted Laser Desorption Ionization–Time of Flight Mass Spectrometry (MALDI-TOF MS). Diagn. Microbiol. Infect. Dis. 2016, 86, 277–283. [Google Scholar] [CrossRef]
- Al-Hatmi, A.M.S.; Normand, A.-C.; van Diepeningen, A.D.; Hendrickx, M.; de Hoog, G.S.; Piarroux, R. Rapid Identification of Clinical Members of Fusarium Fujikuroi Complex Using MALDI-TOF MS. Future Microbiol. 2015, 10, 1939–1952. [Google Scholar] [CrossRef] [PubMed]
- Américo, F.; Machado Siqueira, L.; Del Negro, G.M.; Favero Gimenes, V.; Trindade, M.R.; Motta, A.; Santos de Freitas, R.; Rossi, F.; Colombo, A.; Benard, G.; et al. Evaluating VITEK MS for the Identification of Clinically Relevant Aspergillus Species. Med. Mycol. 2020, 58, 322–327. [Google Scholar] [CrossRef] [PubMed]
- Allen, C.; Prior, P.; Hayward, A.C. (Eds.) Bacterial Wilt Disease and the Ralstonia Solanacearum Species Complex; APS Press: Eagan, MN, USA, 2005; ISBN 978-0-89054-329-0. [Google Scholar]
- Balasundaram, S.V.; Engh, I.B.; Skrede, I.; Kauserud, H. How Many DNA Markers Are Needed to Reveal Cryptic Fungal Species? Fungal Biol. 2015, 119, 940–945. [Google Scholar] [CrossRef] [PubMed]
- Bian, C.; Kusuya, Y.; Sklenář, F.; D’hooge, E.; Yaguchi, T.; Ban, S.; Visagie, C.M.; Houbraken, J.; Takahashi, H.; Hubka, V. Reducing the Number of Accepted Species in Aspergillus Series Nigri. Stud. Mycol. 2022, 102, 95–132. [Google Scholar] [CrossRef] [PubMed]
- Frisvad, J.C.; Hubka, V.; Ezekiel, C.N.; Hong, S.-B.; Nováková, A.; Chen, A.J.; Arzanlou, M.; Larsen, T.O.; Sklenář, F.; Mahakarnchanakul, W.; et al. Taxonomy of Aspergillus Section Flavi and Their Production of Aflatoxins, Ochratoxins and Other Mycotoxins. Stud. Mycol. 2019, 93, 1–63. [Google Scholar] [CrossRef] [PubMed]
- Varga, J.; Frisvad, J.C.; Kocsubé, S.; Brankovics, B.; Tóth, B.; Szigeti, G.; Samson, R.A. New and Revisited Species in Aspergillus Section Nigri. Stud. Mycol. 2011, 69, 1–17. [Google Scholar] [CrossRef] [PubMed]
- Leong, S.L.; Pettersson, O.V.; Rice, T.; Hocking, A.D.; Schnürer, J. The Extreme Xerophilic Mould Xeromyces bisporus—Growth and Competition at Various Water Activities. Int. J. Food Microbiol. 2011, 145, 57–63. [Google Scholar] [CrossRef]
- Hinton, G.E.; Roweis, S. Stochastic Neighbor Embedding. In Proceedings of the Advances in Neural Information Processing Systems; MIT Press: Cambridge, MA, USA, 2002; Volume 15. [Google Scholar]
- Maaten, L.; van der Hinton, G. Visualizing Data Using T-SNE. J. Mach. Learn. Res. 2008, 9, 2579–2605. [Google Scholar]
- Wattenberg, M.; Viégas, F.; Johnson, I. How to Use T-SNE Effectively. Distill 2016, 1, e2. [Google Scholar] [CrossRef]
- Strubel, G.; Arsac, M.; Desseree, D.; Cotte-Pattat, P.-J.; Mahe, P. Method for Identifying Microorganisms via Mass Spectrometry and Score Normalization. U.S. Patent 20140343864A1, 20 November 2014. [Google Scholar]
- Lee, W.; Kim, J.S.; Seo, C.W.; Lee, J.W.; Kim, S.H.; Cho, Y.; Lim, Y.W. Diversity of Cladosporium (Cladosporiales, Cladosporiaceae) Species in Marine Environments and Report on Five New Species. MycoKeys 2023, 98, 87–111. [Google Scholar] [CrossRef]
- Quéro, L.; Girard, V.; Pawtowski, A.; Tréguer, S.; Weill, A.; Arend, S.; Cellière, B.; Polsinelli, S.; Monnin, V.; van Belkum, A.; et al. Development and Application of MALDI-TOF MS for Identification of Food Spoilage Fungi. Food Microbiol. 2018, 81, 76–88. [Google Scholar] [CrossRef]
- Blacutt, A.A.; Gold, S.E.; Voss, K.A.; Gao, M.; Glenn, A.E. Fusarium Verticillioides: Advancements in Understanding the Toxicity, Virulence, and Niche Adaptations of a Model Mycotoxigenic Pathogen of Maize. Phytopathology 2018, 108, 312–326. [Google Scholar] [CrossRef]
- Sklenář, F.; Glässnerová, K.; Jurjević, Ž.; Houbraken, J.; Samson, R.A.; Visagie, C.M.; Yilmaz, N.; Gené, J.; Cano, J.; Chen, A.J.; et al. Taxonomy of Aspergillus Series Versicolores: Species Reduction and Lessons Learned about Intraspecific Variability. Stud. Mycol. 2022, 102, 53–93. [Google Scholar] [CrossRef]
- Dowling, M.; Peres, N.; Villani, S.; Schnabel, G. Managing Colletotrichum on Fruit Crops: A “Complex” Challenge. Plant Dis 2020, 104, 2301–2316. [Google Scholar] [CrossRef] [PubMed]
- Lopes da Silva, L.; Moreno, H.L.A.; Correia, H.L.N.; Santana, M.F.; de Queiroz, M.V. Colletotrichum: Species Complexes, Lifestyle, and Peculiarities of Some Sources of Genetic Variability. Appl. Microbiol. Biotechnol. 2020, 104, 1891–1904. [Google Scholar] [CrossRef]
- Moreira, R.R.; Araldi Silva, G.; May De Mio, L.L. Colletotrichum Acutatum Complex Causing Anthracnose on Peach in Brazil. Australas. Plant Pathol. 2020, 49, 179–189. [Google Scholar] [CrossRef]
- Bachmann, H.P.; Bobst, C.; Bütikofer, U.; Casey, M.G.; Dalla Torre, M.; Fröhlich-Wyder, M.T.; Fürst, M. Occurrence and Significance of Fusarium Domesticum Alias Anticollanti on Smear-Ripened Cheeses. LWT-Food Sci. Technol. 2005, 38, 399–407. [Google Scholar] [CrossRef]
- Savary, O.; Coton, E.; Maillard, M.-B.; Gaucheron, F.; Le Meur, C.; Frisvad, J.; Thierry, A.; Jany, J.-L.; Coton, M. Functional Diversity of Bisifusarium Domesticum and the Newly Described Nectriaceae Cheese-Associated Species. Food Res. Int. 2023, 168, 112691. [Google Scholar] [CrossRef]
- Savary, O.; Coton, M.; Frisvad, J.; Nodet, P.; Ropars, J.; Coton, E.; Jany, J.L. Unexpected Nectriaceae Species Diversity in Cheese, Description of Bisifusarium allantoides sp. nov., Bisifusarium penicilloides sp. nov., Longinectria gen. nov. Lagenoides sp. nov. and Longinectria verticilliforme sp. nov. Mycosphere 2021, 12, 1077–1100. [Google Scholar] [CrossRef]
- Schroers, H.-J.; O’Donnell, K.; Lamprecht, S.C.; Kammeyer, P.L.; Johnson, S.; Sutton, D.A.; Rinaldi, M.G.; Geiser, D.M.; Summerbell, R.C. Taxonomy and Phylogeny of the Fusarium Dimerum Species Group. Mycologia 2009, 101, 44–70. [Google Scholar] [CrossRef] [PubMed]
- Walther, G.; Pawłowska, J.; Alastruey-Izquierdo, A.; Wrzosek, M.; Rodriguez-Tudela, J.L.; Dolatabadi, S.; Chakrabarti, A.; de Hoog, G.S. DNA Barcoding in Mucorales: An Inventory of Biodiversity. Persoonia 2013, 30, 11–47. [Google Scholar] [CrossRef] [PubMed]
- Wagner, L.; Stielow, J.B.; de Hoog, G.S.; Bensch, K.; Schwartze, V.U.; Voigt, K.; Alastruey-Izquierdo, A.; Kurzai, O.; Walther, G. A New Species Concept for the Clinically Relevant Mucor Circinelloides Complex. Persoonia 2020, 44, 67–97. [Google Scholar] [CrossRef] [PubMed]
- Lee, S.C.; Billmyre, R.B.; Li, A.; Carson, S.; Sykes, S.M.; Huh, E.Y.; Mieczkowski, P.; Ko, D.C.; Cuomo, C.A.; Heitman, J. Analysis of a Food-Borne Fungal Pathogen Outbreak: Virulence and Genome of a Mucor circinelloides Isolate from Yogurt. mBio 2014, 5, 10. [Google Scholar] [CrossRef]
- Wagner, L.; de Hoog, S.; Alastruey-Izquierdo, A.; Voigt, K.; Kurzai, O.; Walther, G. A Revised Species Concept for Opportunistic Mucor Species Reveals Species-Specific Antifungal Susceptibility Profiles. Antimicrob. Agents Chemother. 2019, 63, e00653-19. [Google Scholar] [CrossRef]

| Species | Strain Number * |
|---|---|
| Alternaria brassicicola | UBOCC-A-101046, UBOCC-A-101047 |
| Alternaria infectoria | EQUASA 414, EQUASA 415 |
| Arthrographis kalrae | API 2104239, API 2104240, API 2104241, API 2104242 |
| Aspergillus amoenus | EQUASA 1271, EQUASA 1423, EQUASA 1492, EQUASA 1502 |
| Aspergillus cibarius | EQUASA 218, EQUASA 610, EQUASA 1328 |
| Aspergillus clavatus | EQUASA 749, EQUASA 822 |
| Aspergillus creber | EQUASA 1424, EQUASA 1425, EQUASA 1491, EQUASA 1499, EQUASA 1504 |
| Aspergillus domesticus | UBOCC-A-115038, UBOCC-A-115040 |
| Aspergillus fischeri | CBS 125813, CBS 483.65 |
| Aspergillus hiratsukae | EQUASA 854, EQUASA 1132, EQUASA 1133, EQUASA 1435 |
| Aspergillus intermedius ** | CBS 108.55, CBS 523.65 NT, CBS 117329, CBS 116.62 |
| Aspergillus jensenii | EQUASA 956, EQUASA 1262, EQUASA 1266, EQUASA 1489 |
| Aspergillus penicilloides | CBS 234.65, CBS 130294 |
| Aspergillus quadricinctus | CBS 135.52 T, CBS 128010 |
| Aspergillus restrictus | UBOCC-A-101080, CBS 541.65 T |
| Aspergillus sojae | CBS 134.52, CBS 100928 NT |
| Aspergillus tabacinus | EQUASA 1018, EQUASA 1427, EQUASA 1488, EQUASA 1500 |
| Berkeleyomyces basicola | EQUASA 1024, EQUASA 1088, EQUASA 1089, UBOCC-A-101281 |
| Candida carpophila | CBS 5256 T, CBS 5257 |
| Candida deformans | EQUASA 711, EQUASA 1313, EQUASA 1314, EQUASA 1320 |
| Candida pseudoglaebosa | CBS 6715 T, UBOCC-A-214189 |
| Candida saitoana | CBS 6729, CBS 940 T |
| Candida variabilis | EQUASA 816, EQUASA 817, EQUASA 1120, EQUASA 1394 |
| Candida versatilis | CBS 1752 T |
| Chrysonilia sitophila | UBOCC-A-101030, UBOCC-A-111120, UBOCC-A-111121, UBOCC-A-111122 |
| Chrysosporium keratinophilum | API 2104246, API 2104247, API 2104248, API 2104249 |
| Cladosporium allicinum | EQUASA 453, EQUASA 1406, EQUASA 1411 |
| Cladosporium bruhnei | EQUASA 239, EQUASA 406, CBS 134.31, CBS 110024 |
| Cladosporium macrocarpum | EQUASA 70, EQUASA 91 |
| Colletotrichum karsti | UBOCC-A-116037, CBS 132134 NT |
| Cunninghamella elegans ** | API 2104252 |
| Cystobasidium minitum ** | UBOCC-A-214063, UBOCC-A-214082 |
| Engyodontium album | EQUASA 474, EQUASA 753, EQUASA 791, EQUASA 1066 |
| Eupenicillium lapidosum | EQUASA 1111, EQUASA 1173, EQUASA 1181, EQUASA 1348 |
| Exophiala bergeri | CBS 351.52, CBS 353.52 T, CBS 102241, CBS 109786, CBS 111662, CBS 119094, CBS 119099 |
| Exophiala lecanii-corni | CBS 232.39 T, API 2101095, API 2101096, API 2101100, API 2101101, API 2101102 |
| Exophiala oligosperma | CBS 725.88 T, API 2101105 |
| Exophiala pisciphila | EQUASA 373, EQUASA 375 |
| Exophiala psychrophila | EQUASA 397, CBS 191.87 T |
| Filobasidium magnum | UBOCC-A-214029, UBOCC-A-214192 |
| Fusarium verticillioides ** | CBS 734.97 |
| Geosmithia swiftii ** | CBS 116927, CBS 110774, CBS 158.67, CBS 296.48 NT |
| Hannaella luteola | API 9312069, API 2102042 |
| Helicostylum elegans | EQUASA 401.02, EQUASA 402.04, EQUASA 302.01, EQUASA 408.01 |
| Hortaea werneckii | EQUASA 88, EQUASA 449, UBOCC-A-201189, UBOCC-A-208029 |
| Hyphopichia pseudoburtonii | CBS 5510, CBS 2455 T, EQUASA 1417 |
| Isomucor fuscus | CBS 254.48 T, UBOCC-A-109168, UBOCC-A-109169, CBS 230.29, UBOCC-A-109167 |
| Kazachstania exigua | CBS 6440, CBS 135 NT |
| Kazachstania unispora | CBS 398 T, UBOCC-A-220043, UBOCC-A-223012, UBOCC-A-223014 |
| Lachancea kluyveri | CBS 3082 T, UBOCC-A-201045 |
| Linnemannia hyalina | EQUASA 281, EQUASA 282 |
| Linnemannia zychae | EQUASA 270, EQUASA 565 |
| Microdochium nivale ** | UBOCC-A-102041, UBOCC-A-105025, UBOCC-A-113085, UBOCC-A-113088 |
| Mucor mucedo | UBOCC-A-109064, CBS 640.67 NT, CBS 887.71 |
| Mucor piriformis | EQUASA 582, CBS 169.25 NT |
| Nigrospora oryzae | CBS 382.50, CBS 384.69 |
| Nigrospora sphaerica | EQUASA 257, EQUASA 685 |
| Paraphyton cookei | API 2104256, API 2104258 |
| Penicillium biforme | UBOCC-A-110150, UBOCC-A-112050, UBOCC-A-112051, UBOCC-A-112052, UBOCC-A-112053 |
| Penicillium charlesii | CBS 304.48 T |
| Penicillium corylophilum ** | EQUASA 86 |
| Penicillium fellutanum | CBS 229.81 NT, UBOCC-A-123037 |
| Penicillium funiculosum | UBOCC-A-101419, UBOCC-A-112140 |
| Penicillium glandicola | CBS 498.75 ET, UBOCC-A-110041 |
| Penicillium griseofulvum | UBOCC-A-101424, UBOCC-A-109220 |
| Penicillium islandicum | UBOCC-A-101425, CBS 394.50, CBS 165.81 |
| Penicillium janczewskii | UBOCC-A-111140, UBOCC-A-113046 |
| Penicillium janthinellum | UBOCC-A-101427, UBOCC-A-111189 |
| Penicillium macrosporum ** | CBS 350.72, CBS 118884, CBS 130.89, CBS 317.63 T |
| Penicillium olsonii | UBOCC-A-117001, UBOCC-A-117002, UBOCC-A-118059, UBOCC-A-118158 |
| Penicillium purpurogenum | CBS 128132, CBS 128133, CBS 184.27 |
| Penicillium rubens | EQUASA 869, EQUASA 954, EQUASA 955, EQUASA 1265, EQUASA 1268, EQUASA 1490, EQUASA 1509 |
| Penicillium rugulosum | EQUASA 936, EQUASA 1506, UBOCC-A-111174, UBOCC-A-111181, UBOCC-A-111190 |
| Penicillium ubiquetum | EQUASA 125, EQUASA 129 |
| Phoma pinodella | UBOCC-A-116004, CBS 531.66, CBS 133.92, CBS 123522, CBS 403.65 |
| Pichia occidentalis | CBS 10322, CBS 6399 |
| Rhinocladiella similis | EQUASA 529, EQUASA 942 |
| Rhizomucor pusillus | UBOCC-A-101365, UBOCC-A-111202, API 2104260, API 2104264 |
| Saccharomyces cariocanus | UBOCC-A-220015, UBOCC-A-220031, UBOCC-A-220045 |
| Saccharomyces uvarum | CBS 377, CBS 395 T, UBOCC-A-201049 |
| Saccharomycopsis fibuligera | UBOCC-A-212006, UBOCC-A-212010, EQUASA 1082, EQUASA 823 |
| Schizophillum commune | API 2104268, API 2104269 |
| Scopulariopsis asperula ** | UBOCC-A-101272, UBOCC-A-108119, UBOCC-A-110145, UBOCC-A-113016 |
| Scopulariopsis candida | UBOCC-A-108117, UBOCC-A-110144, UBOCC-A-113025 |
| Scopulariopsis flava | UBOCC-A-108118, UBOCC-A-113028 |
| Sporobolomyces roseus | UBOCC-A-214093, UBOCC-A-214118, CBS 486 LT |
| Stachybotrys chartarum | API 2104273, API 2104274, API 2104275, API 2104276 |
| Starmerella etchellsii | CBS 1750 T, CBS 1751 |
| Syncephalastrum racemosum | API 2104281, API 2104282 |
| Thamnidium elegans | CBS 642.69, CBS 341.55 |
| Trichoderma atroviride | UBOCC-A-101288 |
| Trichoderma harzianum ** | UBOCC-A-118023, CBS 226.95 NT, UBOCC-A-117301 |
| Trichoderma viride ** | UBOCC-A-101292 |
| Trigonopsis californica | CBS 5383, CBS 5654 |
| Verticillium albo-atrum | EQUASA 1143, UBOCC-A-101307 |
| Verticillium dahliae | UBOCC-A-101312, UBOCC-A-101313, UBOCC-A-101314, UBOCC-A-101317 |
| Verticillium nonalfalfae | EQUASA 203, EQUASA 589, EQUASA 590, UBOCC-A-112135 |
| Wallemia muriae | CBS 116628 NT, CBS 110619, CBS 110624 |
| Xeromyces bisporus | CBS 469.59, CBS 347.94, CBS 236.71 |
| Zygotorulaspora florentina | CBS 748, CBS 6703, CBS 6761 |
| Zygotorulaspora mrakii | UBOCC-A-220020, UBOCC-A-220022, UBOCC-A-220023, UBOCC-A-220024, UBOCC-A-220025 |
| Aspergillus series Nigri | |
| Aspergillus brasiliensis ** | ATCC 16404 |
| Aspergillus luchuensis (ex Aspergillus coreanus) | CBS 119384, EQUASA 756, EQUASA 1073, EQUASA 1170 |
| Aspergillus eucalypticola | CBS 122712 HT |
| Aspergillus niger (ex Aspergillus foetidus) *** | CBS 114.49, CBS 121.28 NT |
| Aspergillus niger (ex Aspergillus lacticoffeatus) *** | CBS 101884, CBS 101885, CBS 101886 |
| Aspergillus luchuensis (ex Aspergillus piperis) | CBS 112811, CBS 113.52, CBS 113.33 |
| Aspergillus niger *** | API 1006067, API 1006068, API 1105141, API 1212008, UBOCC-A-101072, UBOCC-A-101075, CBS 554.65, UBOCC-A-112064, UBOCC-A-112068, UBOCC-A-112080, UBOCC-A-112082 |
| Aspergillus tubingensis ** | CBS 115656 HT, CBS 115657, CBS 132411, CBS 563.65, CBS 115574 |
| Aspergillus vadensis | CBS 113226, CBS 113365 |
| Bisifusarium dimerum complex | |
| Bisifusarium allantoides | UBOCC-A-120035, UBOCC-A-120036, UBOCC-A-120037 |
| Bisifusarium biseptatum | CBS 110138, CBS 110306, CBS 110144 |
| Bisifusarium delphinoides | CBS 115321, CBS 101047 |
| Bisifusarium dimerum *** | SA132479, SA131363, SA131166 |
| Bisifusarium domesticum *** | UBOCC-A-109095, UBOCC-A-113010, CBS 244.82 |
| Bisifusarium lunatum | UBOCC-A-118038, CBS 632.76 NT |
| Bisifusarium nectrioides | CBS 176.31 LT |
| Bisifusarium penicillioides | UBOCC-A-120021 T, UBOCC-A-120034, UBOCC-A-120054 |
| Bisifusarium penzigii | CBS 317.34 HT, EQUASA 1440, EQUASA 1441, EQUASA 1442 |
| Colletotrichum acutatum complex | |
| Colletotrichum acutatum | UBOCC-A-117265, CBS 126505, CBS 129952, CBS 129914 |
| Colletotrichum fioriniae | UBOCC-A-116032, UBOCC-A-117425, CBS 128517 T, UBOCC-A-116034, UBOCC-A-116033, UBOCC-A-121023, UBOCC-A-103034 |
| Colletotrichum godetiae | CBS 133.44 T, UBOCC-A-121017, UBOCC-A-121021, UBOCC-A-115012 |
| Colletotrichum lupini | UBOCC-A-118145, UBOCC-A-118146, UBOCC-A-118147, CBS 109221 HT, CBS 109225 |
| Colletotrichum nymphaeae | UBOCC-A-117287, CBS 515.78 ET |
| Colletotrichum gloeosporioides complex | |
| Colletotrichum fructicola | UBOCC-A-118064, UBOCC-A-118065 |
| Colletotrichum gloeosporioides | UBOCC-A-116039, UBOCC-A-116038, UBOCC-A-116036 |
| Colletotrichum musae | UBOCC-A-121003, UBOCC-A-121004 |
| Colletotrichum siamense | UBOCC-A-121006, UBOCC-A-121020, CBS 125379 |
| Colletotrichum tropicale | UBOCC-A-121005, CBS 124949 HT, CBS 125389 |
| Mucor circinelloides complex | |
| Mucor bainieri | CBS 293.63 IT |
| Mucor circinelloides *** | UBOCC-A-109182, UBOCC-A-109183, CBS 195.68, UBOCC-A-109192 |
| Mucor ctenidius | CBS 433.87, CBS 696.76, CBS 293.66 |
| Mucor griseocyanus | CBS 116.08, CBS 223.56 |
| Mucor janssenii | CBS 232.29, CBS 185.68, CBS 205.68 |
| Mucor lusitanicus | CBS 633.65, CBS 851.71, CBS 242.33 |
| Mucor ramosissimus | CBS 135.65 NT |
| Mucor variicolumellatus | CBS 236.35 HT |
| Mucor velutinosus ** | EQUASA 1551 |
| Thamnidium anomalum | CBS 697.76, CBS 243.57 T |
| Species | Strain Number |
|---|---|
| Alternaria brassicicola | M1-0046 |
| Arthrographis kalrae * | API 2104244 |
| Aspergillus amoenus * | EQUASA 1261 |
| Aspergillus cibarius * | EQUASA 610 |
| Aspergillus creber * | EQUASA 491, EQUASA 1169 |
| Aspergillus hiratsukae * | EQUASA 1436 |
| Aspergillus jensenii * | EQUASA 2677 |
| Aspergillus tubingensis * | M1-0085 |
| Aureobasidium pullulans | L1-0011 |
| Bisifusarium biseptatum / penzigii * | EQUASA 1442 |
| Botrytis cinerea | M1-0123, M2-0036 |
| Candida famata | L1-0009 |
| Candida guilliermondii | L1-0006 |
| Candida hellenica | L1-0022 |
| Candida pulcherrima | L2-0005 |
| Chrysonilia sitophila * | UBOCC-A-111123, UBOCC-A-111124 |
| Chrysosporium keratinophilum * | API 2104251 |
| Cladosporium cladosporioides complex | M1-0045, M1-0126, M2-0041 |
| Cladosporium snafimbriatum ** | M2-0010 |
| Cladosporium oxysporum | M1-0011 |
| Cladosporium ramotenellum | M1-0014 |
| Colletotrichum lupini * | UBOCC-A-118080, UBOCC-A-118081 |
| Engyodontium album * | EQUASA 473 |
| Eupenicillium lapidosum * | EQUASA 1446 |
| Exophiala dermatitidis | L1-0023 |
| Fusarium proliferatum | M1-0077, M1-0116 |
| Fusarium sambucinum | M1-0137 |
| Fusarium solani complex | M1-0061 |
| Geotrichum candidum | M1-0054 |
| Hortaea werneckii * | EQUASA 680, EQUASA 1364, EQUASA 1365 |
| Kloeckera apiculata | L1-0015 |
| Microdochium nivale * | UBOCC-A-102027 |
| Mucor brunneogriseus ** | M1-0063 |
| Mucor circinelloides | M1-0152 |
| Mucor plumbeus | M1-0139, M1-0153 |
| Mucor piriformis * | M2-0003 |
| Papiliotrema laurentii | L1-0007 |
| Penicillium adametzioides | M1-0020 |
| Penicillium aurantiogriseum | M1-0150 |
| Penicillium aurantiogriseum var. polonicum | M1-0001 |
| Penicillium biforme * | UBOCC-A-112057, UBOCC-A-112058, UBOCC-A-112059 |
| Penicillium brevicompactum | M1-0025 |
| Penicillium citrinum | M1-0049 |
| Penicillium crustosum | M1-0134, M1-0149 |
| Penicillium digitatum | M2-0006 |
| Penicillium expansum | M1-0079 |
| Penicillium glabrum | M2-0033 |
| Penicillium italicum | M1-0144 |
| Penicillium olsonii * | UBOCC-A-118177, UBOCC-A-118178 |
| Penicillium paneum | M1-0109 |
| Penicillium rubens * | EQUASA 1459, EQUASA 1448 |
| Penicillium solitum | M1-0047 |
| Phoma glomerata | M1-0108, CBS 318.90 |
| Rhizopus stolonifer | M1-0098 |
| Rhodotorula babjevae ** | L1-0002 |
| Rhodotorula mucilaginosa | L1-0018 |
| Sporobolomyces roseus * | UBOCC-A-208018 |
| Trichoderma harzianum * | M1-0140 |
| Trichoderma viride/ghanense * | M1-0081 |
| Verticillium nonalfalfae * | EQUASA 526 |
| Zygotorulaspora mrakii * | UBOCC-A-220032, UBOCC-A-220040 |
| Species | Overall Correct (%) (1) | Single Choice (%) | Low Discrimination (%) | No Identification (%) | Discordant (%) |
|---|---|---|---|---|---|
| Alternaria brassicicola | 100 | 100 | 0 | 0 | 0 |
| Alternaria infectoria | 100 | 100 | 0 | 0 | 0 |
| Arthrographis kalrae | 100 | 100 | 0 | 0 | 0 |
| Aspergillus amoenus | 100 | 89.47 | 10.53 | 0 | 0 |
| Aspergillus cibarius | 100 | 100 | 0 | 0 | 0 |
| Aspergillus clavatus | 98.53 | 98.53 | 0 | 1.47 | 0 |
| Aspergillus creber | 89.19 | 81.08 | 8.11 | 10.81 | 0 |
| Aspergillus domesticus | 100 | 100 | 0 | 0 | 0 |
| Aspergillus fischeri | 76.92 | 69.23 | 7.69 | 7.69 | 15.38 |
| Aspergillus hiratsukae | 98.36 | 98.36 | 0 | 1.64 | 0 |
| Aspergillus intermedius * | 100 | 100 | 0 | 0 | 0 |
| Aspergillus jensenii | 90.91 | 86.36 | 4.55 | 4.55 | 4.55 |
| Aspergillus penicilloides | 100 | 100 | 0 | 0 | 0 |
| Aspergillus quadricinctus | 92.86 | 92.86 | 0 | 7.14 | 0 |
| Aspergillus restrictus | 87.5 | 87.5 | 0 | 3.13 | 9.38 |
| Aspergillus sojae | 100 | 100 | 0 | 0 | 0 |
| Aspergillus tabacinus | 100 | 97.62 | 2.38 | 0 | 0 |
| Berkeleyomyces basicola | 100 | 100 | 0 | 0 | 0 |
| Candida carpophila | 91.67 | 91.67 | 0 | 8.33 | 0 |
| Candida deformans | 100 | 100 | 0 | 0 | 0 |
| Candida pseudoglaebosa | 100 | 100 | 0 | 0 | 0 |
| Candida saitoana | 100 | 100 | 0 | 0 | 0 |
| Candida variabilis | 100 | 93.75 | 6.25 | 0 | 0 |
| Candida versatilis | 100 | 100 | 0 | 0 | 0 |
| Chrysonilia sitophila | 100 | 100 | 0 | 0 | 0 |
| Chrysosporium keratinophilum | 100 | 100 | 0 | 0 | 0 |
| Cladosporium allicinum | 100 | 100 | 0 | 0 | 0 |
| Cladosporium bruhnei | 100 | 100 | 0 | 0 | 0 |
| Cladosporium macrocarpum | 85.71 | 42.86 | 42.86 | 7.14 | 7.14 |
| Colletotrichum karsti | 90 | 90 | 0 | 10 | 0 |
| Cunninghamella elegans * | 100 | 100 | 0 | 0 | 0 |
| Cystobasidium minitum * | 97.44 | 87.18 | 10.26 | 2.56 | 0 |
| Engyodontium album | 94.12 | 94.12 | 0 | 5.88 | 0 |
| Eupenicillium lapidosum | 100 | 100 | 0 | 0 | 0 |
| Exophiala bergeri | 96.55 | 96.55 | 0 | 1.72 | 1.72 |
| Exophiala lecanii-corni | 100 | 100 | 0 | 0 | 0 |
| Exophiala oligosperma | 100 | 100 | 0 | 0 | 0 |
| Exophiala pisciphila | 100 | 100 | 0 | 0 | 0 |
| Exophiala psychrophila | 100 | 100 | 0 | 0 | 0 |
| Filobasidium magnum | 100 | 100 | 0 | 0 | 0 |
| Fusarium verticillioides * | 73.53 | 73.53 | 0 | 18.18 | 0 |
| Geosmithia swiftii * | 100 | 100 | 0 | 0 | 0 |
| Hannaella luteola | 81.82 | 81.82 | 0 | 18.18 | 0 |
| Helicostylum elegans | 100 | 100 | 0 | 0 | 0 |
| Hortaea werneckii | 100 | 100 | 0 | 0 | 0 |
| Hyphopichia pseudoburtonii | 100 | 100 | 0 | 0 | 0 |
| Isomucor fuscus | 100 | 100 | 0 | 0 | 0 |
| Kazachstania exigua | 100 | 100 | 0 | 0 | 0 |
| Kazachstania unispora | 100 | 100 | 0 | 0 | 0 |
| Lachancea kluyveri | 100 | 100 | 0 | 0 | 0 |
| Linnemannia hyalina | 100 | 100 | 0 | 0 | 0 |
| Linnemannia zychae | 100 | 100 | 0 | 0 | 0 |
| Microdochium nivale * | 100 | 100 | 0 | 0 | 0 |
| Mucor mucedo | 100 | 100 | 0 | 0 | 0 |
| Mucor piriformis | 95 | 95 | 0 | 5 | 0 |
| Nigrospora oryzae | 100 | 100 | 0 | 0 | 0 |
| Nigrospora sphaerica | 100 | 100 | 0 | 0 | 0 |
| Paraphyton cookei | 100 | 100 | 0 | 0 | 0 |
| Penicillium biforme | 100 | 87.72 | 12.28 | 0 | 0 |
| Penicillium charlesii | 90 | 80 | 10 | 10 | 0 |
| Penicillium corylophilum * | 100 | 100 | 0 | 0 | 0 |
| Penicillium fellutanum | 100 | 100 | 0 | 0 | 0 |
| Penicillium funiculosum | 100 | 93.75 | 6.25 | 0 | 0 |
| Penicillium glandicola | 100 | 100 | 0 | 0 | 0 |
| Penicillium griseofulvum | 100 | 100 | 0 | 0 | 0 |
| Penicillium islandicum | 100 | 100 | 0 | 0 | 0 |
| Penicillium janczewskii | 100 | 100 | 0 | 0 | 0 |
| Penicillium janthinellum | 100 | 100 | 0 | 0 | 0 |
| Penicillium macrosporum * | 98.57 | 98.57 | 0 | 1.43 | 0 |
| Penicillium olsonii | 100 | 100 | 0 | 0 | 0 |
| Penicillium purpurogenum | 93.33 | 93.33 | 0 | 3.33 | 3.33 |
| Penicillium rubens | 100 | 96.43 | 3.57 | 0 | 0 |
| Penicillium rugulosum | 100 | 100 | 0 | 0 | 0 |
| Penicillium ubiquetum | 95.65 | 95.65 | 0 | 4.35 | 0 |
| Phoma pinodella | 100 | 100 | 0 | 0 | 0 |
| Pichia occidentalis | 100 | 100 | 0 | 0 | 0 |
| Rhinocladiella similis | 92.86 | 92.86 | 0 | 7.14 | 0 |
| Rhizomucor pusillus | 100 | 100 | 0 | 0 | 0 |
| Saccharomyces cariocanus | 100 | 100 | 0 | 0 | 0 |
| Saccharomyces uvarum | 100 | 100 | 0 | 0 | 0 |
| Saccharomycopsis fibuligera | 100 | 100 | 0 | 0 | 0 |
| Schizophillum commune | 100 | 100 | 0 | 0 | 0 |
| Scopulariopsis asperula * | 100 | 100 | 0 | 0 | 0 |
| Scopulariopsis candida | 100 | 100 | 0 | 0 | 0 |
| Scopulariopsis flava | 100 | 100 | 0 | 0 | 0 |
| Sporobolomyces roseus | 100 | 100 | 0 | 0 | 0 |
| Stachybotrys chartarum | 100 | 100 | 0 | 0 | 0 |
| Starmerella etchellsii | 100 | 100 | 0 | 0 | 0 |
| Syncephalastrum racemosum | 100 | 100 | 0 | 0 | 0 |
| Thamnidium elegans | 100 | 100 | 0 | 0 | 0 |
| Trichoderma atroviride | 100 | 0 | 100 | 0 | 0 |
| Trichoderma harzianum * | 100 | 100 | 0 | 0 | 0 |
| Trichoderma viride * | 100 | 0 | 100 | 0 | 0 |
| Trigonopsis californica | 100 | 100 | 0 | 0 | 0 |
| Verticillium albo-atrum | 100 | 0 | 100 | 0 | 0 |
| Verticillium dahliae | 97.37 | 97.37 | 0 | 2.63 | 0 |
| Verticillium nonalfalfae | 100 | 0 | 100 | 0 | 0 |
| Wallemia muriae | 100 | 100 | 0 | 0 | 0 |
| Xeromyces bisporus | 96.67 | 96.67 | 0 | 3.33 | 0 |
| Zygotorulaspora florentina | 100 | 100 | 0 | 0 | 0 |
| Zygotorulaspora mrakii | 100 | 100 | 0 | 0 | 0 |
| Aspergillus nigri section | |||||
| Aspergillus brasiliensis * | 100 | 100 | 0 | 0 | 0 |
| Aspergillus luchuensis (ex Aspergillus coreanus) | 96.97 | 96.97 | 0 | 3.03 | 0 |
| Aspergillus eucalypticola | 100 | 0 | 100 | 0 | 0 |
| Aspergillus niger (ex Aspergillus foetidus) ** | 100 | 100 | 0 | 0 | 0 |
| Aspergillus niger (ex Aspergillus lacticoffeatus) ** | 100 | 100 | 0 | 0 | 0 |
| Aspergillus luchuensis (ex Aspergillus piperis) | 77.27 | 0 | 77.27 | 4.55 | 18.18 |
| Aspergillus niger ** | 100 | 100 | 0 | 0 | 0 |
| Aspergillus tubingensis * | 91.15 | 91.15 | 0 | 4.42 | 4.42 |
| Aspergillus vadensis | 100 | 100 | 0 | 0 | 0 |
| Bisifusarium dimerum complex | |||||
| Bisifusarium allantoides | 100 | 100 | 0 | 0 | 0 |
| Bisifusarium biseptatum | 100 | 100 | 0 | 0 | 0 |
| Bisifusarium delphinoides | 100 | 0 | 100 | 0 | 0 |
| Bisifusarium dimerum ** | 100 | 100 | 0 | 0 | 0 |
| Bisifusarium domesticum ** | 100 | 100 | 0 | 0 | 0 |
| Bisifusarium lunatum | 100 | 100 | 0 | 0 | 0 |
| Bisifusarium nectrioides | 100 | 0 | 100 | 0 | 0 |
| Bisifusarium penicillioides | 100 | 100 | 0 | 0 | 0 |
| Bisifusarium penzigii | 100 | 100 | 0 | 0 | 0 |
| Colletotrichum acutatum complex | |||||
| Colletotrichum acutatum | 100 | 100 | 0 | 0 | 0 |
| Colletotrichum fioriniae | 100 | 100 | 0 | 0 | 0 |
| Colletotrichum godetiae | 90.48 | 90.48 | 0 | 9.52 | 0 |
| Colletotrichum lupini | 100 | 100 | 0 | 0 | 0 |
| Colletotrichum nymphaeae | 100 | 100 | 0 | 0 | 0 |
| Colletotrichum gloeosporioides complex | |||||
| Colletotrichum fructicola | 100 | 100 | 0 | 0 | 0 |
| Colletotrichum gloeosporioides | 100 | 100 | 0 | 0 | 0 |
| Colletotrichum musae | 100 | 100 | 0 | 0 | 0 |
| Colletotrichum siamense | 82.14 | 0 | 82.14 | 17.86 | 0 |
| Colletotrichum tropicale | 73.68 | 0 | 73.68 | 26.32 | 0 |
| Mucor circinelloides complex | |||||
| Mucor bainieri | 100 | 0 | 100 | 0 | 0 |
| Mucor circinelloides ** | 100 | 100 | 0 | 0 | 0 |
| Mucor ctenidius | 100 | 100 | 0 | 0 | 0 |
| Mucor griseocyanus | 100 | 100 | 0 | 0 | 0 |
| Mucor janssenii | 100 | 100 | 0 | 0 | 0 |
| Mucor lusitanicus | 100 | 0 | 100 | 0 | 0 |
| Mucor ramosissimus | 100 | 0 | 100 | 0 | 0 |
| Mucor variicolumellatus | 100 | 0 | 100 | 0 | 0 |
| Mucor velutinosus * | 95 | 95 | 0 | 5 | 0 |
| Thamnidium anomalum | 100 | 100 | 0 | 0 | 0 |
| Species (Number of Strains) | Number of Spectra | Number of Correct Identification | Number of No Identification | Number of Misidentification | |
|---|---|---|---|---|---|
| Species present in the database | |||||
| Alternaria brassicicola | 1 | 2 | 2 | ||
| Arthrographis kalrae | 1 | 4 | 2 | 2 | |
| Aspergillus amoenus | 1 | 4 | 4 | ||
| Aspergillus cibarius | 1 | 4 | 4 | ||
| Aspergillus creber | 2 | 12 | 6 | 2 | 4 (Aspergillus versicolor) |
| Aspergillus hiratsukae | 2 | 6 | 6 | ||
| Aspergillus jensenii | 1 | 3 | 2 | 1 | |
| Aspergillus tubingensis | 1 | 2 | 2 | ||
| Aureobasidium pullulans | 1 | 2 | 2 | ||
| Bisifusarium biseptatum / penzigii | 1 | 4 | 4 | ||
| Botrytis cinerea | 2 | 4 | 4 | ||
| Candida famata | 1 | 2 | 2 | ||
| Candida guilliermondii | 1 | 2 | 2 | ||
| Candida hellenica | 1 | 2 | 2 | ||
| Candida pulcherrima | 1 | 2 | 2 | ||
| Chrysonilia sitophila | 2 | 10 | 10 | ||
| Chrysosporium keratinophilum | 1 | 4 | 2 | 2 | |
| Cladosporium cladosporioides complex | 3 | 6 | 6 | ||
| Cladosporium oxysporum | 1 | 2 | 2 | ||
| Cladosporium ramotenellum | 1 | 2 | 2 | ||
| Colletotrichum lupini | 2 | 8 | 8 | ||
| Engyodontium album | 1 | 6 | 5 | 1 | |
| Eupenicillium lapidosum | 1 | 4 | 4 | ||
| Exophiala dermatitidis | 1 | 2 | 2 | ||
| Fusarium proliferatum | 2 | 4 | 4 | ||
| Fusarium sambucinum | 1 | 2 | 2 | ||
| Fusarium solani complex | 1 | 2 | 1 | 1 | |
| Geotrichum candidum | 1 | 2 | 2 | ||
| Hortaea werneckii | 3 | 6 | 5 | 1 | |
| Kloeckera apiculata | 1 | 2 | 2 | ||
| Microdochium nivale | 1 | 5 | 5 | ||
| Mucor circinelloides | 1 | 2 | 2 | ||
| Mucor plumbeus | 2 | 4 | 3 | 1 | |
| Mucor piriformis | 1 | 2 | 2 | ||
| Papiliotrema laurentii | 1 | 2 | 1 | 1 | |
| Penicillium adametzioides | 1 | 2 | 2 | ||
| Penicillium aurantiogriseum | 1 | 2 | 2 | ||
| Penicillium aurantiogriseum var. polonicum | 1 | 2 | 2 | ||
| Penicillium biforme | 3 | 12 | 10 | 2 | |
| Penicillium brevicompactum | 1 | 2 | 2 | ||
| Penicillium citrinum | 1 | 2 | 2 | ||
| Penicillium crustosum | 2 | 4 | 4 | ||
| Penicillium digitatum | 1 | 2 | 2 | ||
| Penicillium expansum | 1 | 2 | 2 | ||
| Penicillium glabrum | 1 | 2 | 2 | ||
| Penicillium italicum | 1 | 2 | 2 | ||
| Penicillium olsonii | 2 | 8 | 8 | ||
| Penicillium paneum | 1 | 2 | 2 | ||
| Penicillium rubens | 2 | 8 | 8 | ||
| Penicillium solitum | 1 | 2 | 2 | ||
| Phoma glomerata | 2 | 6 | 6 | ||
| Rhizopus stolonifer | 1 | 2 | 2 | ||
| Rhodotorula mucilaginosa | 1 | 2 | 2 | ||
| Sporobolomyces roseus | 1 | 2 | 2 | ||
| Trichoderma harzianum | 1 | 2 | 2 | ||
| Trichoderma viride/ghanense | 1 | 2 | 2 | ||
| Verticillium nonalfalfae | 1 | 2 | 2 | ||
| Zygotorulaspora mrakii | 1 | 4 | 2 | 2 | |
| Species absent in the database | |||||
| Cladosporium snafimbriatum | 1 | 2 | 2 (Cladosporium allicinum and Cladosporium macrocarpum) | ||
| Mucor brunneogriseus | 1 | 2 | 2 | ||
| Rhodotorula babjevae | 1 | 2 | 2 | ||
Disclaimer/Publisher’s Note: The statements, opinions and data contained in all publications are solely those of the individual author(s) and contributor(s) and not of MDPI and/or the editor(s). MDPI and/or the editor(s) disclaim responsibility for any injury to people or property resulting from any ideas, methods, instructions or products referred to in the content. |
© 2024 by the authors. Licensee MDPI, Basel, Switzerland. This article is an open access article distributed under the terms and conditions of the Creative Commons Attribution (CC BY) license (https://creativecommons.org/licenses/by/4.0/).
Share and Cite
Rolland, N.; Girard, V.; Monnin, V.; Arend, S.; Perrin, G.; Ballan, D.; Beau, R.; Collin, V.; D’Arbaumont, M.; Weill, A.; et al. Identification of Food Spoilage Fungi Using MALDI-TOF MS: Spectral Database Development and Application to Species Complex. J. Fungi 2024, 10, 456. https://doi.org/10.3390/jof10070456
Rolland N, Girard V, Monnin V, Arend S, Perrin G, Ballan D, Beau R, Collin V, D’Arbaumont M, Weill A, et al. Identification of Food Spoilage Fungi Using MALDI-TOF MS: Spectral Database Development and Application to Species Complex. Journal of Fungi. 2024; 10(7):456. https://doi.org/10.3390/jof10070456
Chicago/Turabian StyleRolland, Nolwenn, Victoria Girard, Valérie Monnin, Sandrine Arend, Guillaume Perrin, Damien Ballan, Rachel Beau, Valérie Collin, Maëlle D’Arbaumont, Amélie Weill, and et al. 2024. "Identification of Food Spoilage Fungi Using MALDI-TOF MS: Spectral Database Development and Application to Species Complex" Journal of Fungi 10, no. 7: 456. https://doi.org/10.3390/jof10070456
APA StyleRolland, N., Girard, V., Monnin, V., Arend, S., Perrin, G., Ballan, D., Beau, R., Collin, V., D’Arbaumont, M., Weill, A., Deniel, F., Tréguer, S., Pawtowski, A., Jany, J.-L., & Mounier, J. (2024). Identification of Food Spoilage Fungi Using MALDI-TOF MS: Spectral Database Development and Application to Species Complex. Journal of Fungi, 10(7), 456. https://doi.org/10.3390/jof10070456