Abstract
Land cover on the Mississippi–Alabama barrier islands was surveyed in 2010–2011 as part of continuing research on island geomorphic and vegetation dynamics following the 2005 impact of Hurricane Katrina. Results of the survey include sub-meter GPS location, a listing of dominant vegetation species and field photographs recorded at 375 sampling locations distributed among Cat, West Ship, East Ship, Horn, Sand, Petit Bois and Dauphin Islands. The survey was conducted in a period of intensive remote sensing data acquisition over the northern Gulf of Mexico by federal, state and commercial organizations in response to the 2010 Macondo Well (Deepwater Horizon) oil spill. The data are useful in providing ground reference information for thematic classification of remotely-sensed imagery, and a record of land cover which may be used in future research.
Data Set: https://dx.doi.org/10.18785/geo.landcover.ds.1 for .gdb file; ds.2 for .xml metadata file, or ds.3 for .kmz file. Also at http://aquila.usm.edu/ms_al_island_landcover_2010_2011/1/.
Data Set License: CC-BY
1. Summary
The data described herein were collected in a May 2010, through July 2011, field survey that recorded land cover features on Cat, West and East Ship, Horn, Sand and Petit Bois Islands in Mississippi and western and central Dauphin Island in Alabama, U.S.A., northern Gulf of Mexico (Figure 1). The survey was conducted 5–6 years after the islands were impacted severely by Hurricane Katrina on 29 August 2005. On its northerly path, the eye of the storm passed 50–150 km due west of the islands, subjecting them to hurricane-force winds and storm tidal depths which decreased eastward from 7 to 9 m on Cat and Ship, respectively [1], and up to 12 m on W. Ship [2], to 3.5 m on western and central Dauphin [1]. Island geomorphic features were substantially altered by erosion and sand overwash [2,3,4,5,6,7], while vegetation was further affected by wind damage, salt spray, saltwater flooding and a post-storm drought of several months [6,7]. Also prior to the 2010–2011 field survey, the Gulf shorelines of Ship, Horn and Petit Bois Islands were eroded in Hurricane Gustav on 1 September 2008 [8]. Furthermore, the survey was in-progress during the 2010 Macondo Well (Deepwater Horizon platform) oil spill.
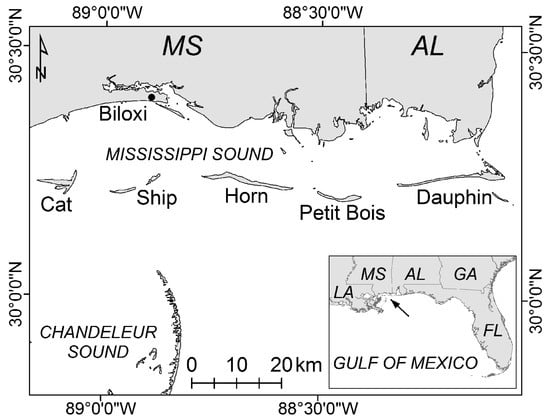
Figure 1.
Location of the Mississippi–Alabama barrier islands in the northern Gulf of Mexico.
In the years since Hurricane Katrina, and particularly following the oil spill, remotely-sensed data have been acquired extensively over the northern Gulf of Mexico by government and commercial organizations. The resulting availability of high-spatial-resolution data from aircraft and satellites has facilitated quantitative assessments of vegetation re-growth and change in habitat-types on the Mississippi–Alabama (MS–AL) islands [7]. In such studies, on-the-ground observations greatly improve the ability of investigators to interpret remotely-sensed data and thus map features of interest over extensive geographic areas. To date, the 2010–2011 MS–AL island field survey data have been used in combination with remotely-sensed data in several studies which addressed post-Katrina changes in geomorphic features and vegetation, and decadal-scale resiliency of the islands to coastal subsidence and eustatic sea-level rise [9,10,11]. A World-Wide-Web link is provided to allow users to download the survey data for access in ArcMap (ESRI) or Open Geospatial Consortium (OGC) viewers such as Google Earth and ArcGIS Earth.
2. Data Description
The dataset is available in two different file formats: (1) an ArcGIS v10.3 [12] geodatabase file (.gdb) with one feature dataset containing seven individual island feature classes with sample point information, field photographs attached as binary large objects (BLOBS), relationship classes, and attachment tables; and (2) a compressed keyhole markup language file (.kmz) for each island containing sample point information and attached field photographs.
Data
Each island feature class in the geodatabase has its own accompanying attribute table organized by object identification number and includes fields for comments (sample point name), GPS date, projection northing and easting, latitude and longitude, primary species and secondary species (Table 1). It also includes field notes identifying other plant species in the vicinity, or a brief description of the soil surface if no vegetation was present. Photographs in the geodatabase feature classes can be viewed from the ArcMap Identify function as attachments (Figure 2). The photograph filenames are comprised of island name, sample-point name, and an indication of view direction given as cardinal magnetic compass direction (N, E, S, or W). Attribute data in the .kmz files are identical to the data provided in the ArcGIS geodatabase. However, due to the large file size, and to ensure full functionality, the .kmz files must be uncompressed into .kml files. With either the .gdb or .kml formats, photograph extraction enables access to technical specifications, such as the type of camera used, via photo-viewing software. Data files are organized by island name. The compressed OGC .kmz files range in size from 96 MB for Sand Island to 1.23 GB for Cat. The ArcGIS v10.3 .gdb file is compressed to 3.6 GB and includes the data for all islands.

Table 1.
Attribute table field properties for the ArcGIS geodatabase feature classes.
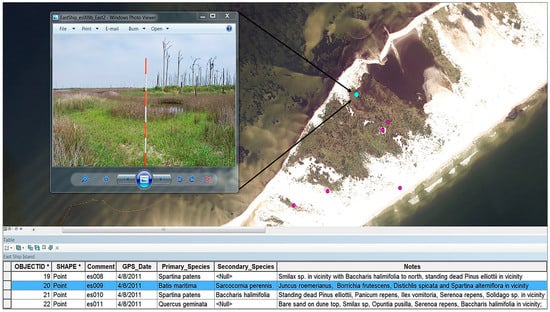
Figure 2.
An example of how land cover data acquired in the present study may be displayed (ArcMap). The small circles shown on the island image represent ground sampling locations. By selecting a point in a .kml or .gdb file, the user can view the associated attribute table and field photographs.
3. Methods
Ground point locations for surveying land cover on each island were selected randomly from georectified digital imagery at an approximate specific sampling area (reciprocal of sampling density) of 6 ha per point (Table 2). Sampling density was based on earlier studies which utilized randomly-positioned line transects in assessing plant species richness and habitat change on Horn Island [7,13,14]. The present survey employed the geographic centers of those transects as the Horn sampling points, along with new randomly-positioned points which were added in order to sample vegetated areas that were not considered in the earlier studies. Generally, the large expanse of bare sand on Horn was not field-sampled. At a density of one point per 6 ha of land area, this would have required nearly a doubling of ground point locations, whereas bare sand could be mapped with relative ease from aerial or satellite image data. For the remaining islands, sampling points were positioned randomly using ENVI software [15] from SPOT-5, 10-m multispectral coverage [16]. In contrast with methods for Horn Island, bare sand areas were included in the randomized sampling of all other islands because they were much less extensive.
Table 2.
Chronology of sampling land cover on the Mississippi–Alabama barrier islands in 2010–2011.
In the field, a GPS unit with sub-meter-accuracy (Trimble, Geo Explorer 2003 Series) [17] was used to navigate to a given randomly-prepositioned point where field GPS location (WGS-84 datum, UTM 16N projection) and date were recorded. If the prepositioned point happened to fall in standing water, it was moved to the nearest above-water area unless emergent vegetation was present. Submerged aquatic vegetation was not sampled. After the initial sampling day (6 May 2010), a fiberglass range pole with alternating 0.3 m (1 ft.) orange and white segments was used to mark point location. If vegetation was present, primary and secondary dominant plant species were determined by visual estimations of abundance within approximately 10 m to 20 m of the point. Also noted were any additional species which might have been found within the same vicinity of the point. The pole and vicinity were photographed using a Nikon model D-60 SLR digital camera with Nikon 18–55 mm f/3.5–5.6G VR AF-S DX lens set at the 18 mm focal length to achieve a wide field-of-view. Beginning on Horn Island, 16 June 2010, and with improved methodological consistency thereafter, the pole and vicinity were photographed first with a view toward magnetic north, then east, south, and west; i.e., clockwise beginning with the view northward. Where tree canopies or other tall objects were present near the point, more than one photograph was taken in a given compass direction to capture mid-canopy to upper-canopy features such as greenness and structure. In the laboratory, the photos were associated with sampling-point GPS coordinates utilizing ArcGIS attachment functions.
A total of 375 points were surveyed in 2010–2011 over a span of approximately 15 months (Table 2). The survey began on Horn Island, where 111 points were sampled during 6 May through 8 October 2010. Based on estimates derived from the SPOT-5 imagery, bare sand was the dominant surface feature on approximately 585 ha of Horn. Thus, of Horn’s 1265 ha total land area, 680 ha were sampled at the approximate specific area of 6 ha per point. Western and central Dauphin Island and Sand Island also were surveyed in 2010. Dauphin Island east of longitude 88.2 degrees, the only significantly-inhabited portion of the island chain, was not included in the field survey. Sampling of the 61 points on Petit Bois began in November 2010, and was completed in January, 2011. Cat Island was surveyed from 28 January through 6 May 2011. Specific sampling area on Cat was slightly greater than on the other islands (Table 2) because some privately-owned areas on the island were not surveyed. Field sampling was completed with surveys of East Ship in April and West Ship in May–July 2011.
Acknowledgments
This survey was supported by grants from NOAA and the NASA Applied Sciences Program, and was conducted under research permits from the U.S. National Park Service, Gulf Islands National Seashore. Thanks to David Mooneyhan, Chris Brown and Les Graham for data management and technological support, and to Josh Cromwell for making our data available for download from the Aquila Digital Community at the University of Southern Mississippi.
Author Contributions
All authors contributed to writing the manuscript. Gregory A. Carter conceived the project, designed the sampling methods, pre-positioned survey points from SPOT-5 data and wrote the initial manuscript draft. The field survey was conducted by Gregory A. Carter and Kelly L. Lucas. Plant species were identified by Kelly L. Lucas. Field photographs were taken and GPS positions recorded by Gregory A. Carter. The original .gdb and .kml files were created by Nathan L. Hopper from field GPS positions, notes and photographs. Data representing each field sampling point were checked for quality and accuracy by Carlton P. Anderson. This included renaming and geographically projecting each photograph file and editing the attribute tables. All authors have read and approved the final manuscript.
Conflicts of Interest
The authors declare no conflict of interest.
Abbreviations
The following abbreviations are used in this manuscript:
| BLOB | Binary large object |
| .gdb | geodatabase file |
| .kmz | keyhole markup language file (compressed) |
| .kml | keyhole markup language file (uncompressed) |
| MS–AL | Mississippi–Alabama |
| OGC | Open Geospatial Consortium |
References
- Fritz, R.A.; Blount, C.; Sokoloski, R.; Singleton, J.; Fuggle, A.; Mcadoo, B.G.; Moore, A.; Grass, C.; Tate, B. Hurricane Katrina storm surge distribution and field observations on the Mississippi barrier islands. Estuar. Coast. Shelf Sci. 2007, 74, 12–20. [Google Scholar] [CrossRef]
- Morton, R.A. First-order controls of extreme-storm impacts on the Mississippi–Alabama barrier-island chain. J. Coast. Res. 2010, 26, 635–648. [Google Scholar] [CrossRef]
- Feagin, R.A.; Williams, A.M. Sediment spatial patterns in a Hurricane Katrina overwash fan on Dauphin Island, Alabama, U.S.A. J. Coast. Res. 2008, 24, 1063–1070. [Google Scholar] [CrossRef]
- Froede, C.R. Changes to Dauphin Island, Alabama, brought about by Hurricane Katrina (August 29, 2005). J. Coast. Res. 2008, 24, 110–117. [Google Scholar] [CrossRef]
- Morton, R.A. Historical changes in the Mississippi–Alabama barrier islands and the roles of extreme storms, sea level and human activities. J. Coast. Res. 2008, 24, 1587–1600. [Google Scholar] [CrossRef]
- Otvos, E.G.; Carter, G.A. Hurricane degradation-barrier development cycles, northeastern Gulf of Mexico: Landform evolution and island chain history. J. Coast. Res. 2008, 24, 463–478. [Google Scholar] [CrossRef]
- Lucas, K.L.; Carter, G.A. Change in distribution and composition of vegetated habitats on Horn Island, Mississippi, northern Gulf of Mexico, in the initial five years following Hurricane Katrina. Geomorphology 2013, 199, 129–137. [Google Scholar] [CrossRef]
- Stockdon, H.F.; Doran, K.S.; Serafin, K.A. Coastal Change on Gulf Islands National Seashore during Hurrican Gustav: West Ship, East Ship, Horn, and Petit Bois Islands; Open-File Report, 2010-1090; U.S. Geological Survey: Reston, VA, USA, 2010; p. 18.
- Anderson, C.P.; Carter, G.A.; Funderburk, W.R. The use of aerial R,G,B imagery and LIDAR in comparing ecological habitats and geomorphic features on a natural versus man-made barrier island. Remote Sens. 2016, 8, 602. [Google Scholar] [CrossRef]
- Funderburk, W.R.; Carter, G.A.; Anderson, C.P. Evaluating the influence of elevation and impact of Hurricane Katrina on radial growth in slash pine (Pinus elliottii var. elliottii Engelm) on Cat Island, Mississippi, U.S.A. J. Coast. Res. 2016, 32, 483–489. [Google Scholar] [CrossRef]
- Jeter, G.W., Jr.; Carter, G.A. Habitat change on Horn Island, Mississippi, 1940–2010, determined from textural features in panchromatic vertical aerial imagery. Geocarto Int. 2016, 31, 985–994. [Google Scholar] [CrossRef]
- ArcGIS Desktop: Release 10.3. Environmental Systems Research Institute (ESRI) Home Page. Available online: www.esri.com (accessed on 26 September 2016).
- Lucas, K.L.; Carter, G.A. The use of hyperspectral remote sensing to assess vascular plant species richness on Horn Island, Mississippi. Remote Sens. Environ. 2008, 112, 3908–3915. [Google Scholar] [CrossRef]
- Lucas, K.L.; Carter, G.A. Decadal changes in habitat-type coverage on Horn Island, Mississippi, U.S.A. J. Coast. Res. 2010, 26, 1142–1148. [Google Scholar] [CrossRef]
- ENVI: Release 4.3. Harris Geospatial Solutions Home Page. Available online: http://www.harrisgeospatial.com (accessed on 26 September 2016).
- USGS Earth Resources Observation and Science (EROS) Center Home Page. Available online: http://eros.usgs.gov (accessed on May–December 2010).
- Trimble GeoExplorer Model XT03: Trimble Home Page. Available online: https://www.trimble.com (accessed on 26 September 2016).
© 2016 by the authors; licensee MDPI, Basel, Switzerland. This article is an open access article distributed under the terms and conditions of the Creative Commons Attribution (CC-BY) license (http://creativecommons.org/licenses/by/4.0/).