
A Hydraulic Analysis of Shock Wave Generation Mechanism on Flat Spillway Chutes through Physical Modeling


 ,
,  , , ,
, , ,  and
and 
Abstract
:1. Introduction
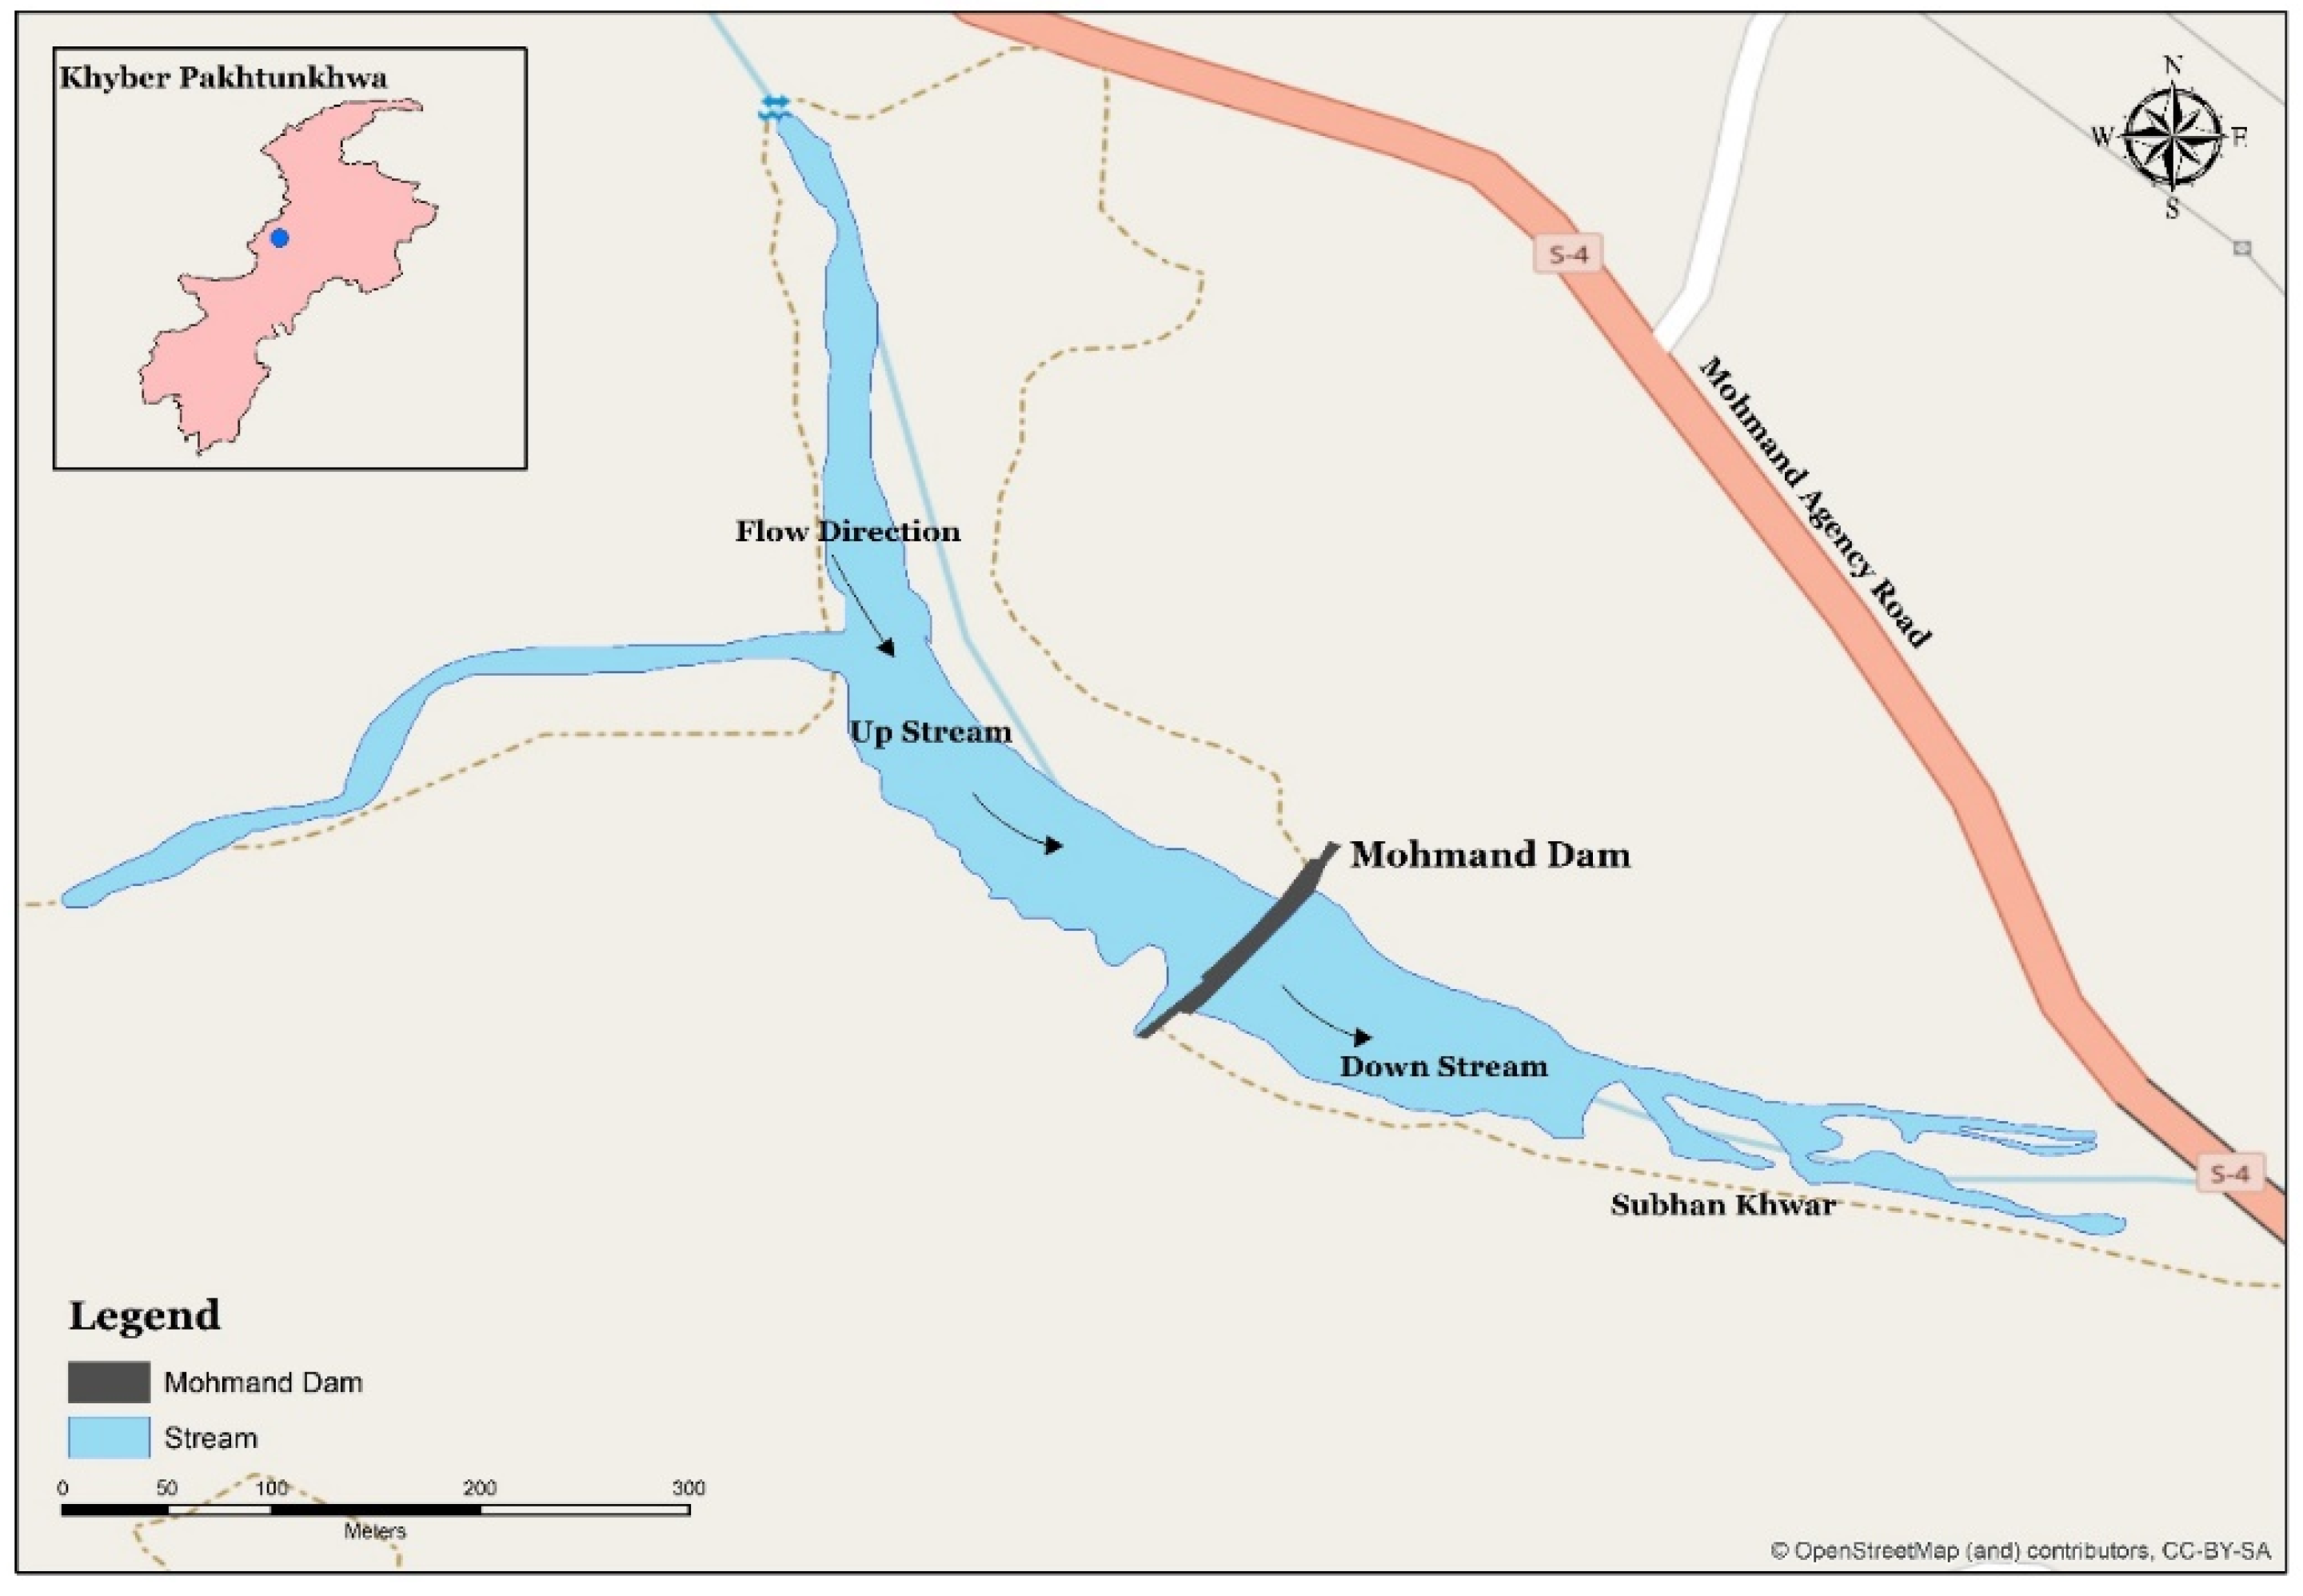
2. Study Area
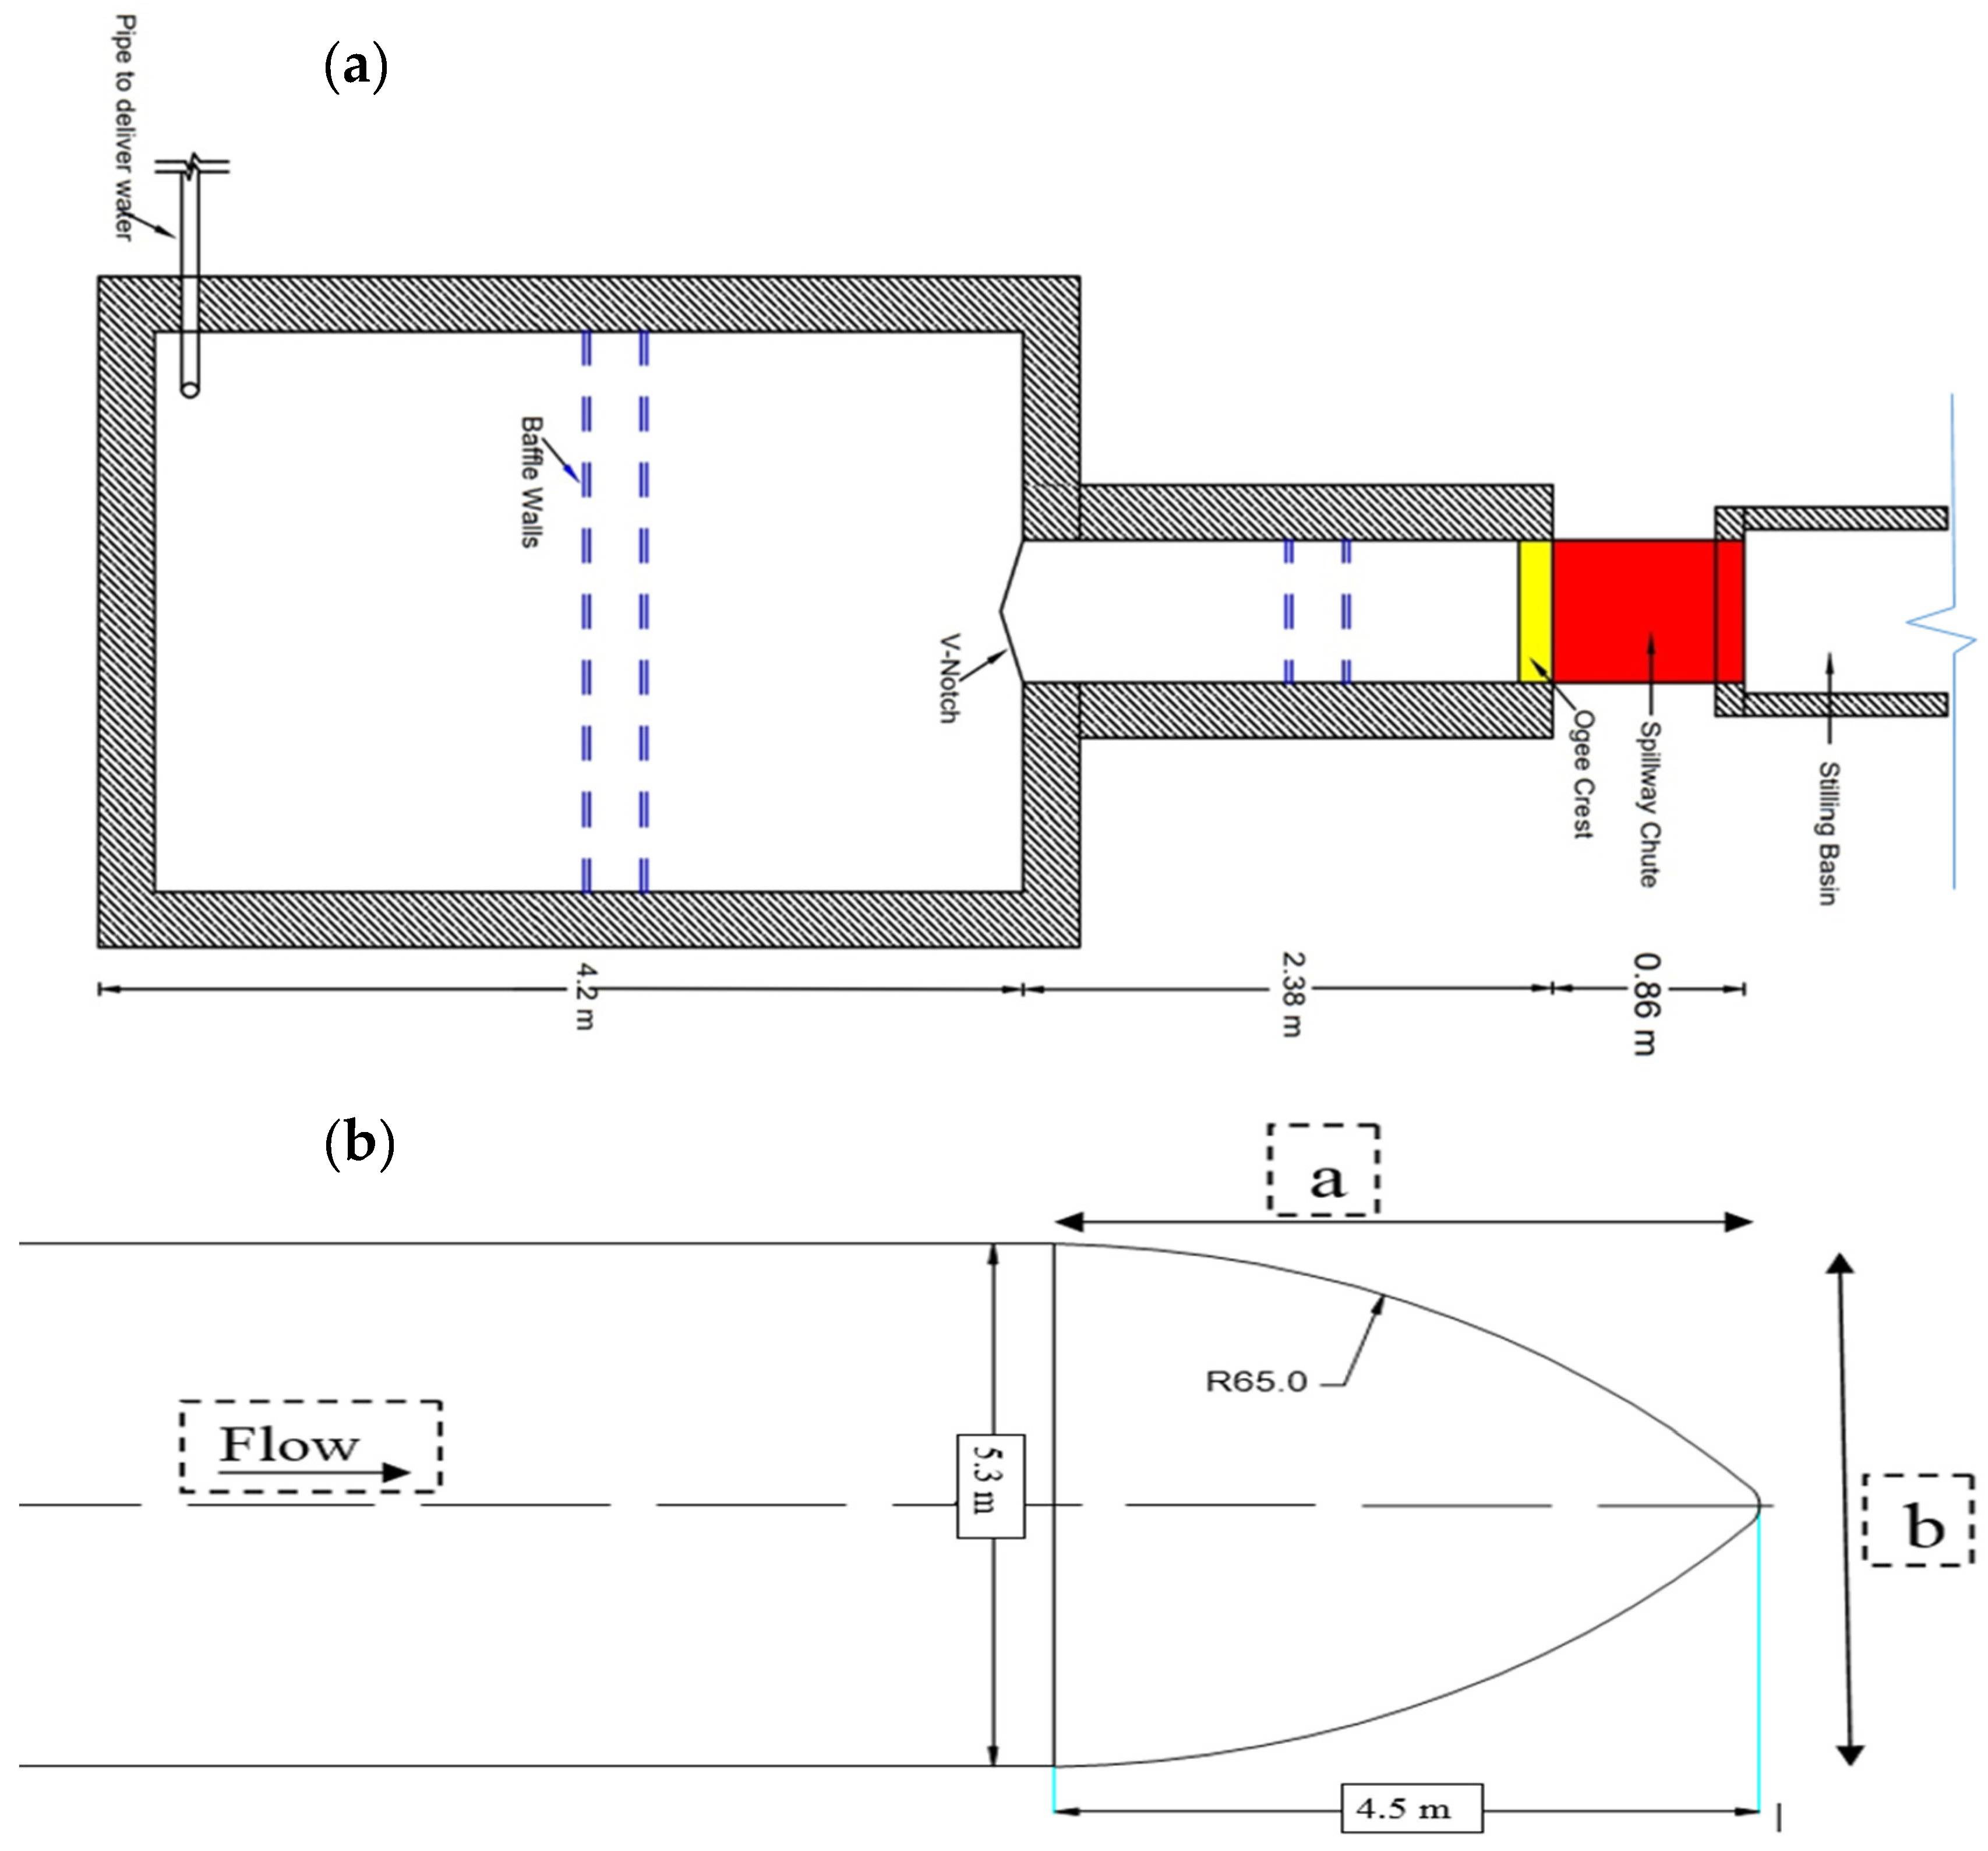
3. Experimental Setup
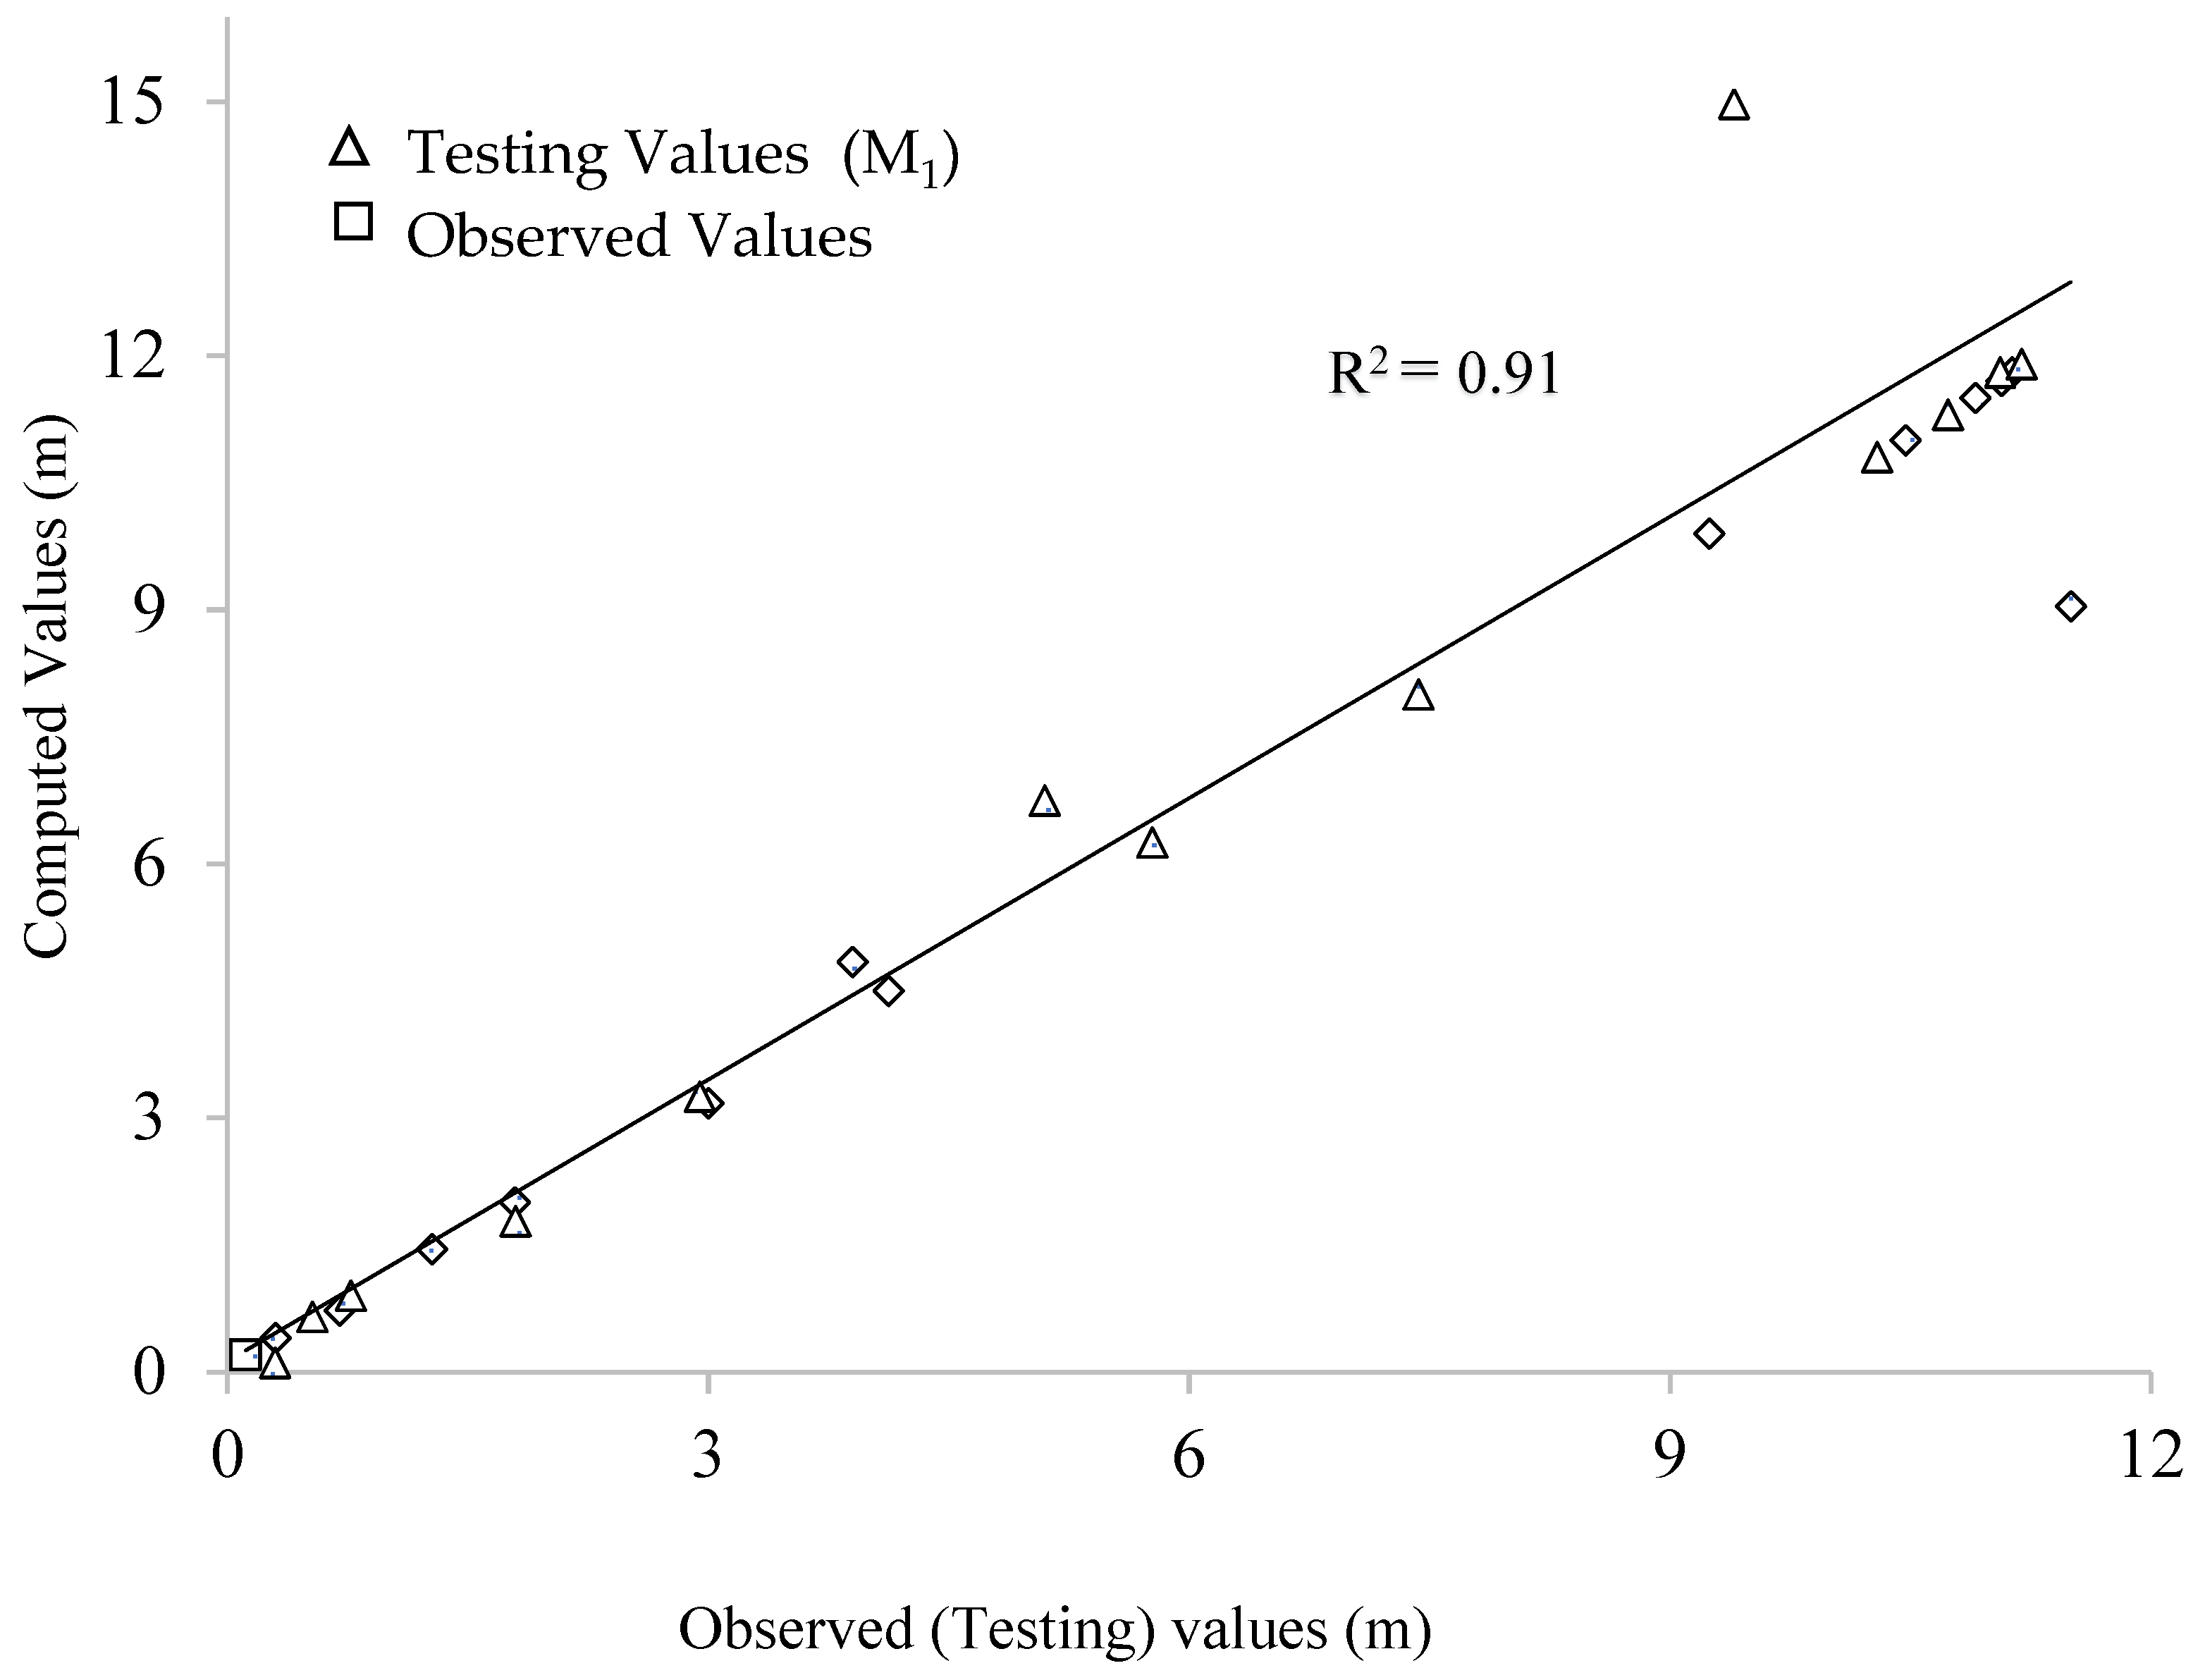
4. Model Validation
5. Dynamic Similarity of Model
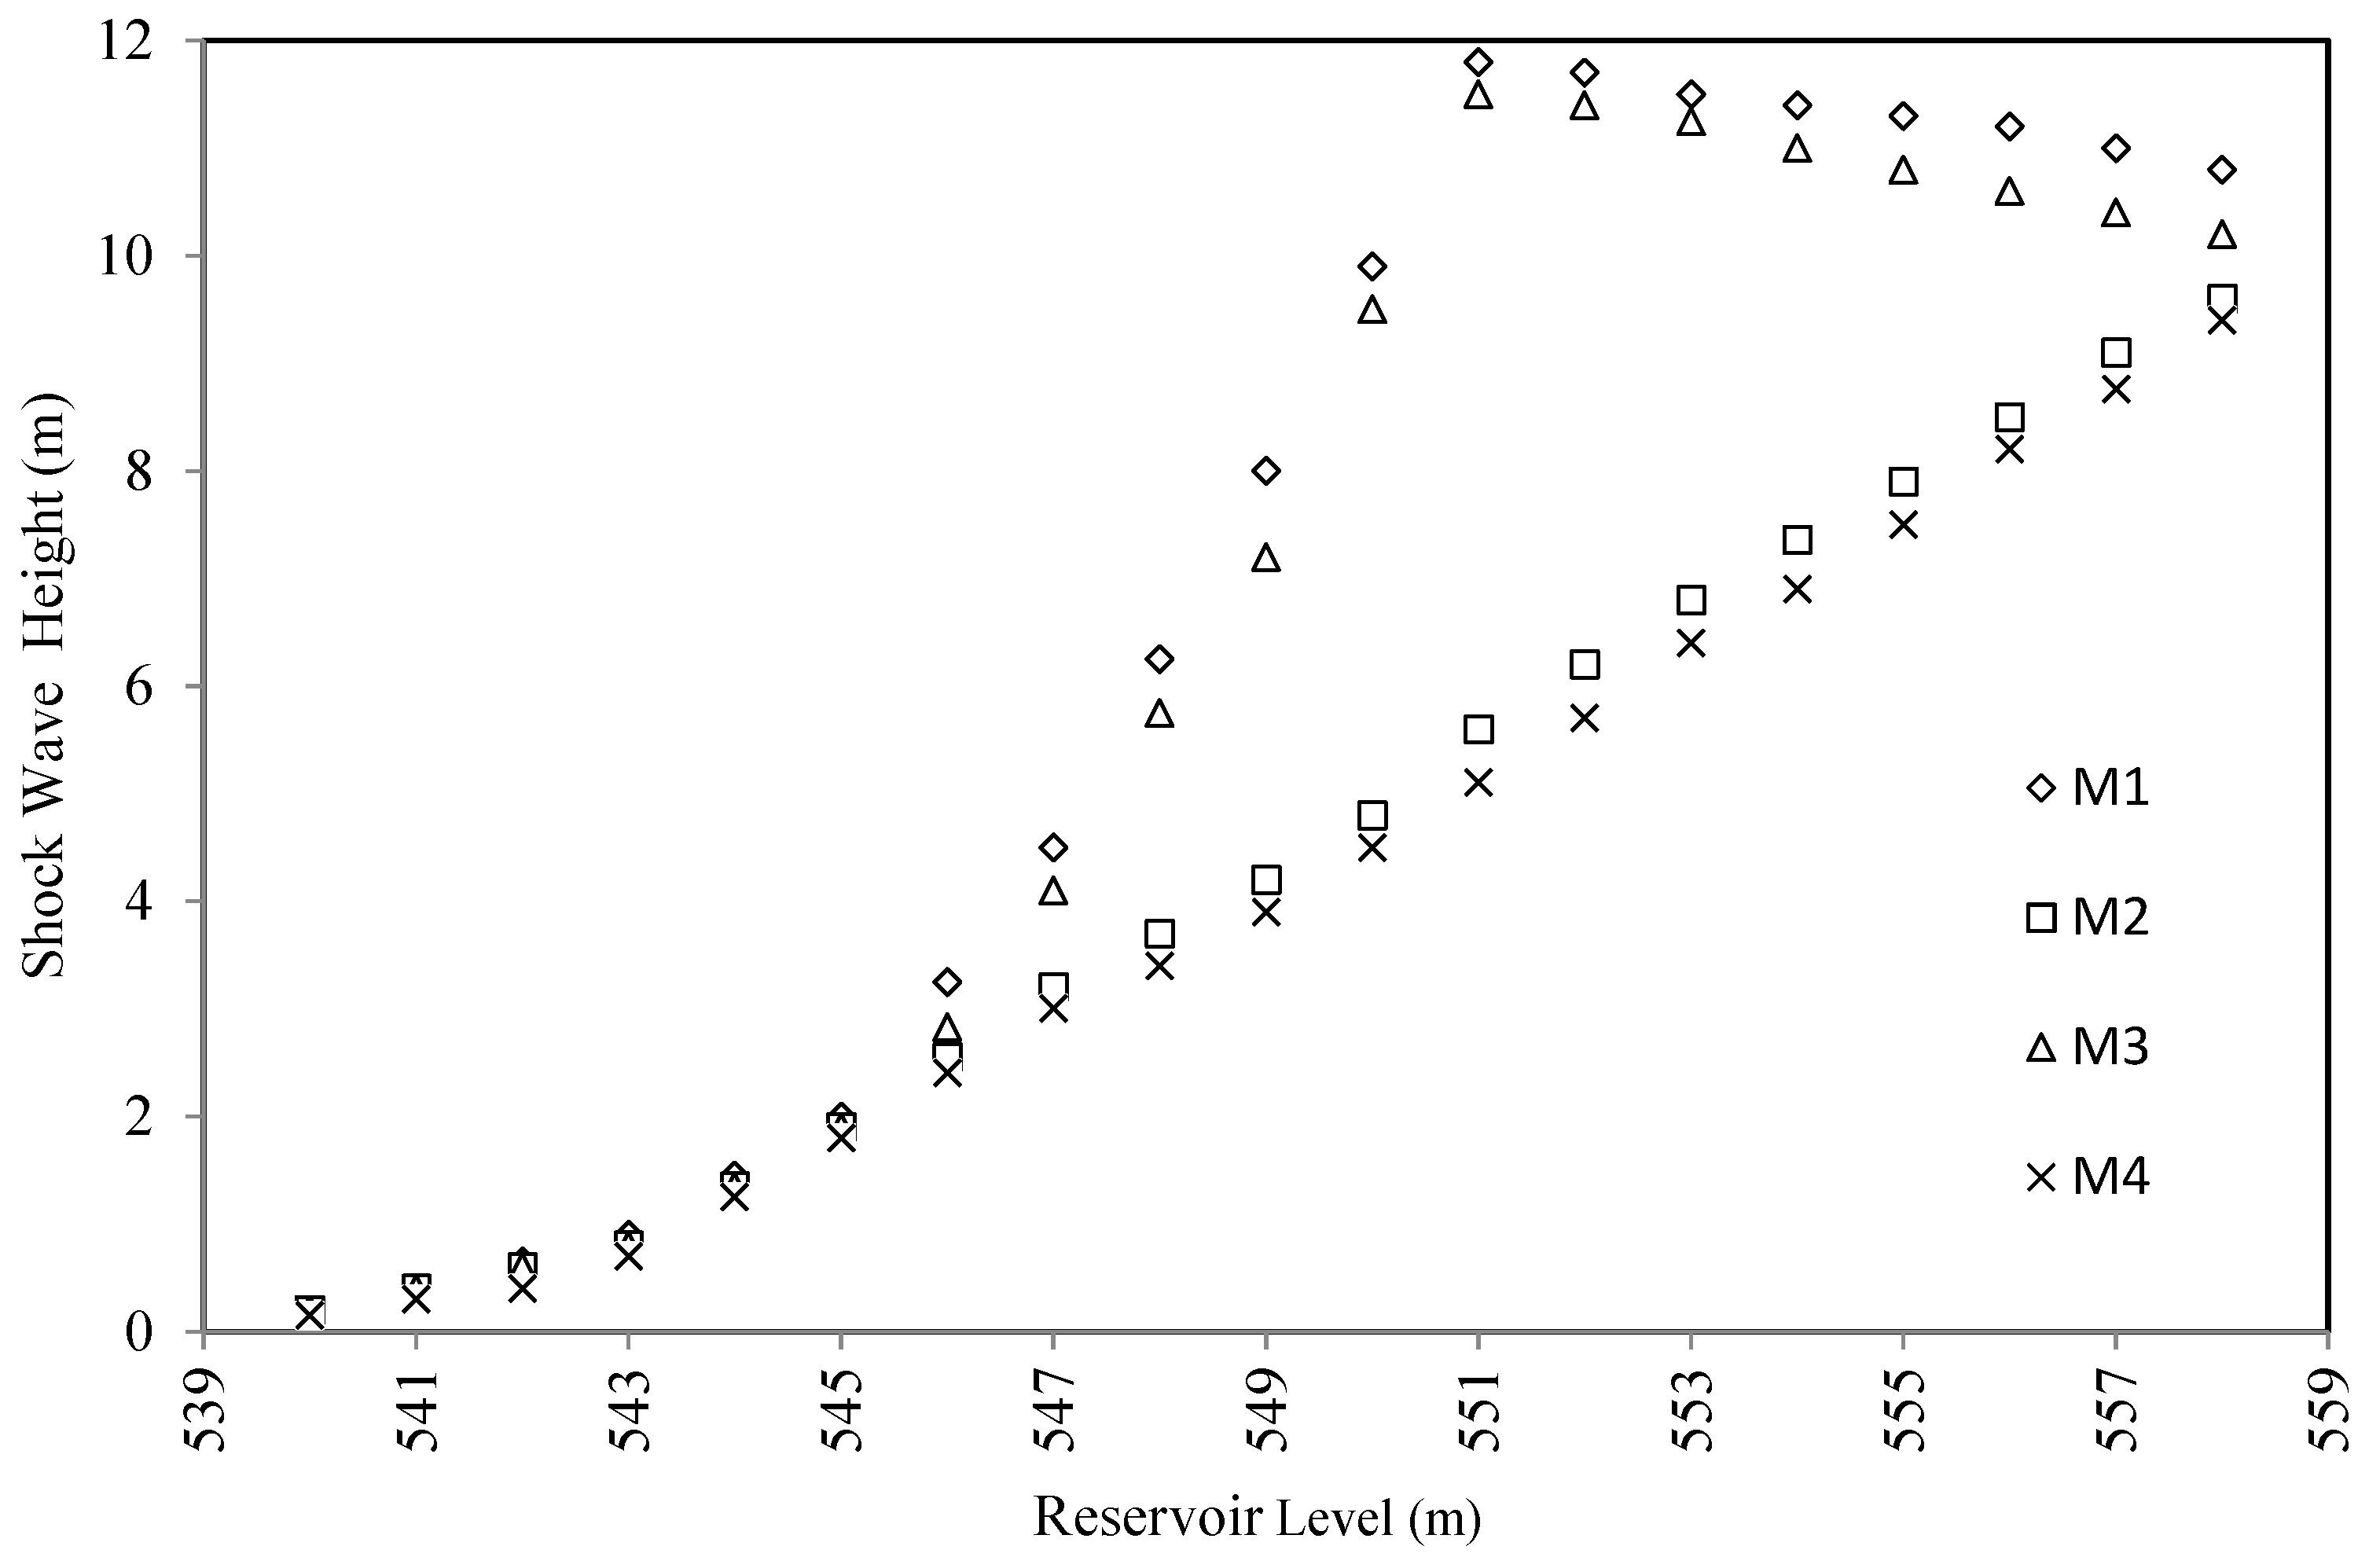
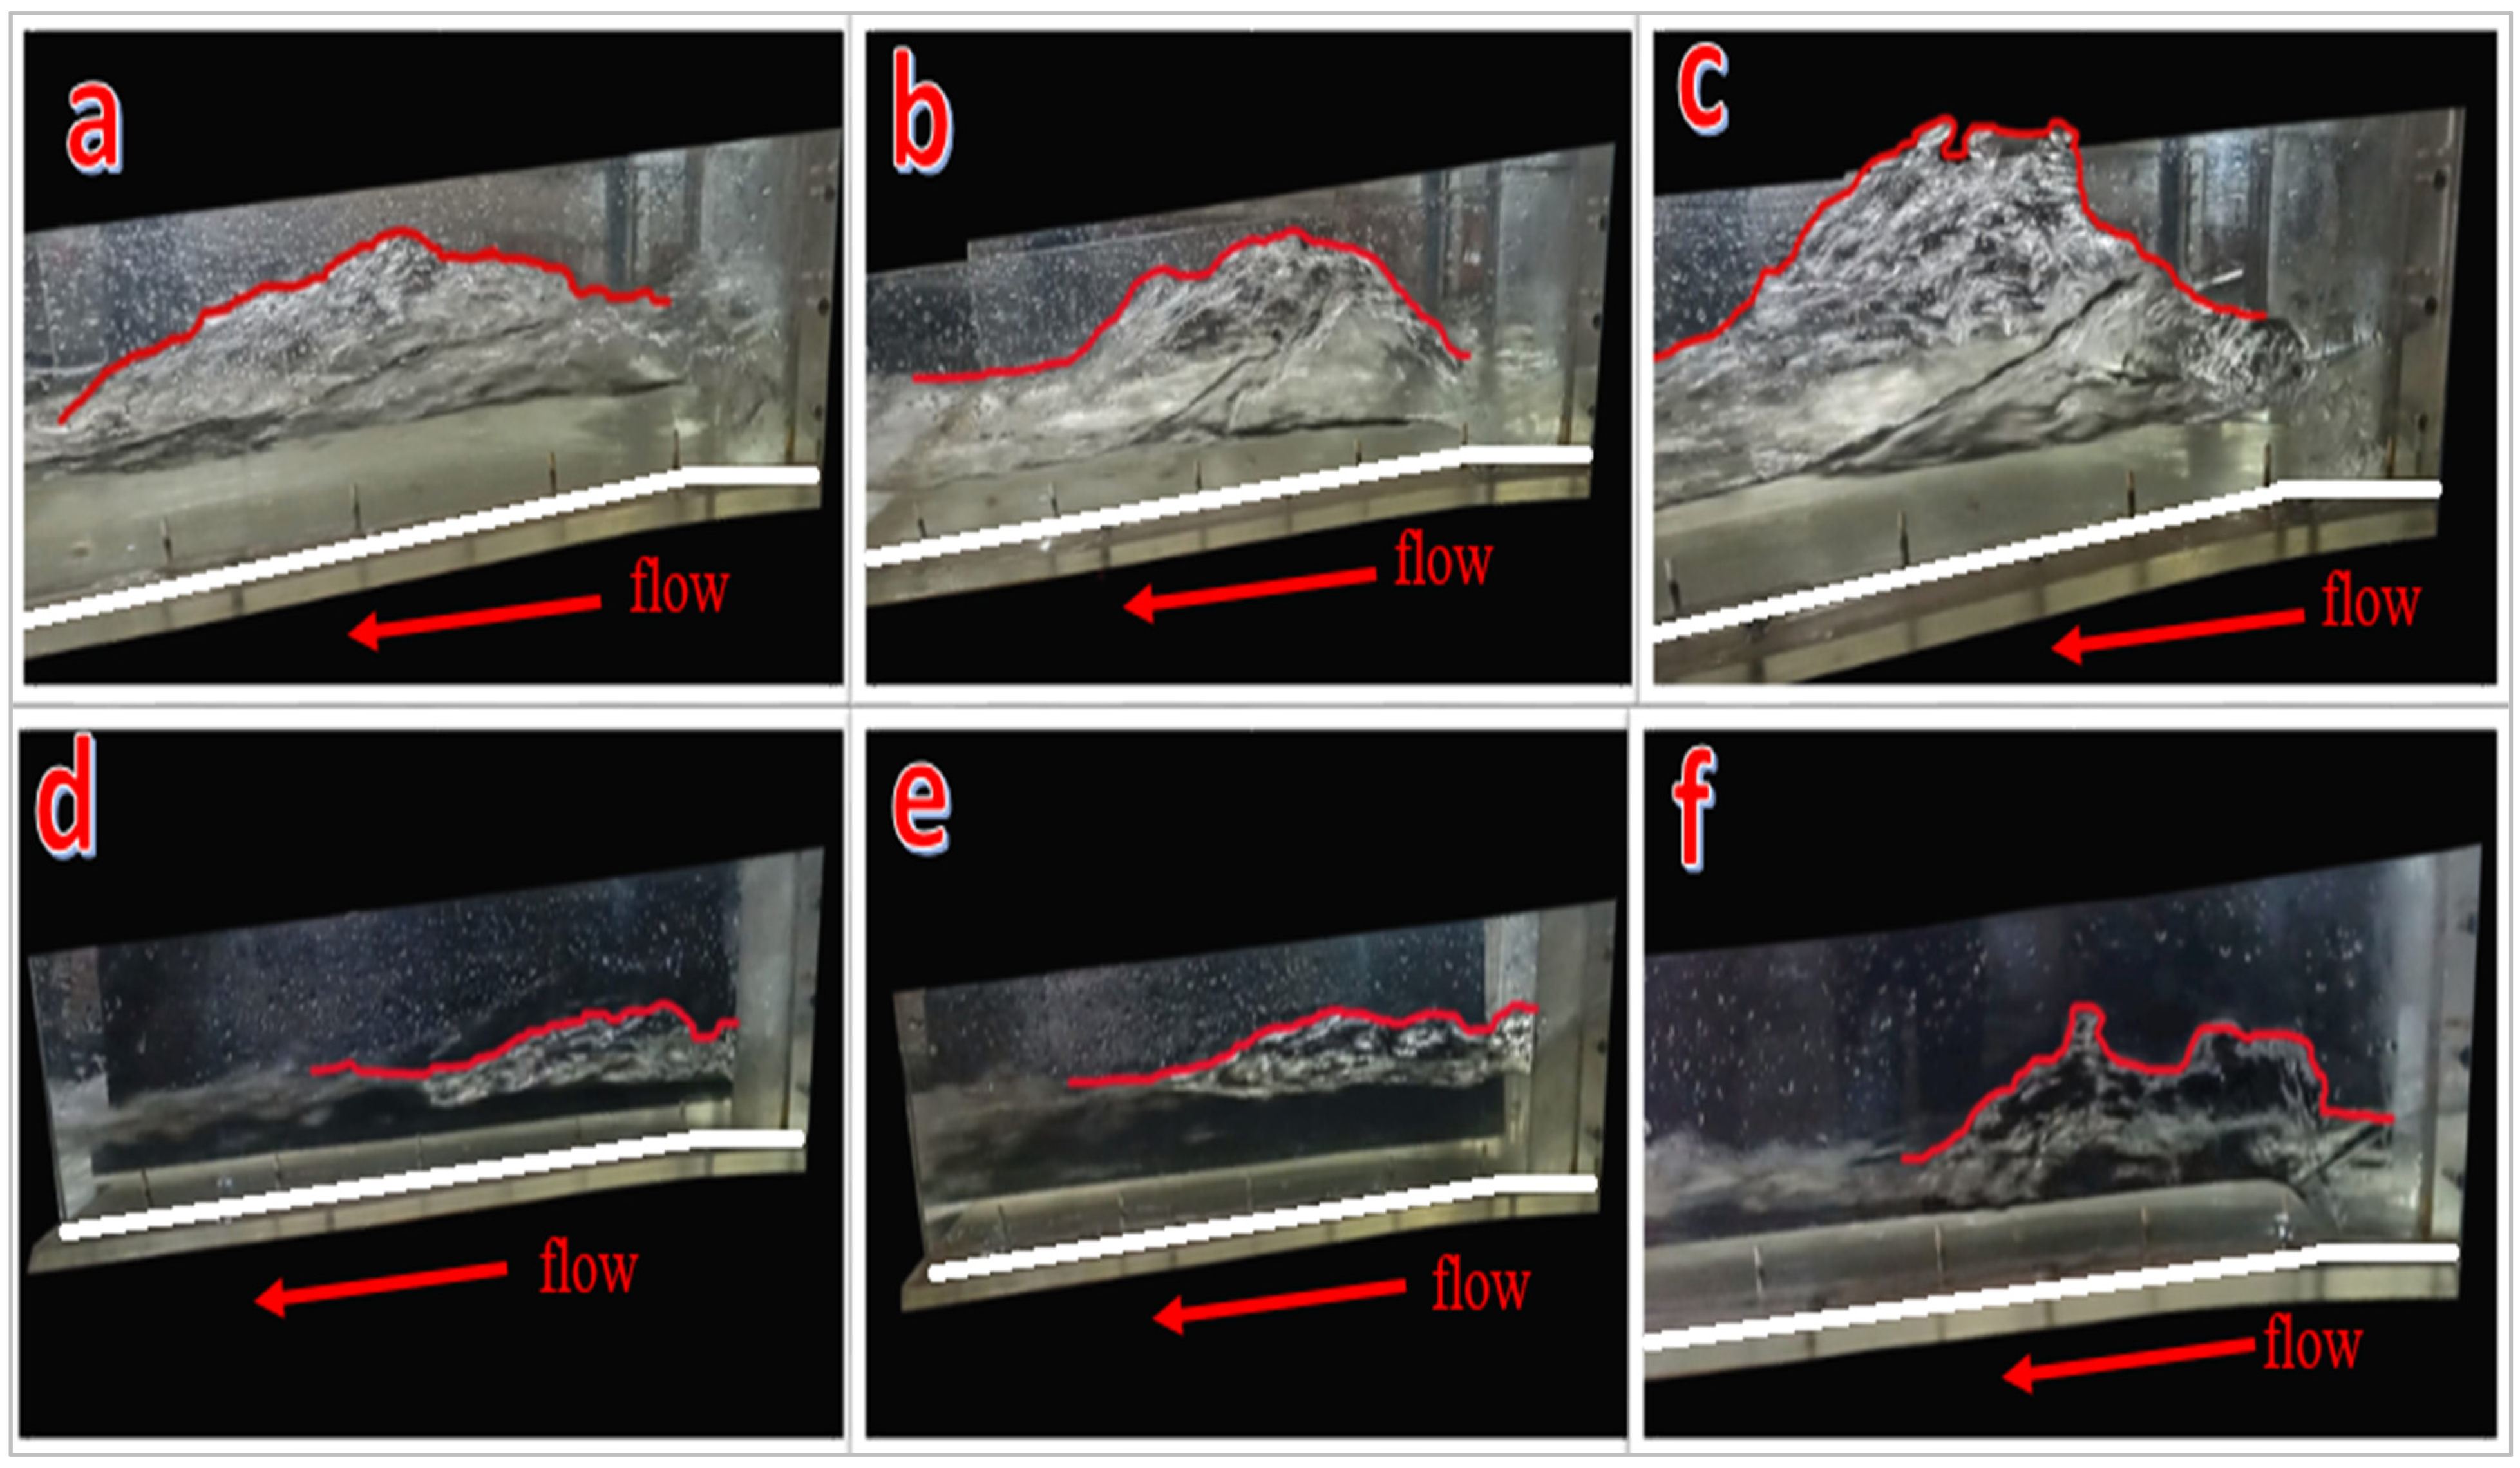
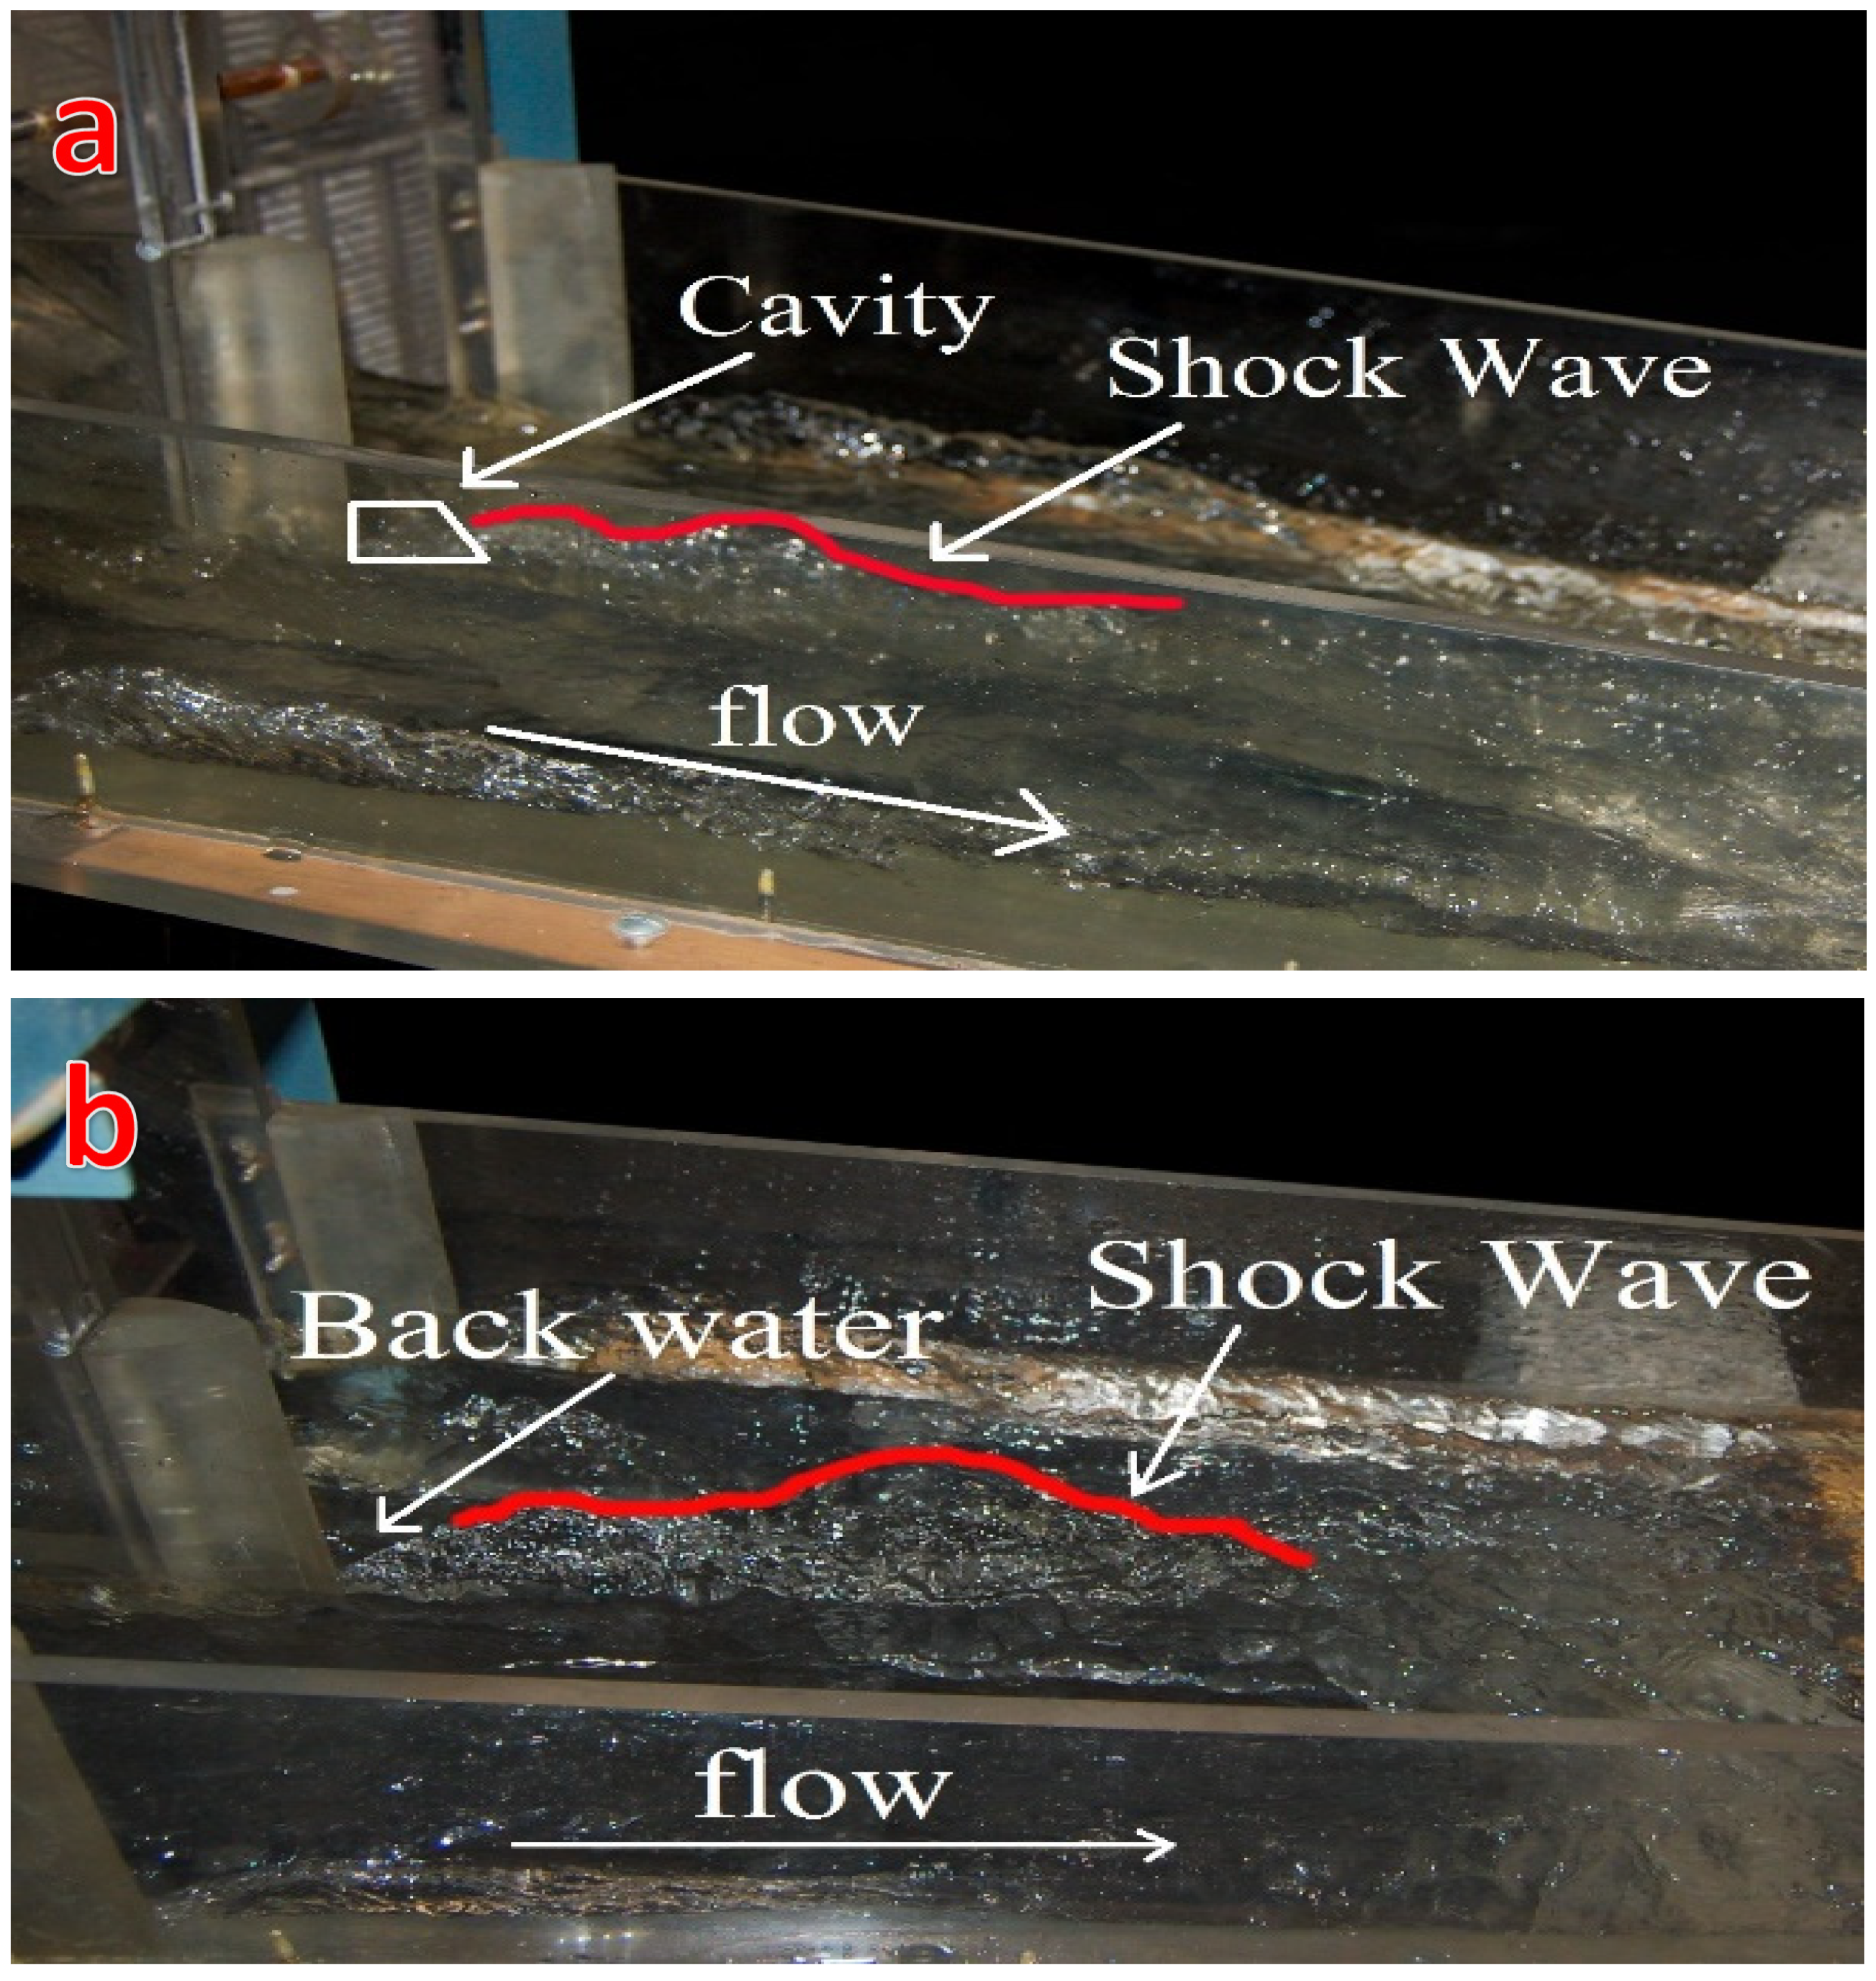
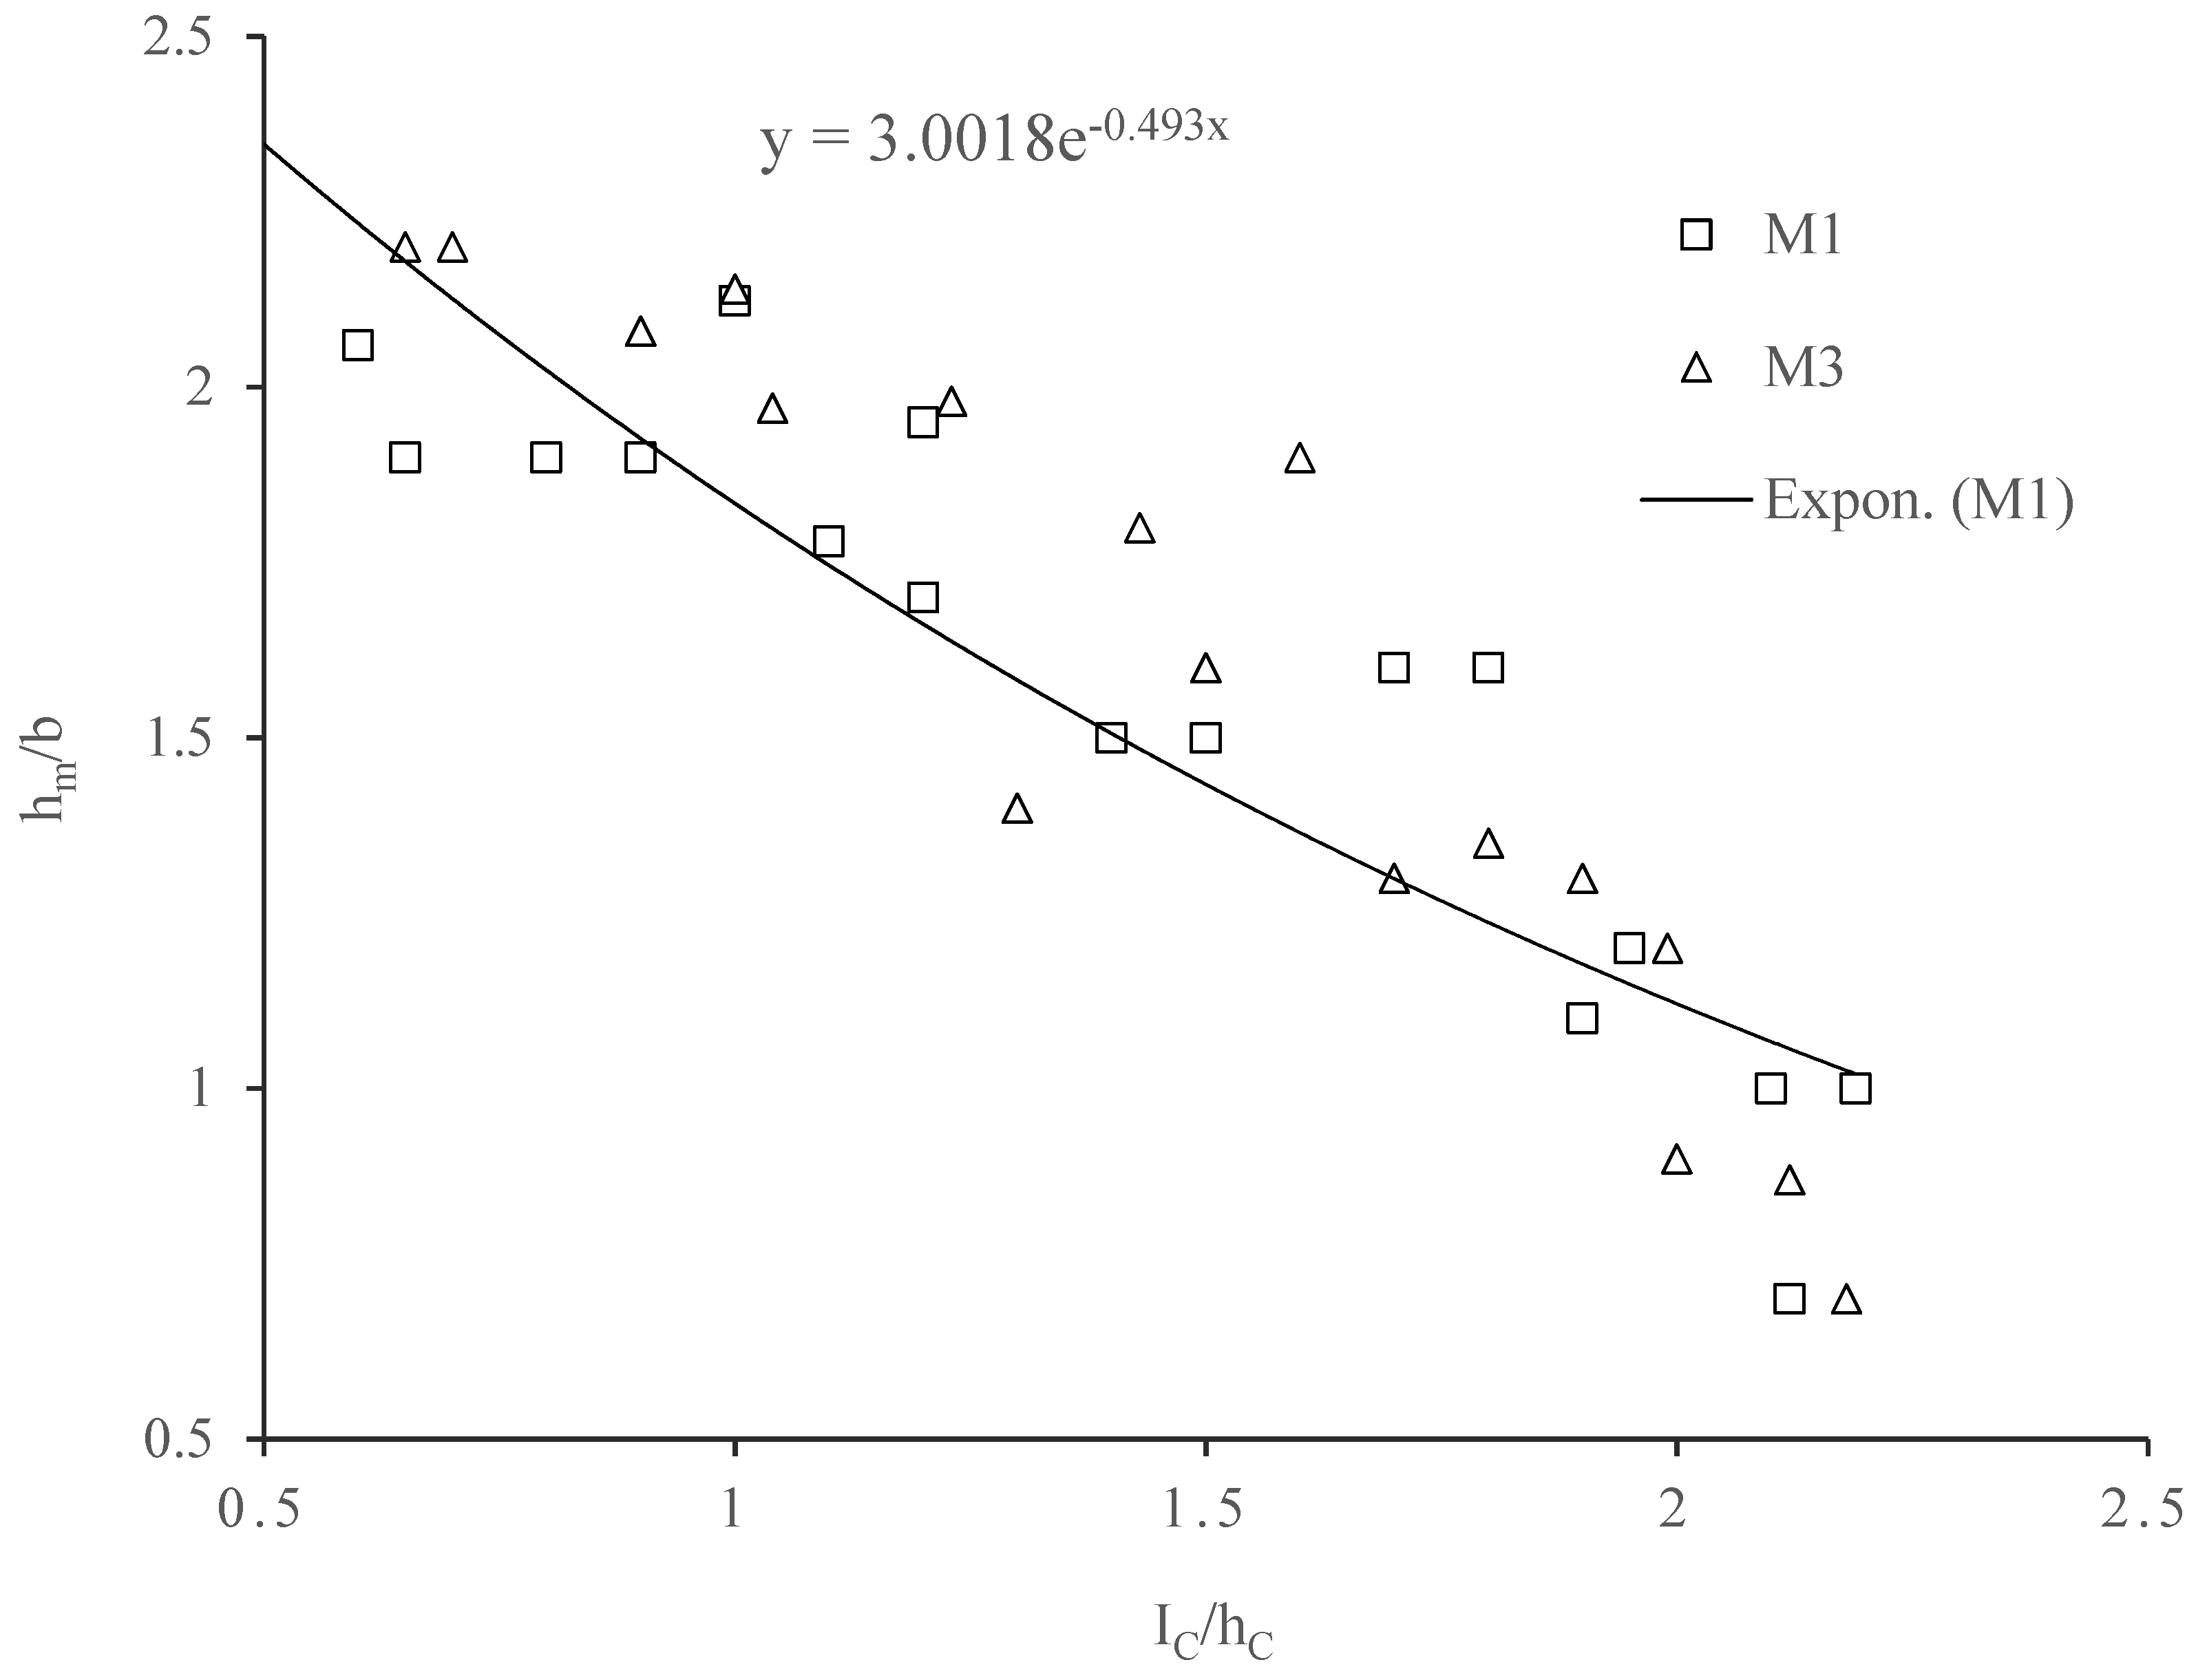
6. Height of Shock Wave
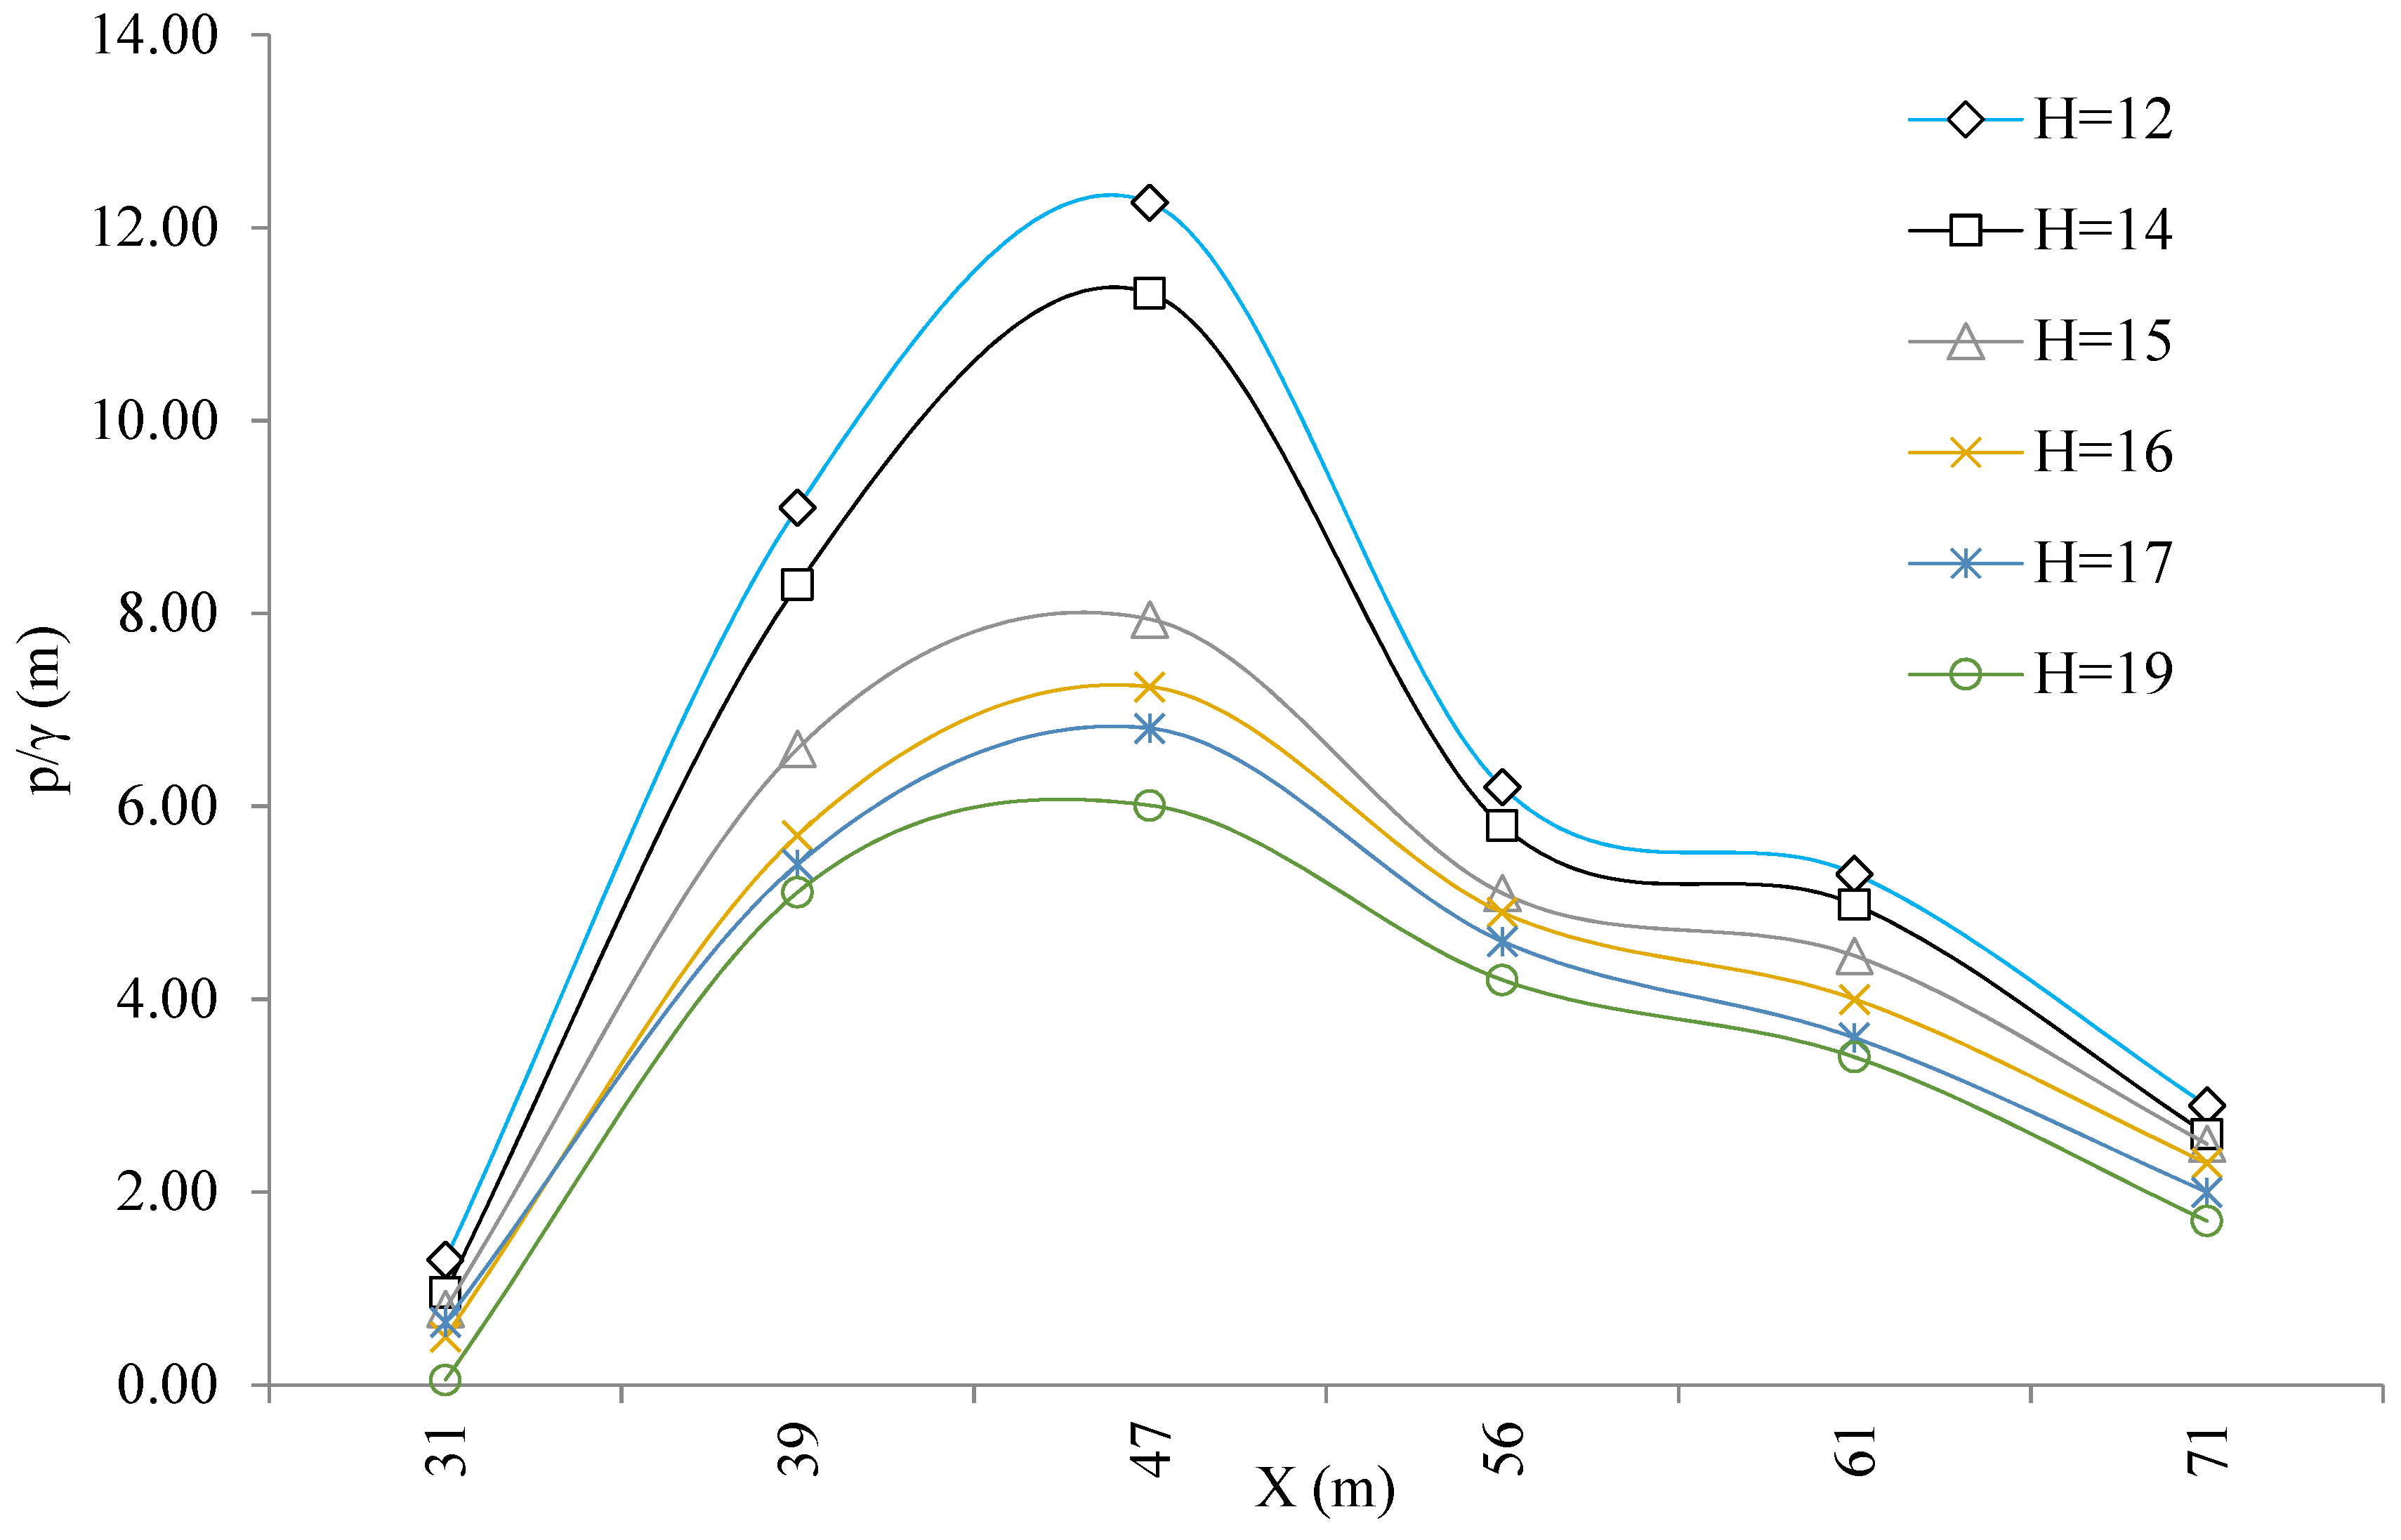
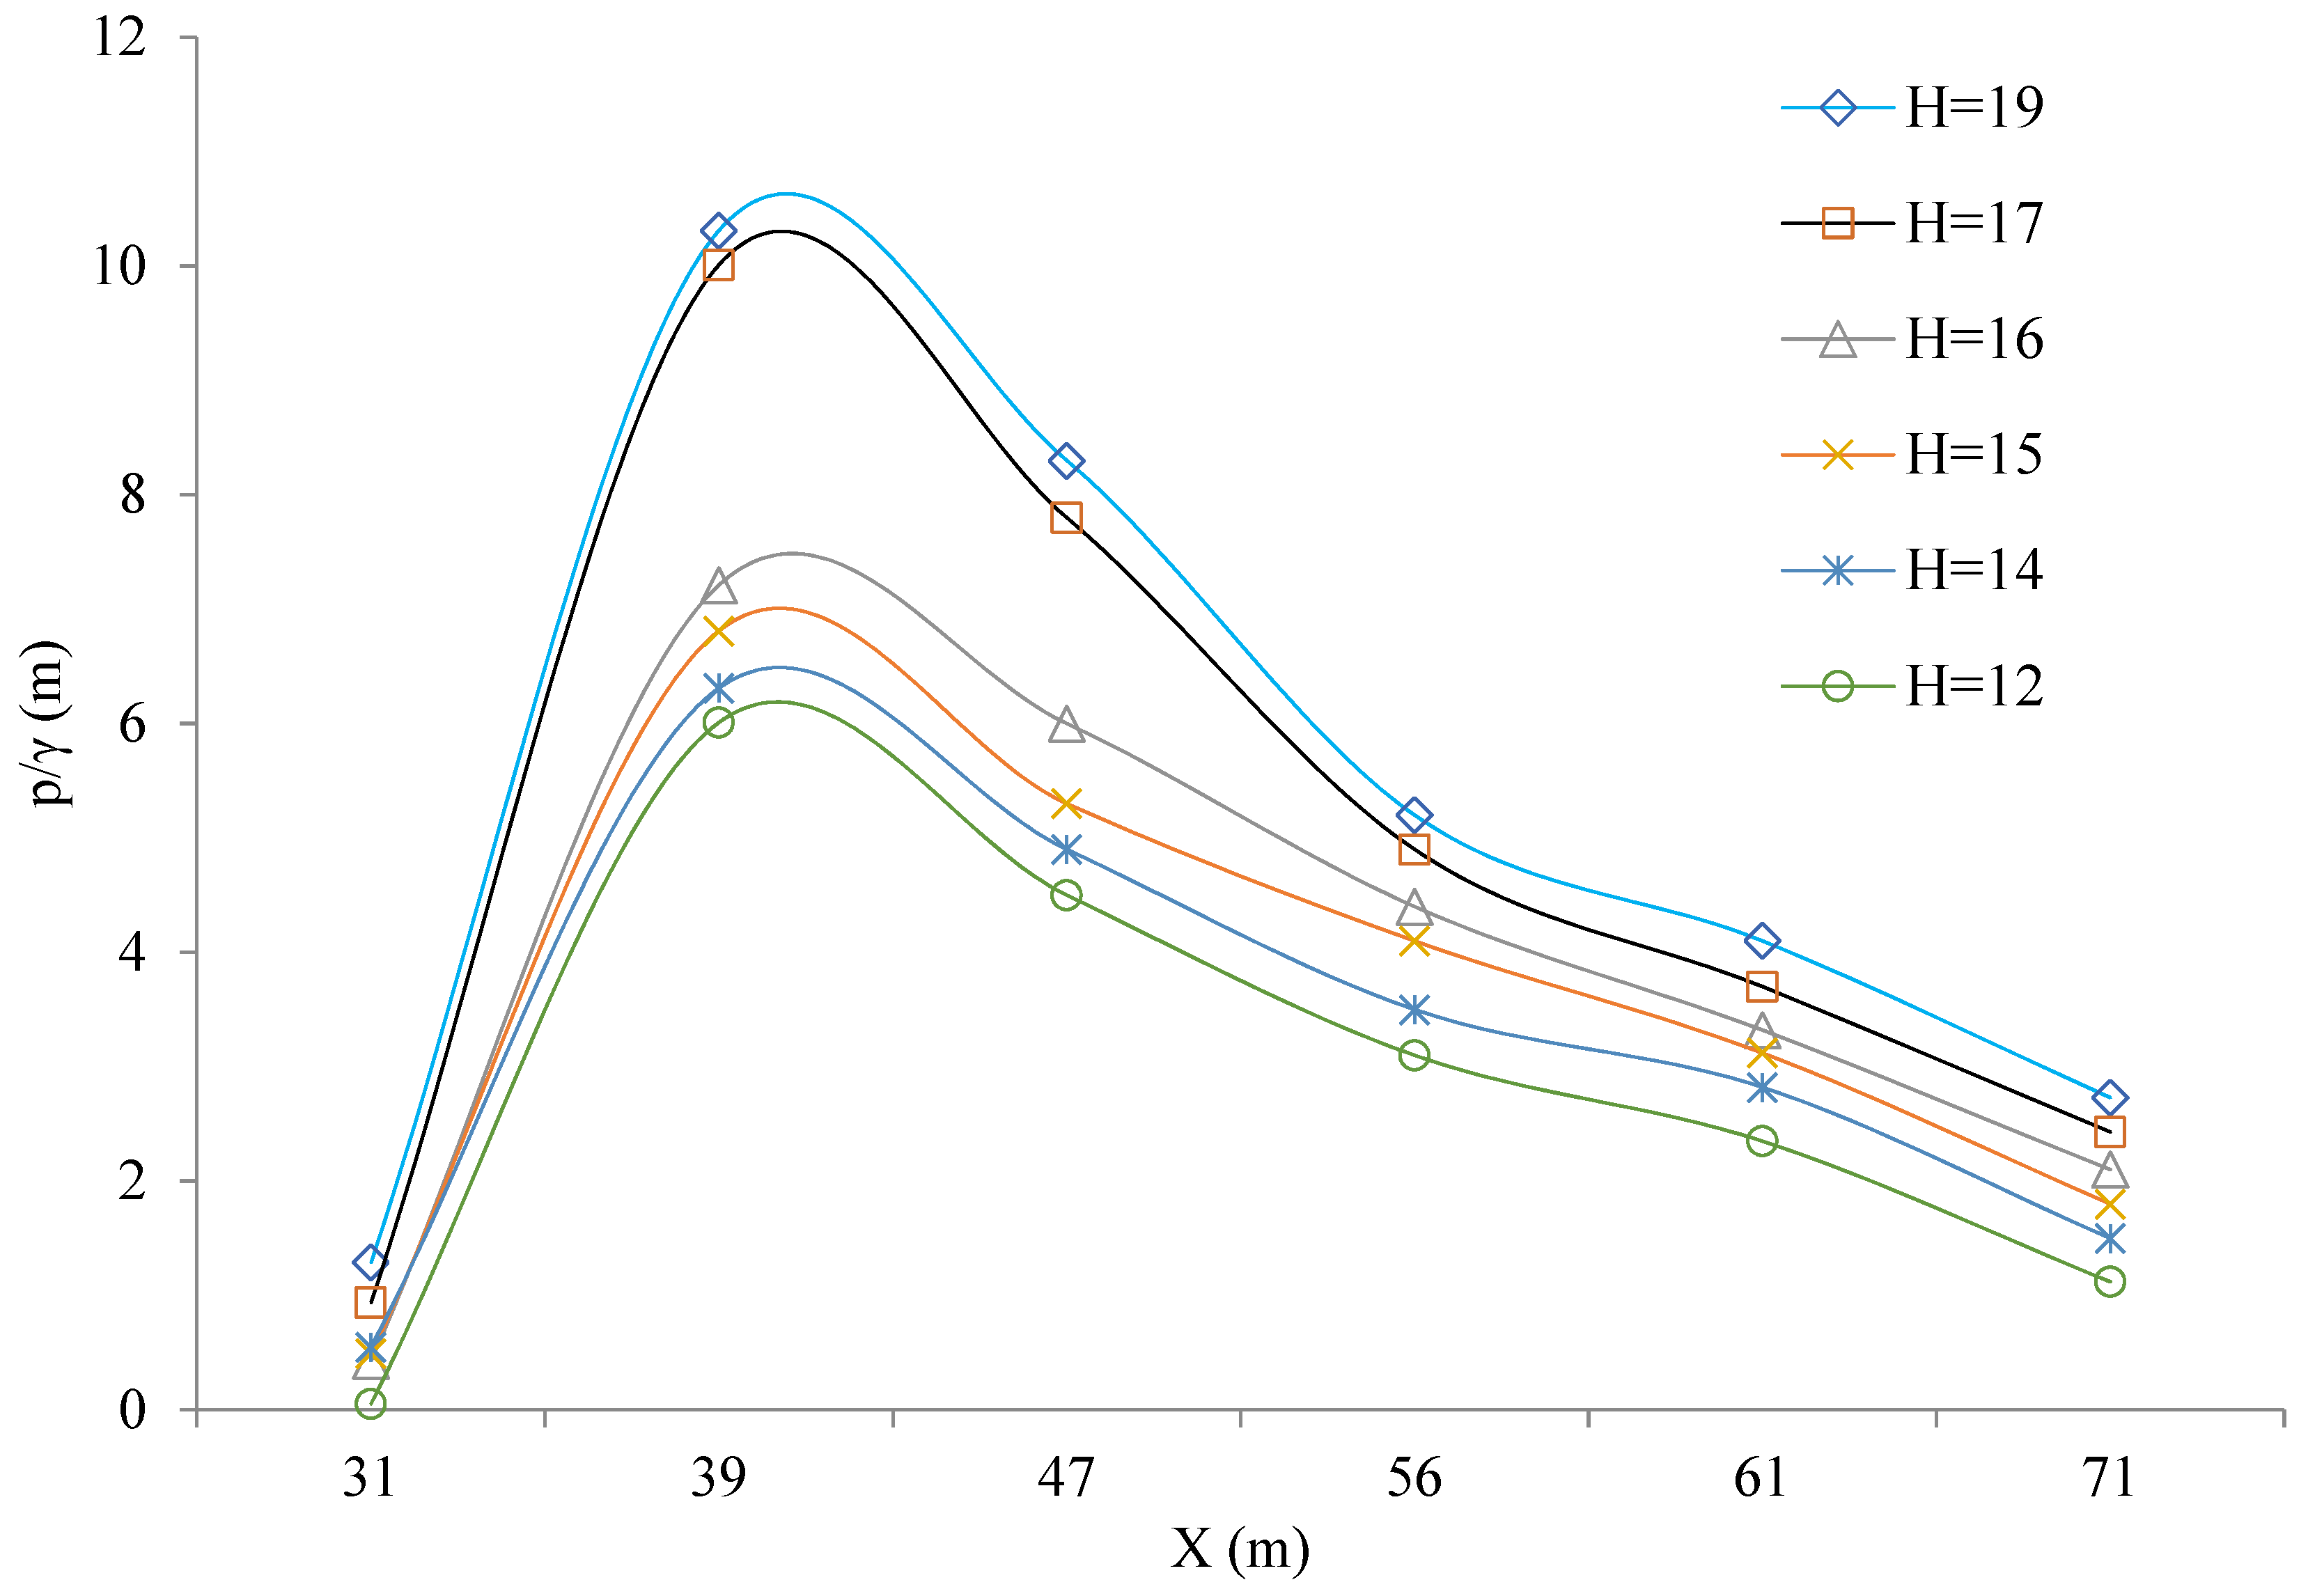
7. Evaluation of Cavity Angle and Diffused Flow Pressure
Pressure Energy
8. Evaluation of Cavity Angle and Diffused Flow Pressure
9. Conclusions
Author Contributions
Funding
Institutional Review Board Statement
Informed Consent Statement
Data Availability Statement
Acknowledgments
Conflicts of Interest
References
- Lee, K.H. Simulation of Dam-Breach Outflow Hydrographs Using Water Level Variations. Water Resour. Manag. 2019, 33, 3781–3797. [Google Scholar] [CrossRef]
- Eghlidi, E.; Barani, G.A.; Qaderi, K. Laboratory Investigation of Stilling Basin Slope Effect on Bed Scour at Downstream of Stepped Spillway: Physical Modeling of Javeh RCC Dam. Water Resour. Manag. 2020, 34, 87–100. [Google Scholar] [CrossRef]
- Jie, Z.; Zhiming, C.; Matahel, A.; Zubayed, R.; Mark, W. Transitional Flow Analysis at Prototype Gated Spillways in South Florida. J. Irrig. Drain. Eng. 2021, 147, 4020042. [Google Scholar] [CrossRef]
- Matahel, A.; Zhiming, C. Generalized Flow Rating Equations at Prototype Gated Spillways. J. Hydraul. Eng. 2009, 135, 602–608. [Google Scholar] [CrossRef]
- Al-Mansori, N.J.H.; Alfatlawi, T.J.M.; Hashim, K.S.; Al-Zubaidi, L.S. The Effects of Different Shaped Baffle Blocks on the Energy Dissipation. Civ. Eng. J. 2020, 6, 961–973. [Google Scholar] [CrossRef]
- Xue, H.; Diao, M.; Ma, Q.; Sun, H. Hydraulic Characteristics and Reduction Measure for Rooster Tails Behind Spillway Piers. Arab. J. Sci. Eng. 2018, 43, 5597–5604. [Google Scholar] [CrossRef]
- Vayghan, V.H.; Mohammadi, M.; Ranjbar, A. Experimental Study of the Rooster Tail Jump and End Sill in Horseshoe Spillways. Civ. Eng. J. 2019, 5, 871–880. [Google Scholar] [CrossRef] [Green Version]
- Vischer, D.L.; Hager, W.H.; Cischer, D. Intake structures. In Dam Hydraulics; John Wiley Sons: Chichester, UK, 1998; pp. 215–232. [Google Scholar]
- Ghadimi, P.; Dashtimanesh, A.; Zamanian, R.; Feizi Chekab, M.A.; Mirhosseini, S.H.R. Rooster tail depression by originating a modified transom stern form using a Reynolds averaged Navier Stokes solver. Sci. Iran. 2015, 22, 765–777. [Google Scholar]
- Salazar, F.; San-Mauro, J.; Celigueta, M.Á.; Oñate, E. Shockwaves in spillways with the particle finite element method. Comput. Part. Mech. 2020, 7, 87–99. [Google Scholar] [CrossRef]
- JING, L.I.; XIANG, Z. Study on Formation Mechanism of Shock Wave after Gate Pier. In Proceedings of the E-Proceedings of the 38th IAHR World Congress, Panama City, Panama, 1–6 September 2019. [Google Scholar]
- Huang, G.-b.; Hu, H.; Wang, C.-h.; Du, L. Shock waves and water wing in slit-type energy dissipaters. J. Hydrodyn. 2017, 29, 504–509. [Google Scholar] [CrossRef]
- Rajaratnam, N. Skimming flow in stepped spillways. J. Hydraul. Eng. 1990, 116, 587–591. [Google Scholar] [CrossRef]
- Tuna, M.C.; Emiroglu, M.E. Effect of step geometry on local scour downstream of stepped chutes. Arab. J. Sci. Eng. 2013, 38, 579–588. [Google Scholar] [CrossRef]
- Toombes, L.; Wagner, C.; Chanson, H. Flow patterns in nappe flow regime down low gradient stepped chutes. J. Hydraul. Res. 2008, 46, 4–14. [Google Scholar] [CrossRef]
- Carnacina, I.; Kurdistani, S.M.; Palermo, M.; Pagliara, S. El Chaparral dam model: Rooster tail formation on high sloped spillway. In Proceedings of the 3rd International Junior Researcher and Engineer Workshop on Hydraulic Structures, Brisbane, Australia, 2–3 May 2010; Volume 10, pp. 65–73. [Google Scholar]
- Chanson, H. Prediction of the transition nappe/skimming flow on a stepped channel. J. Hydraul. Res. 1996, 34, 421–429. [Google Scholar] [CrossRef] [Green Version]
- Najafi, M.R.; Zarrati, A.R. Numerical simulation of air–water flow in gated tunnels. Proc. Inst. Civ. Eng. Water Manag. 2010, 163, 289–295. [Google Scholar] [CrossRef]
- Pagliara, S.; Kurdistani, S.M.; Roshni, T. Rooster tail wave hydraulics of chutes. J. Hydraul. Eng. 2011, 137, 1085–1088. [Google Scholar] [CrossRef]
- Behera, J.; Kar, A.K.; Khamari, A. Scour at the downstream of Ghatakeswar spillway using non-cohesive hydraulic model. ISH J. Hydraul. Eng. 2021, 1–11. [Google Scholar] [CrossRef]
- Duan, W.J. The submerged sloping-tail pier—An effective measure to eliminate the crown of jumping flow. J. Sichuan Univ. Eng. Sci. Ed. 1982, 1, 63–67. [Google Scholar]
- Reinauer, R.; Hager, W.H. Supercritical flow behind chute piers. J. Hydraul. Eng. 1994, 120, 1292–1308. [Google Scholar] [CrossRef]
- Reinauer, R.; Hager, W.H. Pier waves in sloping chutes. Int. J. Hydropower Dams 1997, 4, 100–103. [Google Scholar]
- Reinauer, R.; Hager, W.H. Shockwave in air-water flows. Int. J. Multiph. flow 1996, 22, 1255–1263. [Google Scholar] [CrossRef]
- Wu, J.; Cai, C.; Wei, J.I.; Ruan, S. Hydraulic characteristics of water-wings for the middle-pier of a discharge tunnel. J. Hydrodyn. Ser. B 2006, 18, 567–571. [Google Scholar] [CrossRef]
- Wu, J.; Yan, Z. Hydraulic characteristics of bottom underlay-type pier for water-wing control. J. Hydrodyn. 2008, 20, 735–740. [Google Scholar] [CrossRef]
- Mooselu, M.G.; Nikoo, M.R.; Rayani, N.B.; Izady, A. Fuzzy multi-objective simulation-optimization of stepped spillways considering flood uncertainty. Water Resour. Manag. 2019, 33, 2261–2275. [Google Scholar] [CrossRef]
- Sheng, C.; Jian, Z.; Ming, H.; Hazrati, A. Experimental study on water-wing characteristics induced by piers in flood drainage culverts. Sci. Iran. 2013, 20, 1320–1326. [Google Scholar]
- Shao, Z.; Jahangir, Z.; Muhammad Yasir, Q.; Mahmood, S. Identification of potential sites for a multi-purpose dam using a dam suitability stream model. Water 2020, 12, 3249. [Google Scholar] [CrossRef]
- Zhan, X.; Qin, H.; Liu, Y.; Yao, L.; Xie, W.; Liu, G.; Zhou, J. Variational Bayesian Neural Network for Ensemble Flood Forecasting. Water 2020, 12, 2740. [Google Scholar] [CrossRef]
- Farooq, R.; Ahmad, W.; Hashmi, H.N.; Saeed, Z. Computation of Momentum Transfer Coefficient and Conveyance Capacity in Asymmetric Compound Channel. Arab. J. Sci. Eng. 2016, 41, 4225–4234. [Google Scholar] [CrossRef]


| Geometric Variables | M1 | M2 | M3 | M4 |
|---|---|---|---|---|
| Spillway slope (θ) | 1:6.5 | 1:6.5 | 1:8.5 | 1:8.5 |
| Length of semi major axis (m) (a) | 0 | 4.5 | 0 | 4.5 |
| Sr. No. | Reservoir Level amsl (m) | Observed Discharge (m3/s) | Computed Discharge (m3/s) | Error (%) |
|---|---|---|---|---|
| 1 | 539 | 0 | 0 | 0 |
| 2 | 541 | 156.99 | 155.14 | 1.19 |
| 3 | 543 | 453.08 | 446.8 | 1.41 |
| 4 | 545 | 848.05 | 837.4 | 1.27 |
| 5 | 547 | 1337.75 | 1314.28 | 1.79 |
| 6 | 549 | 1902.02 | 1870.5 | 1.69 |
| 7 | 551 | 2550.89 | 2498.5 | 2.10 |
| 8 | 558 | 5052.27 | 5214.2 | 3.11 |
Publisher’s Note: MDPI stays neutral with regard to jurisdictional claims in published maps and institutional affiliations. |
© 2021 by the authors. Licensee MDPI, Basel, Switzerland. This article is an open access article distributed under the terms and conditions of the Creative Commons Attribution (CC BY) license (https://creativecommons.org/licenses/by/4.0/).
Share and Cite
Sarwar, M.K.; Tariq, M.A.U.R.; Farooq, R.; Abbasi, H.K.J.; Haq, F.U.; Ahmad, I.; Shah, M.I.; Ng, A.W.M.; Muttil, N. A Hydraulic Analysis of Shock Wave Generation Mechanism on Flat Spillway Chutes through Physical Modeling. Hydrology 2021, 8, 186. https://doi.org/10.3390/hydrology8040186
Sarwar MK, Tariq MAUR, Farooq R, Abbasi HKJ, Haq FU, Ahmad I, Shah MI, Ng AWM, Muttil N. A Hydraulic Analysis of Shock Wave Generation Mechanism on Flat Spillway Chutes through Physical Modeling. Hydrology. 2021; 8(4):186. https://doi.org/10.3390/hydrology8040186
Chicago/Turabian StyleSarwar, Muhammad Kaleem, Muhammad Atiq Ur Rehman Tariq, Rashid Farooq, Hafiz Kamran Jaleel Abbasi, Faraz Ul Haq, Ijaz Ahmad, Muhammad Izhar Shah, Anne. W. M. Ng, and Nitin Muttil. 2021. "A Hydraulic Analysis of Shock Wave Generation Mechanism on Flat Spillway Chutes through Physical Modeling" Hydrology 8, no. 4: 186. https://doi.org/10.3390/hydrology8040186
APA StyleSarwar, M. K., Tariq, M. A. U. R., Farooq, R., Abbasi, H. K. J., Haq, F. U., Ahmad, I., Shah, M. I., Ng, A. W. M., & Muttil, N. (2021). A Hydraulic Analysis of Shock Wave Generation Mechanism on Flat Spillway Chutes through Physical Modeling. Hydrology, 8(4), 186. https://doi.org/10.3390/hydrology8040186