Abstract
This study evaluated the water supply and regulation of the San Pedro River basin, located in the municipality of Puerto Libertador (Córdoba, Colombia), under climate change scenarios, using the SWAT (Soil and Water Assessment Tool) hydrological model. The model was calibrated and validated in SWAT-CUP using the SUFI-2 algorithm, based on observed streamflow series and sensitive hydrological parameters. Observed and satellite climate data, CHIRPS for precipitation and ERA5-Land for temperature, radiation, humidity, and wind, were employed. Climatic data were integrated along with spatial information on soils, land use, and topography, allowing for an adequate representation of the basin’s heterogeneity. The model showed acceptable performance (NSE > 0.6; PBIAS < ±15%), reproducing the seasonal variability and the average flow behavior. Climate projections under RCP 4.5 and RCP 8.5 scenarios, derived from the MIROC5 model (CMIP5), indicated a slight decrease in mean streamflow and an increase in interannual variability for the period 2040–2070, suggesting a potential reduction in surface water availability and natural hydrological regulation by mid-century. The Water Regulation Index (WRI) exhibited a downward trend in most sub-basins, particularly in areas affected by forest loss and agricultural expansion. The WRI showed a downward trend in most sub-basins, especially those with loss of forest cover and a predominance of agricultural uses. These findings provide basin-specific evidence on how climate change and land-use pressures may jointly affect hydrological regulation in tropical Andean–Caribbean basins. These results highlight the usefulness of the SWAT model as a decision-support tool for integrated water resources management in the San Pedro River basin and similar tropical Andean–Caribbean catchments, supporting basin-scale climate adaptation planning. They also emphasize the importance of conserving headwater ecosystems and forest cover to sustain hydrological regulation, reduce vulnerability to flow extremes, and enhance long-term regional water security.
1. Introduction
Current water demands across global economic and industrial sectors exert increasing pressure on freshwater availability [1]. Concurrently, climate change alters precipitation regimes, potential evapotranspiration (ETo), and temperature patterns, leading to significant modifications in surface water supply (SWS) in terms of magnitude, seasonality, and reliability [2]. These impacts are particularly pronounced in tropical regions, where strong rainfall seasonality and high climate variability amplify hydrological sensitivity to climate forcing [3]. Northern Colombia is characterized by tropical Andean–Caribbean basins with highly seasonal rainfall regimes and strong interannual variability associated with the El Niño–Southern Oscillation (ENSO) [4,5]. Annual precipitation in this region typically ranges between approximately 1500 and 3000 mm, with marked dry seasons that directly affect streamflow availability and water regulation capacity. In this context, the San Pedro River basin, located in the department of Córdoba, exhibits a unimodal rainfall pattern with a pronounced dry season, which plays a critical role in controlling surface water availability and baseflow dynamics [6]. The interaction between climate variability, projected climate change, and existing land-use pressures increases the basin’s vulnerability to water scarcity and hydrological extremes [7].
For the mid-century period (2040–2070), climate change scenarios (RCP 4.5 and RCP 8.5) project increases in average temperature and alterations in the distribution and intensity of precipitation [2,8]. Which could intensify the reduction in flows and water supply, directly affecting local water security and ecosystem services dependent on the natural regime of the San Pedro River [9]. This challenge is further compounded by anthropogenic pressures associated with land-use and land-cover changes, mainly driven by agricultural and livestock expansion, which have reduced the basin’s capacity to regulate water resources [10,11]. The quantification of surface water supply (SWS) constitutes a fundamental tool for hydrological characterization and for evaluating water availability at the basin scale [12]. Its estimation is based on the principle of conservation of mass, expressed by the general equation of the water balance [4]. In this regard, semi-distributed hydrological models provide a suitable framework for representing spatial heterogeneity by dividing watersheds into sub-basins or hydrological response units (HRUs) and simulating key physical processes such as runoff generation, infiltration, evapotranspiration, and groundwater flow [13,14]. SWAT provides a scalable framework for medium and large basins by incorporating topography, soil properties, vegetation cover, and land management practices [15].
Previous SWAT-based climate change impact studies have reported contrasting hydrological responses depending on regional hydroclimatic conditions, emission scenarios, and model configurations [11,16,17]. Several studies in tropical and subtropical basins indicate reductions in mean streamflow and baseflow under future warming due to increased evapotranspiration demand. Others report stable or locally increased runoff associated with projected intensification of precipitation or seasonal shifts [18,19]. In Andean and Caribbean-influenced basins, uncertainties persist regarding the magnitude and timing of future surface water availability, as well as the capacity of forested headwaters to buffer climate-induced hydrological stress [18,20,21]. These contrasting findings highlight the need for basin-specific assessments that explicitly evaluate both surface water supply and hydrological regulation under consistent modeling frameworks [22].
In the Brazilian Amazon demonstrated that SWAT simulations driven by orbital data can adequately reproduce seasonal flow patterns and water balance components, although uncertainties remain during extreme events [3]. Similarly, evaluations of reanalysis products such as ERA5-Land in Alpine and Cerrado basins [12,23] indicate good performance for temperature-driven processes, while emphasizing the key role of evapotranspiration and soil–vegetation interactions in shaping hydrological responses under climate variability. More recently, ref. [24] highlighted the potential of GloFAS–ERA5 discharge reanalysis data to support SWAT calibration in data-scarce regions, while cautioning about uncertainty propagation in climate change applications. Building on this perspective, recent SWAT-based studies have increasingly emphasized the importance of integrating climate-driven hydrological changes with land-use dynamics and water demand analyses to better characterize future water security. For instance, ref. [1] demonstrated that land-use transitions under alternative development pathways can significantly alter the balance between water supply and demand, often amplifying climate-induced pressures in dryland and transitional regions. Similarly, applications in semi-arid and agricultural basins highlight that irrigation demand and cropping patterns can offset or even outweigh projected changes in runoff, underscoring the need to jointly assess hydrological availability and consumptive use [25,26]. Advances in calibration and uncertainty analysis, such as the use of SUFI-2 and spatially explicit HRUs, have improved the robustness of SWAT simulations in data-scarce basins of Latin America and elsewhere [27], while regional reviews confirm the model’s flexibility across contrasting hydroclimatic settings, including Mediterranean and tropical catchments [15].
Despite its wide applicability, SWAT implementation requires reliable hydrometeorological time series and rigorous calibration and validation procedures, commonly supported by tools such as SWAT-CUP and multi-site SUFI-2 approaches [13]. Although it simplifies certain processes such as the heterogeneity of watersheds or deep groundwater flow, it offers robust results for general trends and water planning at the basin scale [15]. Thus, SWAT constitutes a suitable tool for integrating water balance and physical basin modeling, facilitating integrated resource management and the assessment of climate change impacts in the watershed [28,29]. SWAT’s ability to integrate physical processes and simulate the watershed-scale hydrological system, one of the main challenges in its implementation is the scarcity of input climate data, particularly continuous precipitation and temperature series, which are essential for calculating runoff, evapotranspiration, and baseflow [3,19]. This limitation is common in watersheds of developing countries or remote regions, where meteorological stations are few, records are incomplete. To overcome these barriers, satellite and reanalysis products such as ERA5-Land and CHIRPS [30], provide precipitation and temperature estimates with broad spatial coverage and daily or monthly temporal resolution [31]. Several studies have shown that the use of these products enables reliable simulations of the water balance and watershed stability, even in basins with limited monitoring, thereby increasing the applicability of the SWAT model in regions with scarce hydrometeorological information [24]. However, it is important to consider that these datasets require local validation and bias correction, [32].
The Water Regulation Index (WRI) is an indicator that assesses a basin’s capacity to moderate flow variability and maintain water availability over time [33]. high WRI reflects a basin with effective hydrological regulation, in which runoff processes and surface and groundwater storage attenuate streamflow variability during extreme events and sustain baseflow conditions during dry periods. In contrast, a low WRI indicates limited regulatory capacity, making the basin more vulnerable to hydrological extremes such as droughts and floods [18]. This indicator, along with surface water supply (SWS) modeling and the analysis of future climate scenarios, is fundamental for the planning and sustainable management of water resources [34].
With the above described, the present research aims to evaluate the dynamics of the hydrological system in the face of future climate change scenarios proposed by the IPCC (RCPs) in the San Pedro river basin, located in the municipality of Puerto Libertador, considering the seasonal variability in precipitation, temperature projections and the water regulation capacity of the basin. Unlike previous SWAT-based climate impact studies that primarily focus on streamflow magnitude [3,13,19], this study evaluates hydrological regulation through the Water Regulation Index (WRI), explicitly accounting for storage and flow buffering processes under climate change scenarios.
Based on this context, the present study addresses the following research questions: (i) how does climate change under RCP 4.5 and RCP 8.5 scenarios affect surface water supply and streamflow variability in the San Pedro River basin? (ii) How do projected climate changes influence the basin’s water regulation capacity as quantified by the Water Regulation Index (WRI)?
2. Materials and Methods
The study area is in the municipality of Puerto Libertador, Córdoba, and corresponds to the San Pedro River basin, with an area of 710 km2, as shown in Figure 1. It is situated within the so-called warm lowlands with abundant rainfall (multiannual average between 2000 and 4000 mm) and high temperatures (average between 24 °C and 36 °C) [35]. Geographically, the San Pedro River basin is located between the coordinates −75°48′ W, 8°0′ N and −75°36′ W, 7°36′ N. The availability of weather stations in the study area is limited; there is only one rain gauge within the basin. Therefore, the use of CHIRPS (Climate Hazards Group, University of California, Santa Barbara, CA, USA) and ERA5-Land reanalysis data (European Centre for Medium-Range Weather Forecasts, ECMWF, Reading, UK) were used as inputs for the construction of the hydrological model [36]. It should be noted that the Soil and Water Assessment Tool (SWAT; USDA Agricultural Research Service, USA) is a semi-distributed model, so the extraction of precipitation and temperature series is carried out using virtual stations.
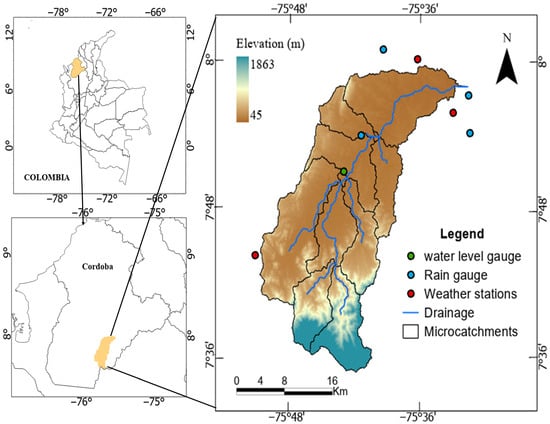
Figure 1.
Location map of the San Pedro river basin, located in the municipality of Puerto Libertador, department of Córdoba (Colombia).
2.1. SWAT Hydrology
The SWAT (Soil and Water Assessment Tool) model is a distributed, continuous simulation hydrologic model developed by the USDA-ARS (United States Department of Agriculture—Agricultural Research Service, Beltsville, MD, USA). It is designed to predict the impact of land-use management practices, climatic conditions, and environmental changes on water resources, sediments, and water quality in watersheds at various spatial and temporal scales [37].
The hydrological component of SWAT is based on the soil water balance, expressed by Equation (1):
where the following definitions are used:
- = soil water content at time t (mm);
- = initial soil water content (mm);
- = daily precipitation (mm);
- = surface runoff (mm);
- = evapotranspiration (mm);
- = percolation or flow into the vadose zone (mm);
- = baseflow or discharge from the aquifer into the channel (mm).
The model divides the basin into sub-basins and subsequently into Hydrological Response Units (HRUs), which represent homogeneous areas according to soil type, vegetation cover, and slope. This allows for the spatially accurate simulation of hydrological processes, as illustrated in Figure 2.
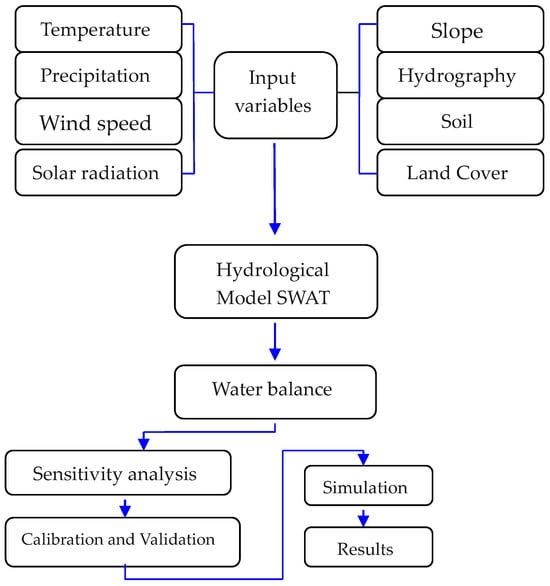
Figure 2.
SWAT hydrological model methodological flow.
2.2. Data Acquisition
The proper execution of the SWAT model depends on the availability and quality of the spatial and climatic information that feeds it [38]. For this study, four main inputs were used: the Digital Elevation Model (DEM), the soil map, the land use and land cover (LULC) map, and climatic data. The modeling was performed in ArcSWAT. The DEM was obtained from ALOS PALSAR, with a spatial resolution of 12.5 m, and was used for watershed delineation and the generation of topographic parameters (such as slope). The soil map was provided by the Agustín Codazzi Geographic Institute (IGAC), while the land cover map came from IDEAM, with a resolution of 100,000 m. Due to the limited availability of observed data in the study basin, climate data were obtained from satellite products and reanalysis. Daily precipitation was obtained from CHIRPS (0.05° resolution), and temperature, solar radiation, humidity, and wind variables were obtained from ERA5-Land (0.1° resolution) [23,39]. All datasets were processed at a daily scale and clipped to the study area for subsequent integration into the SWAT model.
The basin exhibits marked topographic variability, with slopes ranging from 0 to over 15%. Areas with gentle slopes (0–12%) predominate in the northern and central parts, while moderate (12–25%) and steep (>25%) slopes [40], are concentrated mainly towards the south and southwest of the basin (Figure 3a) [41]. This distribution directly influences runoff processes and flow generation within the SWAT model [37]. Regarding land cover, the basin exhibits a heterogeneous mosaic dominated by agricultural land, mixed forests, and pastures (Figure 3b). Agricultural areas, both general and row crops, are distributed in the areas of lower slope, while forests and pastures predominate in the higher and steeper areas. This land use pattern has a significant impact on simulated infiltration and evapotranspiration [42].
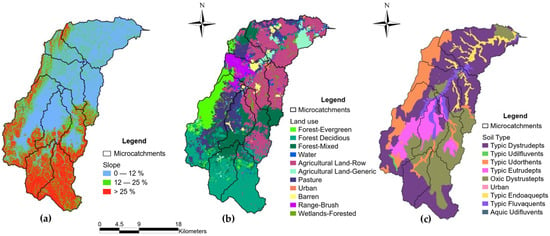
Figure 3.
Spatial input maps used in the configuration of the SWAT model for the San Pedro River basin (Puerto Libertador, Córdoba): (a) slope map derived from the digital elevation model (DEM), (b) land cover and land use map, and (c) map of soil mapping units.
Regarding soil types, the main orders identified were Dystropepts, Udifluvents, and Eutropepts, with subgroups such as Typic Dystropepts, Typic Udifluvents, and Oxic Dystropepts (Figure 3c) [37]. Dystropept and Eutropept soils, characteristic of mountainous areas, predominate in the higher elevations and exhibit good drainage, while Udifluvents are located in flatter areas associated with recent alluvial deposits [41]. Overall, the spatial variation in slope, land cover, and soil type influences the hydrological behavior of the basin, affecting key parameters of the SWAT model such as surface runoff, aquifer recharge, and soil water retention.
2.3. SWAT Model Configuration
The SWAT model simulates the hydrological cycle in two main phases: runoff generation and the concentration of surface flow along the drainage network [42]. For its implementation, the watershed was divided into sub-basins and hydrological response units (HRUs), which allowed for a detailed representation of the spatial heterogeneity of land cover, slope, and soil types [24].
2.4. Model Calibration
The calibration strategy focused on achieving stable and physically consistent parameter sets suitable for climate change impact assessment, rather than maximizing goodness-of-fit metrics through extensive parameter tuning, the calibration and validation of the SWAT model were performed using SWAT-CUP software (Version 5.1.6), employing SUFI-2 (Sequential Uncertainty Fitting, version 2) [43].
This procedure allows for adjusting the model’s most sensitive hydrological parameters to reduce the difference between simulated and observed flows, ensuring a more realistic representation of hydrological processes. SWAT-CUP is a complementary tool to the SWAT model designed to perform the calibration, validation, and uncertainty analysis of its hydrological parameters [13,44]. The total simulation period spanned the years 1990–2013, of which 1990–1992 was considered a warm-up period, 1993–2003 for calibration, and 2004–2013 for model validation.
The process was run on a monthly timescale due to gaps in the daily flow series. The most sensitive hydrological parameters were selected based on the literature and previous experience with SWAT (Table 1), defining an initial variation range for each [22]. The SUFI-2 algorithm generated a set of 400 automatic simulations, progressively optimizing the parameter values until the best fit was achieved [16].

Table 1.
Selected hydrological parameters and initial value ranges used in the SWAT model calibration.
The model’s performance was evaluated using Nash–Sutcliffe (NSE, Equation (1)) statistics, the Coefficient of Determination (R2, Equation (2)), and the Bias Percentage Index (PBIAS, Equation (3)), complemented by the p-factor and r-factor uncertainty indices, corresponding to the 95% prediction interval (95PPU) [45]. Once calibration was complete, the adjusted parameters were incorporated into the model for independent validation, verifying the predictive capacity of SWAT in the subsequent period [46]. His process allowed for the identification of the model’s reliability in simulating the flow rate at the San Pedro AUT station, as well as quantifying the uncertainty associated with the calibrated parameters [26].
Nash–Sutcliffe efficiency coefficient (NSE):
Correlation coefficient R2:
Percent Bias (PBIAS):
where is the observed value, is the estimated or predicted value, and and are the mean observed and simulated values, respectively.
NSE assesses the overall predictive skill of the model by quantifying the agreement between simulated and observed streamflow and penalizing large errors. The correlation coefficient evaluates the model’s ability to reproduce the temporal variability and dynamic behavior of the observed flow, while PBIAS measures the average tendency of the simulated values to overestimate or underestimate observations [3,44]. The combined use of these complementary metrics provides a robust assessment of model performance, capturing accuracy, variability, and systematic bias, and is considered sufficient for climate change impact studies when the model has been properly calibrated and validated [46]. The SUFI-2 method assumes that all uncertainty in the input data, parameters, and model structure is reflected in the uncertainty of the simulated outputs. To reduce this uncertainty, the user defines initial ranges for the parameters, within which SUFI-2 generates multiple combinations using Latin hypercube sampling (LHS). Each set is run in SWAT and evaluated against observed flow rates using the NSE, PBIAS, and R2 indicators [43].
A sensitivity analysis was conducted using the SUFI-2 algorithm in SWAT-CUP to identify the most influential parameters controlling the hydrological response of the basin. Table 2 indicate that parameters related to surface runoff and groundwater processes were the most sensitive, particularly CN2.mgt, GWQMN.gw, and RCHRG_DP.gw, which regulate runoff generation, baseflow contribution, and deep percolation, respectively. Similar sensitivities have been reported in previous SWAT applications [47].
Table 2.
Parameters adjusted during the SWAT model calibration process using the SUFI-2.
Soil-related parameters such as SOL_K and SOL_AWC showed moderate sensitivity, reflecting their role in infiltration and soil water storage (Table 2). Overall, the sensitivity analysis highlights the dominant role of surface runoff and groundwater dynamics in controlling streamflow variability in the basin, supporting their prioritization during calibration [48,49]. Taken together, these results reflect that surface runoff and groundwater dynamics are the main drivers of the basin’s hydrological regime, making their proper calibration essential to ensure the representativeness of the SWAT model.
During the calibration phase, the model obtained a Nash–Sutcliffe Efficiency Coefficient (NSE) of 0.52, a Coefficient of Determination (R2) of 0.55, and a Percentage Bias (PBIAS) of –12.6%, indicating acceptable performance according to the criteria of [44]. These results show that the model reasonably reproduces the monthly variability in the flow rate, although it presents a slight overestimation in the simulated values (Figure 4).
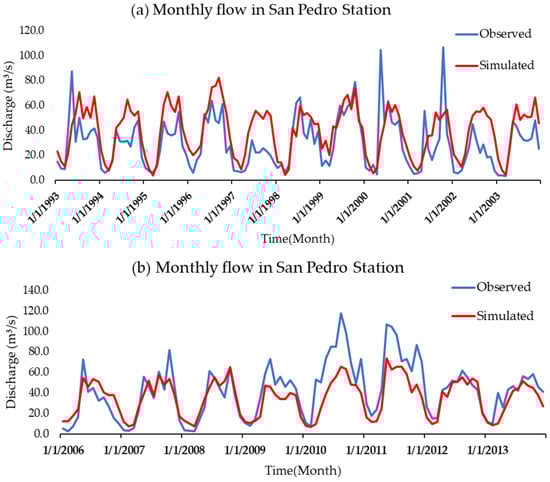
Figure 4.
Observed and simulated multi-year time series of mean monthly flow during the (a) calibration (1993–2003) and (b) validation (2006–2013) of the SWAT model in the San Pedro River basin.
During the validation period, the fit indicators improved, reaching NSE = 0.61, R2 = 0.71, and PBIAS = 12%, reflecting a greater correspondence between simulated and observed flows (Table 3). This behavior suggests that the model maintains its predictive capacity outside the calibration range, demonstrating stability and temporal consistency in the hydrological simulation.
Table 3.
SWAT model performance statistics during monthly calibration and validation in the San Pedro River basin.
In general, the calibrated model satisfactorily represents the monthly hydrological response of the basin, adequately reproducing the patterns of increase and decrease in flow. However, there was a slight underestimation of peak runoff c with the limitations of the CHIRPS and ERA5-Land satellite products in detecting extreme precipitation events in tropical areas. Despite these limitations, the overall performance of the model is robust and acceptable for hydrological simulation and scenario evaluation in the San Pedro River basin.
2.5. Acquisition of Future Climate Data
The MIROC5 model (Model for Interdisciplinary Research on Climate), part of the CMIP5 suite, was used to project climate change scenarios under the RCP 4.5 and RCP 8.5 emission scenarios for the period 2040–2070 [2,50]. Data were obtained from the NEX-GDDP project (NASA Earth Exchange Global Daily Downscaled Projections https://www.nccs.nasa.gov/services/data-collections/land-based-products/nex-gddp (accessed on 15 January 2024)), which provides spatially downscaled climate information at a resolution of 0.25°. Virtual stations were defined for the extraction of the series as shown in Figure 5. The MIROC5 model was selected due to its proven performance in simulating temperature and precipitation patterns in tropical regions and its extensive use in climate change impact studies in Latin America. Previous evaluations have shown that MIROC5 adequately reproduces large-scale atmospheric circulation and interannual climate variability associated with ENSO, which is a dominant driver of hydroclimatic variability in northern Colombia. In addition, MIROC5 outputs are consistently available within the NEX-GDDP dataset, ensuring methodological coherence and comparability with previous regional assessments.
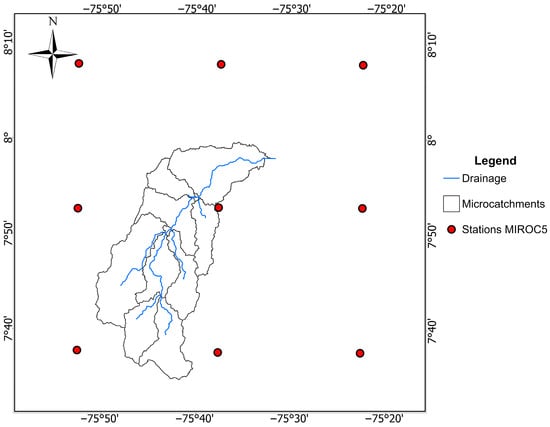
Figure 5.
Spatial location of the virtual stations used for the extraction of projected climate data from the MIROC5 global model under the RCP 4.5 and RCP 8.5 scenarios.
These scenarios were selected to represent contrasting and widely adopted future emission pathways in climate impact assessments. RCP 4.5 corresponds to an intermediate stabilization scenario, whereas RCP 8.5 represents a high-emission pathway that allows the evaluation of more extreme climate change impacts [2]. Lower- and intermediate-forcing scenarios such as RCP 2.6 and RCP 6.0 were not considered, as they either assume strong mitigation efforts that are less relevant to the scope of this regional impact study or provide climate responses that are largely intermediate between RCP 4.5 and RCP 8.5, while also presenting more limited model availability [50]. The projections adopted the same time scale used by IDEAM in its national climate assessments [48,51], with a simulation window from 2037 to 2070, considering three years of initial warming.
The analysis focused on the mid-century period (2040–2070), which is commonly adopted in climate impact assessments to capture stabilized climate signals while limiting the uncertainty associated with near-term variability (2025–2039) and far-future projections (2071–2099). This temporal window also ensures consistency with national climate assessments conducted in Colombia, facilitating comparison and interpretation of results.
2.6. Water Regulation Index (WRI)
The Water Regulation Index (WRI) was estimated following the methodology of the National Water Study [40]. This indicator expresses a basin’s capacity to regulate its flow regime, based on the Flow Duration Curve (FDC) generated with the daily flows simulated in SWAT [52]. For each sub-basin, the Weibull distribution was applied to the daily flows of the RCP 4.5 and RCP 8.5 scenarios, obtaining the respective FDCs. The WRI was calculated as the ratio between the partial volume (Vp) (area under the curve corresponding to the mean flow) and the total volume (Vt) (total area under the FDC) according to Equation (5):
The WRI values were interpreted according to the categories established by IDEAM [33], classifying water regulation into ranges of poor, moderate, good, or high. The comparison between historical WRI values (1990–2020) and future values allowed for the analysis of possible changes in the basin’s regulation capacity under projected climatic conditions.
3. Results
The hydrological response of the basin to projected climate change was evaluated through SWAT simulations under RCP 4.5 and RCP 8.5 scenarios, using the historical period as a reference. The results highlight changes in streamflow behavior and key water balance components driven by variations in precipitation and temperature patterns. Emphasis is placed on the comparison between future scenarios and current conditions, allowing the identification of emerging trends, relative differences between emission pathways, and their implications for water regulation capacity. These findings provide a clear basis for assessing the sensitivity of the basin to climate forcing and for supporting decision-making in the context of long-term water resources planning.
3.1. Modeling 1990–2020
It is important to point out that between the years 2010–2012, several La Niña events occurred, causing heavy rains in the municipality of Puerto Libertador, contributing to the significant increase in the flow of the San Pedro River during these years [40,51]. The results of the historical hydrological modeling (Figure 6) show an average precipitation of 3064.40 mm for the San Pedro River basin, reflecting the humid tropical conditions characteristic of the region [6].
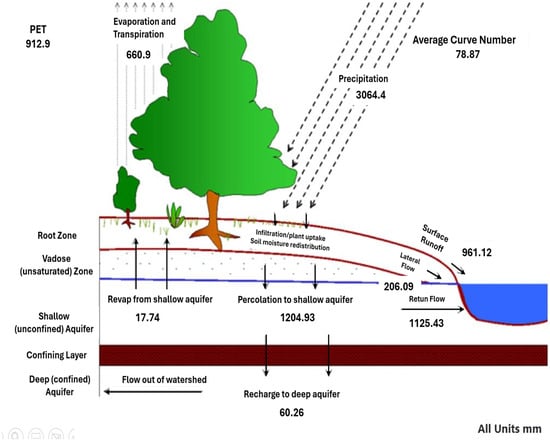
Figure 6.
Results of hydrological modeling (1990–2020) in the San Pedro River basin. Arrows indicate flow directions, and numbers show water fluxes in mm for each component: potential evapotranspiration (PET), actual evapotranspiration, surface runoff, lateral flow, shallow aquifer return, recharge to shallow and deep aquifers, and re-evaporation (revap) from the shallow aquifer. All units are in mm.
Approximately 30.4% (912.90 mm) corresponded to potential evapotranspiration (PET), while actual evapotranspiration reached an average value of 660.90 mm, evidencing a moderate water limitation of the soil associated with vegetation cover and soil properties [18]. Surface runoff represented a significant fraction of the balance, with an average of 961.12 mm, influenced by the mean Curve Number (CN) value of 78.87, which suggests a predominance of agricultural land and pastures with medium to low infiltration capacity. Lateral flow and shallow aquifer return contributed 206.09 mm and 1125.43 mm, respectively, indicating high hydrological connectivity between the soil and the underground system [42].
Regarding recharge to the shallow aquifer, the model estimated a value of 1204.93 mm, while recharge to the deep aquifer was 60.25 mm, confirming that most of the groundwater flow remains in the unconfined zone. Finally, re-evaporation (revap) from the shallow aquifer to the unsaturated zone represented 17.74 mm, a minor but relevant contribution to the dynamics of moisture storage [30].
3.2. Future Climate Series 2040–2070
Annual precipitation series and projected monthly averages for the San Pedro River basin were analyzed for the period 2040–2070 under the RCP 4.5 and RCP 8.5 scenarios, contrasting them with the reference historical series [53]. Figure 1 and Figure 2 present, respectively, the annual series with their linear fit and the composite monthly averages for the projection period.
The annual series shows high interannual variability in both scenarios, with values ranging from approximately 1500 to 3500 mm (Figure 7). The least squares fit applied to each series shows slopes of opposite signs, negative in the RCP 4.5 scenario and positive in the RCP 8.5 scenario. The magnitude of these linear changes is low in relation to the observed interannual dispersion, so the detected trend represents a small-amplitude component compared to the year-to-year oscillations. Visually, the RCP 4.5 scenario tends toward slightly lower mean values toward the end of the period [54], while RCP 8.5 shows a slight increase in mean annual precipitation.
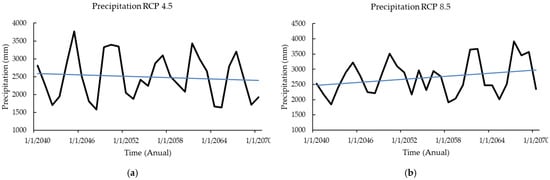
Figure 7.
Projected precipitation series for the San Pedro river basin under the RCP 4.5 (a) and RCP 8.5 (b) scenarios of the MIROC5 model for the period 2040–2070.
Regarding the monthly distribution, the compositions for the period 2040–2070 indicate that the seasonal rainfall pattern is maintained, with peaks concentrated in the first half of the year. However, differences in the magnitude of precipitation are observed compared to historical climatology. In the RCP 8.5 scenario, the projected monthly averages show a relative increase between April and June, months in which the main difference with the historical period is concentrated [20,52]. In the RCP 4.5 scenario, the monthly averages are, in general terms, at similar or slightly lower values than those historically observed. These variations do not imply a shift in the seasonality of the rainfall regime, as the peaks continue to be concentrated in the months corresponding to the wet season.
Figure 8 shows a higher precipitation regime under the RCP 8.5 scenario, with maximum monthly values reaching between 300 and 320 mm, in contrast to the lower values recorded for RCP 4.5 [55]. This behavior suggests that the projected increase in average temperature for the higher emissions scenario could intensify evaporation processes from oceans and continental surfaces, increasing atmospheric humidity and, consequently, enhancing regional precipitation [20,56]. These results are consistent with those reported in [56], which indicates that during the near future (2020–2040), climate projections show variations in the temporal distribution of precipitation without significant increases in its intensity or frequency. However, from the medium future (2040–2070) onward, the greatest differences between scenarios are projected, attributable to the cumulative effect of the increase in GHG concentration [2]. This increase would induce an intensification of the hydrological cycle, expressed in greater volumes of precipitation during the wet season and in the possible appearance of longer and more contrasting dry spells between periods.
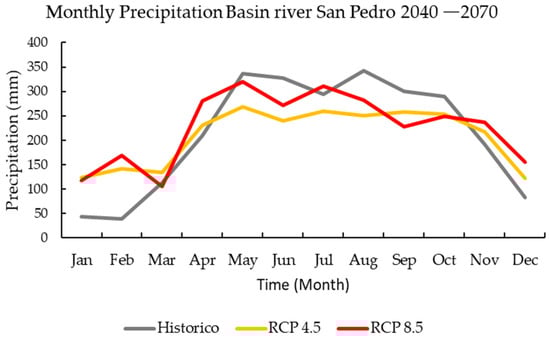
Figure 8.
Comparison of the average monthly multi-year precipitation between the historical period (1990–2020) and the future scenarios RCP 4.5 and RCP 8.5 (2040–2070) in the San Pedro River basin.
The projected thermal behavior for the period 2040–2070 shows a sustained increase in both maximum and minimum temperatures compared to the historical period under both greenhouse gas (GHG) concentration scenarios. For the average monthly maximum temperature, projections indicate values higher than historical averages throughout the year, with a more pronounced increase under the RCP 8.5 scenario, which reaches values close to 33–34 °C in March and April, compared to 31–32 °C under the RCP 4.5 scenario and 29–30 °C in the historical record. This behavior demonstrates a shift in the thermal range towards higher values and a widening of the seasonal gradient, particularly between the wet (April–June) and dry (December–February) months [54].
Regarding the average monthly minimum temperature, the projections also reveal a generalized increase compared to historical conditions, although of a smaller relative magnitude than that observed in maximum temperatures. The RCP 8.5 scenario maintains values higher than those of RCP 4.5 for almost the entire year, with differences ranging between 0.3 °C and 0.8 °C (Figure 9), reaching the greatest contrasts in July to September. In both scenarios, minimum temperatures tend to stabilize towards the end of the year, suggesting a reduction in the daily temperature range. Overall, the results reflect a regional temperature intensification consistent with the projected increase in GHG concentrations [57], being more pronounced in the RCP 8.5 scenario. This temperature increase could have direct implications for potential evapotranspiration and local water dynamics, by favoring higher evaporation rates and modifying the surface energy balance.
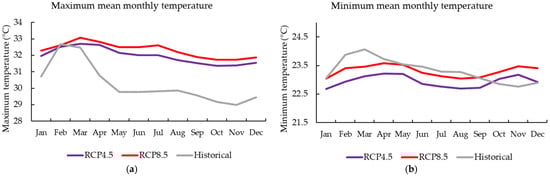
Figure 9.
Projections of the average monthly maximum (a) and minimum (b) temperatures under the RCP 4.5–8.5 scenarios compared to the historical period (1990–2020) for the San Pedro River basin.
As shown in Figure 10, both scenarios exhibit high interannual variability, with peak discharges exceeding 70 m3/s, although with notable differences in the frequency and intensity of extreme events. Under the RCP 4.5 scenario, flows show a more irregular distribution with alternating periods of high and low inflows, reaching maximum values around 60–70 m3/s. Some stability is evident in the average values, suggesting that under moderate mitigation conditions, the hydrological regime could remain within a range like the current one, although with isolated high-discharge events.
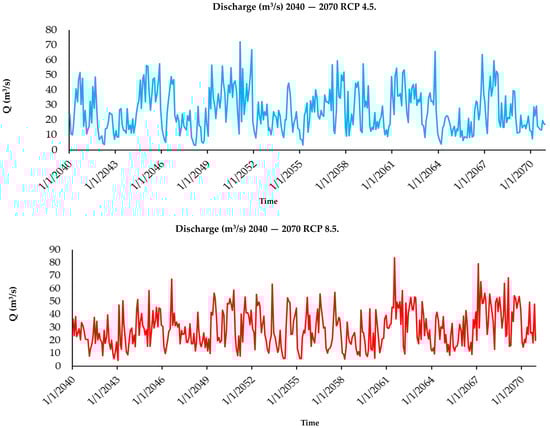
Figure 10.
Time series of simulated flow (m3/s) for the period 2040–2070 under the RCP 4.5 and RCP 8.5 scenarios in the San Pedro River basin.
In contrast, under the RCP 8.5 scenario, high-discharge events become more intense and persistent, reaching peak values of approximately 80–90 m3/s, while low-flow phases tend to be more prolonged. This pattern reflects a substantial increase in hydrological variability, characterized by a wider range between wet and dry conditions. Such behavior is likely linked to the projected rise in air temperature and shifts in precipitation patterns, which together intensify evapotranspiration demand and promote short-duration, high-intensity rainfall events. These processes enhance surface runoff during wet periods and exacerbate soil moisture deficits during dry spells, reducing baseflow contributions to the river system.
Therefore, the basin is expected to experience a more unstable hydrological regime, with higher flood risk during extreme precipitation events and longer periods of reduced streamflow that may compromise water availability. These changes have important implications for agricultural production, domestic water supply, and aquatic ecosystems, particularly through altered flow seasonality and increased stress on ecological processes. The projected conditions under RCP 8.5 highlight the need for adaptive water resources management strategies that account for greater climatic uncertainty, strengthen basin regulation capacity, and integrate climate change mitigation efforts to reduce vulnerability to the most critical future scenarios.
Table 3 shows the corresponding percentile comparison. A decrease in the magnitude of the less frequent peaks (occurring at 10% and 25%), i.e., the highest flows, is evident, of approximately 15 m3/s for scenario 4.5 RCP and 14 m3/s for scenario 8.5 RCP, compared to historical data. A decrease in the magnitude of the peaks with medium occurrence also observed, of approximately 18 m3/s for scenario 4.5 RCP and 16 m3/s for scenario 8.5 RCP, compared to historical data. Finally, an increase in the magnitude of the low flows (occurring at 75%) of approximately 0.1 m3/s observed for scenario 8.5 RCP, and a decrease of 2 m3/s for scenario 4.5 RCP, compared to historical data. An increase in the magnitude of low flows (occurring at 75%) of approximately 0.14 m3/s observed for the RCP 8.5 scenario, while for the RCP 4.5 scenario there is a decrease of approximately 2.5 m3/s in these low flows.
For the months of January–March, both climate change scenarios show an increase in average flow from approximately 11 m3/s to 20 m3/s, indicating that the scenarios exhibit slightly better water supply conditions for dry seasons (Figure 11). However, this does not necessarily indicate greater resource availability, as this depends on the distribution of flows throughout the basin. On the other hand, a significant decrease in average flow values is expected for the months of May–November in the San Pedro River basin, with a difference of 20 m3/s for the RCP 8.5 scenario and a difference of 25 m3/s for the RCP 4.5 scenario. In general, the RCP 4.5 scenario exhibits the worst conditions for water supply in the medium future (2040–2070), directly influenced by the distribution and frequency of rainfall intensity for this scenario.
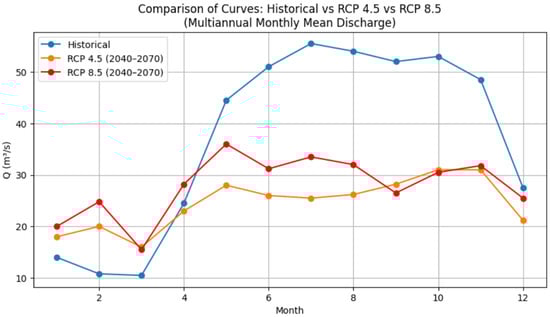
Figure 11.
Comparison of Curves: Historical vs. RCP 4.5 vs. RCP 8.5 (Multiannual Monthly Mean Discharge).
The pronounced reduction in wet season flows, particularly under the RCP 4.5 scenario, indicates a diminished capacity of the basin to store excess rainfall and gradually release it during drier periods. In contrast, the higher flows projected under RCP 8.5 may be explained by more intense precipitation events that enhance direct runoff but reduce infiltration and groundwater recharge. This behavior reinforces the decline observed in the Water Regulation Index, as greater flow variability and reduced storage efficiency undermine the basin’s natural buffering capacity. From a water management perspective, these results imply that future water security in the San Pedro River basin will depend less on total flow volumes and more on maintaining hydrological regulation processes through ecosystem conservation and land-use management.
3.3. Water Regulation Index
The Water Regulation Index (WRI) calculated for the 11 sub-basins defined above by integrating the results obtained from the modeling. Subsequently, the WRI results under RCP 4.5 and RCP 8.5 climate change scenarios compared with the historical WRIs from 1990 to 2022, obtained from the historical modeling. The results indicate a current good water regulation condition for 9 sub-basins and a fair condition for sub-basins 4 and 7. Under the RCP 4.5 scenario, a decrease in WRI is evident, resulting in moderate regulation for sub-basins 2, 3, and 10. Under the RCP 8.5 scenario, a moderate water regulation condition is observed for most sub-basins, with sub-basins 5, 6, and 8 whit good water regulation.
According to Figure 12, the overall condition of the total surface water supply for the San Pedro River basin is moderately good for the period 2040–2070 under both climate change scenarios evaluated. However, the potential changes in water regulation in the upper part of the basin, where Paramillo National Natural Park is located, are particularly noteworthy. This area represents a significant source of rivers, including the San Pedro River, making the conservation of the dense forests in this region a priority. The middle and lower parts of the basin would be much more impacted under the RCP scenarios. This explained by the land cover in these areas, which is a mosaic of crops and pastures, leaving the soil unprotected and susceptible to erosion. This affects infiltration and runoff processes and reduces the basin’s capacity to regulate water.
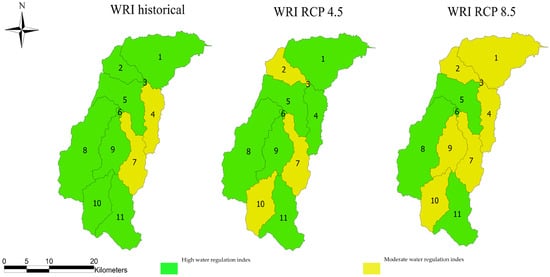
Figure 12.
Water Regulation Index (WRI) for the historical period and future scenarios RCP 4.5 and RCP 8.5. The spatial transition from areas with high water regulation capacity (green) to areas with moderate regulation (yellow) observed under climate change conditions. Numbers within the maps indicate the 11 sub-basins described in the text.
The Water Regulation Index (WRI) reveals that both RCP 4.5 and RCP 8.5 scenarios lead to a decline in the basin’s hydrological regulation capacity. Under RCP 4.5, this reduction is associated with decreasing mean flows and persistent dry-season deficits. In contrast, although RCP 8.5 exhibits higher monthly flows during certain periods, the WRI indicates that these increases driven by faster runoff processes rather than improved water storage. As a result, higher discharges under RCP 8.5 do not translate into better regulation but reflect a more unstable and reactive hydrological regime. These results highlight the importance of using the WRI alongside streamflow analyses to accurately assess climate change impacts on hydrological stability.
4. Discussion
The main objective of this study was to evaluate the impacts of mid-century climate change (2040–2070) on hydrological behavior and water regulation capacity in the San Pedro River basin using the SWAT model and the Water Regulation Index (WRI) under RCP 4.5 and RCP 8.5 scenarios. The results demonstrate that the calibrated SWAT model adequately reproduces the observed hydrological dynamics, providing a reliable basis for scenario analysis. The simulations indicate a generalized reduction in streamflow across most flow conditions, accompanied by increased evapotranspiration and altered runoff generation processes. These changes translate into a measurable decline in hydrological regulation capacity, with most sub-basins shifting from good to medium WRI conditions.
The calibration and validation of the SWAT model using the SUFI−2 module of SWAT-CUP yielded acceptable metrics (NSE > 0.6, PBIAS within ±15%) (Table 3), demonstrating adequate model performance in reproducing the observed hydrological dynamics. These values are within the ranges recommended by [44] and are comparable with similar studies conducted in tropical basins in Colombia [4,48,58]. The model’s ability to represent the hydrological cycle was influenced by the scarcity of local meteorological stations, which necessitated the use of satellite products (CHIRPS and ERA5-Land) as the primary source of information. The high correlation obtained between CHIRPS and observed data (R = 0.8) as shown in Table 2, supports its applicability in areas with low observation density, as reported in [3,59]. The simulated water balance indicates that, despite high precipitation, hydrological regulation in the San Pedro River basin is constrained by runoff-dominated processes associated with agricultural land use and limited soil infiltration, consistent with other tropical Andean basins [25,58]. The model application supports the interpretation of relative hydrological responses to future climate scenarios at the basin scale, particularly in data-scarce contexts.
The projected precipitation patterns for the 2040–2070 period under the RCP 4.5 and RCP 8.5 scenarios indicate that the basin preserves its historical rainfall seasonality, with precipitation maxima remaining concentrated in the first half of the year [55,56]. As shown in Figure 8, under RCP 8.5 the precipitation is projected to increase during the core wet-season months (April–June), suggesting an intensification of rainfall rather than a shift in its temporal distribution, whereas under RCP 4.5 monthly precipitation remains like or slightly lower than historical values. This behavior implies that future hydrological impacts are likely driven by changes in rainfall intensity rather than alterations in the seasonal regime [36,38]. Temperature projections further reinforce this interpretation, as both scenarios show sustained increases in maximum and minimum temperatures relative to the historical period, with a markedly stronger warming signal under RCP 8.5 [54,55,60] (Figure 9). Projected monthly maximum temperatures reach approximately 33–34 °C in March and April under RCP 8.5, compared to 31–32 °C under RCP 4.5 and 29–30 °C historically, reflecting a clear upward shift in the thermal regime and an amplification of seasonal temperature variability [9,60].
The most pronounced decreases occur under median- and high-flow conditions (P50–P90) (Table 4), where reductions exceed 16 m3/s in both scenarios, suggesting that future climate change is likely to diminish not only extreme flows but also the core of the annual discharge regime. This pattern reflects a contraction of the flow distribution, potentially driven by increased evapotranspiration demand and changes in precipitation seasonality [1,56,60], which together reduce effective runoff generation. Although low-flow conditions (P25) show a slight increase under RCP 8.5, this response is marginal and insufficient to compensate for the substantial losses observed at higher percentiles, indicating limited buffering capacity during dry periods (Table 4). Under the RCP 4.5 scenario, a general reduction in mean and low flows was projected, indicating an intensification of water deficits during the dry season (Figure 11). In contrast, the RCP 8.5 scenario showed a relative increase in low flows accompanied by a slight reduction in peak flows, suggesting a redistribution of runoff processes and enhanced hydrological variability [58,61]. Despite higher flows under RCP 8.5, discharge redistribution reflects a less regulated regime, with concentrated runoff and reduced storage efficiency such that increased mean monthly flows do not necessarily improve water availability or regulation [39,55].
Table 4.
Comparison of historical and projected flow percentiles under RCP 4.5 and RCP 8.5 scenarios (period 2040–2070).
From a water management perspective, these changes have critical implications for the municipality of Puerto Libertador. Under RCP 4.5, persistent reductions in streamflow could exacerbate dry-season water deficits, affecting agricultural supply, domestic use, and ecosystem services. Under RCP 8.5, although higher flows may temporarily increase water availability during certain months, the increased variability and concentration of runoff elevate the risks of flooding during the rainy season and water scarcity during prolonged dry periods. This dual pressure complicates operational water management and infrastructure planning.
The analysis focused on the mid-century period (2040–2070); during this period, projected increases in air temperature enhance atmospheric evaporative demand, directly affecting evapotranspiration rates, soil moisture availability, groundwater recharge, and baseflow contributions [2]. The hydrological processes related to water storage and delayed flow release, such as groundwater recharge and baseflow, are expected to be clearer. This makes the 2040–2070 period particularly suitable for assessing changes in water regulation capacity as quantified by the WRI. A limitation of this study is that near-term projections (2025–2039) were not analyzed because this period may be more strongly influenced by short-term climate variability, making it more difficult to isolate long-term trends in hydrological response. Likewise, late-century projections (2071–2099) were not included due to the increasing uncertainty associated with climate projections toward the end of the century. Future research could extend the analysis to additional time horizons to provide a more comprehensive assessment of hydrological change and its implications for water regulation.
The WRI revealed a decrease in the basin’s regulatory capacity for the period 2040–2070, shifting from a good to a medium condition in most sub-basins (Figure 12). This result coincides with observations by in the La Vieja basin [62], who report significant reductions in the WRI associated with the loss of forest cover and the increase in potential evapotranspiration. The negative trend in the WRI observed in the San Pedro River basin suggests a weakening of water storage and gradual release mechanisms, particularly those linked to groundwater recharge and baseflow contributions [40,61]. This reduction in hydrological regulation directly affects the resilience of the water system (Figure 12). The strong relationship between vegetation cover and water regulation highlights the role of forest ecosystems in sustaining infiltration and groundwater recharge [11,27]. Under RCP 4.5, reduced flows and recharge weaken regulations, while under RCP 8.5, the dominance of rapid surface runoff over subsurface storage leads to comparable or greater declines in regulatory efficiency despite higher discharges. This confirms that hydrological regulation depends not only on water volume but also on flow pathways and timing [38,48].
The observed reduction in hydrological regulation and streamflow under future climate scenarios is consistent with previous studies conducted in tropical and Andean basins [21], where increasing air temperature, rising evaporative demand, and land-use pressures reduce effective precipitation and groundwater recharge, leading to greater hydrological variability and reduced buffering capacity [17]. Similar climate-driven alterations in streamflow regimes and water availability have been reported in Colombian basins and other tropical environments using physically based hydrological models, including SWAT and comparable modeling frameworks [48,63]. In this context, the present study does not aim to claim methodological novelty in model application but rather contributes to a basin-scale integrated assessment combining SWAT simulations with the WRI to explicitly link projected climate forcing with changes in both water availability and regulatory capacity in a data-scarce watershed. The model performance achieved acceptable calibration metrics, the results should be interpreted with appropriate caution given the limitations associated with observational data scarcity, satellite-derived forcing uncertainty, and the inherent complexity of tropical hydroclimatic processes.
5. Conclusions
In developing this research project, a comprehensive compilation of basin-specific data was required to support model setup and scenario analysis for a subsequent projection of the climate change scenarios proposed by [2,22]. The model calibration was performed globally, which introduces a bias in the hydrological modeling of the upper and middle parts of the basin. Even so, the hydrological model exhibited acceptable to good performance statistics in terms of calibration and validation. [43]. The difference in the water balance results between the RCP 4.5 and 8.5 scenarios was not significant, but the difference between both scenarios and current conditions was noticeable. This can be attributed to the medium-term future considered (2040–2070) in the model, where the concentration of greenhouse gases does not represent a significant difference between the two scenarios, whereas it would for a more distant future (2070–2100). The hydrological model generated in this project does not fully capture the climatic variability in ENSO phenomena, making it necessary to strengthen the model with observed local climatic information.
The use of alternative satellite climate data sources showed good correlation with observed precipitation data and moderate correlation with temperature data. Climate models with higher resolution, allowing for a better description of the dynamics of climate variables at a local scale, exhibited better performance [23,59]. A total of 11 parameters used for the calibration process, including the curve number and various soil properties such as electrical conductivity and bulk density. The need to include more parameters to optimize calibration noted, as the execution time of the SWAT-CUP software is longer with additional parameters. The PBIAS, R2, and NSE statistics [8,49] allow for a precise evaluation of the simulated flow series, revealing how well they fit the observed values and the percentage by which they underestimate or overestimate them.
This study contributes to the understanding of climate change impacts on hydrological regulation in medium-sized tropical basins by combining a physically based hydrological model with a water regulation index under future climate scenarios. While similar SWAT-based studies exist, the integration of percentile-based flow analysis with regulation metrics provides a clearer representation of changes in flow distribution, which is particularly relevant for water management and ecosystem sustainability [12,48]. The results emphasize that projected hydrological impacts are driven not only by changes in mean conditions but also by alterations in flow variability, reinforcing the need to incorporate such indicators into basin-scale planning [4,55]. Despite inherent uncertainties, the findings provide consistent evidence of future pressure on water resources and support integrated modeling as a decision-support tool in data-scarce regions.
Author Contributions
Conceptualization, M.A.A.M. and T.M.F.; methodology, M.A.A.M. and T.M.F.; formal analysis, A.A.L.-L., T.M.F. and A.D.V.C., writing—original draft preparation, M.A.A.M.; writing—review and editing, A.A.L.-L., Y.S.-U., T.M.F., M.A.A.M. and A.D.V.C.; visualization, M.A.A.M.; supervision, A.A.L.-L. and T.M.F.; project administration, A.A.L.-L. and T.M.F. and A.D.V.C. All authors have read and agreed to the published version of the manuscript.
Funding
This research was funded by Universidad de Córdoba.
Data Availability Statement
The data presented in this study are available on request from the corresponding author. The data are not publicly available due to privacy restrictions.
Acknowledgments
The present study was conducted as a research project from the Faculty of Engineering, Universidad de Cordoba.
Conflicts of Interest
Authors Alvaro Alberto López-Lambraño and Yeraldin Serpa-Usta were employed by the company Hidrus S.A. de C.V. and Grupo Hidrus S.A.S. The other authors declare that the research was carried out without any commercial or financial relationships that could be construed as potential conflicts of interest.
References
- Liu, X.; Liu, Y.; Wang, Y.; Liu, Z. Evaluating Potential Impacts of Land Use Changes on Water Supply-Demand under Multiple Development Scenarios in Dryland Region. J. Hydrol. 2022, 610, 127811. [Google Scholar] [CrossRef]
- IPCC. Climate Change 2022: Impacts, Adaptation, and Vulnerability. Contribution of Working Group II to the Sixth Assessment Report of the Intergovernmental Panel on Climate Change; Cambridge University Press: Cambridge, UK, 2022. [Google Scholar]
- Rufino, P.R.; Gücker, B.; Faramarzi, M.; Boëchat, I.G.; Cardozo, F.d.S.; Santos, P.R.; Zanin, G.D.; Mataveli, G.; Pereira, G. Evaluation of the SWAT Model for the Simulation of Flow and Water Balance Based on Orbital Data in a Poorly Monitored Basin in the Brazilian Amazon. Geographies 2023, 3, 1–18. [Google Scholar] [CrossRef]
- Fernández, T.M.; Gónima, L.G.; Ortega, Á.J.Z. Análisis Del Calentamiento Global y La Oferta Hídrica a Escala Local: Estudios de Caso En El Departamento de Córdoba, Colombia; Universidad de Córdoba: Montería, Colombia, 2021. [Google Scholar]
- Bastidas-Salamanca, M.; Bayona, J.G. Pre-Feasibility Assessment for Identifying Locations of New Offshore Wind Projects in the Colombian Caribbean. Int. J. Sustain. Energy Plan. Manag. 2021, 32, 139–154. [Google Scholar]
- Municipio de Puerto Libertador. Esquema de Ordenamiento Territorial del Municipio de Puerto Libertador: Fase de Diagnóstico; Technical report; Alcaldía Municipal de Puerto Libertador: Córdoba, Colombia, 2005.
- Ivanova, Y.; Arévalo, L.C.M. Estudio de Afectación Del Servicio Ecosistémico de Regulación Hídrica Por Actividades de Agricultura En La Cuenca Del Río Gachaneca I, Páramo Rabanal. Gest. Ambiente 2020, 23, 193–202. [Google Scholar] [CrossRef]
- Zhao, G.; Gao, H.; Kao, S.-C.; Voisin, N.; Naz, B.S. A Modeling Framework for Evaluating the Drought Resilience of a Surface Water Supply System under Non-Stationarity. J. Hydrol. 2018, 563, 22–32. [Google Scholar] [CrossRef]
- Arteaga Madera, M.A. Análisis de La Oferta Hídrica Bajo Escenarios de Cambio Climático en La Cuenca del Rio San Pedro, Municipio de Puerto Libertador. Bachelor’s Thesis, Universidad de Cordoba, Córdoba, Colombia, 2024. [Google Scholar]
- Ivanova, Y.; Lugo, V.D.H.; Herrera, M.F.P. Incidencia Del Cambio de Coberturas Vegetales Sobre La Capacidad de Regulación Hídrica En La Cuenca Del Río Cuja, Colombia. Rev. EIA 2025, 22, 1–21. [Google Scholar] [CrossRef]
- Liu, Y.; Xu, Y.; Zhao, Y.; Long, Y. Using SWAT Model to Assess the Impacts of Land Use and Climate Changes on Flood in the Upper Weihe River, China. Water 2022, 14, 2098. [Google Scholar] [CrossRef]
- Rodrigues, J.; Andrade, A.; Viola, M.; Ferreira, D.; de Mello, C.; Thebaldi, M. Hydrological Modeling in a Basin of the Brazilian Cerrado Biome. Ambiente Água–Interdiscip. J. Appl. Sci. 2021, 16, 18. [Google Scholar] [CrossRef]
- Malik, M.; Qayoom, D.; Jain, M. Modelling Streamflow Using the SWAT Model and Multi-Site Calibration Utilizing SUFI-2 of SWAT-CUP Model for High Altitude Catchments, NW Himalaya’s. Model. Earth Syst. Environ. 2022, 8, 1203–1213. [Google Scholar] [CrossRef]
- Ostad-Ali-Askari, K. Investigation of Meteorological Variables on Runoff Archetypal Using SWAT: Basic Concepts and Fundamentals. Appl. Water Sci. 2022, 12, 177. [Google Scholar] [CrossRef]
- Aloui, S.; Mazzoni, A.; Elomri, A.; Aouissi, J.; Boufekane, A.; Zghibi, A. A Review of Soil and Water Assessment Tool (SWAT) Studies of Mediterranean Catchments: Applications, Feasibility, and Future Directions. J. Environ. Manag. 2023, 326, 116799. [Google Scholar] [CrossRef]
- Rahman, M.M. Hydrologic Modelling of Great Lakes Basin in Southern Ontario and Climate Change Impact Assessment. Ph.D. Thesis, University of Windsor, Windsor, ON, Canada, 2020. [Google Scholar]
- Munar, A.M.; Mendez, N.; Narvaez, G.; Campo Zambrano, F.; Motta-Marques, D.; Lyra Fialho Brêda, J.P.; Santos Fleischmann, A.; Angarita, H. Modelling the Climate Change Impacts on River Discharge and Inundation Extent in the Magdalena River Basin–Colombia. Hydrol. Sci. J. 2023, 68, 1286–1300. [Google Scholar] [CrossRef]
- Álvarez Pulido, A.J.; Yustres Quintero, L.F.; Ivanova, Y. Estimación Del Cambio de La Capacidad de Regulación Hídrica Como Respuesta a Los Cambios de Coberturas de La Tierra. Rev. EIA 2020, 18, 1–12. [Google Scholar] [CrossRef]
- Amorim, J.d.S.; Viola, M.R.; Junqueira, R.; de Oliveira, V.A.; de Mello, C.R. Evaluation of Satellite Precipitation Products for Hydrological Modeling in the Brazilian Cerrado Biome. Water 2020, 12, 2571. [Google Scholar] [CrossRef]
- Gónima, L.; Pérez Viloria, M. Analisis de La Variabilidad Climática de La Temperatura Del Aire y de La ETP Para Una Zona del Caribe Colombiano; Asociación Española de Climatología: Madrid, Spain, 2014. [Google Scholar]
- Jarrin-Perez, F.; Jeong, J.; Célleri, R.; Crespo, P.; Munster, C. Hydrologic Simulation of a Neotropical Alpine Catchment Influenced by Conductive Topsoils in the Ecuadorian Andes. Front. Environ. Sci. 2024, 12, 1303388. [Google Scholar] [CrossRef]
- Joshi, S. A Soil Water Assessment Tool (Swat) Modeling Approach to Assess Discharge and Sediment Transport in Cold Water Refuges: A Case Study of the Klickitat River Basin. SSRN 2025. [Google Scholar] [CrossRef]
- Dalla Torre, D.; Di Marco, N.; Menapace, A.; Avesani, D.; Righetti, M.; Majone, B. Suitability of ERA5-Land Reanalysis Dataset for Hydrological Modelling in the Alpine Region. J. Hydrol. Reg. Stud. 2024, 52, 101718. [Google Scholar] [CrossRef]
- Senent-Aparicio, J.; Blanco-Gómez, P.; López-Ballesteros, A.; Jimeno-Sáez, P.; Pérez-Sánchez, J. Evaluating the Potential of GloFAS-ERA5 River Discharge Reanalysis Data for Calibrating the SWAT Model in the Grande San Miguel River Basin (El Salvador). Remote Sens. 2021, 13, 3299. [Google Scholar] [CrossRef]
- López-Lambraño, A.A.; Martínez-Acosta, L.; Gámez-Balmaceda, E.; Medrano-Barboza, J.P.; Remolina López, J.F.; López-Ramos, A. Supply and Demand Analysis of Water Resources. Case Study: Irrigation Water Demand in a Semi-Arid Zone in Mexico. Agriculture 2020, 10, 333. [Google Scholar] [CrossRef]
- Carlos Mendoza, J.A.; Chavez Alcazar, T.A.; Zuñiga Medina, S.A. Calibration and Uncertainty Analysis for Modelling Runoff in the Tambo River Basin, Peru, Using Sequential Uncertainty Fitting Ver-2 (SUFI-2) Algorithm. Air Soil Water Res. 2021, 14, 1178622120988707. [Google Scholar] [CrossRef]
- Teshager, A.D.; Gassman, P.W.; Secchi, S.; Schoof, J.T.; Misgna, G. Modeling Agricultural Watersheds with the Soil and Water Assessment Tool (SWAT): Calibration and Validation with a Novel Procedure for Spatially Explicit HRUs. Environ. Manag. 2016, 57, 894–911. [Google Scholar] [CrossRef]
- Wang, Y.; Ding, Y.; Ye, B.; Liu, F.; Wang, J. Contributions of Climate and Human Activities to Changes in Runoff of the Yellow and Yangtze Rivers from 1950 to 2008. Sci. China Earth Sci. 2012, 56, 1398–1412. [Google Scholar] [CrossRef]
- Wang, S.; Li, Q.; Wang, J. Quantifying the Contributions of Climate Change and Human Activities to the Dramatic Reduction in Runoff in the Taihang Mountain Region, China. Appl. Ecol. Environ. Res. 2021, 19, 119–131. [Google Scholar] [CrossRef]
- Pang, J.; Zhang, H.; Xu, Q.; Wang, Y.; Wang, Y.; Zhang, O.; Hao, J. Hydrological Evaluation of Open-Access Precipitation Data Using SWAT at Multiple Temporal and Spatial Scales. Hydrol. Earth Syst. Sci. 2020, 24, 3603–3626. [Google Scholar] [CrossRef]
- Morales-Velázquez, M.I.; Herrera, G.d.S.; Aparicio, J.; Rafieeinasab, A.; Lobato-Sánchez, R. Evaluating Reanalysis and Satellite-Based Precipitation at Regional Scale: A Case Study in Southern Mexico. Atmósfera 2021, 34, 189–206. [Google Scholar] [CrossRef]
- Chayña, E.L. Modelación Hidrológica Mediante El Uso de Precipitaciones Obtenidas Por Satélite En La Cuenca Del Río Ramis Perú. Master’s Thesis, Universidad Nacional del Altiplano de Puno, Puno, Peru, 2022. [Google Scholar]
- IDEAM. Lineamientos Conceptuales y Metodológicos Para La Evaluación Regional Del Agua (Ecuación Del IRH: IRH = Vp/Vt y Explicación Del Índice); IDEAM: Bogotá, Colombia, 2013.
- Martínez-Tunarroza, J.L.; Valenzuela-Mahecha, M.A.; Rodríguez-Vásquez, A.F.; García-Navarrete, O.L. Methodological Design to Determine Water Resource Management Indicators in Irrigation Districts. Agronomy 2022, 12, 1407. [Google Scholar] [CrossRef]
- CVS. Esquema Ordenamiento Territorial; CVS: Montería, Colombia, 2005. [Google Scholar]
- Morales-Acuña, E.; Linero-Cueto, J.R.; Canales, F.A. Assessment of Precipitation Variability and Trends Based on Satellite Estimations for a Heterogeneous Colombian Region. Hydrology 2021, 8, 128. [Google Scholar] [CrossRef]
- Arnold, J.G.; Moriasi, D.N.; Gassman, P.W.; Abbaspour, K.C.; White, M.J.; Srinivasan, R.; Santhi, C.; Harmel, R.D.; Van Griensven, A.; Van Liew, M.W.; et al. SWAT: Model Use, Calibration, and Validation. Trans. ASABE 2012, 55, 1491–1508. [Google Scholar] [CrossRef]
- Funk, C.; Peterson, P.; Landsfeld, M.; Pedreros, D.; Verdin, J.; Shukla, S.; Husak, G.; Rowland, J.; Harrison, L.; Hoell, A.; et al. The Climate Hazards Infrared Precipitation with Stations—A New Environmental Record for Monitoring Extremes. Sci. Data 2015, 2, 150066. [Google Scholar] [CrossRef]
- Bekić, D.; Leskovar, K. Evaluating CHIRPS and ERA5 for Long-Term Runoff Modelling with SWAT in Alpine Headwaters. Water 2025, 17, 2116. [Google Scholar] [CrossRef]
- IDEAM. Estudio Nacional Del Agua 2018; IDEAM: Bogotá, Colombia, 2018.
- IGAC. Estudio General de Suelos y Zonificación de Tierras Del Departamento de Córdoba; IGAC: Bogotá, Colombia, 2015.
- Neitsch, S.L.; Arnold, J.G.; Kiniry, J.R.; Williams, J.R.; King, K. Soil and Water Assessment Tool: Theoretical Documentation: Version 2005; Grassland, Soil and Water Research Laboratory & Blackland Research Center: Temple, TX, USA, 2005. Available online: https://swat.tamu.edu/media/1292/swat2005theory.pdf (accessed on 15 January 2024).
- Abbaspour, K.C. SWAT Calibration and Uncertainty Programs. User Man. 2015, 103, 17–66. [Google Scholar]
- Moriasi, D.N.; Arnold, J.G.; Van Liew, M.W.; Bingner, R.L.; Harmel, R.D.; Veith, T.L. Model Evaluation Guidelines for Systematic Quantification of Accuracy in Watershed Simulations. Trans. ASABE 2007, 50, 885–900. [Google Scholar] [CrossRef]
- Krause, P.; Boyle, D.; Bäse, F. Comparison of Different Efficiency Criteria for Hydrological Model Assessment. Adv. Geosci. 2005, 5, 89–97. [Google Scholar] [CrossRef]
- Sao, D.; Kato, T.; Tu, L.H.; Thouk, P.; Fitriyah, A.; Oeurng, C. Evaluation of Different Objective Functions Used in the Sufi-2 Calibration Process of Swat-Cup on Water Balance Analysis: A Case Study of the Pursat River Basin, Cambodia. Water 2020, 12, 2901. [Google Scholar] [CrossRef]
- Tejaswini, V.; Krishna, V. Sensitivity and Uncertainty Analysis for SWAT Model Calibration Using SUFI-2: An Optimization Algorithm. Int. J. Agric. Food Sci. 2025, 7, 16–18. [Google Scholar] [CrossRef]
- Maldonado Santafé, L.C. Oferta hídrica ante escenarios de cambio climático en la cuenca hidrográfica La Vieja: Colombia. Doctoral Dissertation, Universidad Nacional de Colombia, Bogota, Indonesia, 2021. [Google Scholar]
- Tang, X.; Zhang, J.; Wang, G.; Jin, J.; Liu, C.; Liu, Y.; He, R.; Bao, Z. Uncertainty Analysis of SWAT Modeling in the Lancang River Basin Using Four Different Algorithms. Water 2021, 13, 341. [Google Scholar] [CrossRef]
- Watanabe, M.; Suzuki, T.; O’ishi, R.; Komuro, Y.; Watanabe, S.; Emori, S.; Takemura, T.; Chikira, M.; Ogura, T.; Sekiguchi, M.; et al. Improved Climate Simulation by MIROC5: Mean States, Variability, and Climate Sensitivity. J. Clim. 2010, 23, 6312–6335. [Google Scholar] [CrossRef]
- IDEAM. Estudio de Escenarios de Cambio Climático Para Colombia 2011-2100, Herramientas Científicas Para La Toma de Decisiones; IDEAM: Bogotá, Colombia, 2015.
- Poveda, G.; Waylen, P.R.; Pulwarty, R.S. Annual and Inter-Annual Variability of the Present Climate in Northern South America and Southern Mesoamerica. Palaeogeogr. Palaeoclimatol. Palaeoecol. 2006, 234, 3–27. [Google Scholar] [CrossRef]
- Reboita, M.S.; Spinoni, J.; Blázquez, J.; Solman, A.; Carril, A.; Vrac, M.; Russo, S. Future Projections of Extreme Precipitation Climate Indices over South America Based on CORDEX-CORE Multimodel Ensemble. Atmosphere 2022, 13, 1463. [Google Scholar] [CrossRef]
- IDEAM. Tercera Comunicación Nacional de Cambio Climático; IDEAM: Bogotá, Colombia, 2015.
- Rodríguez Roa, A. Evaluación de Las Simulaciones de Precipitación y Temperatura de Los Modelos Climáticos Globales Del Proyecto CMIP5 Con El Clima Presente En Colombia; IDEAM: Bogotá, Colombia, 2012.
- Guzmán, A.M. Caracterización Del Comportamiento Futuro de La Precipitación Asociado al Fenómeno de Cambio Climático En El Área de Producción Hidroeléctrica Embalse Arenal, Costa Rica. Rev. Geográfica 2023, 166, 69–92. [Google Scholar] [CrossRef]
- Taylor, K.E.; Stouffer, R.J.; Meehl, G.A. An Overview of CMIP5 and the Experiment Design. Bull. Am. Meteorol. Soc. 2012, 93, 485–498. [Google Scholar] [CrossRef]
- Carrillo Peña, G.A. Estimación de La Producción Hídrica Para La Cuenca Del Río Tona Mediante El Modelo Hidrológico Semidistribuido Swat. Bachelor’s Thesis, Universidad Pontificia Bolivariana, Bucaramanga, Colombia, 2018. [Google Scholar]
- Le, A.M.; Pricope, N.G. Increasing the Accuracy of Runoff and Streamflow Simulation in the Nzoia Basin, Western Kenya, through the Incorporation of Satellite-Derived CHIRPS Data. Water 2017, 9, 114. [Google Scholar] [CrossRef]
- Tan, M.L.; Armanuos, A.M.; Ahmadianfar, I.; Demir, V.; Al-Areeq, A.; Abba, S.; Halder, B.; Kilinc, H.; Yaseen, Z.; Heddam, S. Evaluation of NASA POWER and ERA5-Land for Estimating Tropical Precipitation and Temperature Extremes. J. Hydrol. 2023, 624, 129940. [Google Scholar] [CrossRef]
- Abbas, S.A.; Xuan, Y.; Bailey, R.T. Assessing Climate Change Impact on Water Resources in Water Demand Scenarios Using SWAT-MODFLOW-WEAP. Hydrology 2022, 9, 164. [Google Scholar] [CrossRef]
- Revueltas, J.E.; Zabaleta, A.; Mercado, T.; Aguirre, S. Cambios En El Clima Local y Su Efecto En La Regulación Hídrica En Microcuencas Del Departamento Del Magdalena, Norte de Colombia. Inf. Tecnológica 2020, 31, 193–206. [Google Scholar] [CrossRef]
- Valencia, S.; Villegas, J.C.; Hoyos, N.; Duque-Villegas, M.; Salazar, J.F. Streamflow Response to Land Use/Land Cover Change in the Tropical Andes Using Multiple SWAT Model Variants. J. Hydrol. Reg. Stud. 2024, 54, 101888. [Google Scholar] [CrossRef]


Disclaimer/Publisher’s Note: The statements, opinions and data contained in all publications are solely those of the individual author(s) and contributor(s) and not of MDPI and/or the editor(s). MDPI and/or the editor(s) disclaim responsibility for any injury to people or property resulting from any ideas, methods, instructions or products referred to in the content. |
© 2026 by the authors. Licensee MDPI, Basel, Switzerland. This article is an open access article distributed under the terms and conditions of the Creative Commons Attribution (CC BY) license.