Abstract
Rainfall erosivity is a key driver of soil erosion and sediment delivery in the Lancang River Basin, but its spatiotemporal variations and relationship with sediment delivery changes remain unquantified. Based on the daily precipitation data from meteorological stations and the annual sediment delivery data from the Yunjinghong hydrologic station, the spatial and temporal variations in rainfall erosivity and how rainfall erosivity changes contribute to the sediment delivery changes were examined in this study. The results showed that the annual average rainfall erosivity varied from 202.6 to 15,946.6 MJ mm ha−1 h−1 a−1 among stations. The rainfall erosivity increased from the upstream to the downstream as elevation decreased. Basin-wide average rainfall erosivity declined by about ten percent from 1958 to 2019, with a decreasing rate of −6.3 MJ mm ha−1 h−1 a−1 per year. Summer rainfall erosivity accounted for the largest portion of the rainfall erosivity throughout the whole year. The sediment delivery increased from 1963 to 2000 but has sharply decreased since 2001. Double mass curve analysis revealed that rainfall erosivity reduction accounted for 32% of the sediment delivery decrease after 2001, with human activities (vegetation restoration and dam operations) contributing the remaining 68%.
1. Introduction
Water erosion significantly degrades land, reduces soil fertility through the loss of soil particles and organic matter, and contributes to river sedimentation and water pollution. These processes impact flood regimes and the efficiency of hydropower operations [1,2]. While numerous factors influence soil erosion, including both natural processes and human activities, rainfall is a primary driver of water erosion [3]. Rainfall erosivity, quantifying the erosive force of a rainfall event, is commonly assessed as the product of kinetic energy and maximum 30-min rainfall intensity [4,5]. Understanding the spatial and temporal patterns of rainfall erosivity is crucial for calculating soil erosion rates and predicting sediment delivery [6,7]. Consequently, rainfall erosivity has been extensively studied globally to quantify potential soil loss [8,9,10]. Estimating rainfall erosivity requires high-frequency, temporally resolved rainfall records; however, acquiring such observational data is often challenging. This limitation has spurred the development of empirical models utilizing annual, monthly, and daily precipitation data [11,12,13]. Annual and monthly datasets lack the temporal resolution needed to capture rainfall erosivity variations; therefore, the daily rainfall data are widely applied in the estimation of rainfall erosivity [14,15].
The Lancang River Basin (LRB), also known as the upper Mekong River Basin, is located in a fragile ecological environment of southwest China and is highly susceptible to soil erosion [16]. Intensified human activities are exacerbating soil erosion in the region [17]. Soil erosion has a direct impact on the sediment delivery of the Lancang River, silting the reservoir, reducing the storage capacity, and reducing the efficiency of dam operations [18,19,20]. The sediment discharge changes in the Lancang River can be attributed to precipitation, changes in land use, and hydropower operations [21]. Among these driving factors, the land use change impact on sediment load is a long-term effect, while the dam operations can induce abrupt changes in sediment delivery because of sediment retention [22]. From 1968 to 2002 (the period before mega-dams commenced operation), the suspended sediment load at the Jinghong station (outlet station of LRB) showed different temporal trends with the upstream Gajiu and downstream Mukdahan stations; rainfall was the dominant factor influencing the suspended sediment load before the early 1980s, while land cover changes dominated the change in sediment load from the 1980s to 2002 [21]. Sediment delivery at Jinghong station dropped sharply in 2003, then again in 2008, which may be highly related to the dam operations [22,23]. A quantitative assessment of the individual contributions of rainfall, land use change, and dam operation to sediment load change in the LRB is still lacking.
As one of the most important driving factors of soil erosion and sediment load, cumulative rainfall erosivity is proved to be highly correlated with cumulative sediment delivery [24]. Therefore, accurately quantifying the contribution of rainfall erosivity to sediment load dynamics within the LRB is crucial, requiring a comprehensive understanding of rainfall erosivity changes at a high resolution across the basin. Current research efforts are limited by a lack of detailed, basin-wide station data. Previous studies have used daily empirical models to map the spatiotemporal characteristics of rainfall erosivity in the Yunnan Plateau and Yunnan Province [13,25], which helps understand rainfall erosivity changes in the LRB, but there is still a lack of temporal and spatial coverage for detailed investigation within the LRB. Specifically, long-term historical trends in rainfall erosivity remain poorly constrained due to limited availability of dense, high-quality station data, which hinders efforts to accurately reconstruct rainfall erosivity spatial and temporal patterns across the basin.
Thus, this study aims to characterize the spatial and temporal variations in rainfall erosivity within the Lancang River Basin using a dense network of high-quality station data, and to quantify the relationship between rainfall erosivity changes and observed sediment load variations at the Yunjinghong hydrologic station.
2. Materials and Methods
2.1. Study Area
The Lancang River Basin (21°30′–32°40′ E, 94°0′–101°50′ N), located in southwest China, is the upper reach of the Mekong River Basin. The catchment area of the LRB is about 164,800 km2, accounting for about 20.7% of the total area of the Lancang-Mekong River Basin [17]. The Lancang River Basin exhibits significant topographic variation along its course. The upstream and downstream sections are comparatively open, while the middle reaches are characterized by a narrow, elongated morphology. Terrain within the LRB is highly variable; the upstream plateau averages elevations exceeding 4500 m, transitioning to a high-mountain canyon landscape in the middle reaches. The lower reaches are dominated by flatter terrain with average elevations around 2500 m. The LRB experiences a western monsoon climate with pronounced wet and dry seasons. Annual average rainfall across the basin is approximately 1000 mm, increasing from north to south [3]. The annual average runoff is 475 billion m3. While the interannual variation in runoff is relatively consistent, the annual distribution is uneven. Corresponding to the annual precipitation pattern, runoff is concentrated from May to October, with minimal flow from January to February. The LRB serves as a composite recharge basin for rainwater, groundwater, and snowmelt. The average sediment concentration of the Lancang River is 1.29 kg/m3, exhibiting significant interannual and intra-annual variability [22]. Increasing anthropogenic pressures within the LRB, including deforestation and unsustainable land use practices, are leading to intensified soil erosion [6,16].
2.2. Data Source
Daily precipitation data from meteorological stations within and surrounding the LRB were obtained from the National Climate Center, China Meteorological Administration (https://data.cma.cn/, accessed on 1 January 2022). To address variations in data start dates and the presence of missing values, data quality control was performed using the standards adopted by the European Climate Assessment Dataset: (1) The data should cover the period from 1958 to 2019; (2) The overall missing data should not exceed 10%; (3) Missing data in each year shall not exceed 20% or for more than three consecutive months [26]. Finally, daily precipitation data from 26 meteorological stations within the LRB and 28 meteorological stations surrounding the LRB were utilized in this study (Figure 1).
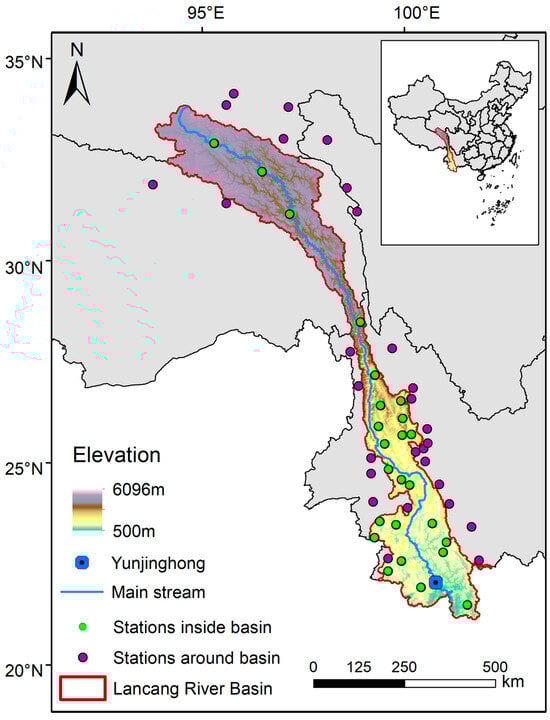
Figure 1.
Location of the Lancang River Basin (LRB) and meteorological stations.
The Yunjinghong hydrologic station (100°47′ E, 20°02′ N), located in Jinghong City, Xishuangbanna Prefecture, is the primary control station in the lower reaches of the Lancang River. The station is located at an altitude of 572 m, with a catchment area of 141,779 km2, accounting for 89% of the whole basin area of the LRB. Runoff and sediment observations at this station are representative of changes occurring throughout the LRB. The inflow of runoff and sediment at Yunjinghong is primarily influenced by upstream flood fluctuations, local scouring and sedimentation dynamics, and other hydraulic factors. Annual sediment delivery data from 1963 to 2013 were utilized in this study to analyze the relationship between rainfall erosivity and sediment delivery [27].
2.3. Methodology
2.3.1. Rainfall Erosivity Estimation Based on Daily Rainfall
The calibrated Richardson daily rainfall erosivity model was used to calculate rainfall erosivity. The model parameters were calibrated by fitting the model to rainfall and soil loss data representative of the major climate zones of China [28]. This calibrated model has been subsequently applied in many investigations under similar climatic conditions, where it has proven accurate for estimating rainfall erosivity [14,25]. In this model, rainfall erosivity is calculated using the following formulas at a half-month time step:
where R is the value of the rainfall erosivity in the half-month period (MJ mm ha−1 h−1), k is the number of days in the half-month period, Pk is the erosive daily rainfall amount on the kth day during the half-month period, and the erosive daily rainfall equals the daily rainfall when it exceeds 12 mm; otherwise, a value of 0 should be used as erosive rainfall. α and β are the two undetermined parameters in the model. Pd12 is the average daily rainfall amount (mm) if the daily rainfall amount exceeds 12 mm and Py12 is the average annual rainfall amount (mm) if the daily rainfall amount is larger than 12 mm. During the calculation, the whole year is divided into 24 half months. The division method of the half-month period is as follows: the 1st to the 15th is the first half-month, and the remainder is another halfmonth. Formulas (1)–(3) are applied to calculate the rainfall erosivity in each half-month of every meteorological station. Then, the annual rainfall erosivity is calculated by adding these half-month rainfall erosivity. Seasons were categorized as: winter (DJF, December to February), spring (MAM, March to May), summer (JJA, June to August), and fall (SON, September to November).
2.3.2. Spatial Interpolation
Spatial interpolation of the rainfall erosivity was performed with universal kriging using mean annual rainfall as a covariate. First, daily precipitation records were aggregated to obtain the mean annual rainfall at each gauge. This precipitation field was interpolated across the study area with ordinary kriging, producing a continuous precipitation surface. The resulting surface then served as an external drift in the universal kriging interpolation of the rainfall erosivity values. A previous study using cross-validation found that universal kriging with mean annual rainfall as a covariate yielded higher interpolation accuracy than ordinary kriging, particularly in western China where gauge density is low [29]. Consequently, universal kriging with precipitation as a covariate was adopted to generate erosivity maps in this study
2.3.3. Mann-Kendall Test and Double Mass Curve Analysis
The Mann–Kendall test is a non-parametric test appropriate for data that do not follow a normal distribution and is less sensitive to outliers [30,31]. It is a standard procedure endorsed by the World Meteorological Organization for detecting trends in serially independent hydro-meteorological data.
The null hypothesis Ho is that the dataset Xt (x1, …, xn) of a generic variable is independent and identically distributed. The alternative hypothesis H1 is that a monotonic trend exists in the dataset. Then, the Z value is used to judge the direction of the trend and is calculated by the following formula:
where the distributions of xk and xj are not identical for all k, j ≤ n with k ≠ j, n ≥ 10 is the length of the dataset, m is the number of tied groups (a tied group is a set of sample data having the same value), and ti is size of the i th group. If , then the null hypothesis is rejected and a significant trend exists in the series at the set level of α. Positive values of Z indicate upward trends, while negative values of Z show downward trends. The magnitude of |Z| reflects the strength of the evidence: larger absolute values correspond to more pronounced and statistically significant trends. In this study, a significance level of α = 0.05 was used to identify statistically significant changes in rainfall erosivity at each meteorological station.
To remove serial correlation before applying the Mann-Kendall test, a pre-whitening method was applied in this study. A pre-whitening method was conducted:
where Yt denotes the pre-whitened series (free of serial correlation) that is subsequently used in the Mann-Kendall test, and r1 is the lag 1 serial correlation coefficient of data.
The double mass curve is a commonly used technique to identify trends in the relationship between two parameters, and has been applied to investigate the connection between accumulated sediment and discharge [24,32]. When the relationship between sediment loading and rainfall erosivity remains stable, the double-mass plot follows a straight line. Nevertheless, a shift in the sediment detachment or transport processes of the flow is signaled by a departure from linearity, manifesting as an inflection point on the curve. Cumulative rainfall erosivity and sediment delivery data for the LRB from 1963 to 2013 were analyzed in this study to assess how variations in rainfall erosivity have influenced sediment load over time.
3. Results
3.1. Spatial Distribution of Rainfall Erosivity
The annual average precipitation and rainfall erosivity of each station from 1958 to 2019 were displayed in Table 1. The results showed that the rainfall erosivity varied from 202.6 to 15,946.6 MJ mm ha−1 h−1 a−1, and correlated positively with precipitation values at each station. The mean rainfall erosivity of 54 stations was 3685.6 MJ mm ha−1 h−1 a−1, the mean rainfall erosivity of 26 stations within the LRB is 3999.7 MJ mm ha−1 h−1 a−1, and the mean rainfall erosivity of 28 stations surrounding the LRB is 3394.0 MJ mm ha−1 h−1 a−1. Rainfall erosivity showed a negative correlation with elevation, generally decreasing with decreasing elevation. This pattern is attributed to the terrain of the LRB and the prevailing monsoon climate.

Table 1.
Elevation, average annual precipitation (P) and rainfall erosivity (R) of the weather stations within/surrounding the Lancang River basin.
Spatial interpolation revealed a clear trend of increasing annual average precipitation and rainfall erosivity from upstream to downstream across the basin (Figure 2). The annual average interpolated precipitation varied widely, ranging from 471.6 to 1744.7 mm, indicating substantial spatial heterogeneity. Rainfall erosivity also exhibited significant spatial variability, with values ranging from 132.3 to 8944.1 MJ mm ha−1 h−1 a−1 across the study area. These gradients likely reflect the influence of orographic effects and monsoon patterns within the basin, with higher rainfall and erosivity concentrated in lower elevation areas.
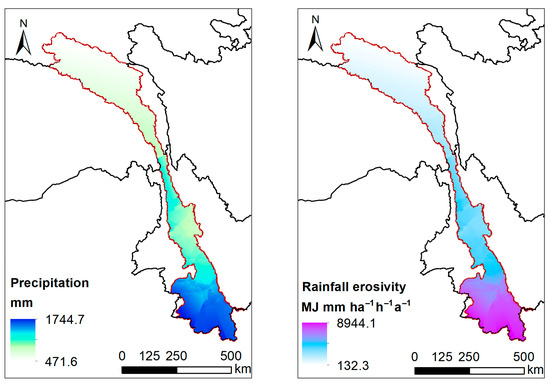
Figure 2.
Spatial distribution of annual average precipitation and rainfall erosivity in the LRB (1958–2019).
3.2. Temporal Rainfall Erosivity Change
3.2.1. Annual Rainfall Erosivity Change
Figure 3 shows the basin-wide average annual precipitation and rainfall erosivity changes from 1958 to 2019 in the LRB. The basin-wide average precipitation showed a decreasing trend from 1958 to 2019, with the largest value in 1966 at 1192.8 mm and the smallest value in 2019 at 777.8 mm. The decreasing rate of the basin-wide average precipitation is −1.5 mm per year (p < 0.05). The basin-wide average rainfall erosivity showed a similar decreasing trend with the largest value in 1966 at 4991.6 MJ mm ha−1 h−1 a−1 and the smallest value in 2019 at 2377.8 MJ mm ha−1 h−1 a−1. The decreasing rate of the basin-wide average rainfall erosivity is −6.3 MJ mm ha−1 h−1 a−1 per year (p < 0.05).
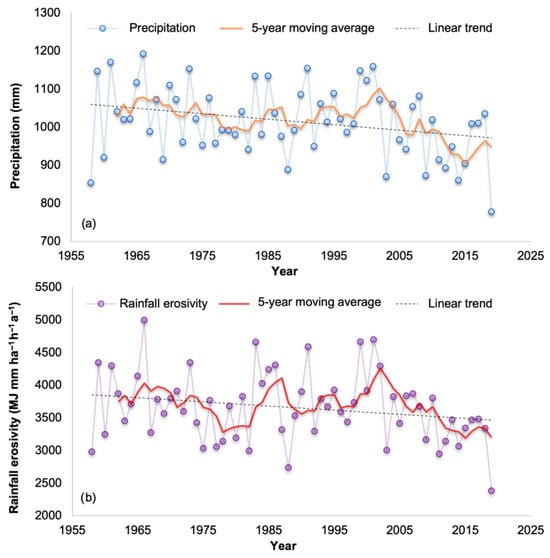
Figure 3.
Temporal trends in basin-wide average annual precipitation (a) and rainfall erosivity (b) in the LRB from 1958 to 2019.
3.2.2. Seasonal Rainfall Erosivity Characteristics
Figure 4 presents the spatial distribution of average rainfall erosivity for each season. Spatially, rainfall erosivity exhibited a consistent increasing trend from upstream to downstream across all seasons. Seasonal analysis revealed that summer (June–August; JJA) contributed the largest proportion of annual rainfall erosivity. The mean rainfall erosivity during JJA was 1880.8 MJ mm ha−1 h−1, significantly exceeding the mean rainfall erosivity observed during autumn (September–November; SON; 742.4 MJ mm ha−1 h−1), winter (December–February; DJF; 77.2 MJ mm ha−1 h−1), and spring (March–May; MAM; 503.0 MJ mm ha−1 h−1). At select stations, the contribution of JJA rainfall erosivity to the annual total reached as high as 81%.
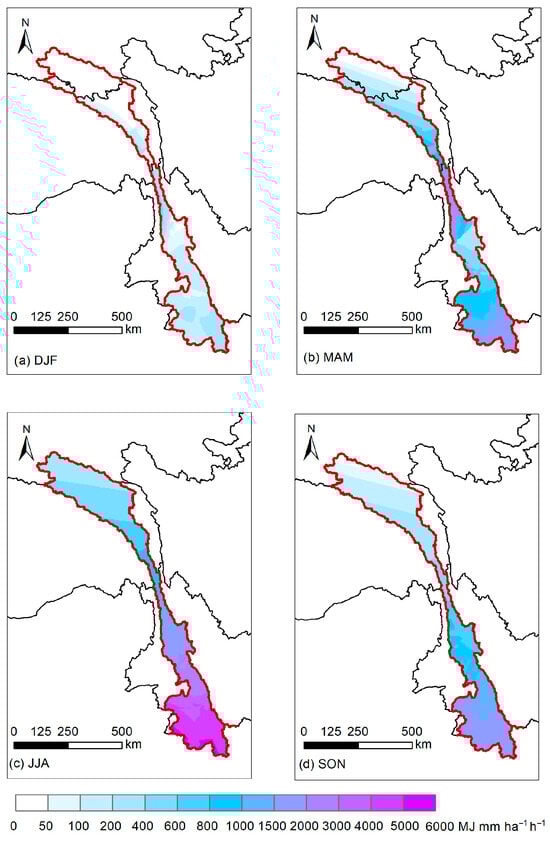
Figure 4.
Spatial distributions of average rainfall erosivity by season within the LRB. DJF represent the December to February, MAM represents the March to May, JJA represents the June to August, SON represents the September to November.
3.2.3. Temporal Change Slope
Figure 5 displays the spatial patterns of precipitation and rainfall erosivity change slopes from 1958 to 2019, along with the results of the Mann-Kendall trend test at each station. Over the study period, precipitation exhibited an increasing trend in the northern portion of the LRB (north of 28° N, before entering into the Yunnan province). Conversely, precipitation in the southern LRB (south of 28° N, in Yunnan province) demonstrated a decreasing trend, with nine stations exhibiting statistically significant declines (p < 0.05). Rainfall-erosivity trends generally followed the precipitation patterns in the northern part of the LRB (north of 28° N, before the basin enters Yunnan Province), with only one station showing a significant increasing trend. Between 28° N and 23° N, an area dominated by mountainous and canyon landscapes, rainfall erosivity showed an overall upward trend, with two stations recording statistically significant increases (p < 0.05). In contrast, the southern portion of the LRB (south of 23° N), characterized by mid-low mountains and broad valleys, displayed a decreasing trend in rainfall erosivity, with three stations showing statistically significant increases (p < 0.05). The southern LRB experiences relatively high rainfall erosivity values, which may contribute to the observed decreasing trends in precipitation and rainfall erosivity in this region.
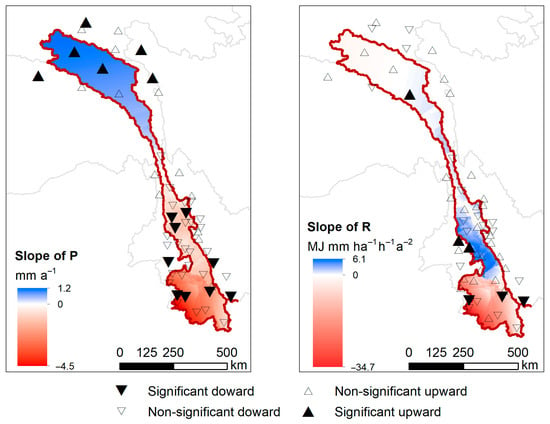
Figure 5.
Spatial patterns of precipitation and rainfall erosivity change slopes from 1958 to 2019 within the LRB.
3.3. Sediment Load Variations
The annual sediment delivery changes in LRB from 1963 to 2013 were shown in Figure 6a. The average annual sediment delivery for the LRB during this period was 73 million tons. Sediment delivery exhibited an increasing trend from the 1960s to the year 2000, peaking at 182 million tons in 1991. Following the turn of the century, sediment delivery decreased dramatically, falling to below 1 million tons around 2010. To determine the year of inflection in sediment delivery, the cumulative anomaly curve for the LRB was plotted in Figure 6b, revealing 2001 as a critical turning point, transitioning from an increasing to a decreasing trend.
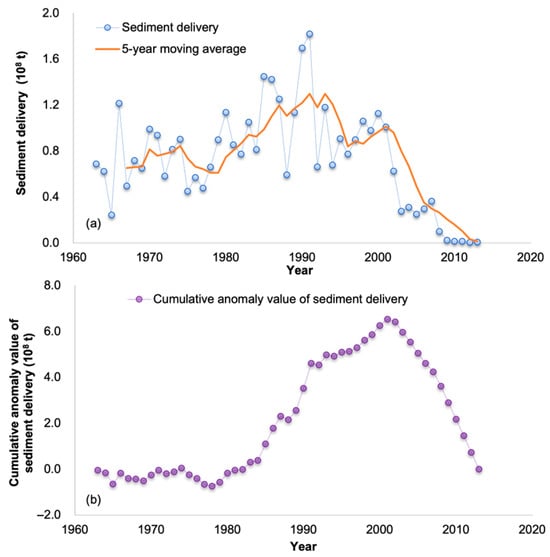
Figure 6.
Changes in sediment delivery (a) and cumulative anomaly value of sediment delivery (b) from 1963 to 2013 at the Yunjinghong hydrological station within the LRB.
4. Discussion
4.1. Decreased Rainfall Erosivity Accounted for One-Third of the Sediment Delivery Reduction
The sediment delivery changes can be influenced by both climate change and human activities [22]. Rainfall erosivity is widely recognized as an important indicator of the potential erosion capacity of rainfall, which is highly related to the soil erosion and sediment delivery [2]. The results of this study demonstrate a gradual 10% decrease in rainfall erosivity from 1958 to 2019. Conversely, sediment delivery at the Yunjinghong station of the LRB increased from 1963 to the 2000s before declining sharply after 2001, this result corresponds well to the sediment load results from previous studies [22,33]. To separate the contributions of rainfall erosivity change and human activities to the sediment delivery in the LRB, a double accumulation curve of rainfall erosivity and sediment delivery in the LRB from 1963 to 2013 was drawn and displayed in Figure 7. Based on the mutation year detection results displayed in Figure 6b, two regression equations were established before and after the turning point year of 2001. The determination coefficients for both segments of the double cumulative curve equation exceed 0.8 (Figure 7).
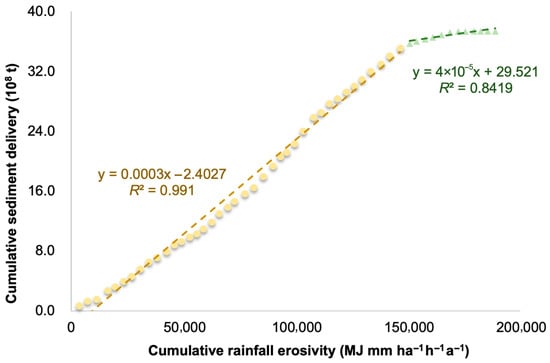
Figure 7.
Double accumulation curve of rainfall erosivity and sediment delivery in the LRB from 1963 to 2013. Yellow dots represent data from 1963 to 2001, and green triangles represent data from 2002 to 2013. Dashed lines show temporal trends for each period.
From 1963 to 2000, the monitored annual average sediment delivery was 89.8 million tons per year. In contrast, the monitored annual average sediment delivery from 2001 to 2013 was only 25.3 million tons per year, representing a reduction of 64.5 million tons per year. This reduction was attributable to both rainfall erosivity reduction and human activities, such as dam construction. To isolate the contribution of rainfall erosivity, the yearly rainfall erosivity data after the 2001 inflection point were substituted into the regression equation established for the period before the inflection point. This calculation yielded an estimated annual average sediment delivery of 69.2 million tons per year. Compared with the 89.8 million tons per year before the inflection point, the rainfall erosivity reduction accounted for a 20.6 million ton per year decrease in sediment delivery. The remaining portion of the reduction, 43.9 million tons per year, was therefore attributed to human activities. These results revealed that, from 2001 to 2013, rainfall erosivity accounted for 32% of the sediment delivery reduction, while human activities, including vegetation restoration and dam operation, contributed approximately 68%. Previous research demonstrated that, from the 1980s to 2002, land cover changes had the greatest impact on the suspended sediment load in the Lancang-Mekong River basin, followed by rainfall [21]. The present study reveals that rainfall erosivity accounts for roughly one-third of the reduction in sediment delivery since 2001, a contribution that deserves emphasis. The reduction in sediment from the Lancang River basin may have a direct impact on downstream geomorphic and ecological processes, but this impact may be spatially confined. The sediment budget of the downstream Mekong is influenced by multiple factors [18,22], which may attenuate or mask the signal from the upper basin.
4.2. Limitations and Future Perspectives
This study provides insights into the relative contributions of rainfall erosivity to sediment delivery changes in the LRB. However, several limitations warrant consideration. The first limitation is the reliance on daily precipitation data from national meteorological stations, which may not fully represent the spatial and temporal heterogeneity of rainfall patterns in high-elevation terrain. This is particularly relevant, as short-duration, high-intensity rainfall events often contribute disproportionately to erosion processes. Moreover, the reliance on a single rainfall-erosivity calculation model may also introduce uncertainty into the resulting erosivity values. Although this method has been employed in many studies and has been shown to be efficient and accurate [14,25], the inherent uncertainties of the model should be acknowledged. To address the critical gap in high-elevation data, future research must focus on deploying meteorological stations to establish vertical measurement gradients. Fine temporal resolution data such as remote sensing and radar data could also be incorporated to improve the accuracy of rainfall erosivity assessments. Obtaining sub-daily precipitation data will be crucial for better characterizing rainfall intensity-duration patterns [34].
A further limitation is the scarcity of high-resolution, long-term sediment load data directly from the river, which hampers a detailed understanding of the relationship between seasonal rainfall erosivity dynamics and sediment delivery. Although the Yunjinghong Station provides a valuable, continuous record of the sediment load exiting the basin, its downstream location means that the record cannot distinguish how much of the observed load originates from natural hillslope erosion versus how much is attenuated or released by the upstream dams. Thus, using this single gauge as a basin-wide proxy may misrepresent the downstream reach and reservoir effects. Incorporating hydrological data from upstream gauging stations would also allow for a more comprehensive assessment of source-to-sink sediment connectivity [35].
Vegetation greening can alleviate water erosion risk and thus diminish sediment flux [36,37], while dam operations can also induce marked variations in sediment transport that merit detailed investigation [18,20]. Both processes are important, but their relative contributions remain uncertain in this study. Future research should quantify these contributions by incorporating vegetation and land cover analyses, as well as pre-dam and post-dam particle size analyses. Such work would provide clearer guidance for vegetation restoration and dam management strategies aimed at regulating sediment transport.
5. Conclusions
Using daily precipitation data from meteorological stations within and surrounding the LRB and the annual sediment delivery data from the Yunjinghong hydrologic station. The spatiotemporal variations in rainfall erosivity and their relationship with the sediment delivery changes were identified. The main conclusions are as follows: (1) Rainfall erosivity increased from upstream to downstream as the elevation of the station decreased. The annual average rainfall erosivity varied from 202.6 to 15,946.6 MJ mm ha−1 h−1 a−1 at each station. (2) Basin-wide average rainfall erosivity declined by ten percent from 1958 to 2019, with a decreasing rate of −6.3 MJ mm ha−1 h−1 a−1 per year. Summer rainfall erosivity (JJA) accounted for the largest portion of the rainfall erosivity in the whole year. (3) Rainfall erosivity showed an upward trend in the northern part of the LRB, which is dominated by mountainous and canyon landscapes, while rainfall erosivity showed a decreasing trend in the southern part. (4) Sediment delivery in the LRB increased from 1963 to 2000 but has declined sharply since 2001. Double mass curve analysis results indicated that rainfall erosivity reduction contributed 32% of the sediment delivery reduction after the mutation year of 2001.
Funding
This research was funded by the National Natural Science Foundation of China, grant number 42277339, 41907060.
Data Availability Statement
Data are available upon request from the author.
Conflicts of Interest
The author declares no conflicts of interest.
Abbreviations
The following abbreviations are used in this manuscript:
| LRB | Lancang River Basin |
| P | Precipitation |
| R | Rainfall erosivity |
| DJF | December to February |
| MAM | March to May |
| JJA | June to August |
| SON | September to November |
References
- Liu, S.; An, N.; Dong, S.; Zhao, C.; Coxixo, A.; Cheng, F.; Hou, X. Spatial variations of sedimentary organic carbon associated with soil loss influenced by cascading dams in the middle Lancang River. Ecol. Eng. 2017, 106, 323–332. [Google Scholar] [CrossRef]
- Chuenchum, P.; Xu, M.; Tang, W. Estimation of soil erosion and sediment yield in the Lancang–Mekong River using the modified revised universal soil loss equation and GIS techniques. Water 2019, 12, 135. [Google Scholar] [CrossRef]
- Shi, W.; Yu, X.; Liao, W.; Wang, Y.; Jia, B. Spatial and temporal variability of daily precipitation concentration in the Lancang River basin, China. J. Hydrol. 2013, 495, 197–207. [Google Scholar] [CrossRef]
- Wischmeier, W.H.; Smith, D.D. Predicting Rainfall Erosion Losses: A Guide to Conservation Planning; USDA Agricultural Handbook; USDA: Washington, DC, USA, 1978.
- Renard, K.G.; Foster, G.R.; Weesies, G.A.; McCool, D.K.; Yoder, D.C. Predicting Soil Erosion by Water: A Guide to Conservation Planning with the Revised Universal Soil Loss Equation (RUSLE); Agriculture Handbook No. 703; US Department of Agriculture: Washington, DC, USA, 1997; 404p.
- Wu, J.; Cheng, Y.; Mu, Z.; Dong, W.; Zheng, Y.; Chen, C.; Wang, Y. Temporal Spatial Mutations of Soil Erosion in the Middle and Lower Reaches of the Lancang River Basin and Its Influencing Mechanisms. Sustainability 2022, 14, 5169. [Google Scholar] [CrossRef]
- He, Y.; Gui, Z.; Su, C.; Chen, X.; Chen, D.; Lin, K.; Bai, X. Response of sediment load to hydrological change in the upstream part of the Lancang-Mekong River over the past 50 years. Water 2018, 10, 888. [Google Scholar] [CrossRef]
- Panagos, P.; Borrelli, P.; Meusburger, K.; Yu, B.; Klik, A.; Lim, K.J.; Yang, J.E.; Ni, J.; Miao, C.; Chattopadhyay, N.; et al. Global rainfall erosivity assessment based on high-temporal resolution rainfall records. Sci. Rep. 2017, 7, 4175. [Google Scholar] [CrossRef]
- Liu, Y.; Zhao, W.; Liu, Y.; Pereira, P. Global rainfall erosivity changes between 1980 and 2017 based on an erosivity model using daily precipitation data. Catena 2020, 194, 104768. [Google Scholar] [CrossRef]
- Yang, Q.; Xu, X.; Tang, Q.; Jia, G. The spatiotemporal variations of global rainfall erosivity and erosive rainfall event based on half-hourly satellite rainfall data. Catena 2025, 252, 108831. [Google Scholar] [CrossRef]
- Renard, K.G.; Freimund, J.R. Using monthly precipitation data to estimate the R-factor in the revised USLE. J. Hydrol. 1994, 157, 287–306. [Google Scholar] [CrossRef]
- Richardson, C.W.; Forster, G.R.; Wright, D.A. Estimation of erosion index from daily rainfall amount. Trans. ASAE 1983, 26, 153–156. [Google Scholar] [CrossRef]
- Petroselli, A.; Apollonio, C.; De Luca, D.L.; Salvaneschi, P.; Pecci, M.; Marras, T.; Schirone, B. Comparative Evaluation of the Rainfall Erosivity in the Rieti Province, Central Italy, Using Empirical Formulas and a Stochastic Rainfall Generator. Hydrology 2021, 8, 171. [Google Scholar] [CrossRef]
- Gu, Z.; Duan, X.; Liu, B.; Hu, J.; He, J. The spatial distribution and temporal variation of rainfall erosivity in the Yunnan Plateau, Southwest China: 1960–2012. Catena 2016, 145, 291–300. [Google Scholar] [CrossRef]
- Xu, X.; Yun, X.; Tang, Q.; Cui, H.; Wang, J.; Zhang, L.; Chen, D. Projected seasonal changes in future rainfall erosivity over the Lancang-Mekong River basin under the CMIP6 scenarios. J. Hydrol. 2023, 620, 129444. [Google Scholar] [CrossRef]
- Yao, H.R.; Yang, Z.F.; Cui, B.S. Soil erosion and its environmental background at Lancang Basin of Yunnan Province. Bull. Soil Water Conserv. 2005, 25, 5–14. [Google Scholar]
- Chen, L.; Xie, G.D.; Zhang, C.S.; Li, S.M.; Fan, N.; Zhang, C.X.; Sha, P.; Ge, L. Spatial distribution characteristics of soil erosion in Lancang River Basin. Res. Sci. 2012, 34, 1240–1247. [Google Scholar]
- Fu, K.D.; He, D.M.; Lu, X.X. Sedimentation in the manwan reservoir in the upper Mekong and its downstream impacts. Quatern. Int. 2008, 186, 91–99. [Google Scholar] [CrossRef]
- Fu, K.; Huang, J.; He, D. Assessment of sediment trapped by the Manwan Dam on Lancang River. J. Sed. Res. 2008, 4, 36–40. [Google Scholar]
- Sun, Z.; Sun, L.; Zheng, H.; Li, Z. Estimation of sedimentation in the Manwan and Jinghong reservoirs on the Lancang river. Water Supply 2022, 22, 4307–4319. [Google Scholar] [CrossRef]
- Tian, F.; Hou, S.; Morovati, K.; Zhang, K.; Nan, Y.; Lu, X.; Ni, G. Exploring spatio-temporal patterns of sediment load and driving factors in Lancang-Mekong River basin before operation of mega-dams (1968–2002). J. Hydrol. 2023, 617, 128922. [Google Scholar] [CrossRef]
- Zhai, H.J.; Hu, B.; Luo, X.Y.; Qiu, L.; Tang, W.J.; Jiang, M. Spatial and temporal changes in runoff and sediment loads of the Lancang River over the last 50 years. Agric. Water Manag. 2016, 174, 74–81. [Google Scholar] [CrossRef]
- Räsänen, T.A.; Someth, P.; Lauri, H.; Koponen, J.; Sarkkula, J.; Kummu, M. Observed River discharge changes due to hydropower operations in the Upper Mekong Basin. J. Hydrol. 2017, 545, 28–41. [Google Scholar] [CrossRef]
- Qin, W.; Zhu, Q.K.; Liu, G.Q.; Zhang, Y. Regulation effects of runoff and sediment of ecological conservation in the upper reaches of Beiluo River. J. Hydraul. Eng. 2010, 41, 1325–1332. [Google Scholar]
- Duan, X.; Gu, Z.; Li, Y.; Xu, H. The spatiotemporal patterns of rainfall erosivity in Yunnan Province, southwest China: An analysis of empirical orthogonal functions. Glob. Planet. Change 2016, 144, 82–93. [Google Scholar] [CrossRef]
- Klein, T.M.G.; Wijngaard, J.B.; Van Engelen, A. Climate of Europe: Assessment of Observed Daily Temperature and Precipitation Extremes; KNMI: De Bilt, The Netherlands, 2002. [Google Scholar]
- Wang, Y.; Hu, Y. Analysis of the Influence of the Water Conservancy Project in the Upper Lancang River on the Hydrological Elements of Yunjinghong Station. In Proceedings of the Yunnan Water Conservancy Society Academic Conference 2014, Kunming, China, 11 December 2014. [Google Scholar]
- Zhang, W.B.; Xie, Y.; Liu, B.Y. Rainfall erosivity estimation using daily rainfall amounts. Sci. Geogr. Sin. 2002, 22, 711–716. [Google Scholar]
- Yue, T.; Yin, S.; Xie, Y.; Yu, B.; Liu, B. Rainfall erosivity mapping over mainland China based on high-density hourly rainfall records. Earth Syst. Sci. Data 2022, 14, 665–682. [Google Scholar] [CrossRef]
- Mann, H.B. Nonparametric tests against trend. Econometrica 1945, 13, 245–259. [Google Scholar] [CrossRef]
- Kendall, M.G.; Gibbons, J.D. Rank Correlation Methods; Oxford University Press: London, UK, 1990. [Google Scholar]
- Sriwongsitanon, N.; Kaprom, C.; Tantisuvanichkul, K.; Prasertthonggorn, N.; Suiadee, W.; Bastiaanssen, W.G.M.; Williams, J.A. The Combined Power of Double Mass Curves and Bias Correction for the Maximisation of the Accuracy of an Ensemble Satellite-Based Precipitation Estimate Product. Hydrology 2023, 10, 154. [Google Scholar] [CrossRef]
- Liu, C.; He, Y.; Des Walling, E.; Wang, J. Changes in the sediment load of the Lancang-Mekong River over the period 1965–2003. Sci. China Technol. Sci. 2013, 56, 843–852. [Google Scholar] [CrossRef]
- Yonaba, R.; Mounirou, L.A.; Keïta, A.; Fowé, T.; Zouré, C.O.; Belemtougri, A.; Kafando, M.B.; Koïta, M.; Karambiri, H.; Yacouba, H. Exploring the Added Value of Sub-Daily Bias Correction of High-Resolution Gridded Rainfall Datasets for Rainfall Erosivity Estimation. Hydrology 2024, 11, 132. [Google Scholar] [CrossRef]
- Wang, S. Differential Changes in Water and Sediment Transport Under the Influence of Large-Scale Reservoirs Connected End to End in the Upper Yangtze River. Hydrology 2025, 12, 292. [Google Scholar] [CrossRef]
- Zhang, Z.; Van Coillie, F.; De Clercq, E.M.; Ou, X.; De Wulf, R. Mountain vegetation change quantification using surface landscape metrics in Lancang watershed, China. Ecol. Indic. 2013, 31, 49–58. [Google Scholar] [CrossRef]
- Wang, H.; Zhao, W.; Li, C.; Pereira, P. Vegetation greening partly offsets the water erosion risk in China from 1999 to 2018. Geoderma 2021, 401, 115319. [Google Scholar] [CrossRef]


Disclaimer/Publisher’s Note: The statements, opinions and data contained in all publications are solely those of the individual author(s) and contributor(s) and not of MDPI and/or the editor(s). MDPI and/or the editor(s) disclaim responsibility for any injury to people or property resulting from any ideas, methods, instructions or products referred to in the content. |
© 2026 by the author. Licensee MDPI, Basel, Switzerland. This article is an open access article distributed under the terms and conditions of the Creative Commons Attribution (CC BY) license.