Abstract
This study assesses the chemical state of surface water bodies (SWBs) in the Júcar River Basin District (Spain), specifically focusing on contaminants such as nickel, lead, imazalil, and thiabendazole. To identify risky zones, the RREA model was combined with a Python-based subroutine to estimate the minimum non-compliance load (MNCL). The results show that many SWBs fail to meet water quality criteria due to point source pollution. The RREA (Rapid Response to Environmental status) model improves monitoring capacities by confirming SWB chemical statuses and detecting locations that have not been monitored or assessed thoroughly. The study also analyzes confidence levels by comparing MNCL to the current accumulated load (CAL), allowing for the identification and prioritization of important non-compliant SWBs and locations that require additional examination. This methodology not only enhances the accuracy of compliance evaluations but also serves as a useful tool for targeted water quality management initiatives. The results of this paper highlight the potential of the proposed pressure-impact approach to assess the chemical state of SWBs. This approach is useful to support sustainable management measures that mitigate water quality issues and preserve the environmental status of SWBs.
1. Introduction
Water is vital for human progress and ecological sustainability [1]. Its availability and quality influence the future of communities, affecting food security and biodiversity preservation [2,3,4]. Water pollution has become a significant worldwide challenge, emphasizing the importance of effective water resources management that considers the dynamic interconnections of water bodies and other environmental elements [5,6,7,8,9].
As a shared and limited resource, water necessitates preservation and responsible utilization, considering both its quantity and quality [10,11]. In order to safeguard and manage our freshwater, the European Union policy established the Water Framework Directive [12]. Through the sustainable use of water resources and the establishment of programs for monitoring ecological and chemical status, the Water Framework Directive defines as environmental objectives the need to achieve the good status of all water bodies [13,14,15,16,17].
To achieve environmental goals and maintain water quality, water management actions are commonly required to mitigate issues like pollution, habitat loss, and nutrient accumulation, which affect both public health and environmental sustainability [18,19,20,21,22,23]. Monitoring programs and numerical models are essential since they provide vital information on flow volumes, ecological conditions, and water quality, among others [24,25,26]. Based on a solid methodological framework that incorporates ecological and chemical indicators, the Spanish Hydrological Planning Regulation classifies the ecological status into five categories (very good, good, moderate, poor, or bad), while the chemical status is rated as good or not good. The final status of a water body is determined by the worst value between its ecological and chemical classifications, reflecting a precautionary approach to water quality management [27].
Water resources all over the world are under significant pressure: the discharges from agricultural inputs (fertilizers and pesticides), domestic and industrial wastes pollute freshwater systems and endanger socio-economic and ecological values. Water quality modeling is one of the fundamental strategies needed to address these issues [28,29,30]. To get a thorough understanding of surface water quality and dynamically account for the interactions between various elements and water bodies, the water resources must be managed at the river basin scale [31,32,33]. Large-scale water quality models enable the integration of complex environmental data, resulting in more effective monitoring and management practices that consider the interconnectivity of ecosystems and human activities [34,35,36].
Numerous water quality models have been developed to address the complexities of simulating and managing water quality dynamics across diverse environmental and spatial scales. The Integrated Catchment model (INCA) studies chemical distribution in both terrestrial and aquatic ecosystems processes [37,38,39], whereas the Hydrodynamic and Pollution 2D model (HydroPol2D) simulates hydrodynamics and pollution transport in catchments [40]. The MARINA model examines nutrient exports from rivers in response to human activity [41], and the GESCAL model, which is part of the AQUATOOL Decision Support System [42], simulates water quality across water resources systems [43,44]. The Rapid Response to Environmental status (RREA) model aims to estimate the impact of various environmental pressures on the physical-chemical condition of continental SWBs [45,46]. The RREA model is currently used by most River Basin Agencies in Spain to assess concentrations of pollutants such as nitrates, BOD5, phosphorus, and ammonium, and to support effective water quality evaluation and decision-making. However, large-scale water quality models to assess the chemical status and pollution risk of SWBs, based on a modeling approach that assumes first-order degradation kinetics for contaminants such as nickel, lead, imazalil, and thiabendazole, have not yet been developed.
The main objective of this paper is to provide a comprehensive understanding of the environmental conditions and potential risks to the surface water quality. This study endeavors to advance scientific knowledge by extending the RREA model, enhancing its capabilities for predicting and managing chemical dynamics in SWBs in the Júcar River Basin District (eastern Spain). By presenting an innovative approach for assessing the overall state of water bodies and detecting chemical problems, the objective is to offer useful insights for decision-makers and managers of water resources to create efficient plans for sustainable water management and environmental preservation.
2. Materials and Methods
Building on a thorough assessment of the environmental conditions and potential risks, this study examines the connection between the detected pressures and how they affect water quality. To establish the significance of those pressures that have a cumulative character (i.e., various upstream sources of pollutants contribute to the concentrations downstream), specifically point discharges and diffuse pollution, the water quality of surface bodies was simulated using the RREA (rapid response of environmental status) model [47].
By comparing the observed findings to the pressure-impact relationship of SWBs, those SWBs that are susceptible to not meeting environmental objectives were identified. As a second part of the analysis, the minimum non-compliance load (MNCL) of each SWB was estimated on the basis of the available data of the current accumulated load (CAL). For that, a Python routine was developed to estimate the risk of non-compliance, as shown in Figure 1.
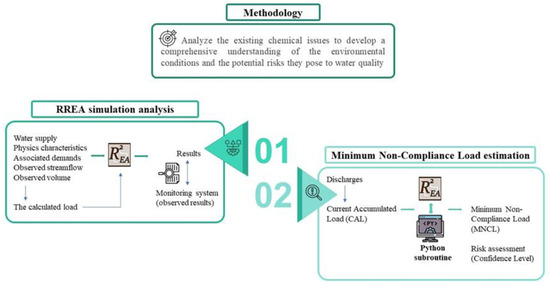
Figure 1.
Diagram of the general methodology proposed and applied in this work.
2.1. Large-Scale Water Quality Model: RREA
To simulate SWB quality, the RREA model assesses the cumulative impact of pressures such as extractions, point discharges, and diffuse pollution. It estimates pollutant concentrations taking into consideration the catchment-generated loads, upstream pollution, and in-body degradation.
The initial step of this methodology involves the collection of input data for the RREA large-scale water quality model (Figure 2). The needed data include physical characteristics of the basin, such as the flow network with codified SWBs and their discharge connections. Reservoirs and rivers are the main parts of this network. Flow inputs (hm3/month) for each catchment basin must present a consistent time series with no missing data. Contaminant information is also required, including contamination loads (g/month) from point or diffuse sources, as well as degradation coefficients, which indicate how quickly a pollutant degrades in water bodies.
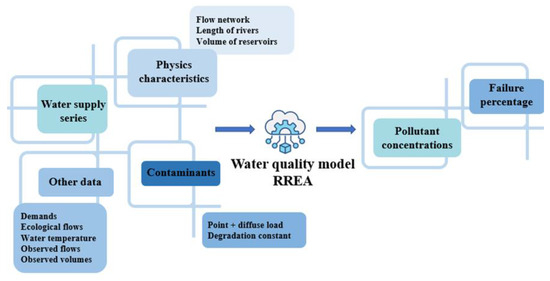
Figure 2.
Diagram of the large-scale water quality model RREA. The blue arrows represent the input variables and results of the RREA model.
In addition to the mandatory input data required, other optional data can improve model accuracy, such as water demands (hm3/month, with negative values representing returns), water temperature (°C, used to adjust pollutant degradation constants), environmental flows (hm3/month), and the observed flows and volumes (used to refine input flows and variable load data).
After fixing all the input data, the large-scale RREA model was simulated. As a result, the circulating flows in each water body, the concentration of pollutants that endanger the good status of the SWBs, and their corresponding non-compliance percentages were obtained as the quotient between the number of time steps with failure (non-compliance) concentrations and the total number of time steps. Based on these results, the SWBs that do not comply with the environmental quality standards were obtained for each contaminant and were mapped using the Quantum Geographic Information System (QGIS).
2.2. Estimation of the Non-Compliance Load Methodology
As a second part of the methodology, a Python program was developed to determine the minimum load value that causes the non-compliance of each SWB. The process of our program, presented in Figure 3, starts from the SWBs with order 0 (i.e., the headwater SWBs), activating them and giving them a minimum load value equal to 0.1 g/month. Then, the RREA model was automatically simulated, obtaining the failure (non-compliance) results, which were imported to check if failures occurred with this load. The load values were increased within the loop till all the activated SWBs became non-compliant (the maximum load value is 1,000,000 g/month). Then, the loop moved to the SWBs with order 1, and the same process was repeated until all the orders were completed.
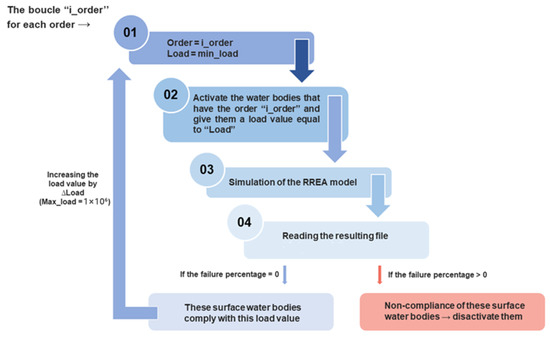
Figure 3.
Diagram of the Python subroutine to quantify the minimum load of non-compliance of the surface water bodies.
The non-compliance of some active SWBs can produce contamination and non-compliance in the downstream SWBs. For these cases, the minimum load result that produced the non-compliance was stored. This type of non-compliance was called indirect non-compliance.
Furthermore, in order to have a thorough picture of the status of each SWB, the Pending Load until Default (PLD) was assessed as the difference between MNCL and CAL (i.e., PLD = MNLC − CAL). This ensures that discharges are closely regulated and observed, avoiding further contamination in regions where concentrations are already high. This tool helps maintain SWBs in good or very good condition by guiding appropriate regulatory actions and discharge restrictions.
2.3. Assessment of Confidence Level and Risk
An essential step in environmental management is the analysis of confidence levels and risks, which guarantees the accuracy and reliability of ecological assessments of SWBs (Table 1). Confidence levels were classified as high, medium, or low based on the assessment of various parameters, including measurement uncertainty, indicator availability, categorization accuracy, and data consistency with known pressures. This is relevant in risk assessment and decision-making contexts.

Table 1.
Estimation of the different confidence levels of compliance and non-compliance of the surface water bodies in the Júcar River Basin District. The observation data come from measurements taken by the monitoring network of the Júcar River Basin Agency (Section 3.2).
3. Application to a Case Study
3.1. Description of the Study Area
The Júcar River Basin District (RBD) is located in the central eastern end of the Iberian Peninsula (Figure 4) and comprises 304 rivers, including the Cenia, Mijares, Palancia, Turia, Júcar, Serpis, and Vinalopó. The longest rivers are the Júcar (512 km) and Turia (280 km), with a Mediterranean climate and flow regime.
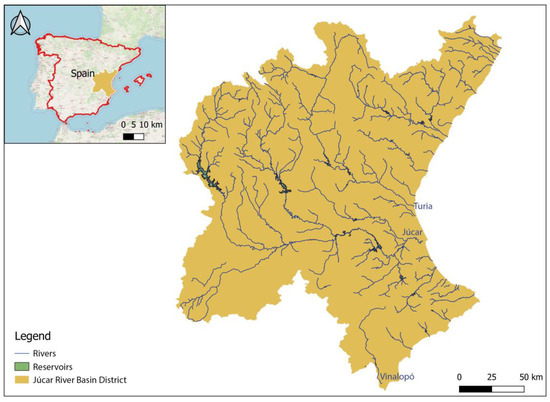
Figure 4.
Location and delimitation of the Júcar River Basin District (eastern Spain).
Economically, the service and tourism sectors are dominant, followed by industry, agriculture, and energy. Agriculture occupies roughly half of the district’s surface and consumes 80% of the water. Citrus (43% of the total irrigated area), grain cereals (12%), wine grapes (9%), and outdoor vegetables (9%) are the most irrigated crops [48].
3.2. Monitoring System in the Study Area
To evaluate the condition of SWBs in the Júcar RBD, water monitoring networks are crucial. The locations of the 2324 quality stations, which collect physicochemical, chemical, and biological parameters, are shown in Figure 5. Based on the monthly observed data from 2014 to 2023, which are provided by the Jucar River Basin Agency (https://aps.chj.es/siajucar/ (accessed on 1 September 2025)), a water quality analysis of the SWBs was performed, concentrating on some specific substances that caused serious problems in the Júcar RBD.
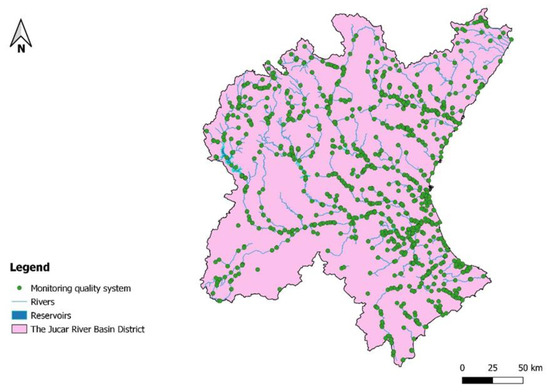
Figure 5.
Monitoring quality system in the Júcar River Basin District.
3.3. Implementation of the RREA Model in the Study Area
This work analyzes the following pollutants due to their severe and widespread impact on water quality and ecosystem health in the Júcar RBD: nickel (AM = 1.2 µg/l, MAC = 14 µg/l), lead (AM = 4 µg/l, MAC = 34 µg/l), imazalil (AM = 0.1 µg/l), and thiabendazole (AM = 1.2 µg/l). This represents a valuable step forward with respect to the earlier RREA model from the 2022–2027 Hydrological Plan of the Júcar RBD [48], which simulated BOD5, phosphorus, ammonium, and nitrates.
Pollutant loads were determined by analyzing discharge data from the Júcar River Basin Agency [48]. The substances were considered to undergo first-order degradation. To that end, degradation constants were defined according to the contaminant and by zone, considering the degree of pollution in each river stretch (most of the coefficients are very low). For heavy metals, most of the constants were set to zero, as both the discharges and the river stretches exhibit very low concentrations of suspended solids. To assess compliance and environmental impact, two datasets were used: one specifying the types, origins, and destinations of discharges, and the other comparing the analytical data of the approved limit values with the registered pollutant concentration. The load values were assessed using Equation (1).
The results of the simulations performed with the RREA model for the 341 SWBs from 1980 to 2018 are analyzed and discussed in the next section.
4. Results and Discussion
4.1. Analysis of the Chemical Status of Surface Water Bodies
Nickel (Ni), which is a silvery-white metallic element, is prized for its high physical and chemical qualities. It is essential for a variety of industries, including transportation, aerospace, construction, medical equipment, electronics, batteries, and food processing sectors. The results of the current status of SWBs regarding this pollutant in the Júcar RBD (Figure 6a) show some non-compliance during the study period between 2014 and 2023 compared to the fixed limits (AM = 4 µg/l, MAC = 34 µg/l). The majority of the SWBs in the Vinalopó, Serpis, and Montnegre rivers failed to meet the good status for nickel. These high concentrations in the study area can be linked to the large number of industrial discharge points. These emissions are presumably from diverse industrial operations that contribute to the accumulation of nickel in SWBs.
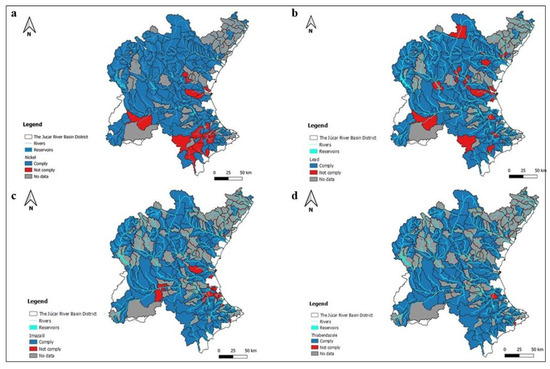
Figure 6.
Water bodies (sub-basins) that comply and do not comply based on the monitoring observations: (a) nickel, (b) lead, (c) imazalil, and (d) thiabendazole.
On the other hand, lead (Pb), which is a silvery-grey metal with high corrosion resistance and malleability, is widely utilized in industry. Lead is commonly found in the surface layers of soil and water, and its use in ammunition and fishing tackle contributes to its long-term persistence in the environment. The examination of lead concentrations, with an AM of 1.2 µg/L and a MAC of 14 µg/L, indicates non-compliance in various SWBs within the Júcar RBD (Figure 6b).
With respect to imazalil (IMZ), it is an imidazole fungicide that is commonly used to prevent storage rot in post-harvest fruits, such as citrus, and to manage fungal diseases in crops and ornamentals. According to the criteria of the Jucar River Basin Agency, the toxicity threshold for imazalil is set at an annual average limit equal to 0.1 µg/L, as it is specified in the Hydrological Plan of the Júcar RBD [48]. Although it is not banned in the EU, it is considered dangerous to the environment and human health, with possible chronic toxicity and carcinogenic consequences [49]. Identified as a specific pollutant in the Júcar RBD, the results of surface water quality analysis, based on the monitoring data, show some non-compliance between 2014 and 2023 (Figure 6c). Influenced by the presence of wastewater treatment plans, some SWBs prove clearly an increase in the imazalil concentration from the month of October to May. This period coincides with the citrus harvesting season.
Finally, thiabendazole is a fungicide that is highly effective against a broad spectrum of fungi, and it is also used as a food additive, a medicament in very small doses, and in post-harvest treatment. According to the Environmental Quality Standards (EQS) for specific pollutants in the Júcar River Basin, for SWBs, the toxicity threshold for thiabendazole is set at an annual average limit equal to 1.2 µg/l [48]. The outcomes of the monitoring analysis to evaluate the SWB status of non-compliance for thiabendazole in the Júcar RBD show just four SWBs that failed to meet the EQS (Figure 6d). The concentration analysis of the thiabendazole in the non-compliant part of the Mijares River demonstrates a significant rise in the concentrations between December and the start of April. This behavior suggests a connection between the orange and mandarin post-harvest treatments (waxing and washing) in the citrus handling food sector.
4.2. Modeling the Chemical Status of Surface Water Bodies with RREA: Comparison with Data of the Monitoring System
To assess the reliability of the RREA model to simulate specific contaminants, monitored data were compared to model results using a 2 × 3 contingency table with binary occurrences. The study identified pollutant conditions using AM and MAC thresholds over 38 years of simulated data. The results of the simulations of non-compliance with the fixed regulations for nickel, within the Júcar RBD, are displayed in Figure 7a, providing a comprehensive overview of the study area. The results highlight some non-compliant SWBs in the Vinalopó River Basin and in the lower part of the Turia River Basin, presenting the highest failure percentages (i.e., percentage of months in which a failure occurs out of the total number of months) of 82.5% and 79.2%, respectively.
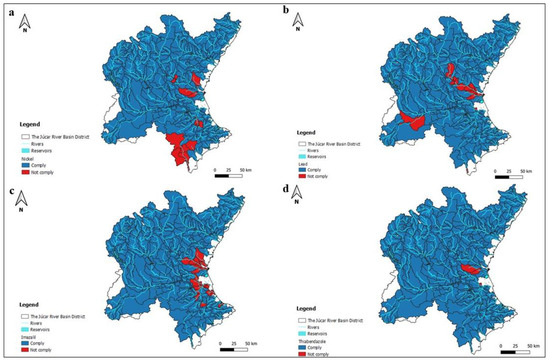
Figure 7.
Water bodies (sub-basins) that comply and do not comply based on the results of RREA: (a) nickel, (b) lead, (c) imazalil, and (d) thiabendazole.
To assess the performance of the RREA model in predicting the chemical status of SWBs, contingency tables were obtained for each pollutant. These tables have been widely used in research studies and management plans. The contingency table (Table 2) for nickel indicates a significant correlation between observed and simulated nickel data, with 260 SWBs demonstrating equivalence. The RREA model also provides insights into 59 SWBs that were not measured by the monitoring system, thereby filling significant data gaps. Furthermore, 18 SWBs listed as non-compliant by the measurements taken by the monitoring network of the Júcar River Basin Agency exhibit satisfactory status in the RREA simulations, most likely due to low or negligible pollution loads. Finally, four SWBs that do not comply with nickel in the RREA simulation contradict their high status in the monitoring system, which could be due to short-term point discharges that were not measured during the monitoring period or upstream non-compliant water bodies during periods that were not measured.

Table 2.
Contingency table to assess nickel status classification performance of the RREA model in the Júcar River Basin District.
Regarding the lead analysis (Figure 7b), the RREA simulation produced some non-compliance of SWBS in the Turia River Basin by exceeding the annual mean (AM = 1.2 µg/l), and in the Júcar River Basin by exceeding both the AM and the MAC, with a low failure percentage. Considering the threshold levels pertaining to both observed and simulated data, any SWB exceeding the AM and/or the MAC is deemed non-compliant. The resulting efficiency analysis shows that the RREA model fills important monitoring gaps by highlighting the status of 59 SWBs that the monitoring system does not measure (Table 3). Additionally, the contingency table shows that the simulated and observed data in 245 SWBs are equivalent. Dissimilarities among the remaining 25 SWBs may be due to the absence of discharges or sufficient flow to allow lead to degrade. Additionally, despite non-compliance in the RREA simulations, 12 SWBs exhibit good status in the monitoring system. This is probably because these water bodies are impacted by point discharges or non-compliant upstream water bodies during periods that were not measured.

Table 3.
Contingency table to assess lead status classification performance of the RREA model in the Júcar River Basin District.
According to the simulations of the RREA model, some SWBs do not comply with the imazalil limits, i.e., they present concentrations higher than the fixed EQS limit (AM = 0.1 µg/l). The results show 34 water bodies at risk of non-compliance (Figure 7c), with significantly high failure percentages. These SWBs are located generally in the downstream part of the Júcar and Turia River Basins. The RREA model shows that observed and simulated data for 213 SWBs are equivalent (Table 4), and it provides useful insights into 105 SWBs that do not have monitoring data. Seven SWBs that, based on the data, do not comply with imazalil contradict their good status in RREA simulations, most likely due to low or negligible pollution loads. In contrast, non-compliance in 16 SWBs can be influenced by massive point releases with high pollution loads that were not measured during the monitoring period, which damage downstream water bodies.

Table 4.
Contingency table to assess imazalil status classification performance of the RREA model in the Júcar River Basin District.
Finally, the status of SWBs regarding the fungicide thiabendazole is relatively good. Only six water bodies do not comply with the regulation, where the most at-risk ones are located in the Poyo Ravine, as illustrated in Figure 7d, with a high percentage of failure (more than 75%). The contingency table indicates that the RREA model aligns with observed data in 228 SWBs (Table 5), demonstrating its reliability. It also provides information on the status of 105 SWBs that were neglected by the monitoring system, thereby addressing key knowledge gaps. Anomalies were found in just 8 of the 341 SWBs.

Table 5.
Contingency table to assess thiabendazole status classification performance of the RREA model in the Júcar River Basin District.
4.3. Assessment of the Minimum Non-Compliance Load
The lowest loads of nickel above which the environmental quality standards (MAC = 34 µg/l) would not be met are analyzed in this section. As is observed in Figure 8, there are some water bodies that do not meet the nickel regulations with low load values between 0.1 and 100 g/month. These water bodies present a high risk of not achieving the environmental goals of 2027. Furthermore, a second category is identified with medium load values ranging from 100 to 10,000 g/month that can sustain significant discharges. The last category that occupies an important surface of the Júcar RBD, represented by the two shades of intense blue, can support very high load values varying from 10,000 to 1,000,000 g/month.
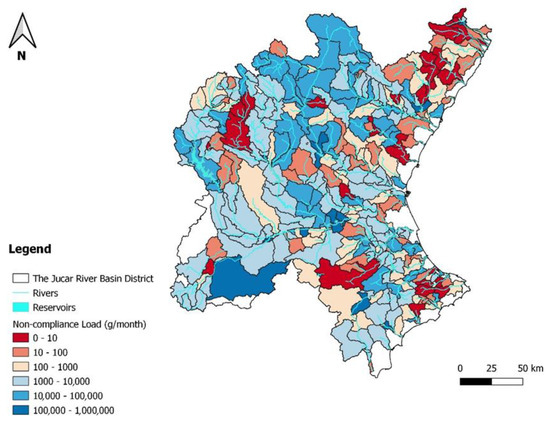
Figure 8.
Minimum load of non-compliance of the surface water bodies in the Júcar River Basin District regarding nickel concentration.
Discharges from upstream sources may have a cumulative impact on SWBs downstream. Although individual releases might not seem significant, their combined effect can cause contamination levels that exceed the legal limits and negatively impact the aquatic system. For these cases, the minimum load result that produces the non-compliance is stored. This is an indirect non-compliance. It expresses the failure accumulation trend of a river. The minimum indirect non-compliance load only gives results if the failing load is equal to or less than the upstream MNCL. The spatial distribution of this indirect non-compliance is shown in Figure 9.
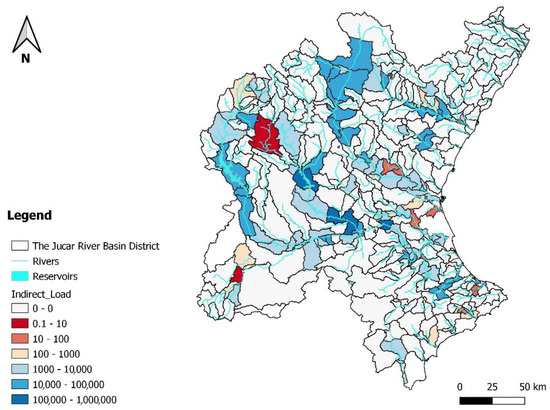
Figure 9.
Indirect non-compliance of the surface water bodies in the Júcar River Basin District regarding nickel concentration.
The comparison of the modelling results with the accumulated load that is currently present in the Júcar RBD (Figure 10) reveals that there is a noticeable correlation between the two data sets, indicating that the trends and patterns found are rather consistent. According to this correlation, the approach proposed in this paper is capable of capturing important factors and processes that are relevant to evaluating nickel loads in the Júcar RBD. Focusing on the part of the Júcar River Basin, almost the entire SWBs of this zone present a good nickel status with accumulated load values between 100 and 1000 g/month. These results are fully consistent with our analysis, which shows that the minimum load non-compliance values for these SWBs range between 100 and 1,000,000.
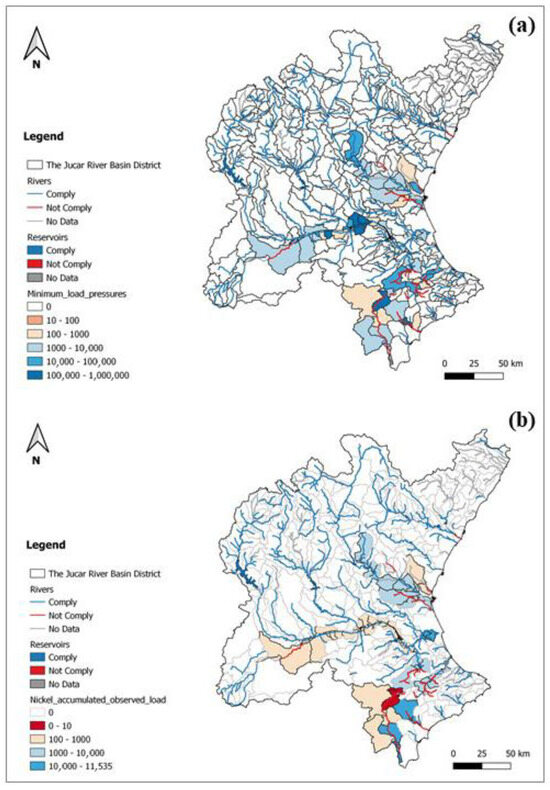
Figure 10.
Comparison between the minimum load of non-compliance (a) and the accumulated observed load values (b) of the surface water bodies under pressures in the Júcar River Basin District regarding nickel concentration.
The PLD values were also assessed, and the results are shown in Figure 11. The SWBs in red and orange have high CAL values that exceed the MNCL, indicating severe non-compliance with nickel regulations. These areas show a considerable deficit, emphasizing the urgent need for intervention to reduce elevated nickel concentrations. SWBs represented in beige have CAL values at or around the MNCL. These water bodies require proactive steps from the Júcar River Basin Agency to improve their quality in terms of nickel concentration, as well as restricting large discharges at these points to prevent future contamination. On the other hand, SWBs depicted in various shades of blue are in good to outstanding condition, with CAL values significantly lower than the MNCL, indicating minimal pollution levels and compliance with nickel regulations.
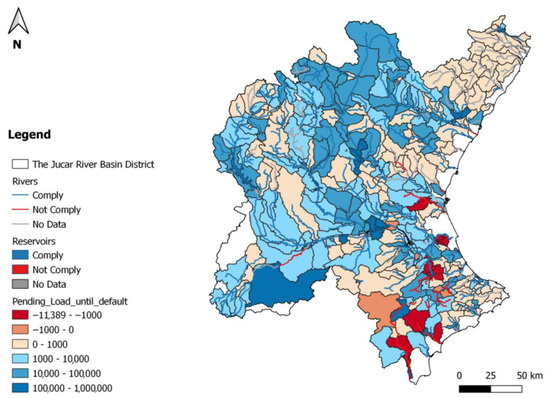
Figure 11.
Pending Load until Default of the surface water bodies in the Júcar River Basin District regarding nickel concentration.
By providing a clear representation of PDL across all SWBs, technicians of the Júcar River Basin Agency can make more informed decisions about water quality management. This tool helps to identify crucial areas where nickel concentrations exceed permissible limits, prioritizing those that require immediate corrective actions. It also helps with intervention strategy by highlighting SWBs at risk of non-compliance, allowing preventative steps to be implemented before the issues worsen.
4.4. Risk Analysis Based on Confidence Levels
The risk analysis detailed in this section is based on the confidence levels of compliance and non-compliance of all the SWBs in the Júcar RBD that present a direct discharge and/or an accumulated load. Regarding the non-compliant SWBs that do not satisfy the standards, with a significantly lower CAL compared to the MNCL, each of these SWBs has a low confidence level of non-compliance (Figure 12). This low level suggests less reliable evaluations, implying probable unpredictability in data accuracy and the need for more rigorous monitoring. On the other hand, there are SWBs that do not comply with nickel but present a different scenario. These SWBs have high CAL values that frequently exceed the MNCL. The high confidence levels of non-compliance for these water bodies indicate a severe and verified pollution problem, suggesting that interventions should be prioritized for these areas due to the high reliability of the assessments.
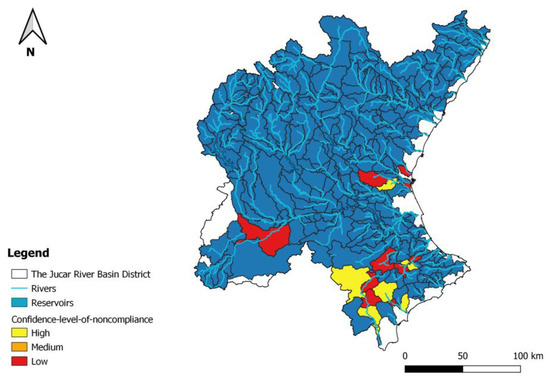
Figure 12.
Level of confidence and risk of non-compliant surface water bodies in the Júcar River Basin District regarding nickel concentration.
For the compliant SWBs, those with CAL values well below their estimated MNCL exhibit a high confidence level in compliance (Figure 13). These elevated confidence levels suggest reliability and precise measurements, indicating effective water body management. However, some compliant SWBs, despite meeting the standards, have CAL values close to or exceeding the MNCL. These SWBs show low confidence levels, implying that although they are currently compliant, there is greater uncertainty regarding the accuracy and stability of this status. Therefore, closer monitoring is recommended to ensure these SWBs remain compliant.
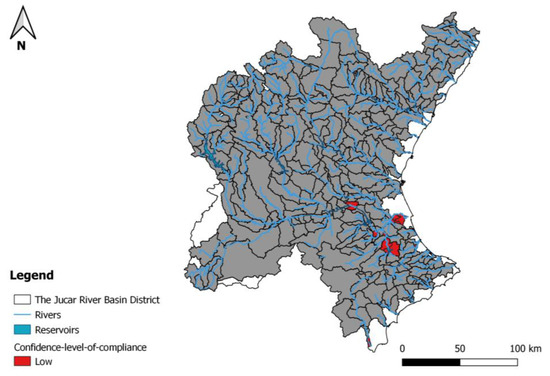
Figure 13.
Level of confidence and risk of compliant surface water bodies in the Júcar River Basin District regarding nickel concentration.
In conclusion, because of their confirmed pollution problems, non-compliant SWBs with high confidence levels are priority targets for intervention. On the contrary, high confidence compliant SWBs demonstrate effective management, while low confidence SWBs need more examination to guarantee continued compliance. Even the SWBs that do not have records in the monitoring system, if they are with or without direct load, present a high confidence level of compliance with CAL values too much lower than the estimated MNCL. Overall, the results indicate the good status of these SWBs and fill the data gaps, aiding in monitoring and ensuring adherence to regulatory standards.
5. Conclusions
This study assesses the current chemical status of surface water bodies (SWBs) within the Júcar RBD (eastern Spain), focusing on four pollutants: nickel, lead, imazalil, and thiabendazole. For that, an improved RREA (Rapid Response to Environmental status) model is developed and presented as a complementary tool to the monitoring system, which has been proven to accurately predict the observed status of SWBs and is also useful to fill the gaps of SWBs that did not have any recorded data.
The proposed methodology to estimate the minimum non-compliance load (MNCL) enables to give a thorough overview of the status of SWBs. This analysis provides vital insights into the capacity of each SWB to accept present discharge levels. Understanding these capacities of SWBs enables the Júcar River Basin Agency to make informed decisions regarding discharge authorization, regulatory compliance, and efficient water resource management. This pressure-impact approach not only allows for more effective decision-making but also supports the River Basin Agency to protect environmental integrity while addressing the requirements of many stakeholders. The confidence level analysis performed reveals critical insights into the status of SWBs and allows water managers to prioritize measures for non-compliant SWBs with established pollution issues and identify well-managed SWBs.
The results of this paper increase our understanding of the chemical state of surface water bodies. The methodology proposed in this work, which is extensible to other river basins across the globe, allows the river basin agencies to make more effective and sustainable water management decisions regarding water quality, environmental protection, and regulatory compliance.
Supplementary Materials
The following supporting information can be downloaded at: https://aps.chj.es/siajucar/ (accessed on 1 September 2025). Time series of the simulated concentrations of each contaminant in the surface water bodies are provided as supplementary materials. The shapefiles of the surface water bodies and discharge points are likewise provided as supplementary materials.
Author Contributions
Conceptualization, J.P.-A., R.J.B., and S.A.; methodology, J.P.-A., R.J.B., A.S., and S.A.; software, J.P.-A., A.S., and S.A.; validation, J.P.-A., R.J.B., and J.A.; investigation, J.P.-A., R.J.B., A.S., J.A., and S.A.; writing—original draft preparation, S.A.; writing—review and editing, R.J.B., A.S., J.A., and J.P.-A.; supervision, J.P.-A. and R.J.B.; project administration, R.J.B. All authors have read and agreed to the published version of the manuscript.
Funding
This work was carried out in the framework of the NBSPLUS project (PCI2025-163161, MICIU/AEI/10.13039/501100011033/EU). This project was funded by Biodiversa+, the European Biodiversity Partnership, under the 2023–2024 BiodivNBS joint call. It was co-funded by the European Commission (GA No. 101052342) and the following funding organisations: The Swedish Research Council for Environment, Agricultural, Sciences, and Spatial Planning (Formas), Fundação para a Ciência e a Tecnologia, I.P., Research Council of Norway, Agencia Estatal de Investigación; Fundación Biodiversidad, Estonian Research Council, Fonds de Recherche du Québec (FRQ).
Data Availability Statement
The data presented in this study are available upon request from the corresponding author. Time series of the simulated concentrations of each contaminant in the surface water bodies are provided as Supplementary Materials. The shapefiles of the surface water bodies and discharge points, which are available at the following website (https://aps.chj.es/siajucar/ (accessed on 1 September 2025)), are likewise provided as Supplementary Materials.
Conflicts of Interest
The authors declare no conflicts of interest.
References
- UNESCO. The United Nations World Water Development Report 2021: Valuing Water; United Nations: New York, NY, USA, 2021. [Google Scholar]
- Sivaranjani, S.; Rakshit, A.; Singh, S. Water quality assessment with water quality indices. Int. J. Bioresour. Sci. 2015, 2, 85–94. [Google Scholar] [CrossRef]
- Risal, A.; Urfels, A.; Srinivasan, R.; Bayissa, Y.; Shrestha, N.; Paudel, G.P.; Krupnik, T.J. Impact of climate change on water resources and crop production in Western Nepal: Implications and adaptation strategies. Hydrology 2022, 9, 132. [Google Scholar] [CrossRef]
- Chen, L.; Xia, X.; Zhang, J.; Zhu, Y.; Long, C.; Chen, Y.; Guo, W.; Xu, L.; Jia, J. The food security risks in the Yangtze River Delta of China associated with water scarcity, grain production, and grain trade. Sci. Total Environ. 2024, 948, 174863. [Google Scholar] [CrossRef] [PubMed]
- Rajanayaka, C.; Weir, J.; Barkle, G.; Griffiths, G.; Hadfield, J. Assessing changes in nitrogen contamination in groundwater using water aging: Waikato River, New Zealand. J. Contam. Hydrol. 2020, 234, 103686. [Google Scholar] [CrossRef] [PubMed]
- Monico, V.; Solera, A.; Bergillos, R.J.; Paredes-Arquiola, J.; Andreu, J. Effects of environmental flows on hydrological alteration and reliability of water demands. Sci. Total Environ. 2022, 810, 151630. [Google Scholar] [CrossRef]
- Ghannem, S.; Bergillos, R.J.; Paredes-Arquiola, J.; Martínez-Capel, F.; Andreu, J. Coupling hydrological, habitat and water supply indicators to improve the management of environmental flows. Sci. Total Environ. 2023, 898, 165640. [Google Scholar] [CrossRef]
- Yi, J.; Gerbens-Leenes, P.W.; Aldaya, M.M. Crop grey water footprints in China: The impact of pesticides on water pollution. Sci. Total Environ. 2024, 935, 173464. [Google Scholar] [CrossRef]
- Shaika, N.A.; Khan, S.; Awal, S.; Haque, M.M.; Bashar, A.; Simsek, H. Aquatic Pollution in the Bay of Bengal: Impacts on Fisheries and Ecosystems. Hydrology 2025, 12, 191. [Google Scholar] [CrossRef]
- Kurrer, C.; Lipcaneanu, N. Water protection and management. In Fact Sheets on the European Union; Articles 191 to 193 of the Treaty on the Functioning of the European Union (TFEU); European Parliament: Strasbourg, France, 2023. [Google Scholar]
- Gartsiyanova, K.; Genchev, S.; Kitev, A. Assessment of Water Quality as a Key Component in the Water–Energy–Food Nexus. Hydrology 2024, 11, 36. [Google Scholar] [CrossRef]
- Directive 2000/60/EC of the European Parliament and of the Council. Establishing a Framework for Community Action in the Field of Water Policy; L327; Official Journal of the European Communities: Luxembourg, 2000; Volume 43.
- Carter, J.G.; White, I. Environmental planning and management in an age of uncertainty: The case of the Water Framework Directive. J. Environ. Manag. 2012, 113, 228–236. [Google Scholar] [CrossRef]
- Fliedner, A.; Lohmann, N.; Rüdel, H.; Teubner, D.; Wellmitz, J.; Koschorreck, J. Current levels and trends of selected EU Water Framework Directive priority substances in freshwater fish from the German environmental specimen bank. Environ. Pollut. 2016, 216, 866–876. [Google Scholar] [CrossRef] [PubMed]
- Fliedner, A.; Rüdel, H.; Lohmann, N.; Buchmeier, G.; Koschorreck, J. Biota monitoring under the Water Framework Directive: On tissue choice and fish species selection. Environ. Pollut. 2018, 235, 129–140. [Google Scholar] [CrossRef] [PubMed]
- Cooper, R.J.; Hiscock, K.M. Two decades of the EU Water Framework Directive: Evidence of success and failure from a lowland arable catchment (River Wensum, UK). Sci. Total Environ. 2023, 869, 161837. [Google Scholar] [CrossRef]
- Adams, R.; Quinn, P. Simulating phosphorus load reductions in a nested catchment using a flow pathway-based modeling approach. Hydrology 2023, 10, 184. [Google Scholar] [CrossRef]
- Pardo-Loaiza, J.; Solera, A.; Bergillos, R.J.; Paredes-Arquiola, J.; Andreu, J. Improving indicators of hydrological alteration in regulated and complex water resources systems: A case study in the Duero River basin. Water 2021, 13, 2676. [Google Scholar] [CrossRef]
- Pardo-Loaiza, J.; Bergillos, R.J.; Solera, A.; Paredes-Arquiola, J.; Andreu, J. Habitat alteration assessment for the management of environmental flows in regulated basins. J. Environ. Manag. 2022, 319, 115653. [Google Scholar] [CrossRef]
- Pardo-Loaiza, J.; Bergillos, R.J.; Solera, A.; Paredes-Arquiola, J.; Andreu, J. The role of environmental flows in the spatial variation of the water exploitation index. Water 2022, 14, 2938. [Google Scholar] [CrossRef]
- Li, Y.; Guo, R.; Liang, X.; Yao, B.; Yan, S.; Guo, Y.; Han, Y.; Cui, J. Pollution characteristics, ecological and health risks of herbicides in a drinking water source and its inflowing rivers in North China. Environ. Pollut. 2023, 334, 122130. [Google Scholar] [CrossRef]
- Bhatt, D.; Swain, M.; Yadav, D. Artificial intelligence based detection and control strategies for river water pollution: A comprehensive review. J. Contam. Hydrol. 2025, 271, 104541. [Google Scholar] [CrossRef]
- Hao, W.; Liu, Y.; Zhu, S.; Liu, Y.; Xu, W. Hydrological modeling of nutrient transport and mitigation strategies for non-point source pollution in the Bailin River basin. J. Contam. Hydrol. 2025, 273, 104617. [Google Scholar] [CrossRef] [PubMed]
- Chang, F.J.; Tsai, Y.H.; Chen, P.A.; Coynel, A.; Vachaud, G. Modeling water quality in an urban river using hydrological factors–Data driven approaches. J. Environ. Manag. 2015, 151, 87–96. [Google Scholar] [CrossRef]
- Chellaiah, C.; Anbalagan, S.; Swaminathan, D.; Chowdhury, S.; Kadhila, T.; Shopati, A.K.; Shangdiar, S.; Sharma, B.; Amesho, K.T. Integrating deep learning techniques for effective river water quality monitoring and management. J. Environ. Manag. 2024, 370, 122477. [Google Scholar] [CrossRef]
- Saadat, A.M.; Khodambashi Emami, S.; Hamidifar, H. A review on storage process models for improving water quality modeling in rivers. Hydrology 2024, 11, 187. [Google Scholar] [CrossRef]
- MARM. Orden ARM/2656/2008, de 10 de Septiembre, por la que se Aprueba la Instrucción de Planificación Hidrológica; 229, 22 September 2008; BOE núm: Madrid, Spain, 2008; pp. 38472–38582. [Google Scholar]
- Ejigu, M.T. Overview of water quality modeling. Cogent Eng. 2021, 8, 1891711. [Google Scholar] [CrossRef]
- Bouriqi, A.; Ouazzani, N.; Deliege, J.F. Modeling the Impact of Urban and Industrial Pollution on the Quality of Surface Water in Intermittent Rivers in a Semi-Arid Mediterranean Climate. Hydrology 2024, 11, 150. [Google Scholar] [CrossRef]
- De Girolamo, A.M.; Ricci, G.F.; Parete, G.; Gómez-Navarro, O.; Pérez, S.; Gentile, F. Modelling occurrence and environmental risk of azithromycin in an intermittent river: Applying hydrological and water quality models. J. Contam. Hydrol. 2025, 272, 104552. [Google Scholar] [CrossRef]
- Al-Jawad, J.Y.; Alsaffar, H.M.; Bertram, D.; Kalin, R.M. A comprehensive optimum integrated water resources management approach for multidisciplinary water resources management problems. J. Environ. Manag. 2019, 239, 211–224. [Google Scholar] [CrossRef]
- Mohtar, W.H.M.W.; Maulud, K.N.A.; Muhammad, N.S.; Sharil, S.; Yaseen, Z.M. Spatial and temporal risk quotient based river assessment for water resources management. Environ. Pollut. 2019, 248, 133–144. [Google Scholar] [CrossRef] [PubMed]
- Khorsandi, M.; Ashofteh, P.S.; Singh, V.P. Development of a multi-objective reservoir operation model for water quality-quantity management. J. Contam. Hydrol. 2024, 265, 104385. [Google Scholar] [CrossRef] [PubMed]
- Fischer, A.; Ter Laak, T.; Bronders, J.; Desmet, N.; Christoffels, E.; van Wezel, A.; van der Hoek, J.P. Decision support for water quality management of contaminants of emerging concern. J. Environ. Manag. 2017, 193, 360–372. [Google Scholar] [CrossRef]
- Van Vliet, M.T.; Flörke, M.; Harrison, J.A.; Hofstra, N.; Keller, V.; Ludwig, F.; Spanier, J.E.; Strokal, M.; Wada, Y.; Wen, Y.; et al. Model inter-comparison design for large-scale water quality models. Curr. Opin. Environ. Sustain. 2019, 36, 59–67. [Google Scholar] [CrossRef]
- Zhao, M.; Ma, C.; Zhang, H.; Li, H.; Huo, S. Long-term water quality simulation and driving factors identification within the watershed scale using machine learning. J. Contam. Hydrol. 2025, 273, 104604. [Google Scholar] [CrossRef] [PubMed]
- Whitehead, P.G.; Wilson, E.J.; Butterfield, D. A semi-distributed Integrated Nitrogen model for multiple source assessment in Catchments (INCA): Part I—Model structure and process equations. Sci. Total Environ. 1998, 210, 547–558. [Google Scholar] [CrossRef]
- Whitehead, P.G.; Wilson, E.J.; Butterfield, D.; Seed, K. A semi-distributed integrated flow and nitrogen model for multiple source assessment in catchments (INCA): Part II—Application to large river basins in south Wales and eastern England. Sci. Total Environ. 1998, 210, 559–583. [Google Scholar] [CrossRef]
- Wade, A.J.; Durand, P.; Beaujouan, V.; Wessel, W.W.; Raat, K.J.; Whitehead, P.G.; Butterfield, D.; Rankinen, K.; Lepisto, A. A nitrogen model for European catchments: INCA, new model structure and equations. Hydrol. Earth Syst. Sci. 2002, 6, 559–582. [Google Scholar] [CrossRef]
- Gomes, M.N., Jr.; Lago, C.A.F.D.; Castillo Rápalo, L.M.; Oliveira, P.T.S.; Giacomoni, M.H.; Mendiondo, E.M. HydroPol2D: Distributed hydrodynamic and water quality model-challenges and opportunities in poorly-gauged catchments. J. Hydrol. 2023, 625, 129982. [Google Scholar] [CrossRef]
- Strokal, M.; Kroeze, C.; Wang, M.; Bai, Z.; Ma, L. The MARINA model (Model to Assess River Inputs of Nutrients to seAs): Model description and results for China. Sci. Total Environ. 2016, 562, 869–888. [Google Scholar] [CrossRef]
- Andreu, J.; Capilla, J.; Sanchís, E. AQUATOOL, a generalized decision-support system for water-resources planning and operational management. J. Hydrol. 1996, 177, 269–291. [Google Scholar] [CrossRef]
- Paredes-Arquiola, J.; Andreu-Álvarez, J.; Martín-Monerris, M.; Solera, A. Water quantity and quality models applied to the Júcar River Basin, Spain. Water Resour. Manag. 2010, 24, 2759–2779. [Google Scholar] [CrossRef]
- Ghannem, S.; Paredes-Arquiola, J.; Bergillos, R.J.; Solera, A.; Andreu, J. Assessing the Effects of Environmental Flows on Water Quality for Urban Supply. Water 2024, 16, 1509. [Google Scholar] [CrossRef]
- Dorado-Guerra, D.Y.; Paredes-Arquiola, J.; Pérez-Martín, M.Á.; Tafur Hermann, H. Integrated Surface-Groundwater Modelling of Nitrate Concentration in Mediterranean Rivers, the Júcar River Basin District, Spain. Sustainability 2021, 13, 12835. [Google Scholar] [CrossRef]
- Dorado-Guerra, D.Y.; Paredes-Arquiola, J.; Pérez-Martín, M.Á.; Corzo-Pérez, G.; Ríos-Rojas, L. Effect of climate change on the water quality of Mediterranean rivers and alternatives to improve its status. J. Environ. Manag. 2023, 348, 119069. [Google Scholar] [CrossRef] [PubMed]
- Paredes-Arquiola, J. Manual Técnico del Modelo RREA: Respuesta Rápida del Estado Ambiental de las Masas de Agua Superficiales Continentales; Versión 4.0; Universitat Politécnica de Valencia: Valencia, Spain, 2023; pp. 1–4. [Google Scholar]
- CHJ, 2022. Plan Hidrológico de la Demarcación Hidrográfica del Júcar 2022–2027. Available online: https://www.chj.es/es-es/medioambiente/planificacionhidrologica/Paginas/PHC-2022-2027-Plan-Hidrologico-cuenca.aspx (accessed on 1 September 2025).
- European Food Safety Authority (EFSA); Brancato, A.; Brocca, D.; Cabrera, L.C.; De Lentdecker, C.; Erdos, Z.; Ferreira, L.; Greco, L.; Jarrah, S.; Kardassi, D.; et al. Updated review of the existing maximum residue levels for imazalil according to Article 12 of Regulation (EC) No 396/2005 following new toxicological information. EFSA J. 2018, 16, e05453. [Google Scholar] [CrossRef] [PubMed]
Disclaimer/Publisher’s Note: The statements, opinions and data contained in all publications are solely those of the individual author(s) and contributor(s) and not of MDPI and/or the editor(s). MDPI and/or the editor(s) disclaim responsibility for any injury to people or property resulting from any ideas, methods, instructions or products referred to in the content. |
© 2025 by the authors. Licensee MDPI, Basel, Switzerland. This article is an open access article distributed under the terms and conditions of the Creative Commons Attribution (CC BY) license (https://creativecommons.org/licenses/by/4.0/).