You are currently viewing a new version of our website. To view the old version click .
Hydrology
  • Article
  • Open Access

6 November 2025

The Effect of Urbanization on the Groundwater Availability in the Masingini–Mwanyanya Catchment Forest, Unguja Island, Zanzibar (Tanzania)

,
,
,
,
and
1
School of Natural and Social Science, State University of Zanzibar, Zanzibar P. O. Box 146, Tanzania
2
Island Research and Consultancy Services, Zanzibar P. O. Box 1203, Tanzania
3
Tanzania Meteorological Authority (TMA) Zanzibar Office, Kisauni Zanzibar P. O. Box 340, Tanzania
4
Department of Civil, Environmental and Construction Engineering (DICEA), Sapienza University of Rome, Via Eudossiana 18, 00184 Rome, Italy
This article belongs to the Special Issue Impact of Climate Change on Groundwater Resources in Coastal Aquifers: Qualitative and Quantitative Assessments

Abstract

The Island of Unguja in Zanzibar (Tanzania) has experienced an accelerated urban development growth since the 1990s due to a rapidly increasing population. These rapid land demands put additional stress on the country’s ability to plan urban centers, cities, and the management of natural resources. The study aimed to determine the impact of urbanization on groundwater availability in the catchment area of the Masingini–Mwanyanya forest reserves from 1992 to 2022. The study used a detection approach to determine the Land Use Land Cover (LULC) changes for three decades, starting from 1992 to 2022. Landsat remote sensed images of 1992, 2002, 2012, and 2022 were used. Additionally, a paired t-test was conducted to determine the significant changes in mean population growth, urbanization, and humidity. The aquifer recharge evolution analysis was conducted using the QGIS software (3.34.8 released version). Obtained results revealed that for these three decades, the forest areas decreased by 14.5% (i.e., from 8.3 km2 in 1992 to 7.1 km2 in 2022), while built-up area increased from 0 km2 in 1992 to 1.7 km2 in 2022. Moreover, the evolution of undesirable Land Use Land Cover (LULC) changes, particularly the persistent conversion of forested areas into built-up zones, has been detected. This trend poses a significant threat to the sustainable management of water resources and catchment forest reserves. The study also indicated a decline in the recharge of the coastal aquifer supplying Zanzibar City, which decreased from 15.5 Mm3 to 11.1 Mm3. These findings highlight that the Masingini Forest Reserve is increasingly encroached by rapid urbanization, which is a phenomenon that may jeopardize the availability and sustainability of groundwater resources in the catchment without proper urban planning. Based on these results, the study recommends further research and upscaling of the existing findings, as well as collaboration with relevant authorities to redefine the Masingini–Mwanyanya forest catchment area to ensure the sustainable use of groundwater resources.

1. Introduction

Urbanization is a global issue which has increased the world’s population living in cities from 30% in 1950 to 60% in 2022, and is expected to reach 68% by 2050 []. These abrupt changes have a significant effect on the environment and development at local, regional, and international levels []. The population and urbanization growth of urban areas is significant in developing countries. Projection studies show that more people will be living in cities by 2050, with Asia and Africa accounting for about 90% of this growth [].
In particular, cities developing in Tanzania and Zanzibar are undergoing extensive spatial, social, economic, and environmental changes, caused by various factors such as resource accessibility, technological advancements, and population growth [,]. In addition, the influence of climate change has induced the unplanned growth of cities, as people move from rural to urban areas for resources competition, resulting in increased informal settlement diffusion and changes in agricultural land uses [,]. Deforestation, on the other hand, has led to the decline in forests and water catchment reserves. In Zanzibar, this phenomenon led to negative impacts on the island’s groundwater resources. Recent findings noted that deforestation has resulted in lower humidity levels and significant variation in humidity levels among areas with and without forest cover [,]. Urbanization processes will increase the degree or magnitude of Urban Heat Islands (UHIs), which will likely place additional stress on health and financial systems in the context of climate change. The Urban West Region of Unguja Island (Zanzibar, Tanzania) is among the rapidly growing cities in the East African region, experiencing accelerated urban development growth since early the 2000s. The area showed an increased variation in population density, increasing from 1696 p/km2 in 2002 to 3883 p/km2 in 2022, while a recent national report in 2022 showed that Dar Es Salaam (the main city on the Tanzanian coast) has a population density of 3100 /km2 []. This increase in population density and a population growth of 3.7% have led to a rapidly increasing demand for land for settlements and urbanization, which is a phenomenon that has put additional stress on the country’s ability to properly plan urban centers, manage natural forest resources, and contrast the depletion and salinization of coastal aquifers [,,].
Recent rapid assessments show that groundwater demand already surpasses the estimated sustainable yield, emphasizing the system’s vulnerability to over-pumping, contamination, and climate-driven recharge variability []. The thin soil cover, high karstic permeability, and shallow water table amplify susceptibility to pollution. Management frameworks under the “Boosting Inclusive Growth for Zanzibar (BIG-Z)” program and community-based initiatives advocate for controlled abstraction, protection of recharge zones, and rainwater-harvesting measures [].
Zanzibar has several forest catchment reserves, including Pongwe, Bumbwisudi, and Masingini among others. Most of these catchments are facing urbanization stresses, with Masingini–Mwanyanya being the most affected one as evidenced by Google Earth images for 1992 and 2022. The Masingini–Mwanyaynya forest reserve, which also hosts an important aquifer, has been severely affected by urbanization (i.e., has been highly encroached and covered by buildings) despite being demarcated as a protected area since 1958 and gazetted in 2015 [].
Despite these significant changes (largely exacerbated by population growth), there are limited interventions, including studies that critically assess the groundwater availability based on pressures of climate change and rapid urbanization.
Thus, this study aimed to estimate the impact of urbanization on the groundwater catchment area of the Masingini–Mwanyanya forest from 1992 to 2022. Specifically, the study aimed to
(i)
Determine the extent to which urbanization has affected the Masingini–Mwanyanya water catchment forest reserve;
(ii)
Analyze the relationship between urbanization (built-up area) and population growth in the Masingini–Mwanyanya water catchment forest reserve;
(iii)
Assess the reduction in infiltration and recharge of the aquifer in the forest reserve.

2. Study Area

2.1. Geographical Framework

Unguja Island is the biggest coastal island in Zanzibar (Tanzania, Africa) with an area of approximately 2461 km2, located at the Southwestern Indian Ocean (SWIO) at grid points of 39°05′ E to 39°55′ E and 4°45′ S to 6°30′ S. The main socioeconomic activities on this island are tourism, fishery, and agriculture. Tourism and agriculture contribute between 28 and 40% of Zanzibar’s GDP. The national 2022 census report shows that the population of Zanzibar Island (Unguja and Pemba) is around 1.9 million people, with a 3.7% annual growth rate [].
This rapid population increase of 1.9 million from 1.43 million in 2012, and a growth rate of 3.7% from 1.4% in 2012, is mostly due to two main factors, which include birth and immigration rates (Figure 1). The expansion of tourism, as well as industry and economic development, has also made a significant contribution to the current population and its growth rate. These factors have exacerbated the population density records of 3883 people /km2 for the Urban West Region.
Figure 1. The study area of Unguja Island in Zanzibar (Tanzania) and the Masingini–Mwanyanya forest catchment near Zanzibar City.

2.2. Geological and Hydrogeological Framework

Zanzibar Island originated through block faulting and the differential uplift of the Neogene Ruvu–Rufuji Delta, which is one of the largest Neogene deltaic deposits in East Africa. The shallow strait separating Zanzibar from the mainland (about 30 m deep) is fault-controlled and tectonic processes continue to shape the region.
The stratigraphy is composed (from the youngest to the oldest) of
  • Lower Miocene formations—conglomerates, sandstones, marls, and muds (deltaic/fluvial deposits);
  • Miocene limestones (grainstones, framestones) deposited in shallow marine reef environments;
  • Mesozoic and Paleozoic sediments (Cretaceous, Jurassic, Karoo) comparable to those on the mainland;
  • Precambrian crystalline basement [].
Both Miocene and Pleistocene sediments are cut by N–S to NNW–SSE normal faults, dipping shoreward.
The few land formation and geological studies currently available in the literature noted that Zanzibar Island is made up of rocks that range in age from Miocene to modern calcareous sediment with marine limestone that has been coated by sands, silt, and clays carried in by rivers from the East African mainland []. Sikat (2011) noted that the island was formerly a part of Tanzania’s old Ruvu–Rufiji river delta, which is East Africa’s biggest tertiary delta, and was separated from the mainland drift faulting of Tanzania’s eastern coastal districts []. The geology of the catchment is composed of Miocene M3 rocks (sandy clays, marls, and clayey sands) and is part of the old Miocene Rufiji/Ruvu delta. These rocks are from bluish-gray to bluish-green in hue, thick, coarsely sorted, chalky, and have red, yellow, or brown weathering [].
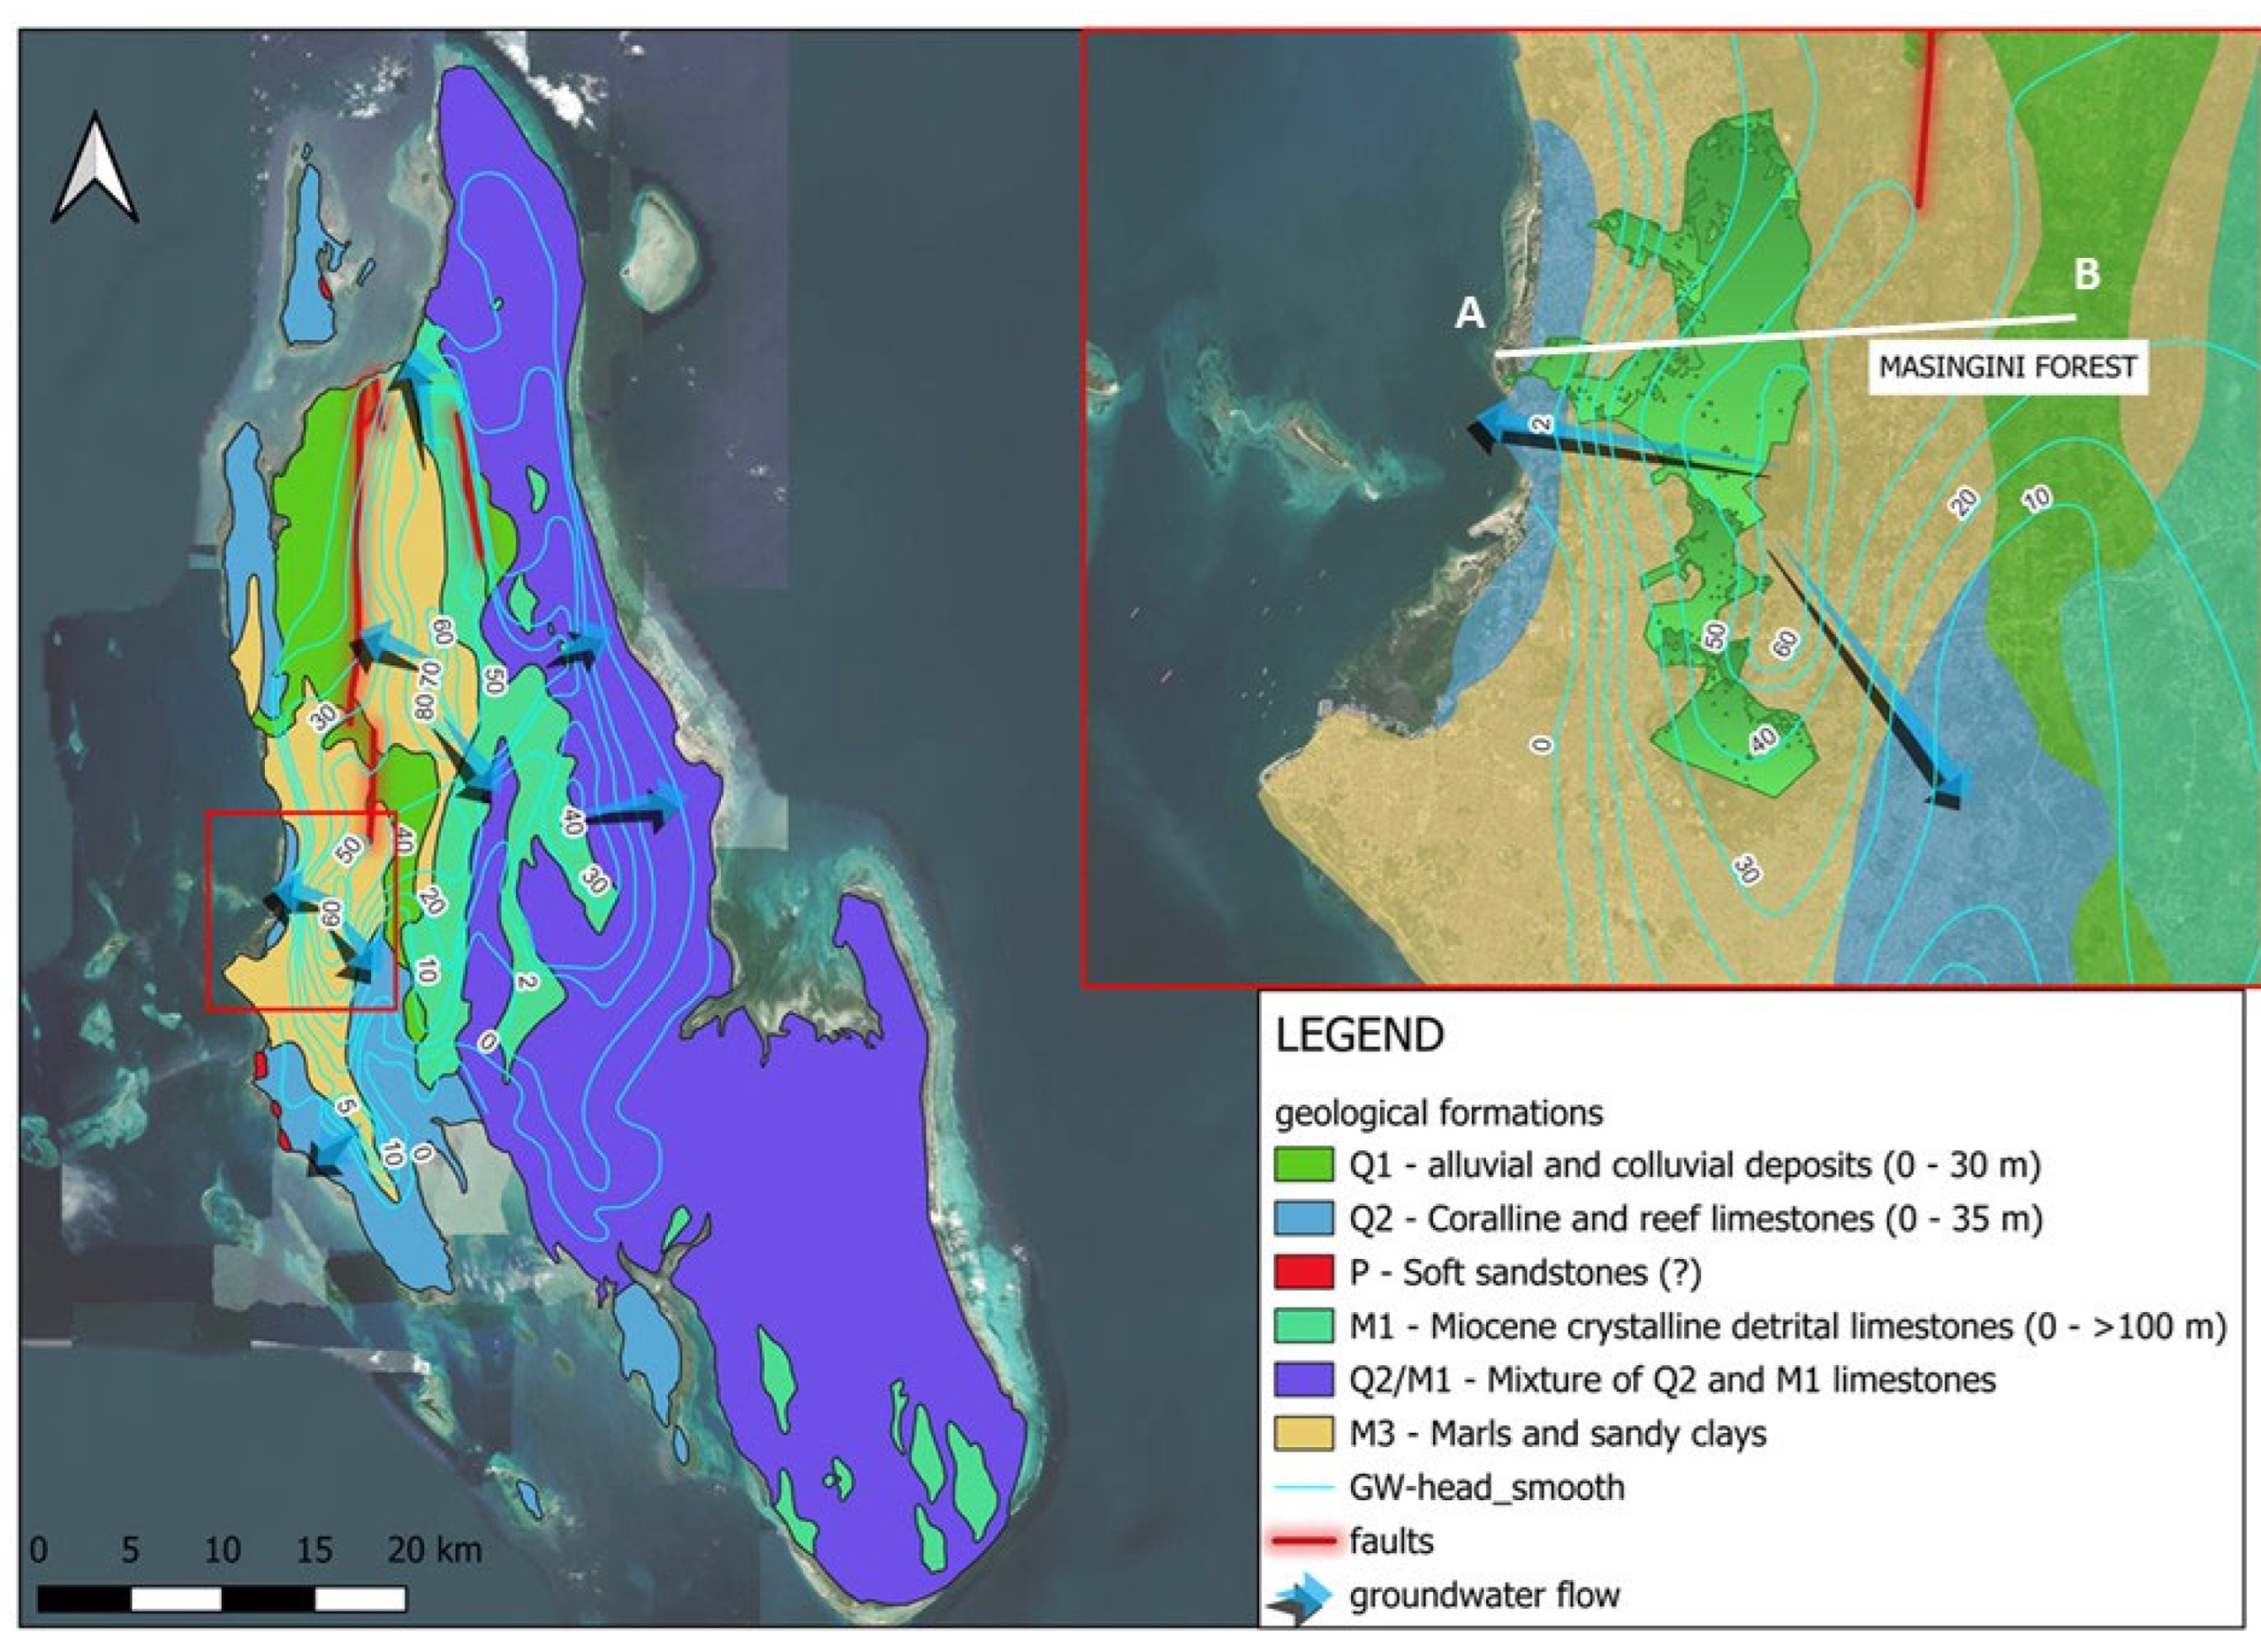
The aquifer systems of Unguja Island are principally associated with the Pleistocene reef and lagoonal limestones of the “Azania Series”, which form a highly permeable, karstified coastal aquifer complex. These limestones host the main freshwater lenses and flank margin caves such as Kuumbi Cave, developed near the freshwater–seawater interface under fluctuating sea levels []. Beneath the limestones, Miocene siliciclastic sandstones and conglomerates constitute semi-confined aquifers of lower transmissivity but greater storage potential (Figure 2). The high infiltration capacity of the karstic terrain, combined with the lack of perennial surface drainage, leads to rapid percolation and limited surface runoff. The hydrogeological framework thus reflects a dynamic coastal karst system, characterized by high permeability and rapid recharge–discharge cycles. Groundwater flow is generally radial from the island’s central upland recharge areas toward coastal discharge zones such as the Mtoni and Bububu springs and diffuses submarine seepage [,]. The Masingini ridge is one of these recharge areas, characterized by deep soil that is rich in nutrients, supporting a variety of crops which include coconuts, mangoes, home gardens, herbs, and others. The Masingini–Mwanyanya catchment forest reserve is located in the Urban West Region, which is a district with a coverage of 11.36 km2 []. Here, an important coastal aquifer is present, mainly draining groundwater from the eastern hills to the western shoreline (Figure 3).
Figure 2. Hydrogeological map of Unguja Island (Zanzibar), modified from Colbert et al. (1987) []. The cross-section AB is represented in Figure 3.
Figure 3. Hydrogeological cross-section AB (see Figure 2). Groundwater (GW) level in light blue is taken from Colbert et al. (1987) [].
Groundwater composition is predominantly Ca–Mg–HCO3 to Na–Cl type, reflecting variable mixing between meteoric recharge and marine intrusion [,]. Hydrogeochemical data indicate slightly alkaline pH (7.5–8.5), moderate to high electrical conductivity (400–2500 µS cm−1), and total dissolved solids up to 1200 mg L−1 near the coast. Seawater intrusion, particularly in the Chwaka–Jozani–Uzi corridor and the Urban West Region, is a major concern where abstraction exceeds recharge [,]. Seasonal variations in salinity and microbial contamination have also been linked to unregulated private wells and poor sanitation [].

2.3. Climatic Framework

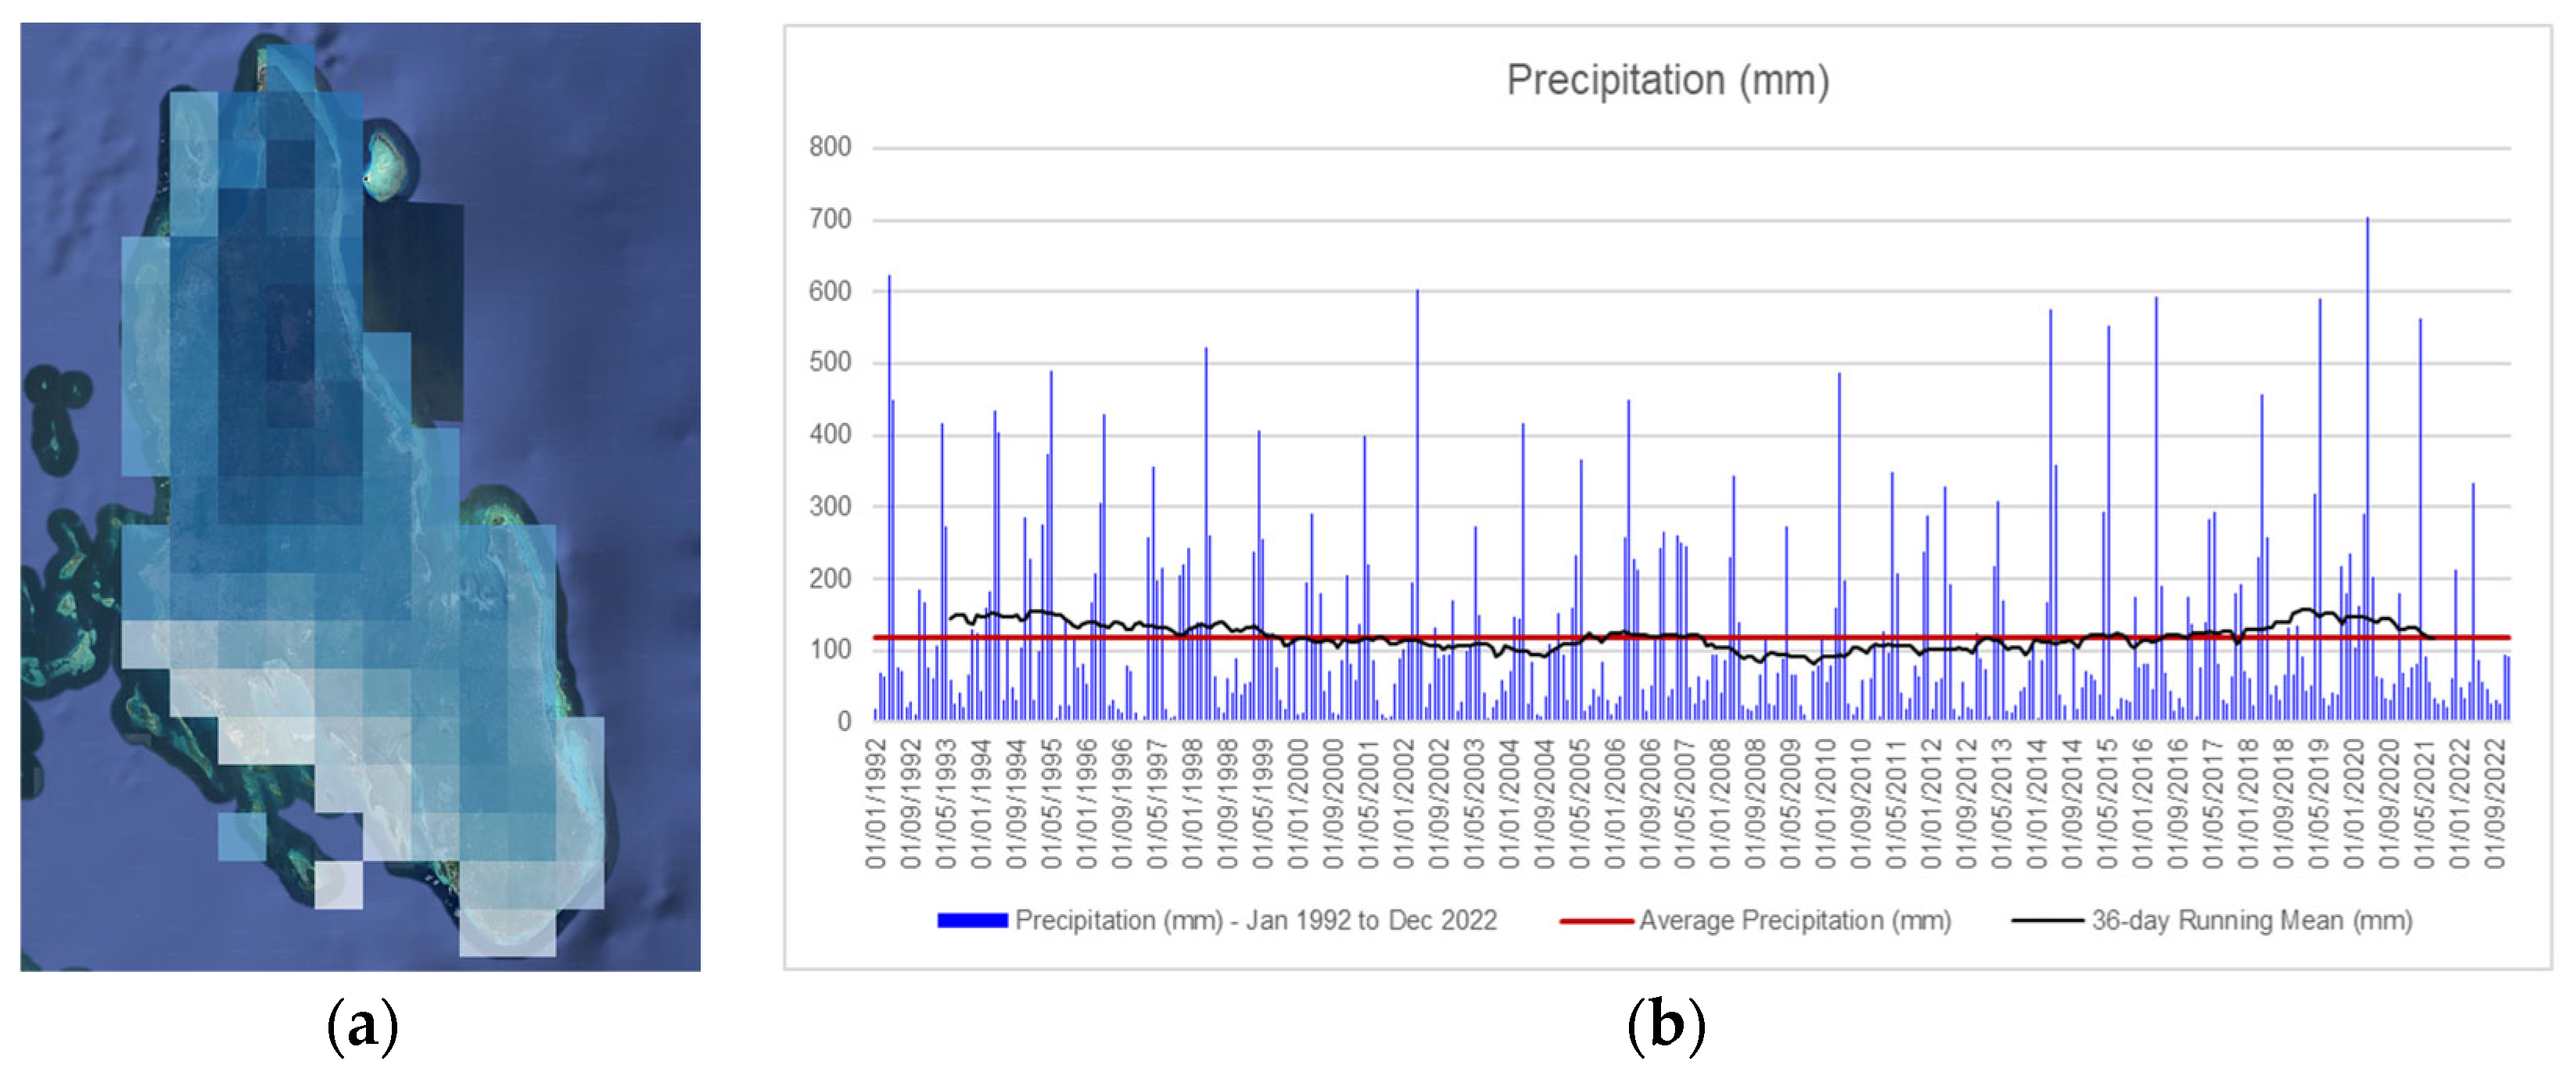
The climate of Unguja Island is tropical, with a consistent bimodal rainfall pattern driven by monsoon winds. The region experiences two main rainfall regimes: the long rainy season (Masika), which occurs from March to May and is characterized by heavy and abundant precipitation, and the short rainy season (Vuli), which spans from October to December and is associated with the northeast monsoon flow.
The “Masika” and “Vuli” seasons contribute approximately 52% and 24% of the total annual precipitation, respectively. These rainfall regimes are critical for groundwater recharge, jointly accounting for around 28% of the average annual recharge [].
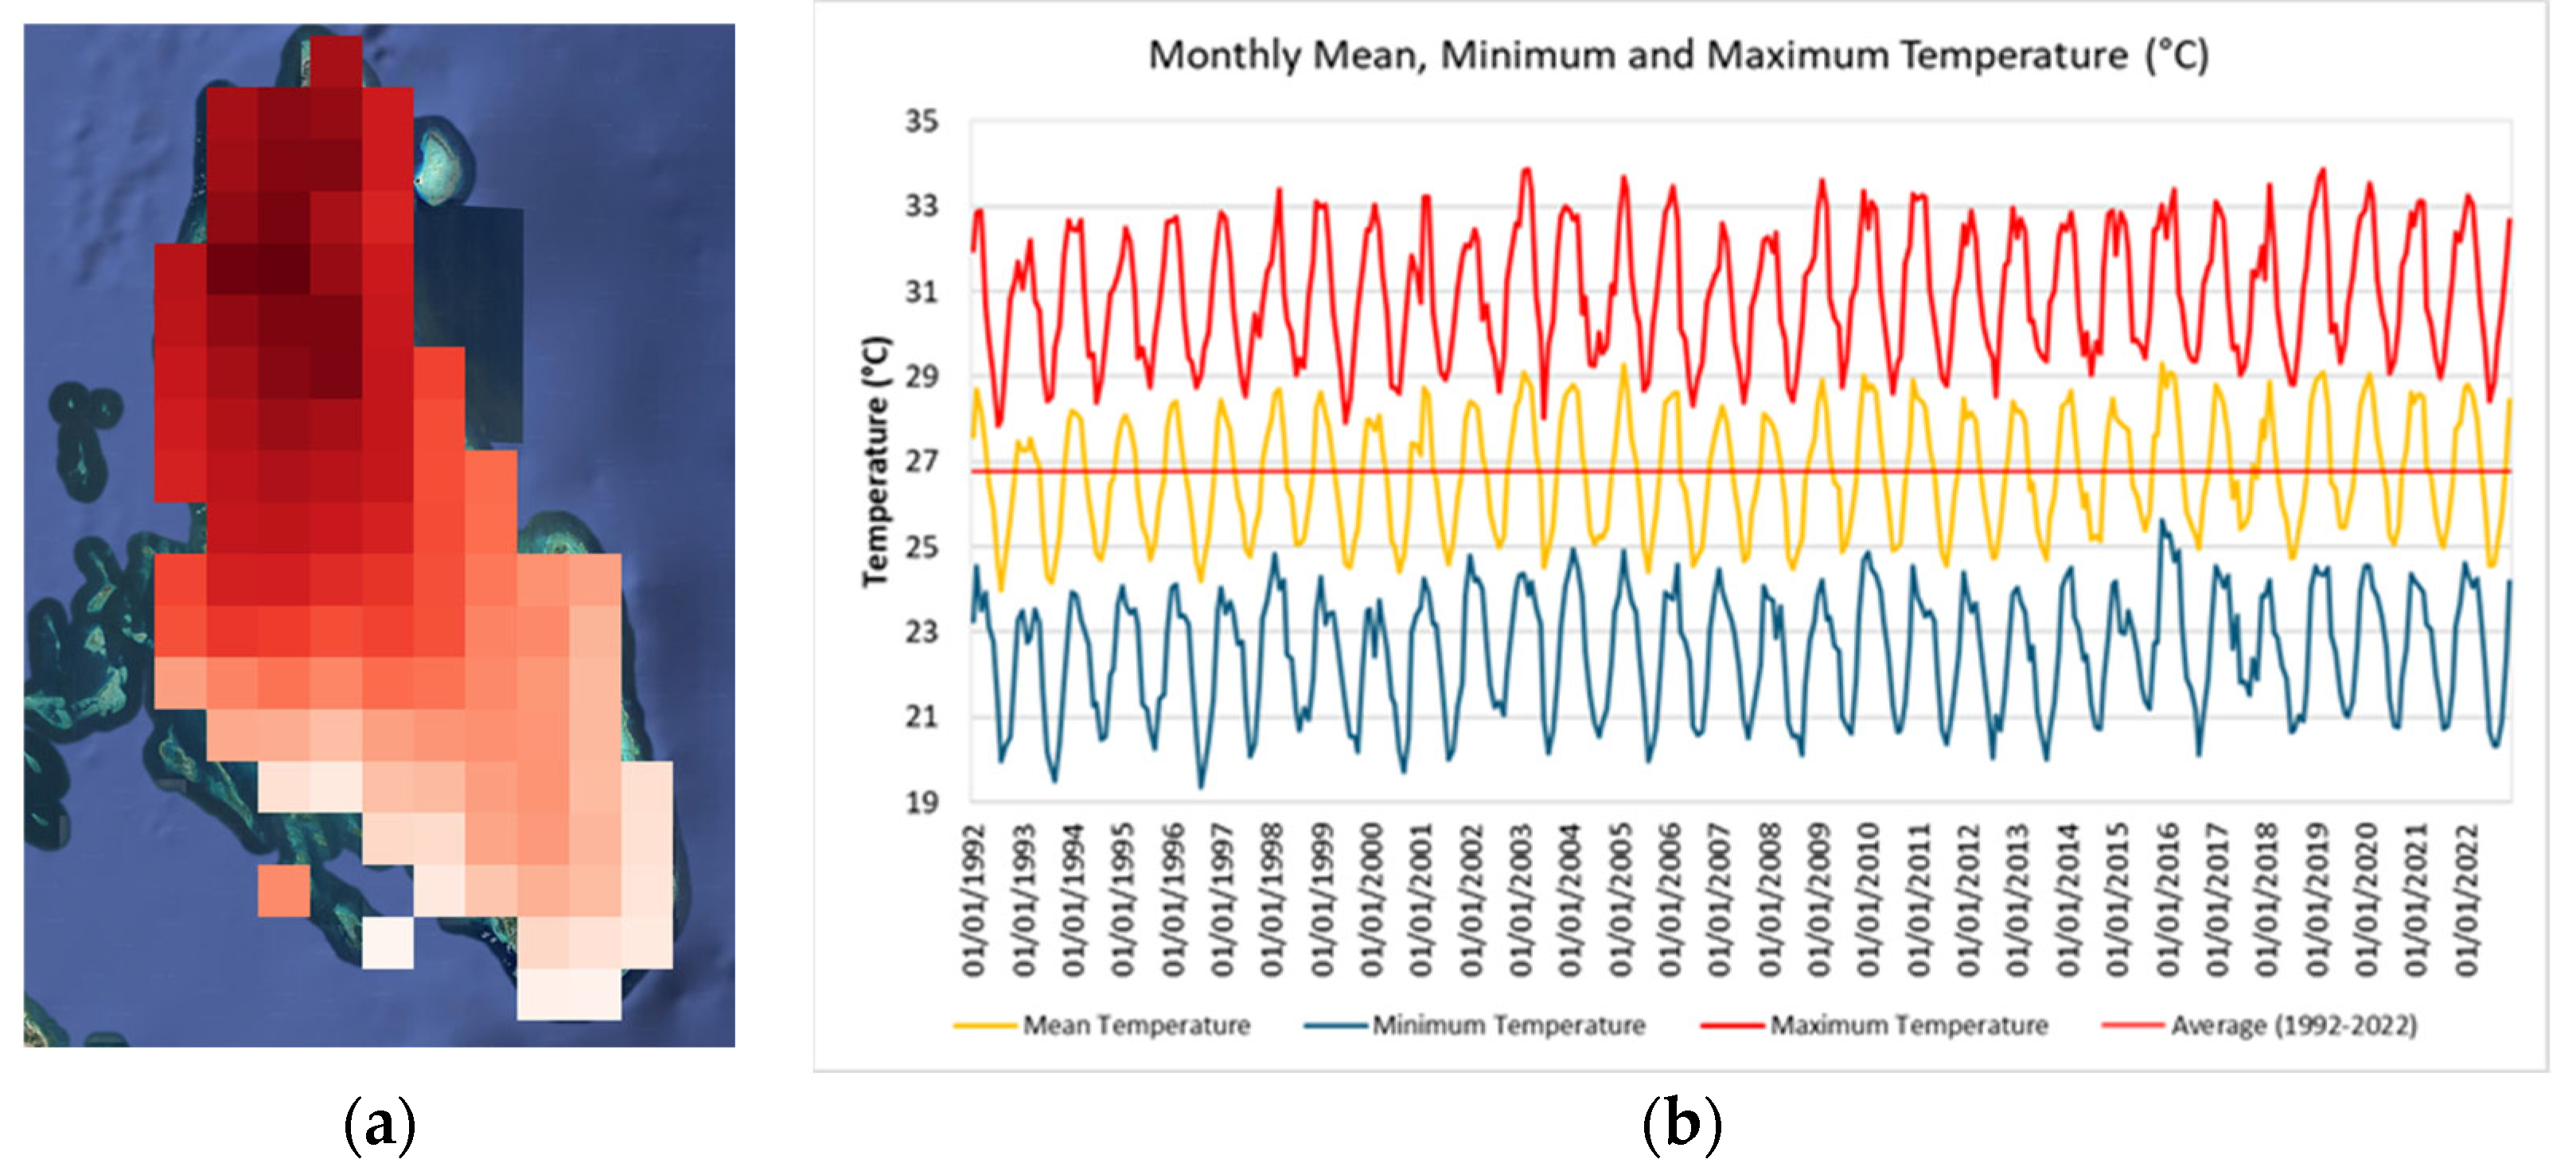
Figure 4 shows the total monthly precipitation pattern over Unguja Island and the spatial grid resolution (4 km) used in the analysis, whereas Figure 5 presents the mean monthly temperature over the same period together with the spatial resolution (4 km). Both time series are derived from the TerraClimate dataset and cover the period from January 1992 to December 2022 [].
Figure 4. (a) Spatial grid resolution and (b) total monthly precipitation pattern of Unguja Island. Data source: TerraClimate from Climate Engine tool (website: http://climateengine.org; last access: 20 October 2025) [,,].
Figure 5. (a) Spatial grid resolution and (b) mean monthly temperature pattern of Unguja Island. Data source: TerraClimate from Climate Engine tool (website: http://climateengine.org; last access: 20 October 2025) [,,].

3. Materials and Methods

3.1. Datasets

The study used different types of datasets including the National Bureau of Statistics (NBS) records, remote sensing images acquired from United States Geological Survey (USGS), and the population datasets acquired from 1992 to 2022, as well as the previously mentioned climate time series (monthly temperature and precipitation) coming from the Terraclimate satellite gridded data [].
The GIS layers (shapefiles) were acquired from the Commission of Land (COLA) in the Revolutionary Government of Zanzibar (RGoZ).
The 30 m × 30 m Landsat images were freely downloaded from USGS (https://earthexplorer.usgs.gov/; last access: 20 October 2025) [], cited in Table 1.
Table 1. Characteristics of the Landsat images used for the study.
These images were downloaded based on seasonality, cloud cover ratio, availability, location, sensor, quality, and resolution of the images. These were later acquired within the same season/year for reducing seasonal and varying sun position effects. Each Landsat was geo-referenced to the WGS_84 datum and Universal Transverse Mercator Zone 37 South coordinate system. The ground truth data was collected during the field visit using handheld GPS (22 May 2022). Ground truthing followed a stratified random sampling strategy. The total number of reference points was 90 for each classified year (1992, 2002, 2012, and 2022). Sampling strata were defined based on the mainland cover classes of forest, built-up, and bare land, so that each class was represented in proportion to its mapped area. Within each stratum, random points were generated using the sampling tool in Google Earth Engine and exported for verification.
Finally, to evaluate the accuracy of land use and land cover classification, ground truthing was used as an accuracy assessment and 250 truthing points were conducted by 168 random sampling within the study area for each year, in parallel with various field visits that were used as reference data for validation.
The data in combination with the Google Earth images were used as training signatures and the validation point in imaging the supervised maximum likelihood classification. In addition, intensive image pre-processing techniques such as geo-referencing, mosaicking, and layer-stacking were carried out for the ortho-rectification process of the acquired satellite images. Landsat images were atmospherically corrected using Google Earth Engine embedded in QGIS version 2.9 to account for variations in solar illumination, atmospheric scattering, and absorption. The shapefile (layers) acquired from COLA was used to clip the stacked satellite image under the ArcGIS 10.3 environment to obtain the exact forest catchment area for further analysis.

3.2. RAPS and IPTA Methods for Climate Data Analyses

In the recent literature, the rescaled adjusted partial sums (RAPSs) and Innovative Polygon Trend Analysis (IPTA) methods have been used to analyze time series, including environmental/climatic ones. These methods have also been applied to the climatic time series of the island of Unguja (Zanzibar), in order to obtain important information regarding the homogeneity and isotropy (or otherwise) of the datasets used for subsequent processing.
The RAPS method is designed to analyze time series (such as precipitation, runoff, temperature, river flow) to identify irregularities, discontinuities, regime shifts, or subperiods that are not evident with traditional linear trend methods [,,,].
In particular, it is helpful to
-
Divide the series into possible subperiods where the behavior changes;
-
Graphically display the cumulative trend (using the normalized partial sum) and highlight periods where the “accumulated” trend deviates from the expected line.
It is calculated as follows:
R A P S n = i = 1 n Y i Y ¯ S y
where Yi is the single specific value of the time series, Y ¯ is the average value of all members of the diagnosed time series, Sy is the standard deviation of all members of the time series, and n is the number of the time series values [].
The IPTA method was developed for the qualitative and graphical analysis of trends in hydro-meteorological time series (precipitation, runoff, etc.) with the aim of identifying
-
Subperiods (e.g., monthly, seasonal) where the trend changes (transitions);
-
The presence or absence of “natural equilibrium” in monthly/seasonal behavior, which is visualized through a “polygon” that combines two halves of the series [,,,].
IPTA is a graphical method that after splitting the series into two equivalent parts correlates them in a scatter plot, and allows for the identification of variations in normal behavior. This could help to determine trend transitions between successive sections of two equal segments of the original hydro-meteorological time series, resulting in a polygonal trend [].

3.3. Land Use/Land Cover (LULC) Classification

A modified version of the Anderson Scheme Level I [] was adopted to study the land use/cover change due its promising results and its worldwide usage in many classification studies including [,,,]. The system proposed multilevel land use/cover classification of which level I classes can be mapped from Landsat data or from high-altitude air photo/imagery. Through visual inspection of the clip images, using different band combinations, six separable land use/cover types have been identified in this study as water bodies, wetland/lowlands, built-up, cultivated land, vegetation, and bare soil/landfill. To avoid the uncertainty of inter-annual variability, only imagery acquired during the wet period was used to mitigate seasonal effects, which frequently lead to errors in change detection. As for image classification, the study used supervised approaches to define the four classes of forest, cropland, urban, and bare land. In the Masingini forest catchment, only three of these are present: forest, urban, and bare land. Through reference data and ancillary information, a consistent number of training samples/classes was chosen. It should be noted that since the forest was a reserved one, the shrubs were categorized as part of the catchment forest covers. The supervised Maximum Likelihood Classification (MLC) algorithm was then applied to each image, which is more appropriate when each class defined has a normal distribution [,]. Also, the K (kappa) coefficients and the confusion matrix were used to determine the classification accuracy of both the user and the producer [,]. For each Landsat image, the land cover class assigned to 90 pixels (total area was 11.3 km2) was selected using a stratified random sampling. The overall accuracy values of each classified image were then reported.
Accuracy assessment examines the relationships between outcomes and actual values, offering qualitative insights derived from satellite data. To assess the accuracy of supervised image classification, an error matrix based on the reference data was employed to compare user and producer accuracy. For this calculation, the 90 sample locations was sourced from Google Earth for ground truthing and juxtaposed with the LULC map for validation. Overall accuracy (OA) represents the proportion of matched locations relative to the total number of sites acquired through the methodology outlined below:
O v e r a l l   a c c u r a c y = T o t a l   n u m b e r   o f   c o r r e c t l y   c l a s s i f i e d   p i x e l s   ( d i a g o n a l ) T o t a l   n u m b e r   o f   r e f e r e n c e   p i x e l s × 100
The accuracy for each specific land use class is also determined in a similar way. There are two methodologies: one is the user’s accuracy, and the other is the producer’s accuracy. These two forms of accuracy can be computed using the two formulas outlined below. The user’s accuracy is derived by dividing the number of matched sites within a particular land use category by the total number of sites in that same category [] and then multiplying the result by 100. The commission error measures associated with the user’s accuracy reflect the likelihood that a site classified within a category is indeed present in that category []. In contrast, the producer’s accuracy is calculated by dividing the number of matched sites by the total number of sites derived from the reference data and then multiplying by one hundred. This metric assesses the effectiveness of the categorization of an area. By using the following formulas, we obtained producer’s accuracy and user’s accuracy:
U s e r s   A c c u r a c y = N u m b e r   o f   c o r r e c t l y   c l a s s i f i e d   p i x e l s   i n   e a c h   c a t e g o r y T o t a l   n u m b e r   o f   c l a s s i f i e d   p i x e l s   ( t h e   r a w   t o t a l ) × 100
P r o d u c e r   A c c u r a c y = N u m b e r   o f   c o r r e c t l y   c l a s s i f i e d   p i x e l s   i n   e a c h   c a t e g o r y T o t a l   n u m b e r   o f   r e f e r e n c e   p i x e l s   ( c o l u m n   t o t a l ) × 100
In this research, the kappa coefficient is also calculated for the land use maps across all four to determine their accuracy. Kappa can yield negative values, though this is rare; generally, the maximum value cannot surpass one, and the minimum cannot fall below zero. Kappa is a more advanced measure than overall accuracy, providing greater interclass discrimination in the results []. The Kappa value is expressed as a percentage (%) and is calculated using the following formula:
K   =   N   i = 1 r x i i   i = 1   r x i + ×   x + i N 2 i = 1   r x i + ×   x + i
where N is the total number of sites in the matrix, r is the number of rows in the matrix, xii is the number in row i and column i, x+i is the total for row i, and xi+ is the total for the column.
The accuracy of classified LULC maps was evaluated by comparing land use classes to satellite image ground truth data.
Ground truthing data were collected using a GEMINI GPS with a meter accuracy, following a stratified random sampling strategy. The total number of reference points was 90 for each classified year (1992, 2002, 2012, and 2022). The same ground truth data were used to validate LULC maps generated with Landsat imagery. Sampling strata were defined based on the mainland cover classes of forest, built-up, and bare land, so that each class was represented in proportion to its mapped area. Within each stratum, random points were generated using the sampling tool in Google Earth Engine and exported for verification. Finally, to evaluate the accuracy of the land use and land cover classification, ground truthing was used as an accuracy assessment: 250 truthing points were conducted by 168 random samplings within the study area for each year, in parallel with various field visits that were used as reference data for validation. Then, results were visualized through thematic maps, and spatial statistics were used to provide a comprehensive understanding of the dynamics of land use and land cover in the study area.
Table 2 displays the accuracy percentages for producers, user accuracy, and kappa coefficient, as well as overall accuracy.
Table 2. Metrics and accuracy of LULC data processing.
Multiple land use classification trials were performed to optimize accuracy using Anderson’s classification system. A minimum accuracy of 85% is concluded sufficient for land use classification. A confusion matrix of the classified images was applied to evaluate the accuracy of both the user and the producer [,].
Finally, four different land cover maps were developed. The maps from 1992, 2002, 2012, and 2022 were originally in raster format (30 m pixel resolution) and were converted to shapefile (*.shp) vector format. This format is better suited for the successive change detection procedures. The processed Landsat images were then used in change detection analysis, for monitoring the differences in land cover at different times. The changes in LULC have been analyzed under four major periods of 1992–2002, 2002–2012, 2012–2022, and 1992–2022, respectively. There are numerous change detection methods available, each with its own set of variations depending on the image type, final intent for the change image, and type of change to be detected []. The “post classification comparison” methodology was used in the case study described here [,,,]. This method determines the difference between independently classified images from each of the dates in question, and it is the only method that calculates “from” and “to” classes for each changed pixel. This method has the advantage of allowing the creation and updating of GIS databases because classes/categories are specified and quantitative values for each class can be determined.

3.4. Population Data

The regional-level demographic data for Urban West Region in Zanzibar is based on the Tanzania National Census for the period of 1992, 2002, 2012, and 2022. This has been analyzed and underwent an interpolation process for the missing years from 1992 to 2022, ready for the analysis of the Mann–Kendall (MK) trend test (known as non-parametric statistical method) for capturing data trends over time []. The test observes whether a random response variable monotonically rises or falls with []. The standardized Mann–Kendal test is given by Equation (3) and the magnitude of change was quantified using Sen’s slope estimator:
k = 1 n 1   j = k + 1 n s i g n ( x j   x k )
  • where sign(xjxk) = 1 if xjxk > 0
  • = 0 if xjxk = 0
  • = −1 if xjxk = 0 source: (taken from Abdalla et al., 2023) []

3.5. Hydrogeological Water Balance Method

The Hydrogeological Water Balance Method (HWBM) was used to perform a rapid assessment of runoff and infiltration rates. It is often used to provide an overview of the aquifer recharge evolution in time, due to climate change and human impacts []. The datasets used in this analysis were (i) the digital elevation model—DEM for analyzing the topographic features, (ii) land use and land cover (LULC) maps, (iii) geological and hydrogeological characteristics (geological map), and (iv) climate data (precipitation and temperature).
The study area was discretized using a regular square grid, where the size of each cell was defined according to the scale of the study and the desired resolution. Each grid cell was referred to as a finite square element (FSE) and was assigned the necessary parameters to evaluate the water balance (e.g., precipitation, temperature, geology, land cover). Using geographic information system (GIS) techniques, the method was implemented spatially. Input data values were extracted at the centroid of each FSE and assigned to the respective cell. Precipitation and temperature datasets were processed as average annual rainfall module (AARM) and average inter-annual temperature (AIT), which were computed over the available historical series (i.e., 30 years).
The actual evapotranspiration (ETR, in mm/year) was estimated for each cell using the Turc empirical formula presented in Equation (4):
E T R = A A R M 0.9 + A A R M 2 L 2
where
L = 300 + 25 ( A I T ) + 0.05 ( A I T ) 3
To compute the effective infiltration rate for each cell, a potential infiltration coefficient (χ) was introduced. This coefficient was chosen based on both lithological and land cover characteristics and will be discussed later.
Infiltration (I, in mm) for each i-th FSE was calculated as follows:
I = A A R M i E T R i χ i = Q i   χ i
where Q is the net precipitation, i.e., the portion of rainfall available for infiltration.
The surface runoff (R, in mm) was then estimated using the classic hydrological balance equation:
P = E T + R + I
rearranged as follows:
R = P E T I = Q I
In this study, the following datasets were processed in QGIS:
  • Geological map of the study area, geo-referenced from Colbert et al. (1987) [];
  • LULC maps for the years 1992, 2002, 2012, and 2022;
  • Average annual temperature (AIT) for the period 1992–2022;
  • Average total precipitation (AARM) for the same period.
The Turc equation was applied to estimate annual evapotranspiration for each FSE. To evaluate infiltration, two coefficients were considered at the same time, one for geology and one for LULC. Table 3 and Table 4 show the proposed values of infiltration coefficients used for the evaluation.
Table 3. Values of the potential infiltration coefficient assigned, based on the outcropping geology.
Table 4. Potential infiltration coefficient values assigned, based on land cover.
The effective infiltration (Iₑ) for each FSE was then computed using
I i = P i E T R i χ G i   χ L C i = Q i   χ G i   χ L C i
By multiplying the infiltration rate (mm/year) by the area of each cell, the infiltration volume (m3/year) was derived for each element. Summing up these values across all FSEs allowed the estimation of the total groundwater recharge for each considered year (usually expressed in 1 × 10⁶ m3 (Mm3)).
A similar approach was used to estimate the runoff volume, based on the runoff depth (mm/year). This procedure was repeated for each of the four target years (1992, 2002, 2012, and 2022) using updated LULC data for each year and constant climatic input values (AARM and AIT) calculated over the entire 1992–2022 period.

4. Results and Discussion

4.1. Climate Analyses

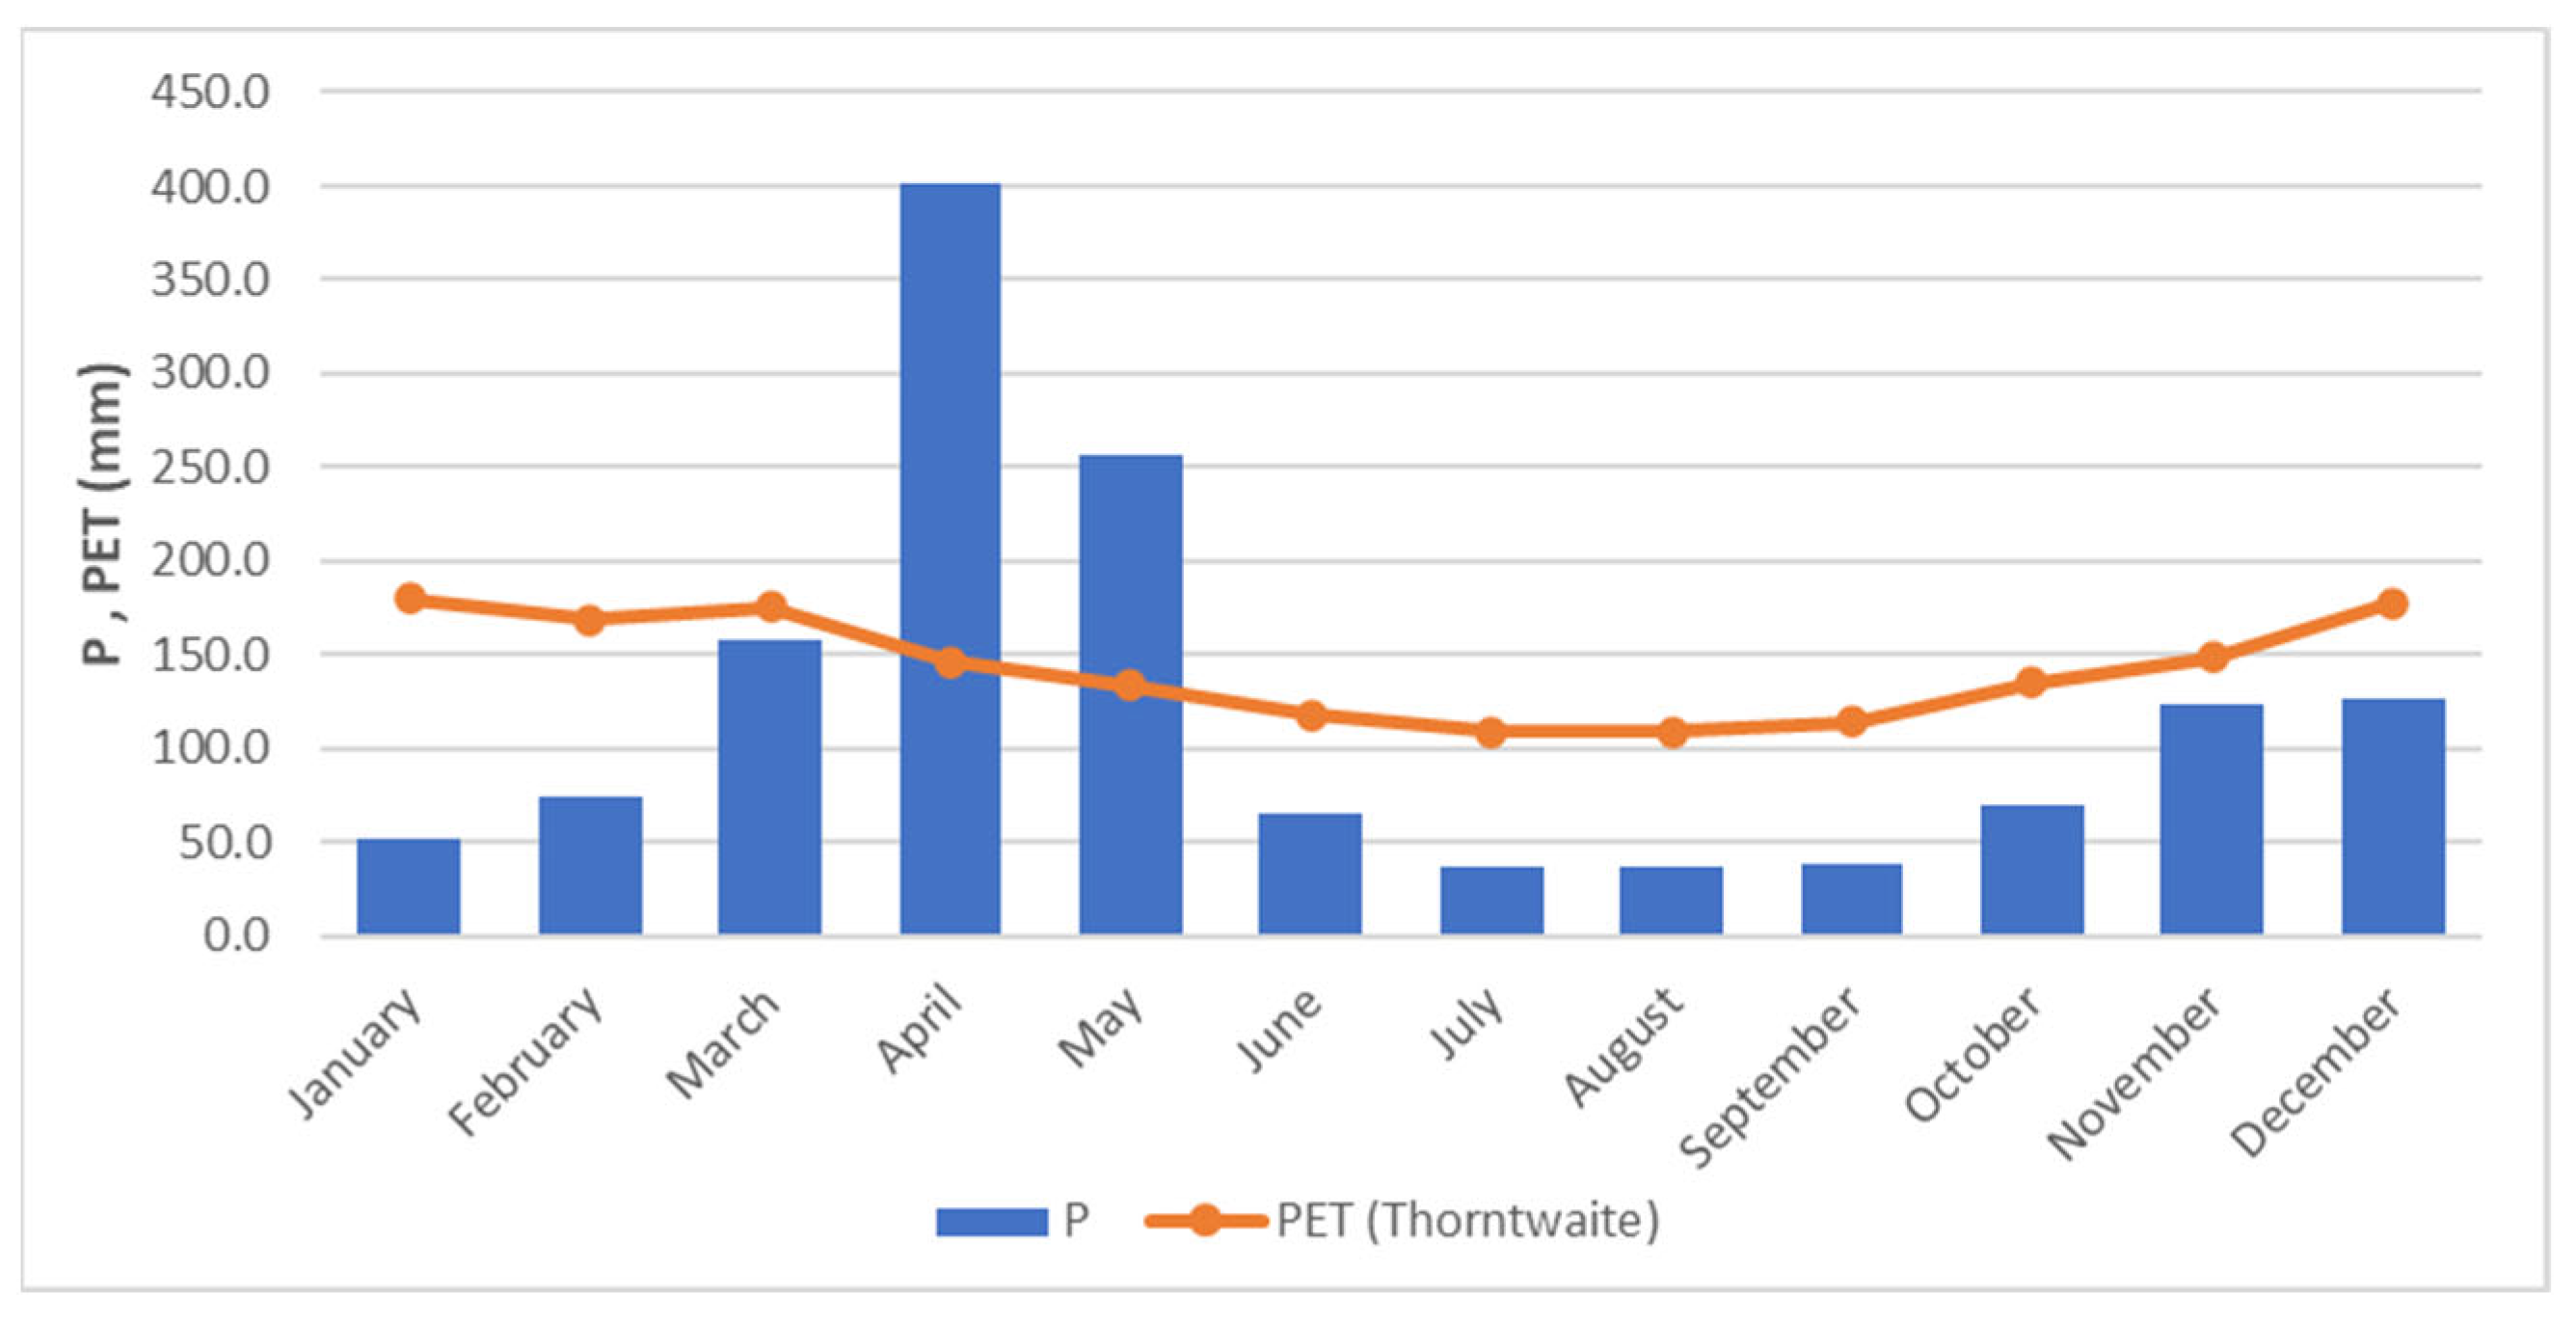
The elaborations on the available time series (1992–2022) confirm the clear bimodal rainfall pattern, with peaks typically occurring in April–May. The groundwater recharge mainly occurred in these two months, when average precipitation values are higher than monthly evapotranspiration, calculated using the Thorntwaite Formula (Figure 6).
Figure 6. Average monthly precipitation (P) and potential evapotranspiration (PET) related to the time series of 1992–2022.
From June through October, as well as in January and February, the island experienced a dry season, while average annual temperature remained relatively constant at around 26–27 °C, as already seen in Figure 4b and confirmed by previous studies [].
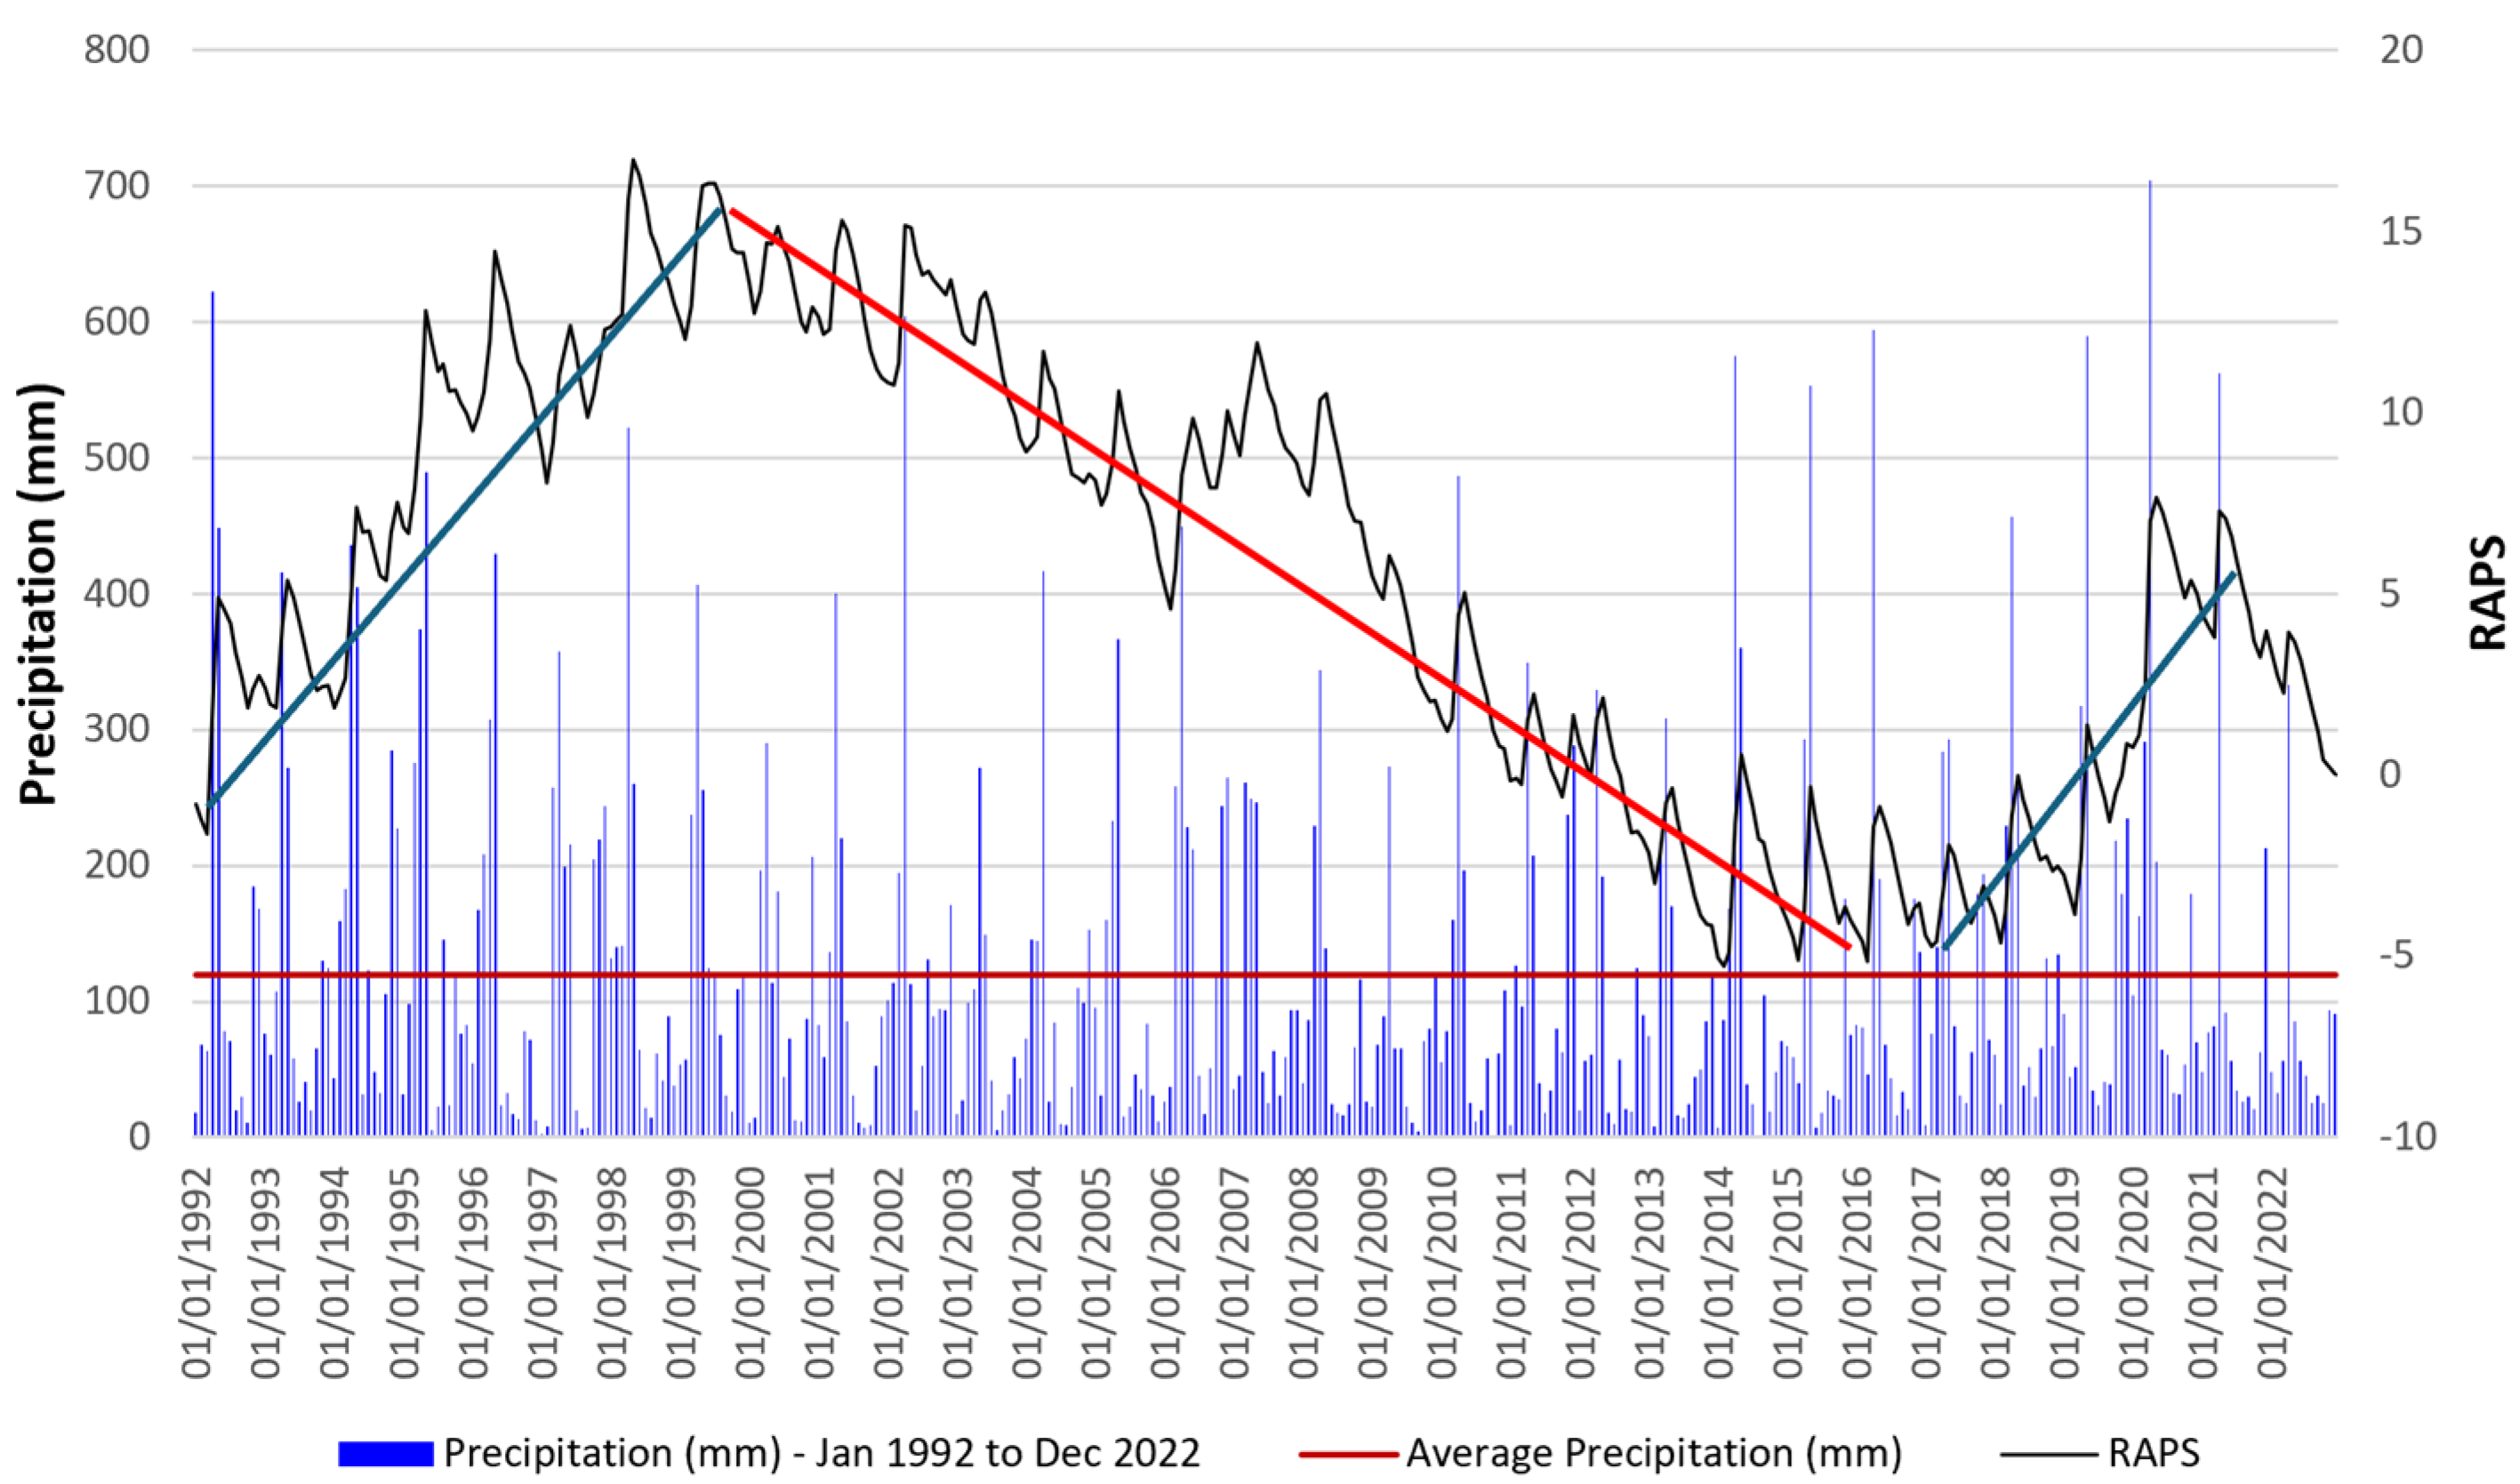
Results coming from the application of RAPS methodology on monthly precipitation and temperature data show that subseries are present in the overall time series.
In the precipitation data, three distinct periods are evident from Figure 7:
Figure 7. Average monthly precipitation (P) and rescaled adjusted partial sums (RAPSs) related to the time series of 1992–2022.
A first rising trend from 1992 to 1999;
A second decreasing trend from 1999 to 2016;
A third increasing trend from 2016 to 2022.
Regarding temperatures, there are two evident subseries: a decreasing trend from 1992 to 2002 and an increasing one from 2014 to 2022. In the middle of these two, from 2002 to 2014, there are two short increasing (2002–2005; 2008–2011) and decreasing trends (2005–2008; 2011–2014) which, however, do not have an overall impact on the variability of the parameter (Figure 8).
Figure 8. Average monthly temperature (T) and rescaled adjusted partial sums (RAPSs) related to the time series of 1992–2022.
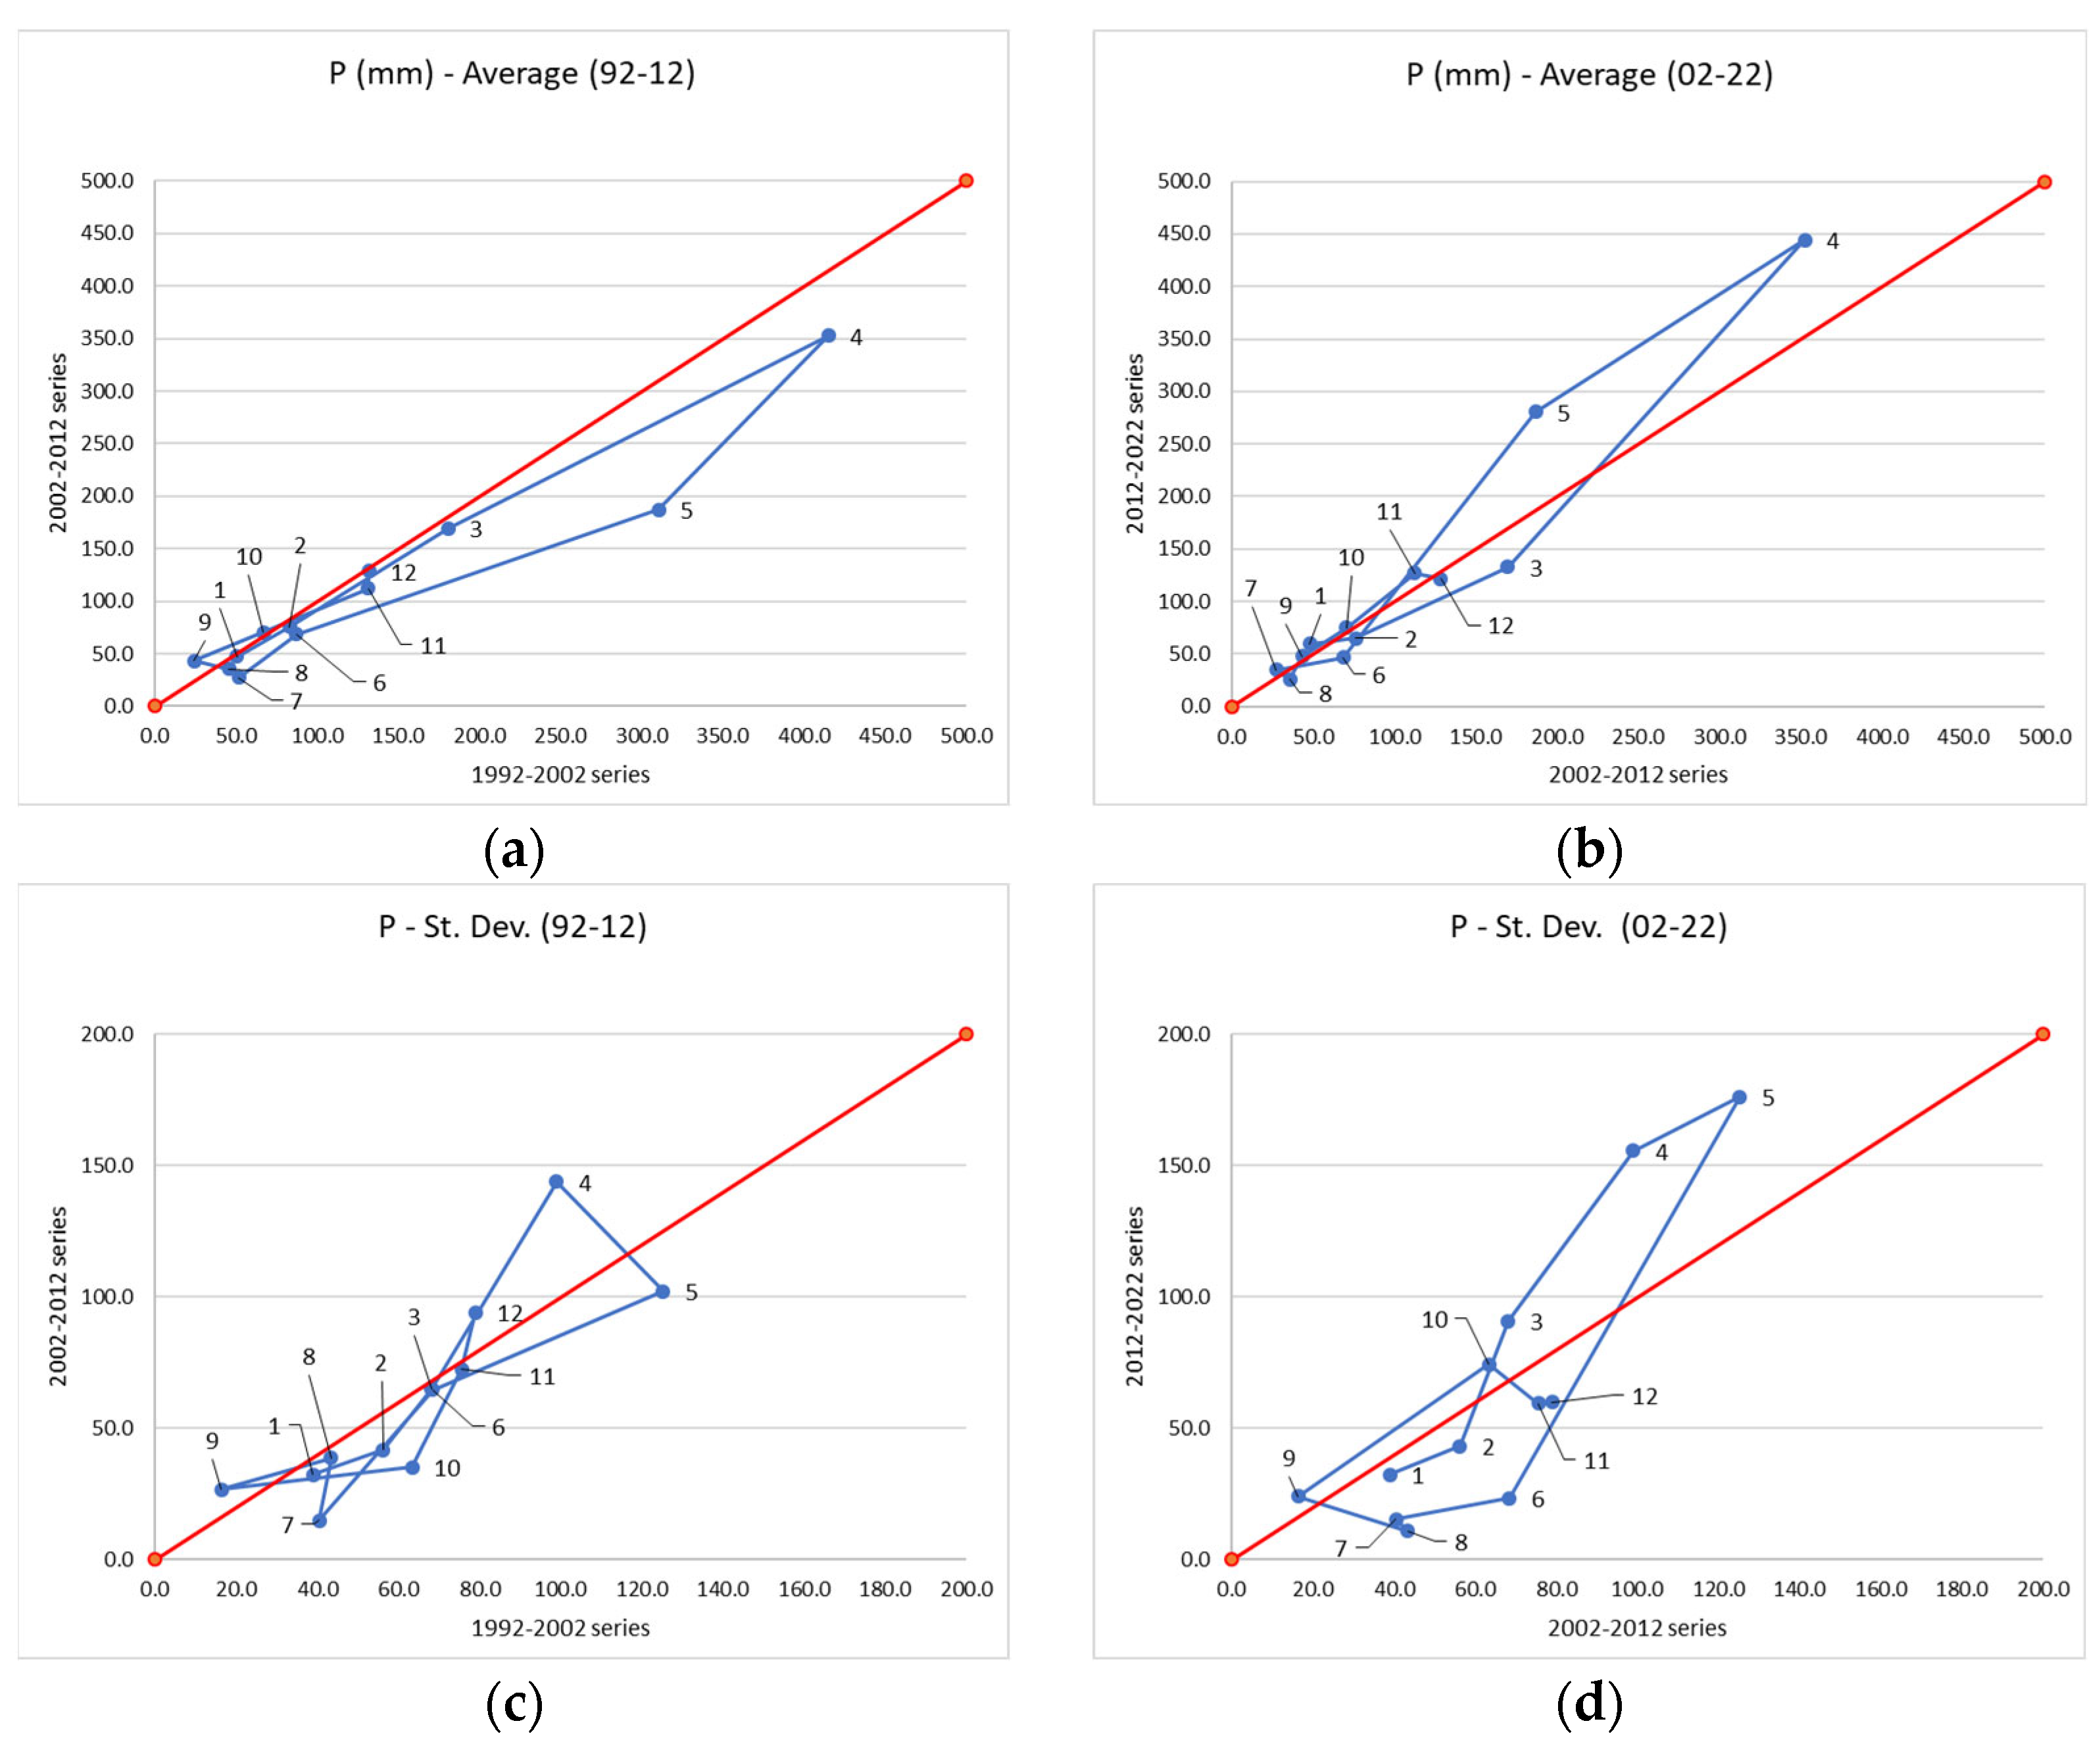
Results coming from the application of the IPTA method sharply confirm these trends for precipitation data. The method has been applied considering three consecutive ten-year time series (1992–2002, 2002–2012, and 2012–2022) and comparing the monthly values of average and the standard deviation (Figure 9).
Figure 9. Results of IPTA method applied to the average (a) and standard deviation (c) of monthly precipitation for the period of 1992–2012, and to the average (b) and standard deviation (d) of monthly precipitation value for the period of 2002–2022.
Figure 8 presents the results related to the precipitation time series. It can be observed that the two decreasing and increasing subperiods are confirmed by the comparison between the first and second decades and between the second and the third one, respectively. However, the IPTA method is able to specify in which months the trend mainly occurred. In particular, the two months of the Masika rainy season (April and May) presented a decreasing trend in the average monthly precipitation in the first comparison (Figure 9a), but a reversed increasing trend (of the same magnitude) occurred for the same months for the time series from 2002–2012 to 2012–2022 (Figure 9b). No significant changes are evident for the rest of the months.
Regarding the standard deviation, considering the first comparison, a remarkable shift from the 1:1 line is visible again for April and May (increasing and decreasing trend, respectively), but also for other months such as July and October (Figure 9c). The increase in variability is evident also in the second comparison (2012–2022) for March, April, and May (Masika season), whereas the rest of the months shows a significant decrease in standard deviation (Figure 9d).
The application of the IPTA method for temperature values led to obtaining non-significant results, with trends in the monthly values of both mean and standard deviation that were almost linear (no polygon).

4.2. LULC Changes in Masingini–Mwanyanya Forest

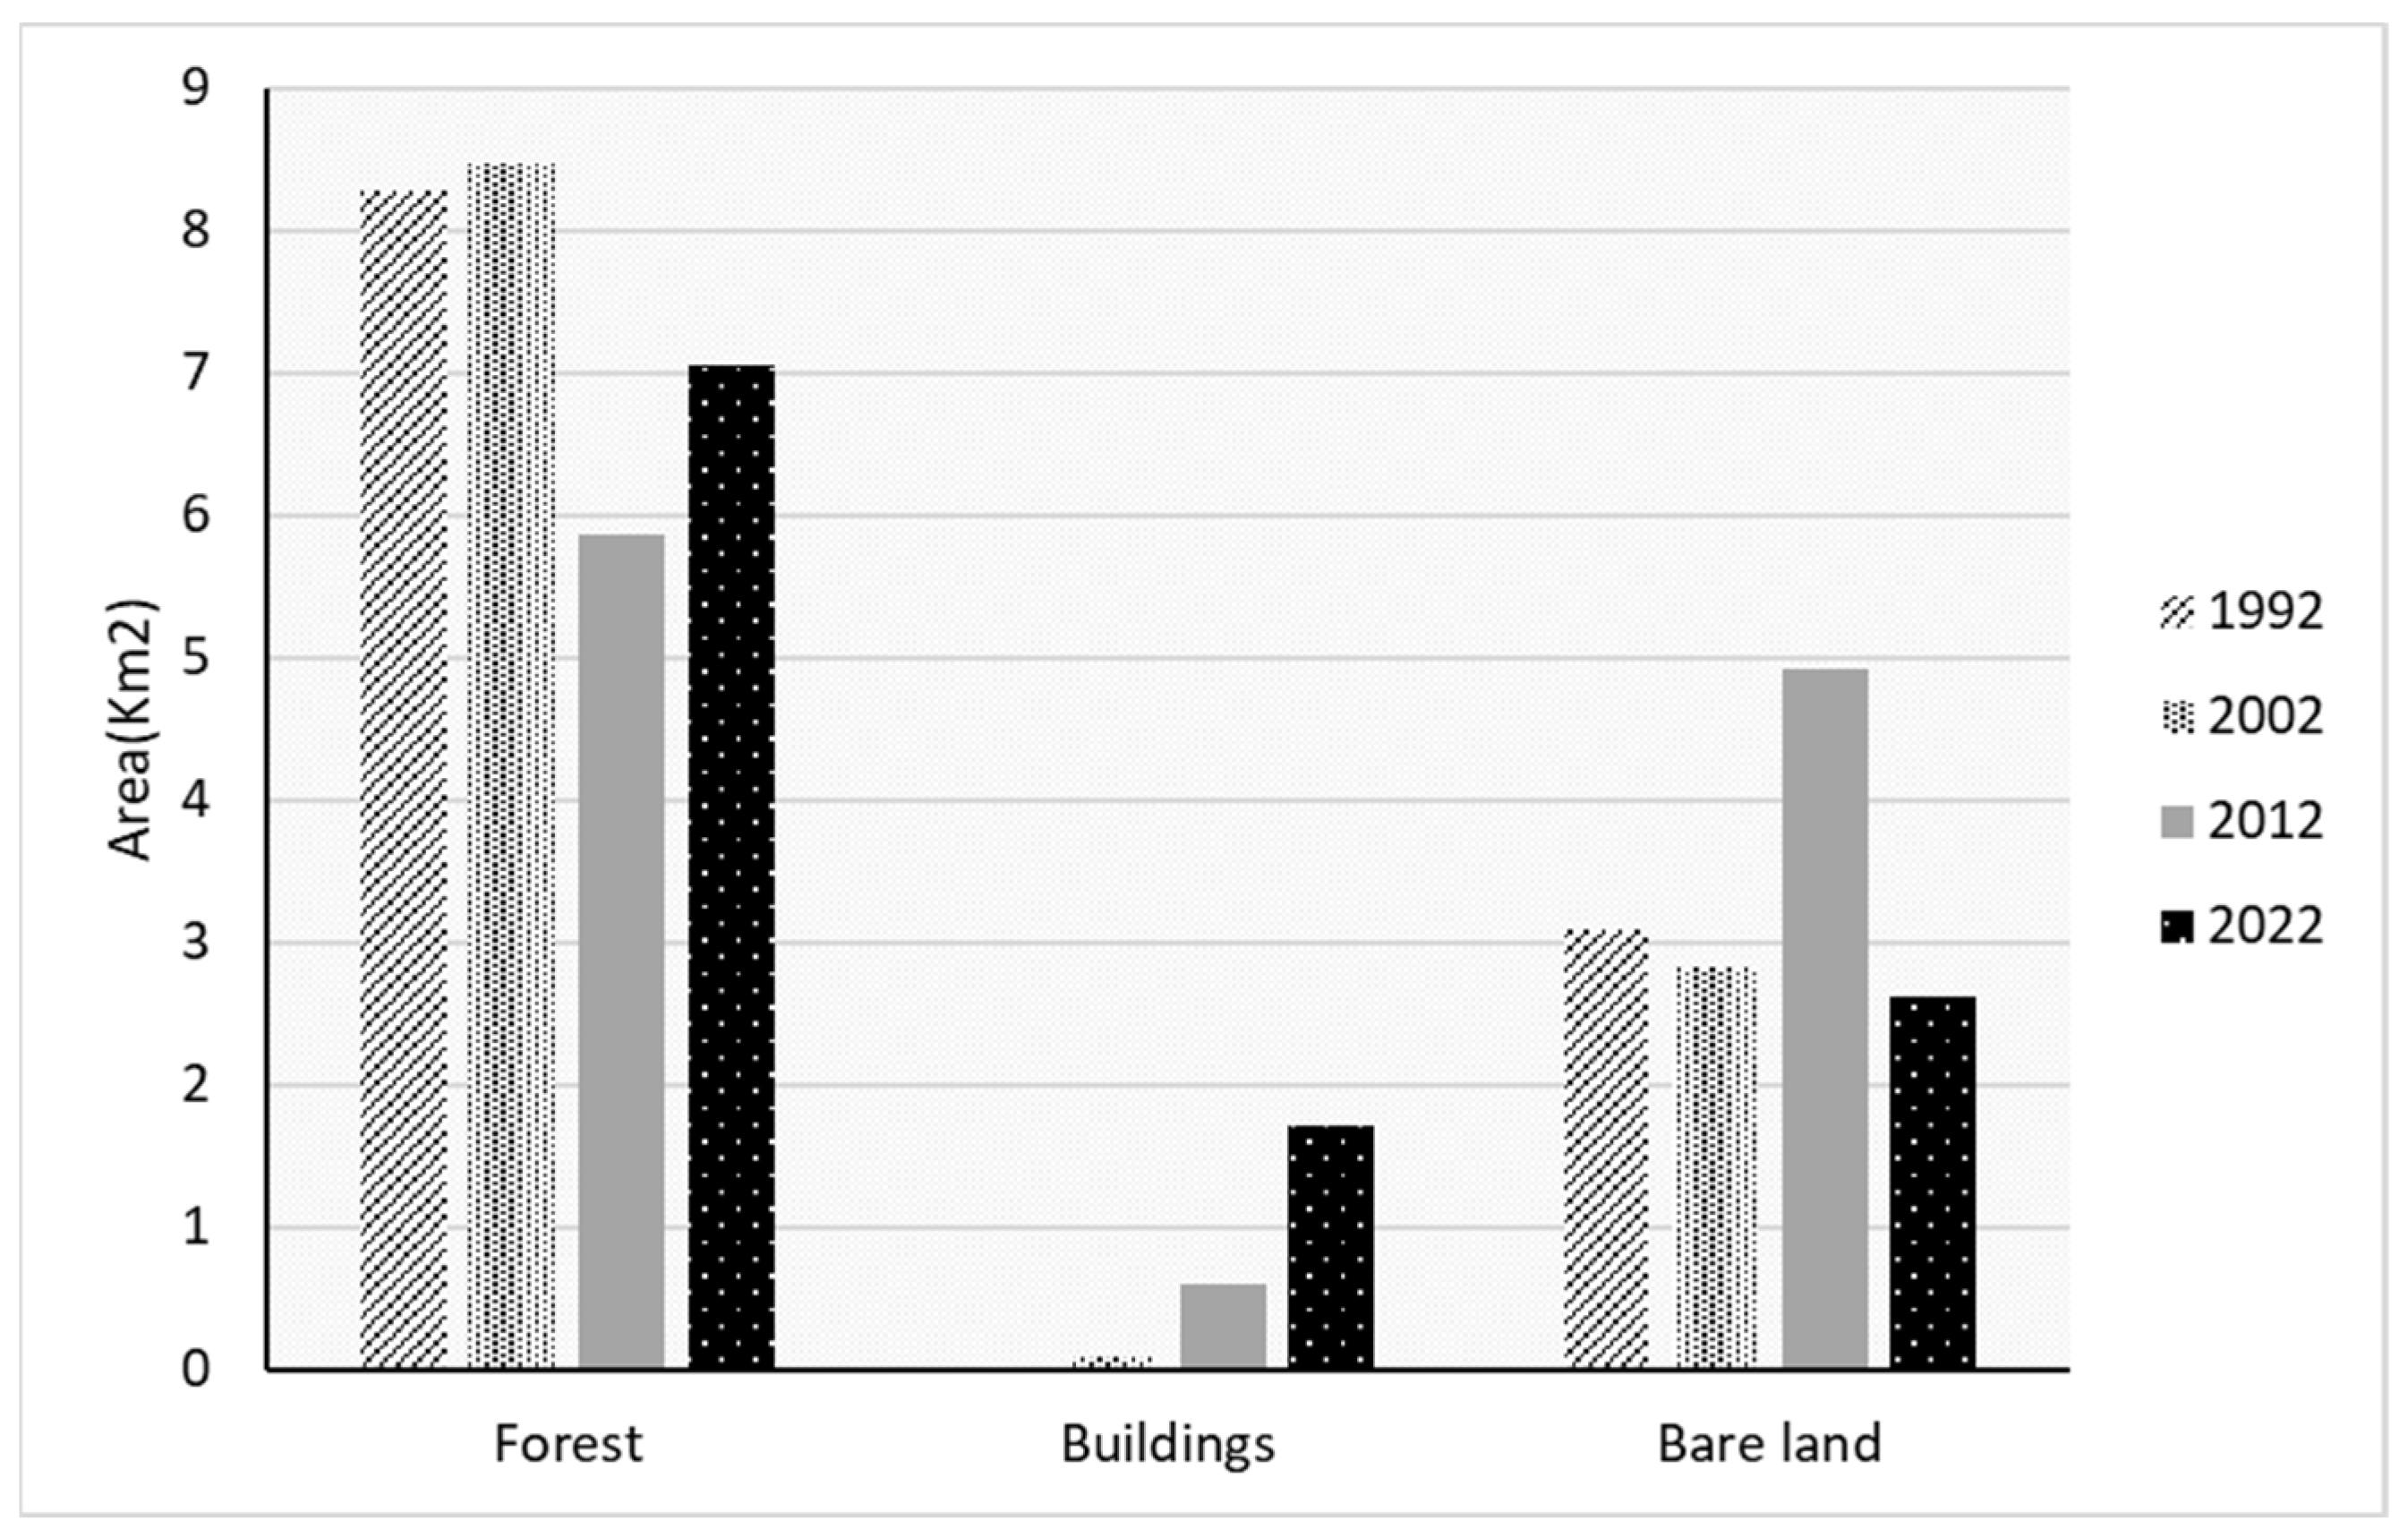
The results coming from LULC classification and time evolution analyses show that during the entire study period (1992–2022), forestland and bare land were the predominant classes. In 1992, forest, buildings, and bare land covered 72.7%, 0.03%, 27.19% of the forest reserve, respectively. Unfortunately, the areas under forest cover and bare land drastically decreased from 72.7% (8.27 km2) and 27.19% (3.09 km2) in 1992 to 62.08% (7.05 km2) and 22.95% (2.61 km2) in 2022 (Table 5), respectively.
Table 5. LULC change trend in the Masingini Forest from 1992 to 2022.
Figure 10 depicts the actual areas (in km2) of different land use and land cover types in 1992, 2002, 2012, and 2022.
Figure 10. Time evolution of land use classes in the Masingini forest areas (in km2).
There has been a significant change in land use/cover in the catchment forest reserve, with building land class covering 0 km2 in 1992, 0.08 km2 in 2002, 0.59 km2 in 2012, and 1.70 km2 in 2022 (Table 5). It is only the land cover class that has shown a constant extensive increase compared to bare land and forest cover.
This could be attributed to the population growth reported by the national census conducted, where the 593 678 people present in west region increased to 893 169 (+50.4%) in the 2022 census report [].
The analyses revealed that there were major changes among the three LULC classes. The results showed that for the 30-year period (1992 to 2022), forestland and bare land decreased by 10.7% from 8.3 km2 to 7.5 km2 and 4.2% from 3 km2 to 2.6 km2, respectively, while built-up land increased by 14.9% from 0.003 km2 in 1992 to 1.7 km2 in 2022, as shown in Table 6. In the 2002–2012 period, a rapid growth was noted in the total area covered by built-up class and bare land as shown in Table 5. This exponential rise was at the cost of forest areas as the area covered by forest reduced by −22.9% with an annual rate of change of 3.63%. These changes were attributed to a spiked increase in population as recorded by the 2012 census [].
Table 6. Annual rate of LULC change in the Masingini Forest.

4.3. LULC Changes in Urban West Area

The same analyses have been conducted on the overall Urban West Area, where Zanzibar City urban areas have progressively expanded in time, encroaching forest and rural inland areas (Table 7). This phenomenon has been more intense in the last two decades, with an annual rate of change related to urban areas equal to 4.5% (2002–2012) and 6.35% (2012–2022) (Table 8).
Table 7. LULC change trend in the Urban West Area from 1992 to 2022.
Table 8. Annual rate of LULC change in the Urban West Area.
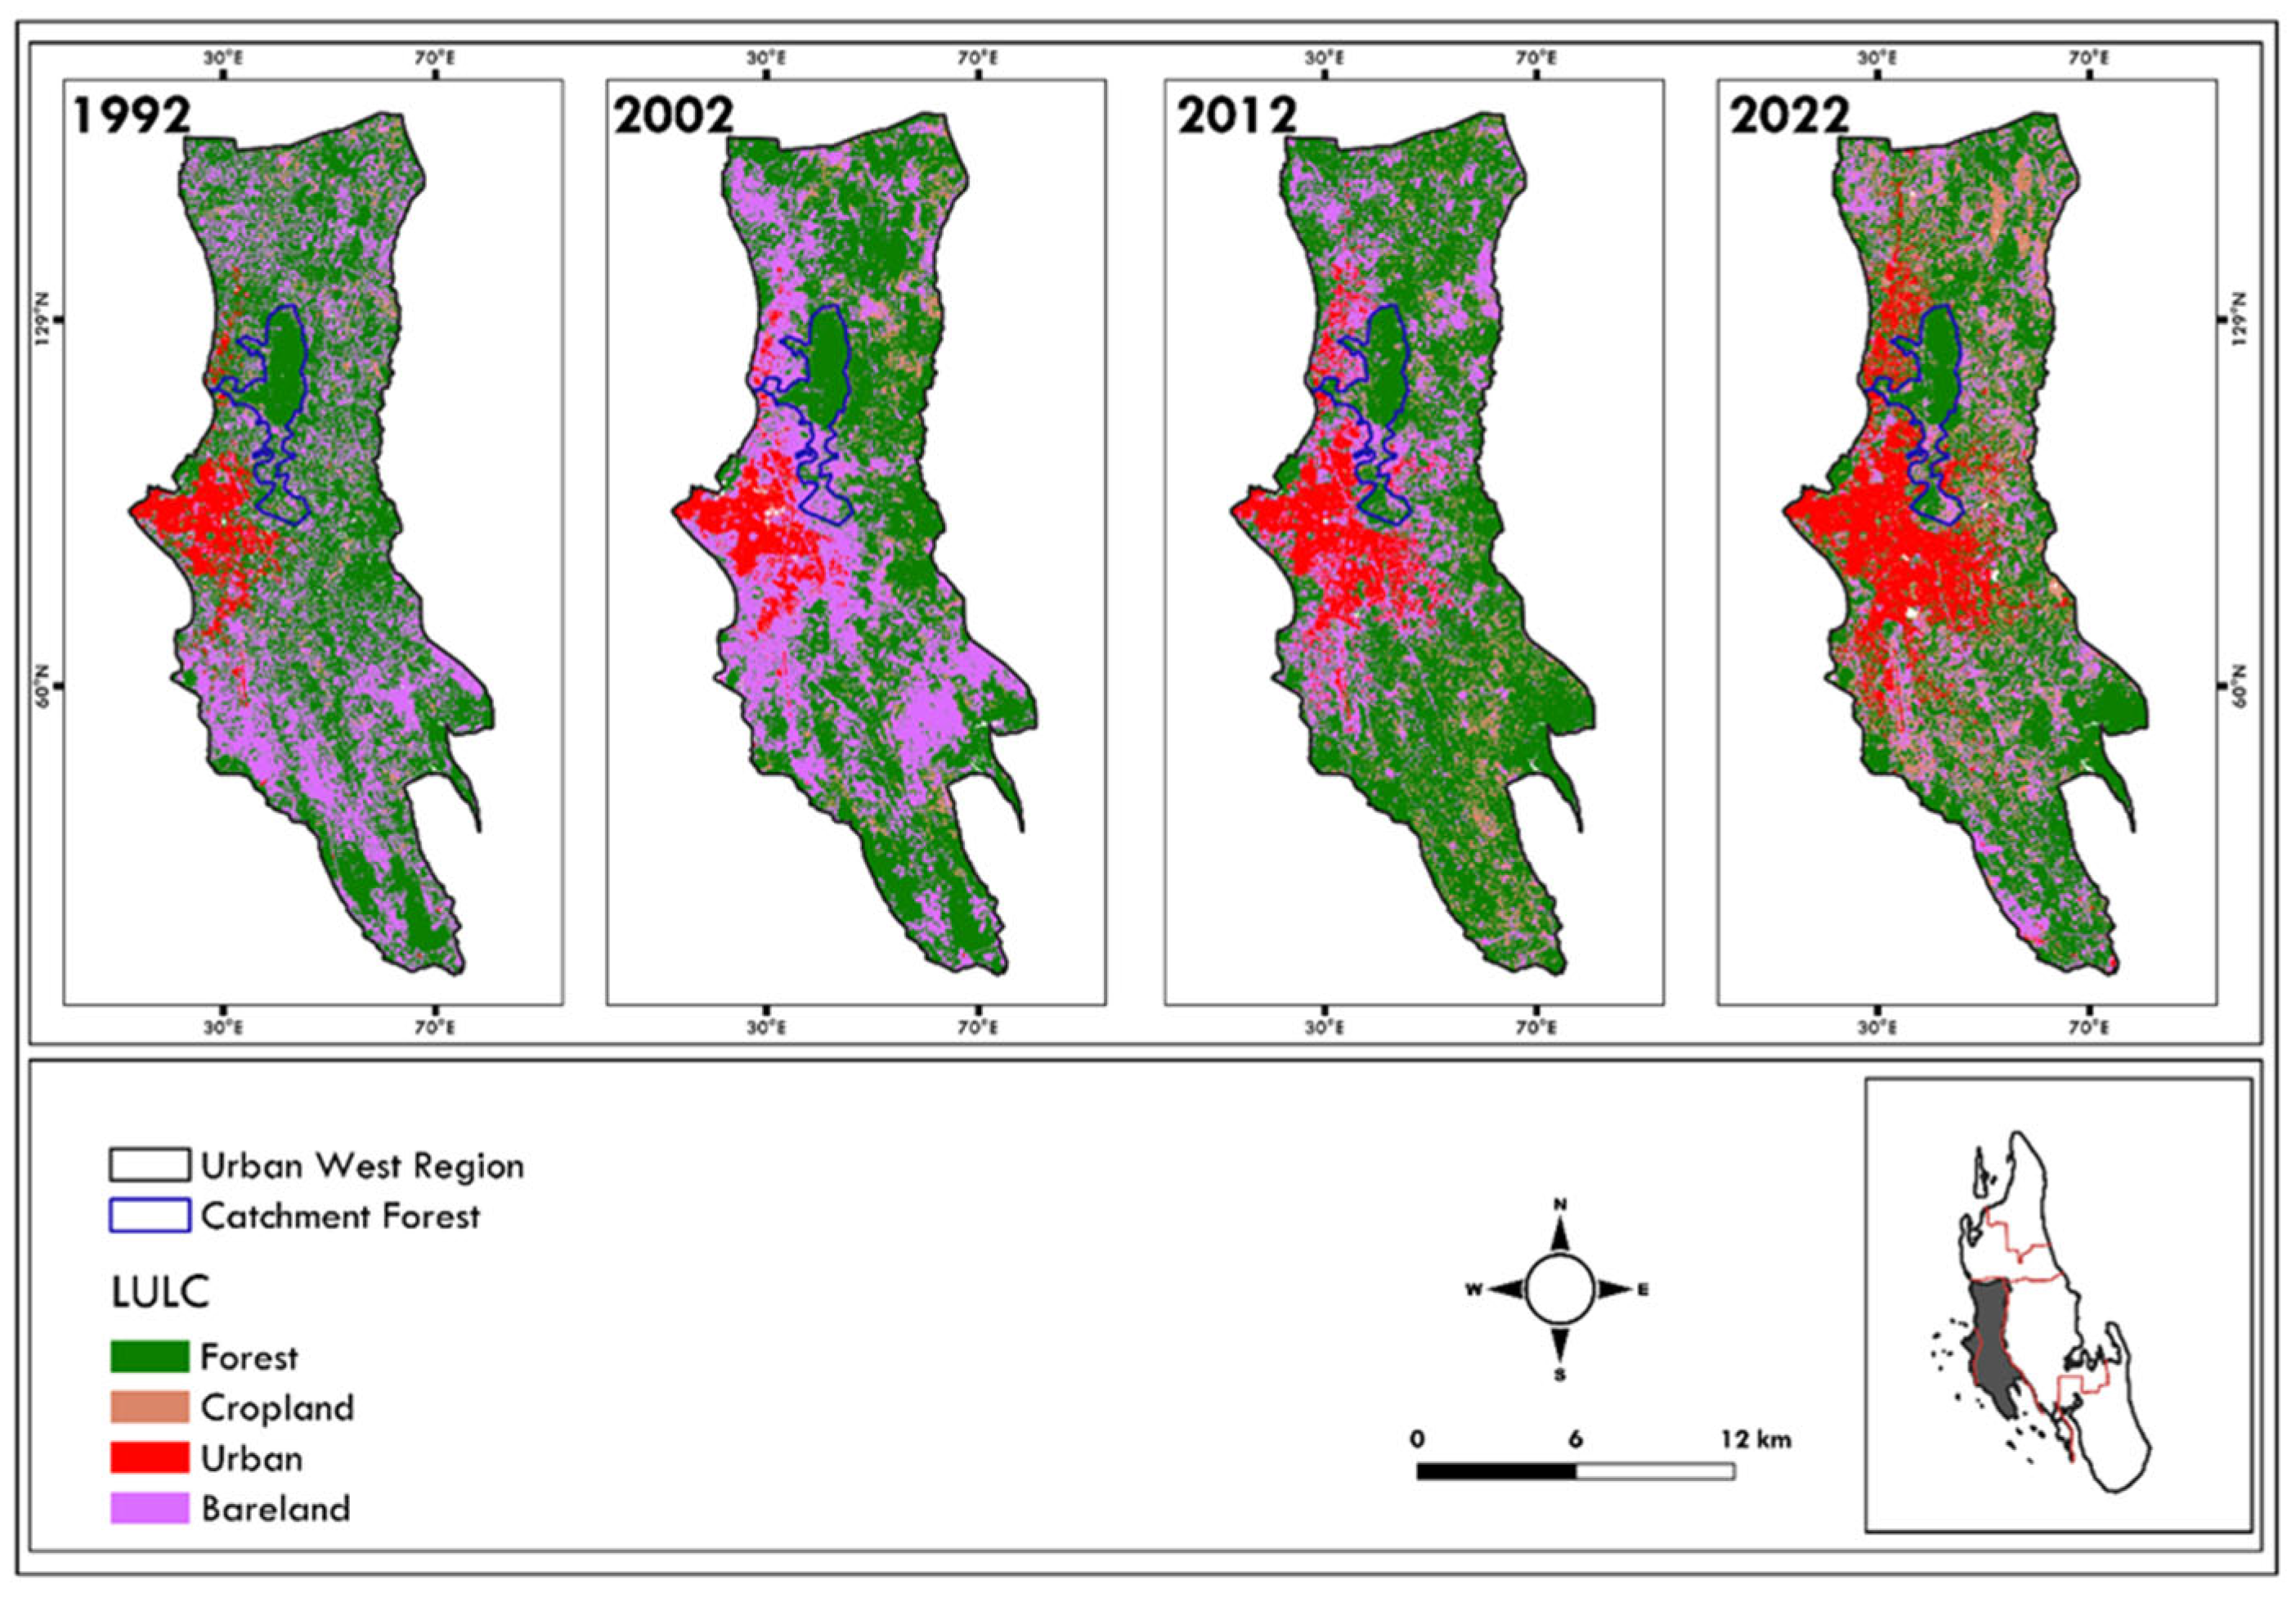
The percentage of change in urban areas increased in the last two decades consuming the soil previously occupied by forest or bare land. A significant increase in cropland area is another issue in terms of water management. While plowed and then irrigated soil partially allows water to re-infiltrate into the aquifer, it often modifies the permeability characteristics of the first layer, thus also significantly altering the recharge process. The overall spatial results in Figure 11 show the LULC maps related to both the Masingini–Mwanyanya forest catchment and the Urban West Region over the study period (1992–2022).
Figure 11. Land use and land cover evolution map in the Urban West Region and Masingini–Mwanyanya catchment forest (Landsat images—see Table 1).
According to recent studies, Zanzibar City had approximately 380,000 people in 2013 and the number would increase to approximately 600,000 people []. These scenarios put pressure on the natural land and its resources since activities like deforestation are likely to occur. The government, community, and international organization noticed these changes around the forest area and took action: in the period between 2012 and 2022, there was an increase in forest by 10.5% in total and 1.83% annually. This increase was attributed to various reforestation projects that were conducted from 2012 around the catchment forest by the Seacology Foundation. One of these is named “Sustainable Management and Conservation of the Masingini Indigenous Forest” [].

4.4. Aquifer Recharge Evolution in Time (1992–2022)

In the coastal area of Zanzibar City, urban expansion has progressively encroached upon inner zones, replacing green and natural areas between 1992 and 2022. Over the same period, the annual infiltration rates calculated with the hydrogeological water balance have decreased accordingly, as shown in Figure 12.
Figure 12. Infiltration evolution map in the coastal area of Zanzibar City.
Specifically, infiltration volumes declined from 15.5 Mm3 (millions of cubic meters) in 1992 to 11.1 Mm3 in 2022 (Figure 13), resulting in a net loss of approximately 4.4 Mm3, equivalent to a 28% reduction in the total aquifer recharge. This decline could worsen the problem of seawater intrusion, which had already been triggered by increased groundwater pumping [,,].
Figure 13. Average aquifer recharge decreases due to urbanization spread.

5. Conclusions

As demonstrated throughout this study, Unguja Island (Zanzibar, Africa) is experiencing a steady decline in availability of its groundwater resources. Between 1992 and 2022, forestland, built-up areas, and bare land shifted from 72.7%, 0.03%, and 27.19% in 1992 to 62.3%, 14.8%, and 22.9%, respectively, by 2022.
Over this 30-year period, land cover changes driven by rapid urbanization have substantially reduced the recharge of the coastal aquifer supplying Zanzibar City from 15.5 Mm3 in 1992 to 11.1 Mm3 in 2022. The Masingini–Mwanyanya forest, which is the one of the main recharge areas of the aquifer, has been especially affected, losing nearly 25% of its green cover, with this trend accelerating significantly during the last decade (2012–2022).
In light of these findings, the study recommends that urban planners and water resource managers adopt an integrated management approach to curb further degradation and mitigate potential seawater intrusion, which might be closely related to recharge reduction and intensified groundwater abstractions, as highlighted by previous studies. The overarching objective should be to halt the continued decline in groundwater availability to ensure the long-term sustainability of this precious resource.
To achieve this, it is crucial to enhance knowledge generation and strengthen the understanding of local water dynamics, enabling timely, evidence-based interventions through the active involvement and collaboration of relevant authorities.

Author Contributions

Conceptualization, S.S.B. and F.M.D.F.; methodology, S.S.B., S.M.K., F.M.D.F. and G.S.; software S.M.K., F.M.D.F. and F.G.; validation, S.S.B., K.H.K. and G.S.; formal analysis, S.S.B., S.M.K., K.H.K. and F.M.D.F.; investigation, S.M.K. and F.G.; data curation, S.M.K., K.H.K. and F.G.; writing—original draft preparation, S.S.B., S.M.K. and K.H.K.; writing—review and editing, F.M.D.F., G.S. and F.G.; supervision, F.M.D.F. and G.S.; project administration, S.S.B. and G.S. All authors have read and agreed to the published version of the manuscript.

Funding

This research received no external funding.

Data Availability Statement

The raw data supporting the conclusions of this article will be made available by the authors on request.

Acknowledgments

The authors would like to express their sincere gratitude to the Department of Land Commission, Zanzibar for providing access to previous mapping materials that greatly supported this study. Special thanks are extended to the Zanzibar Water Supply Authority (ZAWA) for sharing valuable information on water resources and to the Tanzania Meteorological Agency, Zanzibar Office for availing the meteorological data used in the analysis. We are also extremely grateful to the members of staff in the Department of Natural Sciences, State University of Zanzibar for their constructive comments and insights during the seminar presentation, which helped to strengthen this research.

Conflicts of Interest

The authors declare no conflicts of interest.

References

  1. Superfisky, K.; Katz, N. Managing Urban Ecosystems: An Introduction to the Special Issue. Cities Environ. 2023, 16, 1. [Google Scholar]
  2. Li, W.; Wang, Y.; Xie, S.; Cheng, X. Coupling coordination analysis and spatiotemporal heterogeneity between urbanization and ecosystem health in Chongqing municipality, China. Sci. Total Environ. 2021, 791, 148311. [Google Scholar] [CrossRef] [PubMed]
  3. Gollin, D.; Jedwab, R.; Vollrath, D. Urbanization with and without industrialization. J. Econ. Growth 2016, 21, 35–70. [Google Scholar] [CrossRef]
  4. Lall, S.V.; Henderson, J.V.; Venables, A.J. Africa’s Cities: Opening Doors to the World; World Bank Publications: Washington, DC, USA, 2017. [Google Scholar]
  5. Ryan, C.M.; Pritchard, R.; McNicol, I.; Owen, M.; Fisher, J.A.; Lehmann, C. Ecosystem services from southern African woodlands and their future under global change. Philos. Trans. R. Soc. B Biol. Sci. 2016, 371, 20150312. [Google Scholar] [CrossRef]
  6. Lwasa, S.; Buyana, K.; Kasaija, P.; Mutyaba, J. Scenarios for adaptation and mitigation in urban Africa under 1.5 °C global warming. Curr. Opin. Environ. Sustain. 2018, 30, 52–58. [Google Scholar] [CrossRef]
  7. Thorn, J.P.R.; Biancardi-Aleu, R.; Wijesinghe, A.; Mdongwe, M.; Marchant, R.; Shackleton, S. Mainstreaming nature-based solutions for climate resilient infrastructure in peri-urban sub-Saharan Africa. Landsc. Urban Plan. 2021, 216, 104235. [Google Scholar] [CrossRef]
  8. Kukkonen, M.; Käyhkö, N. Spatio-temporal analysis of forest changes in contrasting land use regimes of Zanzibar, Tanzania. Appl. Geogr. 2014, 55, 193–202. [Google Scholar] [CrossRef]
  9. Mwampamba, T.H. Forest Recovery and Carbon Sequestration Under Shifting Cultivation in the Eastern Arc Mountains, Tanzania: Landscape and Landuse Effects. Ph.D. Thesis, University of California, Davis, CA, USA, 2009. [Google Scholar]
  10. NBS. Tanzania in Figures 2022. Available online: https://www.nbs.go.tz/nbs/takwimu/Census2022/Administrative_units_Population_Distribution_Report_Tanzania_volume1a.pdf#page=265.08 (accessed on 20 October 2025).
  11. The United Republic of Tanzania (URT), Ministry of Finance and Planning; Tanzania National Bureau of Statistics; President’s Office—Finance and Planning; Office of the Chief Government Statistician, Zanzibar. The 2022 Population and Housing Census: Administrative Units Population Distribution Report; Tanzania, 2022; Available online: https://www.nbs.go.tz/nbs/takwimu/Census2022/Administrative_units_Population_Distribution_Report_Tanzania_volume1a.pdf (accessed on 20 October 2025).
  12. Sappa, G.; Ferranti, F.; De Filippi, F.M. Assessment of vulnerability to seawater intrusion for the coastal aquifer of Dar es Salaam (Tanzania). In Proceedings of the 17th International Multidisciplinary Scientific Geoconference SGEM 2017, Albena, Bulgaria, 29 June–5 July 2017. [Google Scholar]
  13. De Filippi, F.M.; Giaccio, F.; Ricci, L.; Sappa, G. Modelling artificial infiltration through the vadose zone in the unconfined coastal aquifer of Dar Es Salaam (Tanzania): A preliminary assessment for a managed aquifer recharge (MAR) solution. Environ. Earth Sci. 2025, 84, 552. [Google Scholar] [CrossRef]
  14. GWP Tanzania. Rapid Assessment of Groundwater Resources in Zanzibar; Global Water Partnership Tanzania: Dar es Salaam, Tanzania, 2023. [Google Scholar]
  15. World Bank. Boosting Inclusive Growth for Zanzibar (BIG-Z): Environmental and Social Management Framework; World Bank: Washington, DC, USA, 2020. [Google Scholar]
  16. Shapira & Hellerman Planners; ROM Transportation Engineering Ltd. ZanPlan: Urban Development Report; Zanzibar, Tanzania, 2015. [Google Scholar]
  17. Mpanda, S. Geological development of the East African Coastal Basin of Tanzania. J. Afr. Earth Sci. 1997, 24, 371–391. [Google Scholar]
  18. Colbert, G.; Wagner, B.H.; United Nations Department of Conference Services Cartographic Unit. Hydrogeological Map of Zanzibar: Including the Islands of Zanzibar and Pemba, the United Republic of Tanzania [Map]; United Nations: New York, NY, USA, 1987. [Google Scholar]
  19. Sikat, L.B. Assessing the Spatial and Temporal Characteristics of Groundwater Recharge in Zanzibar: Towards the Optimal Management of Groundwater Resources. Master’s Thesis, University of Twente, Enschede, The Netherlands, 2011. [Google Scholar]
  20. Abdalla, Y.; Makokha, M.; Maalim, M.K. Effect of Rainfall Variability on Spring Discharge in the Masingini Catchment, Zanzibar-Tanzania. Int. J. Environ. Geoinform. 2021, 8, 39–48. [Google Scholar] [CrossRef]
  21. Nikos, K.; Shipton, C.; Mills, W.; Tibesasa, R.; Horton, H.; Horton, M.; Prendergast, M.; Crowther, A.; Douka, K.; Faulkner, P.; et al. Late Quaternary speleogenesis and landscape evolution in a tropical carbonate island: Pango la Kuumbi (Kuumbi Cave), Zanzibar. Int. J. Speleol. 2015, 44, 293–314. [Google Scholar] [CrossRef]
  22. Ali, S. Assessment of the Impacts of Groundwater Pumpage on Water Resources in Zanzibar. Master’s Thesis, Nelson Mandela African Institution of Science and Technology, Arusha, Tanzania, 2020. [Google Scholar]
  23. Mwevura, H.; Haji, M.R.; Othman, W.J.; Okafor, C.J. Seasonal Assessment of Quality of Groundwater from Private Owned Wells in Unguja Island Zanzibar. Int. J. Trop. Dis. Health 2021, 42, 30–45. [Google Scholar] [CrossRef]
  24. Kombo, Y. Sustainable Management and Conservation of the Masingini Indigenous Forest in Zanzibar. 2016. Available online: https://www.researchgate.net/publication/302956085 (accessed on 20 October 2025).
  25. Anthony, O.O.; Ali, S.A.; Hamad, H.S.; Hamad, M.K.; Juma, K.A. Hydrogeochemistry and Health Risks Assessment of Some Groundwaters Suitability for Drinking within the Urban Region of Unguja Island, Zanzibar. Am. J. Water Sci. Eng. 2021, 7, 113–125. [Google Scholar] [CrossRef]
  26. Said, M.S.; Maliondo, S.M.; Semoka, J.M.; Msanya, B.M. Extent of Seawater Intrusion from Chwaka and Uzi Bays into Jozani Groundwater Forest, Zanzibar, Tanzania. Int. J. Sci. Eng. Res. 2017, 8, 1143–1149. [Google Scholar]
  27. Mohamed, A.A.J.; Ali, R.M.; Kombo, M. Groundwater Quality Dynamics during Wet and Dry Incidents in Urban West Region of Zanzibar Island. Int. J. Multidiscip. Res. Anal. 2019, 2, 61–69. [Google Scholar]
  28. Abatzoglou, J.T.; Dobrowski, S.Z.; Parks, S.A.; Hegewisch, K.C. TerraClimate, a high-resolution global dataset of monthly climate and climatic water balance from 1958–2015. Sci. Data 2018, 5, 170191. [Google Scholar] [CrossRef]
  29. Climate Engine. Desert Research Institute and University of Idaho, Version 2.1. 2025. Available online: http://climateengine.org (accessed on 20 October 2025).
  30. Huntington, J.; Hegewisch, K.; Daudert, B.; Morton, C.; Abatzoglou, J.; McEvoy, D.; Erickson, T. Climate Engine: Cloud Computing of Climate and Remote Sensing Data for Advanced Natural Resource Monitoring and Process Understanding. Bull. Am. Meteorol. Society 2017, 98, 2397–2410. [Google Scholar] [CrossRef]
  31. USGS. Earth Explorer. Available online: https://earthexplorer.usgs.gov/ (accessed on 29 July 2025).
  32. Markovinović, D.; Kranjčić, N.; Đurin, B.; Bjelotomić Oršulić, O. Identifying the Dynamics of the Sea-Level Fluctuations in Croatia Using the RAPS Method. Symmetry 2021, 13, 289. [Google Scholar] [CrossRef]
  33. Đurin, B.; Raič, M.; Sušilović, P. Application of the RAPS Method of Time Series Analysis to the Assessment of Grout Curtain Performance in Karst—A Case Study of the Hydro Energy Power Plant (HEPP) Mostar Dam in Bosnia and Herzegovina. Hydrology 2022, 9, 192. [Google Scholar] [CrossRef]
  34. Šrajbek, M.; Đurin, B.; Sušilović, P.; Singh, S.K. Application of the RAPS Method for Determining the Dependence of Nitrate Concentration in Groundwater on the Amount of Precipitation. Earth 2023, 4, 266–277. [Google Scholar] [CrossRef]
  35. Garbrecht, J.; Fernandez, G.P. Visualization of Trends and Fluctuations in Climatic Records. J. Am. Water Resour. Assoc. 1994, 30, 297–306. [Google Scholar] [CrossRef]
  36. Đurin, B.; Kranjčić, N.; Kanga, S.; Singh, S.K.; Sakač, N.; Pham, Q.B.; Hunt, J.; Dogančić, D.; Di Nunno, F. Application of Rescaled Adjusted Partial Sums (RAPS) method in hydrology—An overview. Adv. Civ. Archit. Eng. 2022, 13, 58–72. [Google Scholar] [CrossRef]
  37. Sen, Z.; Sisman, E.; Dabanli, I. Innovative Polygon Trend Analysis (IPTA) and applications. J. Hydrol. 2019, 575, 202–210. [Google Scholar] [CrossRef]
  38. Achite, M.; Ceribasi, G.; Ceyhunlu, A.I.; Wałęga, A.; Caloiero, T. The innovative polygon trend analysis (IPTA) as a simple qualitative method to detect changes in environment—Example detecting trends of the total monthly precipitation in semiarid area. Sustainability 2021, 13, 12674. [Google Scholar] [CrossRef]
  39. Alashan, S.; Abu Arra, A.; Şişman, E. Standardized Innovative Polygon Trend Analysis for Climate Change Assessment (S-IPTA). Pure Appl. Geophys. 2024, 181, 2277–2295. [Google Scholar] [CrossRef]
  40. Acar, E.; Kankal, M.; Akçay, F.; Şan, M. Innovative polygon trend analyses with star graph for rainfall and temperature data in agricultural regions of Turkey. Environ. Earth Sci. 2022, 81, 530. [Google Scholar] [CrossRef]
  41. Şen, Z. Conceptual monthly trend polygon methodology and climate change assessments. Hydrol. Sci. J. 2021, 66, 503–512. [Google Scholar] [CrossRef]
  42. Anderson, J.R. A Land Use and Land Cover Classification System for Use with Remote Sensor Data; U.S. Geological Survey Professional Paper; U.S. Geological Survey: Reston, VI, USA, 1976; Volume 964. [Google Scholar]
  43. Bronstert, A.; Niehoff, D.; Bürger, G. Effects of climate and land-use change on storm runoff generation: Present knowledge and modelling capabilities. Hydrol. Process. 2002, 16, 509–529. [Google Scholar] [CrossRef]
  44. Käyhkö, N.; Fagerholm, N.; Asseid, B.S.; Mzee, A.J. Dynamic land use and land cover changes and their effect on forest resources in a coastal village of Matemwe, Zanzibar, Tanzania. Land Use Policy 2011, 28, 26–37. [Google Scholar] [CrossRef]
  45. Kleemann, J.; Inkoom, J.N.; Thiel, M.; Shankar, S.; Lautenbach, S.; Fürst, C. Peri-urban land use pattern and its relation to land use planning in Ghana, West Africa. Landsc. Urban Plan. 2017, 165, 280–294. [Google Scholar] [CrossRef]
  46. Muhammad, R.; Zhang, W.; Abbas, Z.; Guo, F.; Gwiazdzinski, L. Spatiotemporal change analysis and prediction of future land use and land cover changes using QGIS MOLUSCE plugin and remote sensing big data: A case study of Linyi, China. Land 2022, 11, 419. [Google Scholar] [CrossRef]
  47. Bolstad, P.; Lillesand, T.M. Rapid maximum likelihood classification. Photogramm. Eng. Remote Sens. 1991, 57, 67–74. [Google Scholar]
  48. Fichera, C.R.; Modica, G.; Pollino, M. Land cover classification and change-detection analysis using multi-temporal remote sensed imagery and landscape metrics. Eur. J. Remote Sens. 2012, 45, 1–18. [Google Scholar] [CrossRef]
  49. Foody, G.M. Explaining the unsuitability of the kappa coefficient in the assessment and comparison of the accuracy of thematic maps obtained by image classification. Remote Sens. Environ. 2020, 239, 111630. [Google Scholar] [CrossRef]
  50. Manandhar, R.; Odeh, I.O.; Ancev, T. Improving the accuracy of land use and land cover classification of Landsat data using post-classification enhancement. Remote Sens. 2009, 1, 330–344. [Google Scholar] [CrossRef]
  51. Story, M.; Congalton, R.G. Accuracy Assessment: A User’s Perspective. Photogramm. Eng. Remote Sens. 1986, 52, 397–399. [Google Scholar]
  52. Choudhury, D.; Das, K.; Das, A. Assessment of land use land cover changes and its impact on variations of land surface temperature in Asansol-Durgapur Development Region. Egypt. J. Remote Sens. Space Sci. 2019, 22, 203–218. [Google Scholar] [CrossRef]
  53. Lu, D.; Batistella, M.; Moran, E.; Mausel, P. Application of spectral mixture analysis to Amazonian land-use and land-cover classification. Int. J. Remote Sens. 2004, 25, 5345–5358. [Google Scholar] [CrossRef]
  54. Al-Doski, J.; Mansor, S.B.; Shafri, H.Z.M. NDVI differencing and post-classification to detect vegetation changes in Halabja City, Iraq. IOSR J. Appl. Geol. Geophys. 2013, 1, 1–10. [Google Scholar] [CrossRef]
  55. Hishe, H.; Giday, K.; Van Orshoven, J.; Muys, B.; Taheri, F.; Azadi, H.; Witlox, F. Analysis of land use land cover dynamics and driving factors in Desa’a forest in Northern Ethiopia. Land Use Policy 2021, 101, 105039. [Google Scholar] [CrossRef]
  56. Serra, P.; Pons, X.; Sauri, D. Post-classification change detection with data from different sensors: Some accuracy considerations. Int. J. Remote Sens. 2003, 24, 3311–3340. [Google Scholar] [CrossRef]
  57. Shalaby, A.; Tateishi, R. Remote sensing and GIS for mapping and monitoring land cover and land-use changes in the Northwestern coastal zone of Egypt. Appl. Geogr. 2007, 27, 28–41. [Google Scholar] [CrossRef]
  58. Abdalla, A.H.; Kai, K.H.; Khamis, S.A.; Kondowe, A.L.; Osima, S.E.; King’uza, P.H.; Hamad, A.O. The influence of climate change and variability on spatio-temporal rainfall and temperature distribution in Zanzibar. Atmos. Clim. Sci. 2023, 13, 282–313. [Google Scholar] [CrossRef]
  59. Potochnik, A.; Colombo, M.; Wright, C. Recipes for Science; Routledge: New York, NY, USA, 2018. [Google Scholar] [CrossRef]
  60. De Filippi, F.M.; Sappa, G. The Simulation of Bracciano Lake (Central Italy) Levels Based on Hydrogeological Water Budget: A Tool for Lake Water Management when Climate Change and Anthropogenic Impacts Occur. Environ. Process. 2024, 11, 8. [Google Scholar] [CrossRef]
  61. The United Republic of Tanzania (URT). 2012 Population and Housing Census: Population Distribution by Administrative Areas; URT: Dar es Salaam, Tanzania, 2013. [Google Scholar]
  62. Mato, R.M. Groundwater quality degradation due to salt water intrusion in Zanzibar Municipality. Afr. J. Environ. Sci. Technol. 2015, 9, 734–740. [Google Scholar] [CrossRef]
  63. Idowu, T.E.; Lasisi, K.H. Seawater intrusion in the coastal aquifers of East and Horn of Africa: A review from a regional perspective. Sci. Afr. 2020, 8, e00402. [Google Scholar] [CrossRef]
  64. Pembe-Ali, Z.; Mwamila, T.B.; Lufingo, M.; Gwenzi, W.; Marwa, J.; Rwiza, M.J.; Lugodisha, I.; Qi, Q.; Noubactep, C. Application of the Kilimanjaro Concept in Reversing Seawater Intrusion and Securing Water Supply in Zanzibar, Tanzania. Water 2021, 13, 2085. [Google Scholar] [CrossRef]
Disclaimer/Publisher’s Note: The statements, opinions and data contained in all publications are solely those of the individual author(s) and contributor(s) and not of MDPI and/or the editor(s). MDPI and/or the editor(s) disclaim responsibility for any injury to people or property resulting from any ideas, methods, instructions or products referred to in the content.

Article Metrics

Citations

Article Access Statistics

Multiple requests from the same IP address are counted as one view.