Abstract
Excess concentrations of fecal indicator bacteria, nitrogen, and phosphorus have caused closure of shellfish growing waters, swimming advisories, eutrophication, and impairment of aquatic habitat in the Tar–Pamlico Estuary, North Carolina. Regulatory requirements to reduce nutrient and bacteria loading to the estuary were enacted more than two decades ago, but water quality problems persist. The goals of this study were to (1) assess the nutrient and bacteria concentrations and exports from Jacks Creek and Runyon Creek to the Tar–Pamlico Estuary in Coastal North Carolina, USA, and (2) recommend watershed-specific practices to reduce pollutant loadings and improve estuarine water quality. Stream water samples were collected for nutrient, bacteria, and physicochemical property (flow, pH, temperature, turbidity, and dissolved oxygen) analyses from five segments of Jacks Creek and six segments of Runyon Creek. Samples were collected between 8 and 10 times over a two-and-a-half-year period (2021–2024). Mean concentrations of total dissolved nitrogen, total dissolved phosphorus, and E. coli for Jacks Creek (1.55 mg/L, 0.10 mg/L, 502 MPN/100 mL) and Runyon Creek (1.70 mg/L, 0.07 mg/L, 262 MPN/100 mL) exceeded reference conditions or thresholds established by the US EPA (0.69 mg/L, 0.036 mg/L, 126 MPN/100 mL). Therefore, both watersheds have been contributing to the nutrient and bacteria problems of the estuary. Implementation of stormwater control measures in the urbanized Jacks Creek Watershed and agricultural best management practices in the Runyon Creek Watershed is encouraged. Some of the suggested practices have been installed, but additional remediation efforts are needed.
1. Introduction
Elevated concentrations of fecal indicator bacteria and nutrients are often linked to the designation of water resources as “impaired” [1]. Almost 50% of the river and stream miles and more than 20% of lakes in the US that were tested are listed in poor condition because of excess nitrogen and/or phosphorus, and elevated concentrations of fecal bacteria were reported in almost 25% of water bodies tested, including coastal recreational waters [2]. Primary productivity in aquatic habitats is often limited by the supply of nitrogen and phosphorus [3]. When nutrients are added to water resources, they can increase algal growth, thus providing a food source at the base of the food chain and supporting higher trophic levels [4]. However, too much algal growth can be detrimental because when the algae die, the waters can become depleted of dissolved oxygen during decomposition, resulting in anoxic conditions and causing fish kills. Also, some harmful algae produce toxins such as microcystin that are dangerous for aquatic organisms and humans [3]. Harmful algal blooms have been reported in major water bodies across the world, including the Patos Lagoon in Brazil, Lake Michigan in Canada, Lake Victoria in Africa, Lake Taihu in China, and the estuarine waters of the Chesapeake Bay and Albemarle Sound, USA; thus, harmful algal blooms are a global issue [5,6].
Harmful algal blooms are fueled by additions of nitrogen and phosphorus from various sources. A major non-point source of nutrients to surface waters is agricultural runoff. Manure and/or nitrogen and phosphorus-rich synthetic fertilizers are applied to agricultural fields to stimulate crop yields, and these efforts have been successful. For example, research that included 50 years of crop data in Germany [7] showed yield increases of more than 74% for wheat, winter rye, potato, and sugar beets for crops receiving fertilizers relative to crops without fertilizer. A recent study in the North China Plain [8] showed that wheat and maize yields increased by 21.5% and 27.5%, respectively, in comparison to treatments with no nutrient additions. Good crop yields are important to sustain a food supply for a growing global population; however, crops are not 100% percent efficient at taking up the applied nutrients [9]. Nutrients that are not incorporated into plant biomass are susceptible to leaching to groundwater [10] or attachment to soil particles and removed from the sites via erosion [11]. Groundwater transport of nutrients and overland flow from agricultural fields has been identified as a culprit in contributing to eutrophication and harmful algal blooms in many regions [12,13], including the Tar–Pamlico Estuary [6], where this study was conducted.
Urban stormwater runoff is one of the major point sources of nutrient pollution to surface waters. When land is covered with impervious (hard) surfaces such as roads, parking lots, and rooftops, infiltration of rainfall decreases, and runoff increases [14]. Wildlife and pet waste, grass clippings, leaf matter, sediment, and other nutrient-containing pollutants collect on the hard surfaces during dry periods. When the area receives rain, the runoff is funneled to storm drains connected to a network of pipes that discharge the flow and pollutants to streams, lakes, and other surface waters. The volume and velocity of runoff discharged from the stormwater outfalls can cause erosion of the bed and banks of the receiving drainageways, thus degrading aquatic habitat and mobilizing additional sediment and pollutants [15]. Nutrient exports from watersheds with predominantly urban lands may be comparable or even exceed exports from watersheds with agricultural land uses [10]. Discharges from municipal storm sewer systems in larger cities of the US are regulated via the National Pollution Discharge Elimination Systems Program [16]. However, most non-point sources of pollution, like diffuse agricultural runoff, are not regulated via a permitting system like stormwater outfalls.
Fecal indicator bacteria, including E. coli, are commonly used to evaluate the environmental health risks of recreational waters. When the geometric mean of E. coli concentrations in recreational waters exceeds 126 MPN/100 mL, or more than 10% of samples exceed 410 MPN/100 mL, the probability of negative health consequences for humans recreating in the water may increase [17]. Some of the major sources of bacteria and nutrients in surface waters include wastewater from humans via malfunctioning septic systems [18,19,20] or sewer systems [21,22,23], wildlife waste [24,25,26], livestock waste [27,28], and pet waste [25,29,30]. These wastes are mobilized from agricultural and urban lands via runoff following rain events [31,32]. In some coastal communities, shellfish harvesting waters are temporarily closed after storm events to reduce the risk of illness from consumption of contaminated shellfish associated with polluted runoff [33].
While water quality problems associated with elevated concentrations of nutrients and bacteria have been documented for decades in Eastern North Carolina, where this study was focused, and other regions [3], there are mechanisms for reducing pollutant loadings to impaired waters that may improve water quality. Prior research has shown that runoff control measures such as bioretention [26,34,35], water control structures placed in drainageways [26,36,37], construction or preservation of wetlands [19,38,39,40,41], and detention basins [41,42] can slow runoff and may stimulate various biological, chemical, and physical processes that reduce nutrient and bacteria transport. More specifically, bioretention cells are excavations constructed in areas that have permeable soil with sufficient depth to the water table (typically > 1 m). The cells are planted with vegetation that can tolerate wet and dry conditions [34,35]. Stormwater is piped to the cell (s) and infiltrates the soil. Bacteria are filtered during infiltration of stormwater, while phosphorus may bind to the soil and/or be immobilized via plant uptake. Nitrogen can also be immobilized via plant uptake or may be removed via denitrification, especially if the cells are designed with an internal water storage system that provides a saturated, anaerobic zone towards the bottom of the cell [36]. Water control structures are placed in drainageways and utilize devices such as flash boards to manage the outlet elevation. Adding boards to the structure creates a dam that reduces the outflow of water from the adjacent lands/fields, thus also reducing nutrient and bacteria exports [11]. Wetlands and detention basins are designed with sufficient capacity to slow and treat runoff from various sources, including agricultural and urban lands [40,41,42]. Wetlands are typically constructed in areas with shallow water tables (<1 m) and/or in soils with low permeability, so runoff directed to the wetland tends to create pools. Vegetation tolerant of saturated soils is planted in wetlands to enable immobilization of nutrients and stimulate soil microbial transformations such as denitrification [36,40]. Detention basins typically have larger open water areas in comparison to wetlands but are often lined with wetland vegetation to improve nutrient removal capacity [40,41,42]. These structural control measures can be effective, but they are costly to design, construct, and maintain [43], and thus, it is important that they are placed in locations within a watershed where they can have the greatest influence [11].
The goal of this research was to gain a better understanding of the water quality characteristics of the flow discharging into the Tar–Pamlico River Estuary from Jacks Creek and Runyon Creek in coastal North Carolina, USA, and identify if certain portions of the watersheds were contributing the most to pollutant loadings. This information is important because water quality problems have persisted in the estuary for decades [2,11]. Data from this study will help guide mitigation efforts to reduce nutrient and bacteria exports to the estuary.
2. Materials and Methods
2.1. Study Area
The study sites were in Washington, North Carolina, and included the Jacks Creek and Runyon Creek Watersheds (Figure 1). Jacks Creek drains an urbanized area encompassing approximately 614 ha. Just over 92% of the watershed is characterized as developed (residential or commercial construction), and approximately 36% of the surface is impervious cover, including roads, rooftops, and parking lots (Table 1). The dominant soils in the watershed include Altavista, Seabrook, and the State series, which, together, comprise about 2/3 of the land area. These soil series typically have sand or sandy loam surface horizons and are classified as moderately well to well drained with seasonal high water tables typically deeper than 0.75 m below the surface [44]. Residents in the Jacks Creek Watershed and the southern portion of the Runyon Creek Watershed are served by the City of Washington Wastewater Treatment plant. The effluent from the plant is not discharged into Jacks Creek or Runyon Creek; thus, there are no known sewer outfalls in either watershed that would influence nutrient and or bacteria concentrations in the sampled stream segments. Runyon Creek drains a rural watershed encompassing approximately 3030 ha (Figure 1). Just over 32% of the watershed is characterized as cropland, almost 20% is forested, and about 15% is developed (Table 1). The most planted crops in the area include corn, soybeans, and wheat [45], which receive significant applications of nitrogen and phosphorus-based fertilizer. For example, corn in the region typically receives more than 150 Kg ha/yr of nitrogen [46] and 14 kg ha/yr of phosphorus [47,48]. Thus, fertilization of agricultural fields is a significant source of nutrients in the Runyon Creek Watershed. The dominant soils in the Runyon Creek Watershed include Craven, Lenoir, and Leaf, which comprise about 67% of the land. Leaf and Lenoir soils are very poorly and poorly drained, respectively, with seasonal high water tables typically within 0.6 m of the surface, while Craven is characterized as moderately well drained with a high water table around 0.75 m or deeper [44]. Each of these series has expansive clay mineralogy subsoil, which leads to relatively low hydraulic conductivity values in the subsurface. Drainage modifications, including crowning of agricultural fields and installation of ditches and canals, are used extensively to increase trafficability to enable agricultural production. The climate of Washington, NC, is temperate. Using daily parameters summarized for the entire year, there is an average daily high of 22.8 °C and an average daily low of 11.7 °C. The average temperatures are highest in July (mean 32.2 °C) and lowest in January (1.1 °C) [49]. The annual average precipitation is 125.2 cm for Washington, with monthly averages ranging from about 8 cm in April to 14.8 cm in September [49].
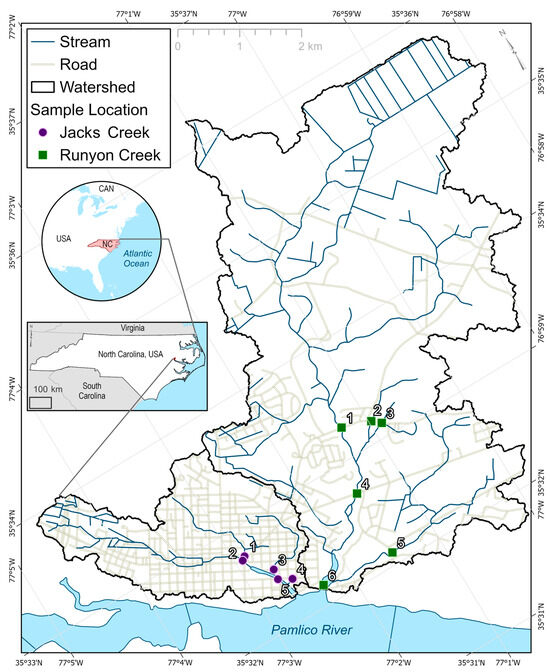
Figure 1.
Jacks Creek and Runyon Creek Watersheds that drain to the Tar–Pamlico Estuary in coastal North Carolina, USA. Numbered features delineate locations.

Table 1.
Land use characteristics of sub-watersheds in Jacks Creek and Runyon Creek. Watershed outlets are denoted by (*). Estimates based on USGS StreamStats data. (https://www.usgs.gov/streamstats). URL (accessed on 10 September 2025).
Jacks Creek and Runyon Creek are tributaries of the nutrient-sensitive Tar–Pamlico Estuary, where issues with excess loading of nutrients (nitrogen and phosphorus) and fecal indicator bacteria have led to algal blooms, eutrophication, degradation of aquatic habitat, and/or impairment of water resources [50]. Regulations were enacted in 2000 to reduce nutrient loadings to the estuary, which included preservation of vegetated riparian buffers, reduction in urban runoff from new developments via installation of stormwater control measures, nutrient management plans and best management practices for farms, and loading caps for wastewater treatment plants. These practices and efforts to improve water quality via reducing nutrient loadings from agriculture, wastewater discharges, and stormwater runoff were documented and summarized by NC DEQ [50]. However, decades after the regulations went into effect, excess nutrient concentrations in the Tar–Pamlico Estuary persist [51]. Swimming alerts and advisories associated with elevated fecal indicator bacteria concentrations in coastal recreational waters of NC are also still common. For example, in 2024 alone, there were 99 such warnings posted [52]. Therefore, continued work to identify sources of nutrient and bacteria pollution and mitigate loadings to the estuary is needed, especially in watersheds immediately adjacent to the estuary.
2.2. Physicochemical Characterization of Drainage
Stream velocity was measured using a Global Water FP111 Flow Probe (Global Water, Gold River, CA, USA) at 5 locations within the Jacks Creek Watershed and 6 locations within the Runyon Creek Watershed (Figure 1), where access to the streams was available near road culverts. The width (m) and average depth (m) of each stream were determined using a tape measure and grade rod, respectively. Discharge (L/s) was determined by multiplying stream velocity by the active cross-sectional area of the stream. Near the mouth of Jacks Creek (JC-5) and Runyon Creek (RC-6), outflow was estimated by summing the discharge from the tributary stream segments, where stream velocities enabled the use of the flow meter, and waders could be used to traverse the channels and determine active cross-sectional areas of flow. Field days were planned so that approximately half of the sampling events were conducted during baseflow conditions and half when stormflow was contributing to discharge (rainfall exceeding 1.5 cm received within 48 h). Jacks Creek was sampled during stormflow conditions 5 times (of 10 total events) while Runyon Creek was sampled 3 times (of 8 events) during stormflow. A Hanna Instruments 9829 multi-meter (Hanna Instruments, Smithfield, RI, USA) was used to determine pH, temperature, specific conductance (SC), and dissolved oxygen (DO) concentration of water in the streams. The probes were calibrated prior to each field event.
2.3. Nutrient and Fecal Indicator Bacteria Analyses
Samples for nutrient and bacteria analyses were collected at least once during each season from stream segments in the Jacks Creek and Runyon Creek Watersheds. Field events were coordinated so the number of samples collected during the typically warm seasons of Spring and Summer and the cold seasons of Fall and Winter would be similar. Sampling events for Jacks Creek occurred during Summer (n = 3), Winter (n = 3), Fall (n = 3), and Spring (n = 1) dates, while Runyon Creek was sampled during Winter (n = 2), Fall (n = 2), Spring (n = 1), and Summer (n = 3) dates. HDPE bottles with 500 mL capacity were used to collect water samples for nutrient analyses, while sterile, 120 mL capacity bottles were used for collecting samples for E. coli analyses. The bottles, once filled with samples by dipping them into the streams, were placed in ice-filled coolers for transport to labs at East Carolina University (ECU) for analysis. More specifically, samples were analyzed for total dissolved nitrogen (TDN), total dissolved phosphorus (TDP), and E. coli. Water samples for nutrient analyses were filtered using Whatman GF/F 0.7 µm pore-sized filters (Cytiva, Marlborough, MA, USA). Filtrate was analyzed for TDN using a Shimadzu TNN-L analyzer with catalytic thermal decomposition/chemiluminescence (Shimadzu Corp., Kyoto, Japan). Total dissolved phosphorus was determined using a Unity SmartChem 170 color spectrometer (KPM Analytics, Westborough, MA, USA). Concentrations of E. coli were enumerated using IDEXXTM Colilert media with the QuantiTray2000® method (IDEXX Laboratories, Inc., Westbrook, ME, USA). Dilution factors of up to 100 were used for bacteria analyses during sampling events that occurred after recent rainstorms.
Concentrations of nitrogen and phosphorus were compared to ambient water quality reference conditions recommended by the US EPA [53] for the closest Ecoregion (IX) (total nitrogen = 0.69 mg/L; total phosphorus = 0.036 mg/L). Concentrations of E. coli were compared to the US EPA [17] recreational water quality criteria, which indicate that water samples should not exceed a geometric mean of 126 MPN/100 mL, and no more than 10% of samples should exceed the statistical threshold value of 410 MPN/100 mL. Thus, the geometric mean of E. coli at each sampling location was computed and compared to the threshold of 126 MPN/100 mL, and the frequency of samples that exceeded 410 MPN/100 mL was also reported. Anderson–Darling tests for normality were conducted on the nitrogen and phosphorus concentration data. A one-sample T-test (data were normally distributed) was used to determine if the differences in concentrations of TDN and TDP at the watershed outlets were statistically significant relative to reference conditions. Nutrient and bacteria concentration data were pooled based on whether the samples were collected during the warm seasons of spring and summer or the cool seasons of fall and winter. Mann–Whitney tests (data did not follow a normal distribution) were used to determine if the differences in concentrations based on seasons were statistically significant (p < 0.05). Statistical tests were performed using Minitab 22.4 statistical software (State College, PA, USA). Concentrations of nutrients and E. coli observed in the watersheds evaluated during this study were also compared to concentrations reported in other watersheds with predominantly agricultural and urban land uses to gain perspective on the relative magnitudes of the concentrations. Exports of TN, TP, and E. coli were calculated by multiplying discharge (L/s) by concentrations (mg/L or MPN/L).
Concentrations and exports of nutrients and bacteria were compared for each of the sampling locations in Jacks Creek and Runyon Creek. Land use characteristics (e.g., % of agriculture, woodlands, and developed settlements) of the watershed area upstream from the sampling locations with the highest pollutant concentrations were evaluated using USGS StreamStas, satellite aerial photography, soil survey data, and site visits to determine the likely sources of the pollutants. This information, including contributing area and land cover, soil permeability, water table depths, and onsite observations, was used to determine which control measures may be suggested to address the most likely pollutant sources.
3. Results and Discussion
3.1. Nutrient and Bacteria Concentrations
The mean concentration of TDN at every sampling location in Jacks Creek (JC-1 to JC-5) and Runyon Creek (RC-1 to RC-6) exceeded the US EPA reference condition of 0.69 mg/L (Figure 2). The average concentrations of TDN at the five stream segments within Jacks Creek were similar and ranged from 1.53 mg/L (JC-2 and JC-3) to 1.61 mg/L (JC-1) (Figure 2). The concentrations of TDN within the Runyon Creek Watershed were more variable and ranged from an average of 1.48 mg/L at RC-1 to 2.85 mg/L at RC-2 (Figure 2). One-sample t-tests revealed that the concentrations of TDN discharging to the Tar–Pamlico River Estuary from Jacks Creek (1.55 mg/L) and Runyon Creek (1.70 mg/L) were significantly (p < 0.001) greater relative to the EPA reference concentration of 0.69 mg/L [37]. The average concentrations of TDP within the Jacks Creek Watershed ranged from 0.06 mg/L at JC-3 to 0.11 mg/L at JC-1, JC-2, and JC-5 (Figure 3). Runyon Creek stream sampling revealed mean concentrations of TDP between 0.06 mg/L at RC-5 to 0.19 mg/L at RC-2 (Figure 3). One-sample t-tests showed the mean concentrations of TDP at JC-5 (0.11 mg/L) and RC-6 (0.07 mg/L) near the mouths of the rivers and closest to the Pamlico River Estuary were significantly (p < 0.05) higher in comparison to the reference criteria concentration of 0.036 mg/L suggested by the EPA [53].
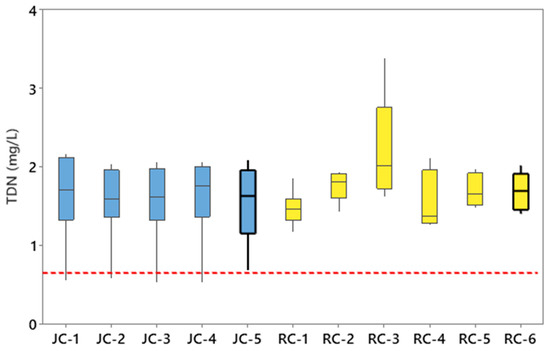
Figure 2.
Total dissolved nitrogen concentrations (TDN) for each sampling location within Jacks Creek (JC) and Runyon Creek (RC). The dashed line is the reference condition for TDN concentrations.
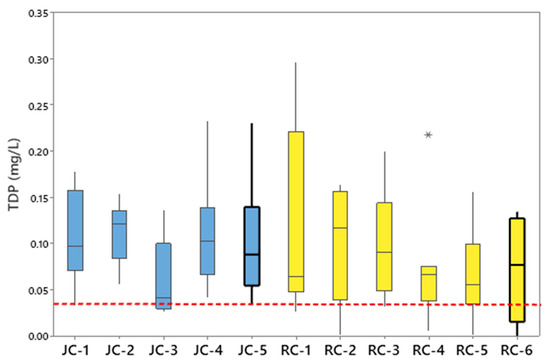
Figure 3.
Total dissolved phosphorus concentrations (TDP) for each sampling location within Jacks Creek (JC) and Runyon Creek (RC). The dashed line is the reference condition for TDP concentrations. The asterisk indicates a statistical outlier.
While the concentrations of TDN and TDP observed discharging from Jacks Creek and Runyon Creek to the Tar–Pamlico Estuary were elevated relative to reference standards, they were within the ranges reported for other watersheds with predominantly agricultural or urban land uses. For example, in a study conducted in the Peace River Watershed of Florida, where agricultural and urban land uses comprise 36% and 13% of the watershed, respectively [54], concentrations of TN between 0.95 and 1.8 mg/L and concentrations of TP between 0.27 and 0.94 mg/L were observed. Research [55] conducted in the Upper Parkhill Watershed of Ontario, Canada, which comprises 76% agricultural areas, showed surface waters with average annual nitrate and total phosphorus concentrations of 5.15 mg/L and 0.07 mg/L, respectively. Closer geographically to the current study area, researchers [56] analyzed water samples from 14 streams in Eastern NC (11 of 14 watersheds had >31% agricultural land use) and reported concentrations of TN and TP between 0.50 and 3.1 mg/L, and 0.01 to 0.34 mg/L, respectively. Studies [57,58] of six watersheds with mostly urban land uses in the NC Coastal Plain showed median TN concentrations between 0.9 and 1.1 mg/L and median TP concentrations between 0.09 and 0.27 mg/L. A different study [59] of 13 urbanizing watersheds in central NC reported median TDN and phosphate concentrations between 0.97 and 8.95 mg/L, and 0.02 and 0.98 mg/L, respectively. Therefore, nutrient concentrations observed in Jacks Creek and Runyon Creek were like concentrations in other streams draining watersheds influenced by anthropogenic activities associated with urban and agricultural land uses.
The concentration of E. coli exceeded the US EPA [17] recreational waters threshold (geometric mean of 126 MPN/100 mL) at all sampling locations in Jacks Creek and Runyon Creek (Figure 4). Geometric mean concentrations of E. coli were between 280 MPN/100 mL at JC-3 to 1333 MPN/100 mL at JC-1 at Jacks Creek, and geometric mean concentrations at Runyon Creek ranged from 262 MPN/100 mL at RC-6 to 884 MPN/100 mL at RC-2. A total of 56 percent of all samples collected at JC-5 and over 35% of all samples collected at RC-6 nearest the Tar–Pamlico River Estuary exceeded the statistical threshold value of 410 MPN/100 mL. The concentrations of E. coli in the sampled stream segments observed in our study also align with concentrations reported in other watersheds with mostly urban or agricultural land uses. For example, mean concentrations of E. coli in surface waters ranging from 63 to 3512 CFU/100 mL were reported [60] in the Black Hawk Lake Watershed of Iowa, where approximately 75% of the land is used for row crop production. Neher et al. [60] reported higher concentrations of E. coli in surface waters during periods when the crops were actively growing and fertilized with manure (mean of 505 and 774 CFU/100 mL) in comparison to periods before the crops were planted (without manure applications) (mean of 63 and 97 CFU/100 mL). Surface waters from the Grand Lake in St. Marys, Ohio, where 78% of the land use is row-crop production, were monitored [27] and mean concentrations of E. coli were highest during summer (857 CFU/100 mL) and lowest in Fall (460 CFU/100 mL), thus showing variability associated with seasons/temperature. Mean concentrations of E. coli in 24 streams draining urban watersheds in the piedmont of Georgia [61] were over 300 MPN/100 mL, with a range from 10 to 2739 MPN/100 mL, while a study [62] of 6 urbanizing watersheds in eastern NC reported median concentrations of E. coli ranging from 359 to 750 MPN/100 mL.
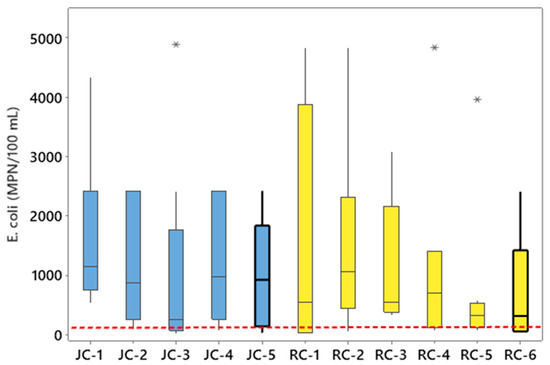
Figure 4.
Concentrations of E. coli for each sampling location within Jacks Creek (JC) and Runyon Creek (RC). The dashed line is the 126 MPN/100 mL geometric mean threshold for E. coli in recreational waters. The asterisks indicate statistical outliers.
Mann–Whitney tests showed that during the warm season (spring and summer) sampling events, the median concentrations of TDN (0.76 mg/L), TDP (0.11 mg/L), and E. coli (1937 MPN/100 mL) in Jacks Creek were not significantly (p > 0.05) different in comparison to concentrations during the cool season (TDN = 1.77 mg/L; TDP = 0.09 mg/L; E. coli = 610 MPN/100 mL). For Runyon Creek, no significant differences were observed when comparing the median concentrations during the warm-season sampling of TDN (1.63 mg/L), TDP (0.10 mg/L), or E. coli (157 MPN/100 m) to the cool-season samples (TDN = 1.76 mg/L; TDP = 0.06 mg/L; E. coli = 1044 MPN/100 mL). There was substantial overlap with warm and cool season nutrient and bacteria concentration data for both watersheds (Figure 5), suggesting that other factors were more influential regarding the concentrations observed. The highest concentrations of TDN and E. coli discharging into the Tar–Pamlico Estuary from Jacks Creek were observed during sampling periods that followed rain events. More specifically, a TDN concentration of 2.09 mg/L and an E. coli concentration of 2420 MPN/100 mL were reported at the mouth of Jacks Creek during a sampling event in May of 2022, when 1.78 cm of rain was received within 2 days (prior) of the sampling event. A TDP concentration of 0.23 was reported at JC-5 in August of 2022 when samples were collected after the area had received 3.2 cm of precipitation within the previous 48 h. For Runyon Creek, the highest concentration of E. coli (2407 MPN/100 mL) was observed during a March 2024 sampling event when 4.34 cm of precipitation was received during the previous 2 days. The highest TDP concentration (0.13 mg/L) reported at the mouth of Runyon Creek was sampled in July of 2024, when 1.88 cm of rain had been received just prior to the field event. Other studies have also reported higher concentrations of nutrients and bacteria in surface waters following rain events due to agricultural and urban runoff [19,26,63,64].
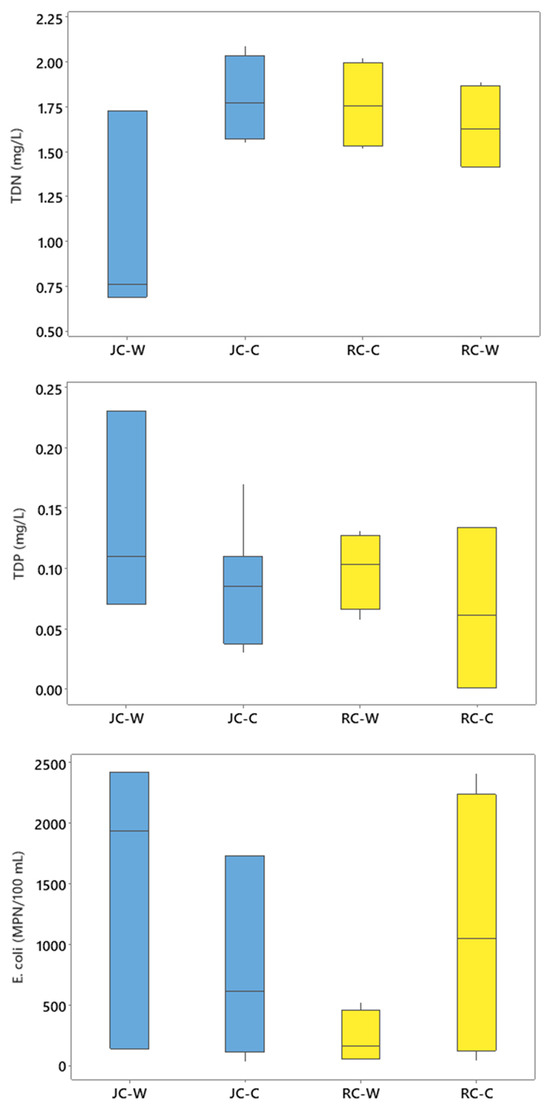
Figure 5.
Concentrations of TDN (top), TDP (middle), and E. coli (bottom) for the Jacks Creek (JC) and Runyon Creek (RC) watersheds during warm (w) and cool (c) seasons.
3.2. Nutrient and Bacteria Loadings
For sampling events conducted during baseflow conditions (mean discharge of 29 L/s), there was an average of 4.04 kg/d of TDN, 297.0 g/d of TDP, and 1.1 × 10¹⁰ of MPN/day of E. coli discharged into the Tar–Pamlico River Estuary from Jacks Creek (Table 2). During stormflow conditions (mean discharge of 276 L/s), the mean exports from Jacks Creek were 18.4 kg/d of TDN, 3026.8 g/d of TDP, and 1.3 × 10¹¹ MPN/day of E. coli (Table 2). Exports of nutrients and bacteria from Runyon Creek to the estuary during stormflow conditions (mean discharge of 1700 L/s; 232.0 kg/d of TDN; 9.2 kg/d of TDP; 4.1 × 10¹¹ MPN/day of E. coli) were also greater relative to baseflow conditions (mean discharge of 259 L/s; 95.6 kg/d of TDN; 7.5 kg/d of TDP; 8.1 × 10⁵ MPN/d of E. coli). It was expected that flow (L/s) would increase following rain events, but the mean concentrations of TDN, TDP, and E. coli were also elevated during stormflow conditions (mean of 1.78 mg/L, 0.09 mg/L, 864 MPN/100 mL) relative to baseflow conditions (1.61 mg/L, 0.08 mg/L, 80 MPN/100 mL) for Runyon Creek. A similar trend was observed for Jacks Creek for TDP (storm: 0.11 mg/L; base: 0.08 mg/L) and E. coli (storm: 490 MPN/100 mL; base: 388 MPN/100 mL). The increase in concentrations of nutrients and bacteria, coupled with higher flows following rain events, increased the pollutant exports to the Tar–Pamlico Estuary from the watersheds. These data suggest that slowing runoff in the watersheds may reduce pollutant transport.
Table 2.
Mean loadings of total dissolved nitrogen (TDN), total dissolved phosphorus (TDP), and geometric mean loadings of E. coli during baseflow and stormflow conditions. Standard deviation is shown in parentheses. RC-3 did not have measurable flow and thus was excluded from loading calculations.
When normalizing the exports by catchment area in the Jacks Creek Watershed, JC-1 contributed the highest daily loading of TDN (7.8 g/ha) and E. coli (3.0 × 10⁷ MPN/ha) during baseflow conditions, while JC-2 contributed the most TDP (0.58 g/ha). JC-4 had the greatest loadings of nutrients (61.7 g/ha of TDN; 10.4 g/ha of TDP) and E. coli (2.2 × 10⁸ MPN/d) during stormflow events (Table 3). In Runyon Creek, discharge from RC-4 contributed the most TDN (154.0 g/d) and RC-2 contributed the most TDP (4.28 g/d) per hectare during baseflow conditions, while RC-1 was responsible for the highest area-normalized loadings of E. coli during baseflow (1.0 × 10³ MPN/ha) and stormflow (1.4 × 10⁸ MPN/ha) (Table 3). Stormflow exports of TDN normalized by watershed area were greatest at RC-1 (85.1 g/ha), while RC-2 contributed the most TDP (10.6 g/ha) per day.
Table 3.
Mean and standard deviation of area-normalized loadings of total dissolved nitrogen (TDN), total dissolved phosphorus (TDP), and E. coli during baseflow and stormflow conditions. RC-3 did not have measurable flow and thus was e×cluded from loading calculations.
The hydrology of small watersheds in the Coastal Plain of North Carolina is greatly influenced by the percentage of the watershed that is impervious cover (e.g., roads, rooftops, and compacted soils). Prior research in the area [15] has shown that as the impervious percentage of a watershed increases, stormflow contributions to overall annual flow increase and baseflow contributions decrease. Hardison et al. [15] reported that the percentage of annual flow that was stormwater runoff in small NC Coastal Plain watersheds could be predicted using the following equation:
Using the above equation, stormflow would account for an estimated 53% of the total flow in Jacks Creek and about 14% total flow in Runyon Creek. Baseflow would comprise approximately 47% of the total flow for Jacks Creek and 86% for Runyon Creek.
The watershed exports of nutrients and bacteria observed at the mouths of Jacks Creek and Runyon Creek are within the ranges reported in other studies of watersheds with mostly agricultural or urban land uses. For example, daily exports of nutrients for agricultural watersheds in Illinois [64] were reported to be between 123 and 150 g/ha of N during wet years and less than 41 g/ha of N for dry years, and from 0.5 to 5.8 g/ha for TP. A study of agricultural watersheds in Ontario [65] showed daily exports between 41 and 93 g/ha TN and an average of 2.3 g/ha of TP. A study [56] of 14 streams in eastern NC showed TN exports between 3.3 and 32.6 g/ha and TP exports between 0.05 and 2.8 g/ha. Mean daily exports of E. coli from an urbanized watershed in central NC were 2.1 × 10⁷ MPN/ha [19], while the mean exports of E. coli from 24 watersheds in Georgia were 1.7 × 10⁷ MPN/ha [61]. These results suggest that the drainage discharging from Jacks Creek and Runyon Creek was comparable to nutrient and bacteria exports reported in watersheds with urban and agricultural land uses.
3.3. Physicochemical Properties of Drainage
The mean pH of water sampled from the stream segments of Jacks Creek was between 6.5 (JC-3 to JC-5) and 6.9 (JC-1) (Table 4), while water in Runyon Creek stream segments had average pH values between 6.1 (RC-3) and 7.1 (RC-6) (Table 4). These pH ranges are similar to what was reported for other streams in eastern NC, where median values were between 6.0 and 6.3 for watersheds with predominantly agricultural land uses [65] and between 5.7 and 6.5 for watersheds with mostly urban land uses [58]. The average dissolved oxygen concentration was above the NC minimum instantaneous concentration standard of 4 mg/L [66] at each of the stream segments in Runyon Creek, while all stream segments except JC-3 (3.3 mg/L) had average dissolved oxygen concentrations exceeding that value. The mean turbidity of water was below the 50 NTU threshold [66] for every stream segment in Jacks Creek, but water sampled from RC-5 (95.1 NTU) and RC-1 (67.5) exceeded the standard for streams. Specific conductance of water was highest near the mouths of Jacks Creek (305.1 µS/cm) and Runyon Creek (6950.0 µS/cm), closest to the brackish water of the estuary, and the mean temperature of water sampled from stream segments in Jacks Creek and Runyon Creek were between 17.5 and 19.3 °C and 17.2 and 21.1 °C, respectively. The mean measured discharge from Runyon Creek (1009.2 L/s) to the Tar–Pamlico Estuary was greater relative to discharge from Jacks Creek (203.2 L/s) (Table 4), likely due to the greater watershed area for Runyon Creek (3030 ha) relative to Jacks Creek (614 ha) (Table 1).
Table 4.
Mean and standard deviation of physicochemical parameters, including specific conductance (SC), oxidation reduction potential (ORP), dissolved oxygen (DO), turbidity (Turb), and flow.
3.4. Remediation Strategies
Implementation of practices within the Jacks Creek and Runyon Creek Watersheds to reduce nutrient and bacteria exports to the Tar–Pamlico Estuary is needed, given the elevated concentrations of pollutants discharging from both. The predominant (>87%) land use upstream from every sampling location in Jacks Creek was residential and/or commercial development, and the percentage of impervious surface was between 24 and 44% (Table 1). Thus, urban runoff is likely a significant driver of nutrient and bacteria loading throughout the watershed [11]. Stormwater control measures such as constructed wetlands within or near existing drainageways and bioretention in higher-elevation areas of the watershed are suggested, along with rainwater harvesting and downspout diversions to open space throughout the urbanized Jacks Creek Watershed (Figure 6). Prior studies have documented that constructed and natural wetlands can reduce nutrient and bacteria exports. For example, researchers studying a stormwater wetland in eastern NC showed outflow with lower concentrations of nitrate (69% reduction), phosphate (63% reduction), and E. coli (59% reduction) in comparison to inflow [63]. The treatment efficiency of the wetland was linked to its relatively large surface area, routine maintenance of wetland vegetation, and lower-than-average rainfall during the monitoring period. A study of two stormwater wetlands in Southwest Texas, USA [67] showed that nitrogen and phosphorus were reduced by 6 to 47% and 9 to 17%, respectively. The higher treatment efficiencies were related to a wetland with a larger surface area and longer residence time of stormwater in the cell. A 64% reduction in bacteria exports was reported for a stormwater wetland in central North Carolina [68], and a natural wetland receiving drainage from an urban watershed was able to lower phosphorus and E. coli concentrations by 85% and 57%, respectively [19]. Wetlands are typically constructed in areas where the water table is relatively close to the surface to enable the growth of wetland vegetation. Several locations in Jacks Creek between JC-1, JC-2, and JC-5 were identified where wetlands could be incorporated into the landscape (Figure 7). These areas had soil characteristics that were similar to the Altavista series, which has a seasonal-high water table within 75 cm of the surface and a sandy clay loam subsoil with permeability rates between 1.4 and 5 cm/hr [44]. These areas also had existing stormwater conveyance pipes that could be “daylighted” to discharge into the constructed wetlands.
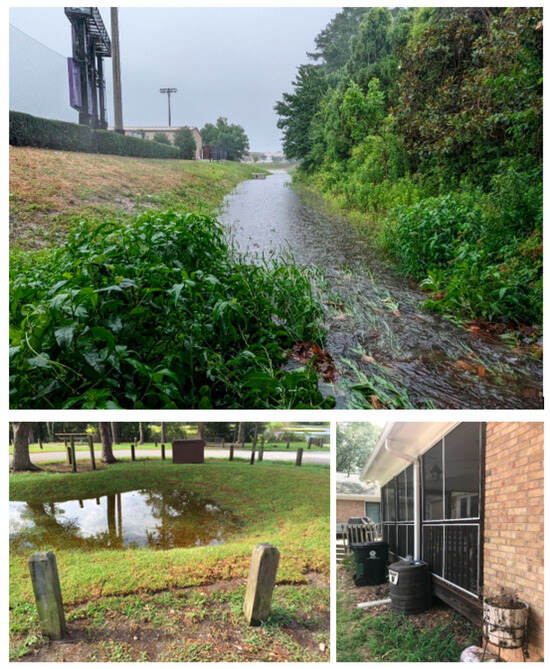
Figure 6.
Stormwater wetland (top), bioretention cell (bottom left), and rainwater harvesting with the overflow directed towards a grass lawn (bottom right) are examples of suggested runoff control measures in the Jacks Creek Watershed.
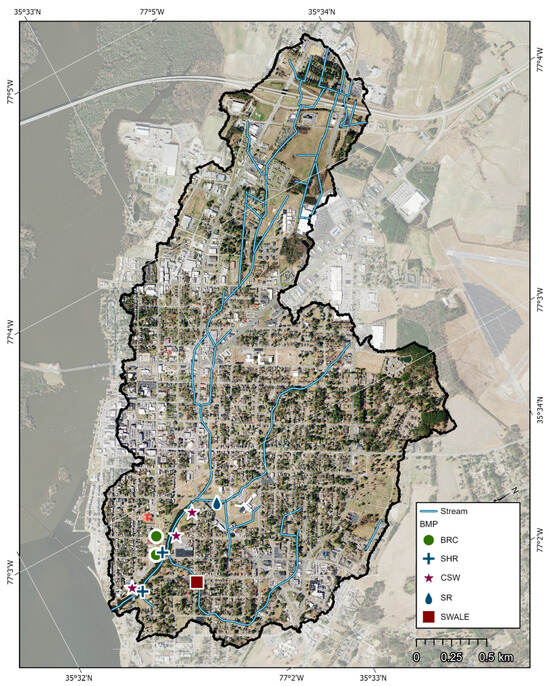
Figure 7.
Jacks Creek Watershed showing the location of suggested stormwater control measures, including bioretention cells (BRC), shoreline stabilization (SHR), constructed stormwater wetlands (CSW), stream restoration (SR), and vegetated swales.
In areas of the watershed with deeper water tables, bioretention (Figure 6), which requires infiltration of stormwater and a vadose zone of 0.6 m or more, may be more suitable for stormwater management. Research on bioretention cells has shown that they can be very effective at nutrient and bacteria treatment. For example, a bioretention cell in Charlotte, North Carolina, was able to lower exports of stormwater-transported nitrogen, phosphorus, and bacteria by 32%, 31%, and 71%, respectively [68]. A study of a bioretention cell in Chapel Hill, North Carolina, reported nitrogen and phosphorus reductions of 40 and 65% [69]. Effluent concentrations of E. coli were 91% lower relative to influent concentrations for a bioretention cell in the Piedmont of NC [68]. Thus, bioretention is a good option where there is open space for the construction and the water table is deep enough to allow for infiltration of stormwater during wet periods. Some potential locations for bioretention in the Jacks Creek Watershed are shown in Figure 7. These locations were selected because the soils at those sites exhibited characteristics similar to the Seabrook series. The Seabrook series is sandy, permeable (15 cm/h to 51 cm/h), and moderately well drained [44]. There was also enough vacant area to support the installation of the bioretention cells. These areas are near parks, and thus, there is potential for educational signage and incorporation of the practices into local environmental outreach programs.
While stormwater wetlands and bioretention cells require conversion of existing land for the construction of the practices, rain harvesting systems and disconnection of downspouts that outlet on impervious surfaces (Figure 6) require much less disturbance and land conversion and can be very cost effective [70]. For example, runoff volume reductions at the site-scale of 49 to 99% were reported for four sites in Durham, NC, where downspout diversions to open lawns were evaluated. Runoff reductions were inversely related to the slope of the lawns and the loading ratio (roof area/lawn area). Research in Buffalo, NY [71], reported that if sized appropriately (3780-L capacity for residential sites and 18,900-L capacity for commercial facilities), rainwater harvesting systems and downspout disconnects could reduce runoff volumes by up to 24% for the entire city. However, these practices would require cooperation by home and business owners throughout the watershed. Research has shown that while the number of people stating they would be willing to adopt control measures in hypothetical scenarios is significantly greater than the percentage that would officially commit to the installations [72]. Educational outreach programs would likely be needed to garner support.
Reducing the volume and timing of runoff during rain events in urban environments is important so that the banks and beds of streams and drainageways do not erode [19,73,74]. Streambank stabilization may be required in some areas to prevent the drainageway from becoming a source of sediment and sediment-bound pollutants to downstream ecosystems [19]. There are several locations in the Jacks Creek Watershed where shoreline repair and stabilization are needed (Figure 7). Some work stabilizing eroding banks near JC-2 has been accomplished. These practices and control measures are suggested as a starting point to improve water quality discharging to the Tar–Pamlico Estuary from Jacks Creek.
For the Runyon Creek Watershed, which is predominantly agricultural land use upstream from every sampling location (32 to 84%), a combination of controlled drainage and nutrient management is suggested. Controlled drainage is a best-management practice that enables farm operators to manipulate the outlet elevation of their drainage system by adding (raising the elevation) or removing (lowering the elevation) boards from a control structure installed in a ditch [75] (Figure 8). Research in North Carolina [11] and Indiana [75] has shown that if properly managed, controlled drainage can reduce outflow volumes from farms by 30% to 39%, respectively. Researchers [11] reported nitrogen and phosphorus exports were reduced by 45% and 35%, respectively, due to a reduction in outflow, enhanced crop uptake of nutrients, and denitrification (N loss). Other researchers [75] reported mean nitrogen and TP reductions of 58% and 32%, respectively, with controlled drainage. This practice is popular with farmers because it does not take land out of production and can increase crop yields during dry periods [75]. Significant reductions in exports of pathogens have also been reported with the use of controlled drainage [76].
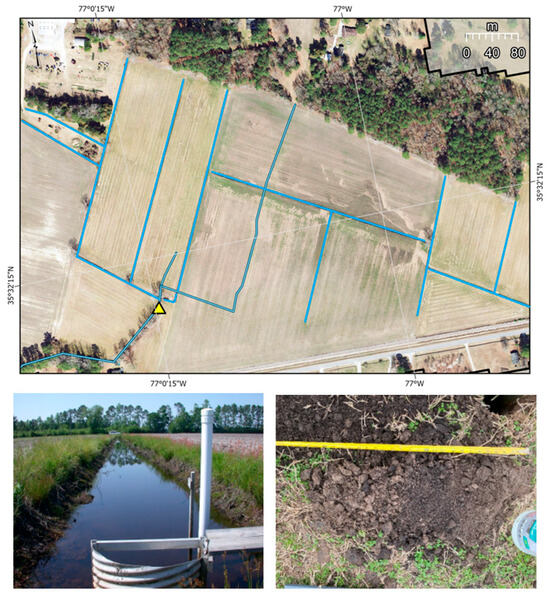
Figure 8.
Extensive drainage networks (top), shown as blue lines in the Runyon Creek Watershed, lend themselves to controlled drainage (bottom left) where the outflow from many hectares of fields can be managed by a single structure (yellow triangle). Nutrient management, including soil sampling for fertility status (bottom right), can be implemented along with controlled drainage, and when combined, they can reduce nutrient and bacteria exports.
The northern portion of the Runyon Creek Watershed (RC-1 and RC-2), where some of the highest normalized exports of nutrients and bacteria are generated, has intensive drainage networks, including open ditches and canals that were installed to lower the water table and improve trafficability to enable agricultural production. The region has a flat topography (<1% slope), and the dominant soils are somewhat poorly to poorly drained Lenoir and Leaf series [44]. Water control structures could be installed near the outlets of several farms to reduce outflows, thus reducing nutrient and bacteria exports. Examples of potential locations for such structures are shown in Figure 9. Maintenance of nutrient management plans for the cropland in Runyon Creek could also be implemented. Nutrient management includes collecting soil samples from fields for fertility analyses and prescribing fertilizer application rates based on crop needs and soil fertility status [77]. The plans also include information regarding the type of fertilizer used, application methods and timing, and use of cover crops and other best management practices. Studies have shown that if nutrient management plans are followed, reductions in nitrogen and phosphorus loadings can be over 45% [77,78]. However, there are challenges to changing the way farmers manage their lands regarding nutrient applications, as many think of applying excess nutrients as “insurance” for obtaining good yields [48]. Thus, it may require routine interactions between educational/technical outreach experts and farmers to build trust and enact change [48,77].
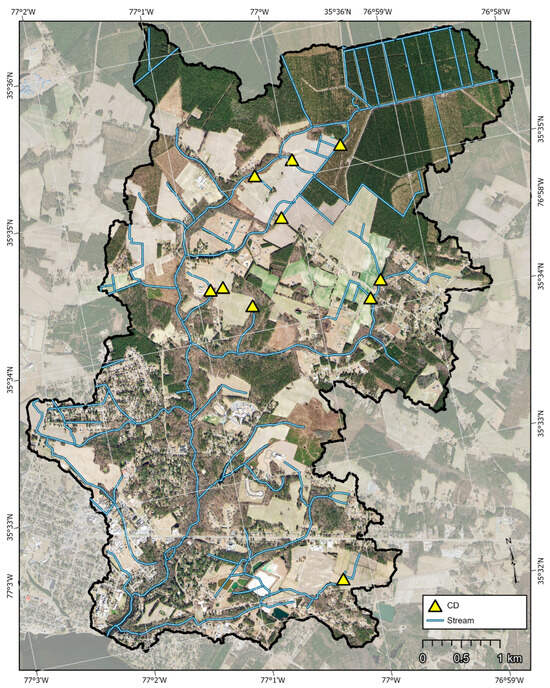
Figure 9.
Suggested locations of controlled drainage water structures to reduce outflow volumes of water from agricultural fields. These practices, in combination with nutrient management plans, can be implemented to reduce nutrient and bacteria exports.
The implementation of these suggested practices in the Jacks Creek and Runyon Creek watersheds may improve water quality by reducing the transport of nutrients and bacteria from urban and agricultural lands to the estuary. The water quality monitoring and land use data collected and analyzed during this project are being incorporated into a watershed assessment plan for Jacks Creek and Runyon Creek. If the plans are approved by the NC Department of Environmental Quality, then local governments, non-profits, and universities will be eligible to apply for funding via the NC DEQ 319 non-point source program [79] to implement the best management practices. Practices including bioretention, water control structures, and stormwater wetlands were constructed with funds from the NC DEQ 319 program in other watersheds with approved assessment plans [19,26,40].
4. Conclusions
This study documented that mean concentrations of TDN, TDP, and E. coli discharged from Jacks Creek and Runyon Creek to the Tar–Pamlico Estuary exceeded US EPA reference conditions for nutrients (TN of 0.69 mg/L; and TP of 0.036 mg/L) and E. coli (geometric mean of 126 MPN/100 mL). The dominant land use in Jacks Creek was urban development, while Runyon Creek was mostly in agricultural production. Overall, there were higher exports of TDN and TDP from Runyon Creek to the estuary, and higher exports of E. coli contributed to the estuary by Jacks Creek. Mitigation of the pollutant exports is needed. Practices to improve water quality by reducing nutrient and bacteria runoff, including construction of stormwater wetlands, bioretention cells, rainwater harvesting and downspout disconnection, shoreline stabilization, and stream stabilization/restoration, are suggested for the urbanizing Jacks Creek. Agricultural best management practices, such as controlled drainage and nutrient management, are suggested for the more rural Runyon Creek. While this study was conducted solely in Coastal North Carolina, other regions of the world [5,6,14] have also experienced problems associated with excess nutrients in surface waters linked to urban and agricultural runoff. The watershed assessment methods and suggested remediation strategies outlined in this research may be beneficial to other communities confronting similar problems.
There are many challenges regarding land use management of the Jacks Creek and Runyon Creek Watersheds. Some climate experts [80] predict that Coastal North Carolina will experience more frequent extreme weather events such as drought, tropical storms with intense rain, and increased temperatures. If these models are correct, then the delivery of nutrients and bacteria to the estuary will also change, as most stormwater control measures are typically designed to store and treat runoff from a 2.54 cm rain event. If larger (than 2.54 cm) rains become more common, then stormwater control measures may become less effective [14]. More frequent droughts could reduce crop yields, thus allowing for increased buildup of fertilizers in agricultural fields and increasing the likelihood of leaching or runoff when the higher intensity rains arrive later [81]. Increases in temperature and nutrients to the estuary may stimulate harmful algal blooms [3,6], which have been problematic for decades. In addition to the climate-related challenges, implementation of some of the suggested control measures will require educational outreach efforts to property owners/managers to gain their cooperation, technical expertise to design and install the suggested practices, and funding to pay for the professional services. The suggested practices will require maintenance to ensure they are functioning as intended, and thus future research should include continued monitoring to document any changes observed as a result of the installed practices and/or needs for additional or different remediation efforts as climate and watershed characteristics change.
Author Contributions
Conceptualization, C.H. and G.I.; methodology, C.H., G.I., J.D. and A.S.; software, C.H. and G.I.; validation, C.H., G.I., J.D. and A.S.; formal analysis, C.H., G.I., J.D. and A.S.; investigation, C.H., G.I., J.D. and A.S.; resources, C.H. and G.I.; data curation, C.H., G.I., J.D. and A.S.; writing—original draft preparation, C.H.; writing—review and editing, C.H. and G.I.; visualization, C.H. and G.I.; supervision, C.H. and G.I.; project administration, C.H.; funding acquisition, C.H. and G.I. All authors have read and agreed to the published version of the manuscript.
Funding
This research was funded by Sound Rivers, grant numbers AWD-22-0570 and AWD-23-0359. The APC was funded via a waiver.
Data Availability Statement
Raw data can be made available upon request by contacting the corresponding author.
Acknowledgments
The authors would like to thank the project partners, including Sound Rivers, Kris Bass Engineering, and the City of Washington, NC.
Conflicts of Interest
The authors declare no conflicts of interest.
References
- Jordan, M.A.; Rogers, S.R. A new perspective on water quality: Exploring spatial and temporal patterns of impaired waters. J. Environ. Manag. 2024, 359, 120983. [Google Scholar] [CrossRef]
- US EPA National Water Quality Inventory: Report to Congress. 2017. EPA 841-R-16-011. Available online: https://www.epa.gov/sites/default/files/2017-12/documents/305brtc_finalowow_08302017.pdf (accessed on 15 August 2025).
- Paerl, H.W.; Otten, T.G.; Joyner, A.R. Moving towards adaptive management of cyanotoxin-impaired water bodies. Microb. Biotechnol. 2016, 9, 641–651. [Google Scholar] [CrossRef]
- Huang, H.; Ciais, P.; Goll, D.S.; Sardans, J.; Penuelas, J.; Cresto-Aleina, F.; Zhang, H. The shift of phosphorus transfers in global fisheries and aquaculture. Nat. Commun. 2020, 11, 355. [Google Scholar] [CrossRef]
- Carmichael, W.W. Health effects of toxin producing cyanobacteria: The cyanoHABs. Hum. Ecol. Risk Assess. 2001, 7, 1393–1407. [Google Scholar] [CrossRef]
- Paerl, H.W. Mitigating harmful cyanobacterial blooms in a human-and climatically-impacted world. Life 2014, 4, 988–1012. [Google Scholar] [CrossRef]
- Ahrends, H.E.; Siebert, S.; Rezaei, E.E.; Seidel, S.J.; Huging, H.; Ewert, F.; Doring, T.; Rueda-Ayala, V.; Eugster, W.; Gaiser, T. Nutrient supply affects the yield stability of major European crops—A 50 year study. Environ. Res. Lett. 2021, 16, 014003. [Google Scholar] [CrossRef]
- Sun, Z.; Yang, R.; Wang, J.; Zhou, P.; Gong, Y.; Gao, F.; Wang, C. Effects of nutrient deficiency of crop yield and soil nutrients under winter wheat-summer maize rotation system in the North China Plain. Agronomy 2024, 14, 2690. [Google Scholar] [CrossRef]
- Tilman, D.; Cassman, K.G.; Matson, P.A.; Naylor, R.; Polasky, S. Agricultural sustainability and intensive production practices. Nature 2002, 418, 671–677. [Google Scholar] [CrossRef]
- Ghane, E.; Ranaivoson, A.Z.; Feyereisen, G.W.; Rosen, C.J.; Moncrief, J.F. Comparison of contaminant transport in agricultural drainage water and urban stormwater runoff. PLoS ONE 2016, 11, e0167834. [Google Scholar] [CrossRef]
- Osmond, D.L.; Gilliam, J.W.; Evans, R.O. Riparian Buffers and Controlled Drainage to Reduce Agricultural Nonpoint Source Pollution. In NC Agricultural Research Service Technical Bulletin 318; North Carolina State University: Raleigh, NC, USA, 2023; Available online: https://content.ces.ncsu.edu/riparian-buffers-and-controlled-drainage-to-reduce-agricultural-nonpoint-source-pollution (accessed on 15 August 2025).
- Beman, J.M.; Arrigo, K.R.; Matson, P.A. Agricultural runoff fuels large phytoplankton blooms in vulnerable aeras of the ocean. Nature 2005, 434, 211–214. [Google Scholar] [CrossRef]
- Chen, N.; Hong, H. Nitrogen export by surface runoff from a small agricultural watershed in southeast China: Seasonal pattern and primary mechanism. Biogeochemistry 2011, 106, 311–321. [Google Scholar] [CrossRef]
- Qui, S.; Yin, H.; Deng, J.; Li, M. Cost-effectiveness of green-gray stormwater control measures for non-point source pollution. Int. J. Environ. Res. Public Health 2020, 17, 998. [Google Scholar] [CrossRef]
- Hardison, E.C.; O’Driscoll, M.; DeLoatch, J.P.; Howard, R.J.; Brinson, M.M. Urban Land Use, Channel Incision, and Water Table Decline Along Coastal Plain Streams, North Carolina. J. Am. Water Resour. Assoc. 2009, 45, 1032–1046. [Google Scholar] [CrossRef]
- US Environmental Protection Agency. NPDES Stormwater Program. Available online: https://www.epa.gov/npdes/npdes-stormwater-program (accessed on 24 October 2025).
- US EPA Recreational Water Quality Criteria. EPA-820-F-12-061. Available online: https://www.epa.gov/sites/default/files/2015-10/documents/rec-factsheet-2012.pdf (accessed on 28 May 2025).
- Webster, L.F.; Thompson, B.C.; Fulton, M.H.; Chestnut, D.E.; Van Dolah, R.F.; Leight, A.K.; Scott, G.I. Identification of sources of Escherichia coli in South Carolina estuaries using antibiotic resistance analysis. J. Exp. Mar. Biol. Ecol. 2004, 298, 179–195. [Google Scholar] [CrossRef]
- Humphrey, C.; Underwood, J.; Iverson, G.; Etheridge, R.; O’Driscoll, M.; White, A. Evaluation of Phosphate and E. coli Attenuation in a Natural Wetland Receiving Drainage from an Urbanized Catchment. Hydrology 2024, 11, 74. [Google Scholar] [CrossRef]
- Iverson, G.; Humphrey, C.P., Jr.; O’Driscoll, M.; Bell, N.; Hoben, J. How do malfunctioning onsite wastewater systems influence water quality? Assessing treatment of nutrient and Escherichia coli in central North Carolina. J. Environ. Manag. 2024, 371, 123324. [Google Scholar] [CrossRef]
- Sercu, B.; Van De Werfhorst, L.C.; Murray, J.L.S.; Holden, P.A. Sewage exfiltration as a source of storm drain contamination during dry weather in urban watersheds. Environ. Sci. Technol. 2011, 45, 7151–7157. [Google Scholar] [CrossRef]
- Kirs, M.; Kisand, V.; Wong, M.; Caffaro-Filho, R.A.; Moravcik, P.; Harwood, V.J.; Yoneyama, B.; Fujioka, R.S. Multiple lines of evidence to identify sewage as the cause of water quality impairment in an urbanized tropical watershed. Water Res. 2017, 116, 23–33. [Google Scholar] [CrossRef]
- Kaushal, S.S.; Groffman, P.M.; Band, L.E.; Elliott, E.M.; Shields, C.A.; Kendall, C. Tracking nonpoint source nitrogen pollution in human-impacted watersheds. Environ. Sci. Technol. 2011, 45, 8225–8232. [Google Scholar] [CrossRef]
- Edge, T.A.; Hill, S. Multiple lines of evidence to identify the sources of fecal pollution at a freshwater beach in Hamilton Harbour, Lake Ontario. Water Res. 2007, 41, 3585–3594. [Google Scholar] [CrossRef]
- Ram, J.L.; Thompson, B.; Turner, C.; Nechvatal, J.M.; Sheehan, H.; Bobrin, J. Identification of pets and raccoons as sources of bacterial contamination of urban storm sewers using a sequence-based bacterial source tracking method. Water Res. 2007, 41, 3605–3614. [Google Scholar] [CrossRef]
- Humphrey, C.P., Jr.; Lyons, N.; Bond, R.; Bean, E.; O’Driscoll, M.; White, A. Assessment and Mitigation of Fecal Bacteria Exports from a Coastal North Carolina Watershed. Hydrology 2023, 10, 156. [Google Scholar] [CrossRef]
- Jacquemin, S.J.; Birt, J.; Senger, Z.; Axe, B.; Strang, B.; Ewing, C.; Kinney, B.; Newell, S.E. On the potential for reconstructed wetlands to remediate fecal coliform loading in an agricultural watershed. Hydrobiologia 2023, 850, 3879–3891. [Google Scholar] [CrossRef]
- Browning, D.A.; Mausbach, W.E.; Stookey, C.; Nikolai, S.J.; Barrow, J.; Townsend II, D.E. Validating microbial source tracking markers and assessing the efficacy of culturable E. coli and Enterococci assays in Ozark streams, USA. Water Air Soil Pollut. 2023, 234, 348. [Google Scholar] [CrossRef]
- Kelsey, H.; Porter, D.E.; Scott, G.; Neet, M.; White, D. Using geographic information system and regression analysis to evaluate relationships between land use and fecal coliform bacterial pollution. J. Exp. Mar. Biol. Ecol. 2004, 298, 197–209. [Google Scholar] [CrossRef]
- Ervin, J.S.; Van De Werfhorst, L.C.; Murray, J.L.; Holden, P.A. Microbial source tracking in a coastal California watershed reveals canines as controllable sources of fecal contamination. Environ. Sci. Technol. 2014, 48, 9043–9052. [Google Scholar] [CrossRef]
- Flood, M.T.; Hernandez-Suarez, J.S.; Nehadhashemi, A.P.; Martin, S.L.; Hyndman, D.; Rose, J.B. Connecting microbial, nutrient, physicochemical, and land use variables for the evaluation of water quality within mixed use watersheds. Water Res. 2022, 219, 118526. [Google Scholar] [CrossRef]
- Shanks, O.C.; Diedrich, A.; Sivaganesan, M.; Willis, J.R.; Sharifi, A. Quantitative fecal source characterization of urban municipal storm sewer system outfall ‘wet’ and ‘dry’ weather discharges. Water Res. 2024, 259, 121857. [Google Scholar] [CrossRef]
- Leight, A.K.; Hood, R.R. Precipitation thresholds for fecal bacteria indicators in the Chesapeake Bay. Water Res. 2018, 139, 252–262. [Google Scholar] [CrossRef]
- Hunt, W.F.; Smith, J.T.; Jadlocki, S.J.; Hathaway, J.M.; Eubanks, P.R. Pollutant removal and peak flow mitigation by a bioretention cell in urban Charlotte, N.C. J. Environ. Eng. 2008, 134, 403–408. [Google Scholar] [CrossRef]
- Palmer, E.T.; Poor, C.J.; Hinman, C.; Stark, J.D. Nitrate and phosphate removal through enhanced bioretention media: Mesocosm study. Water Environ. Res. 2013, 85, 823–832. [Google Scholar] [CrossRef]
- Collins, K.A.; Lawrence, T.J.; Stander, E.K.; Jontos, R.J.; Kaushal, S.S.; Newcomer, T.A.; Grimm, N.B.; Ekberg, M.L.C. Opportunities and challenges for managing nitrogen in urban stormwater: A review and synthesis. Ecol. Eng. 2010, 36, 1507–1519. [Google Scholar] [CrossRef]
- Sittig, S.; Sur, R. Runoff mitigation on agricultural fields via micro-dams—literature review and derivation of runoff curve number reductions. Environ. Res. 2023, 238, 117128. [Google Scholar] [CrossRef]
- Beutel, M.W.; Morgan, M.R.; Erlenmeyer, J.J.; Brouillard, E.S. Phosphorus removal in a surface-flow constructed wetland treating agricultural runoff. J. Environ. Qual. 2014, 43, 1071–1080. [Google Scholar] [CrossRef]
- Hsu, C.Y.; Yan, G.E.; Pan, K.C.; Lee, K.C. Constructed wetlands as a landscape management practice for nutrient removal from agricultural runoff- a local practice case on the east coast of Taiwan. Water 2021, 13, 1973. [Google Scholar] [CrossRef]
- Humphrey, C.P.; Iverson, G. Reduction in nitrogen exports from stormflow after conversion of a dry detention basin to a stormwater wetland. Appl. Sci. 2020, 10, 9024. [Google Scholar] [CrossRef]
- Humphrey, C.P.; Iverson, G.; Nolan, M. Nitrogen treatment by a dry detention basin with stormwater wetland characteristics. Hydrology 2022, 9, 85. [Google Scholar] [CrossRef]
- Wissler, A.D.; Hunt, W.F.; McLaughlin, R.A. Hydrologic and water quality performance of two aging and unmaintained dry detention basins receiving highway stormwater runoff. J. Environ. Manag. 2020, 255, 109853. [Google Scholar] [CrossRef]
- Nobles, A.L.; Goodall, J.L.; Fitch, M. Comparing costs of onsite best management practices to nutrient credits for stormwater management: A case study in Virginia. J. Am. Water Resour. Assoc. 2016, 53, 131–143. [Google Scholar] [CrossRef]
- Natural Resources Conservation Service. Official Soil Series Descriptions (OSDs). Available online: https://www.nrcs.usda.gov/resources/data-and-reports/official-soil-series-descriptions-osds (accessed on 26 October 2025).
- NC Department of Agriculture & Consumers Services Agricultural Statistics—County Estimates. Available online: https://www.ncagr.gov/divisions/agricultural-statistics/agricultural-statistics-county-estimates (accessed on 26 October 2025).
- Franzluebbers, A.J. Soil-test biological activity with the flush of CO2: III. Corn yield responses to applied nitrogen. Soil& Water Management & Conservation. Soil Sci. Soc. Am. J. 2018, 82, 708–721. [Google Scholar] [CrossRef]
- Morales, N.A.; Gatiboni, L.; Osmond, D.; Vann, R.; Kulesza, S.; Crozier, C.; Hardy, D. Critical soil test values of phosphorus and potassium for soybean and corn in three long-term trials in North Carolina. Soil Sci. Soc. Am. J. 2023, 87, 278–290. [Google Scholar] [CrossRef]
- Kile, L.K.; Gatiboni, L.; Osmond, D.L.; Marshall, A.M.; Johnson, A.; Duckworth, O.W. Why does overapplication of phosphorus fertilizers occur: Insights from North Carolina Farmers. Agriculture 2025, 15, 606. [Google Scholar] [CrossRef]
- U.S. Climate Data. Washington, NC. Available online: https://www.usclimatedata.com/climate/washington/north-carolina/united-states/usnc1127 (accessed on 18 August 2025).
- NC Department of Environmental Quality. Tar-Pamlico Nutrient Strategy. Available online: https://www.deq.nc.gov/about/divisions/water-resources/water-planning/nonpoint-source-planning/tar-pamlico-nutrient-strategy (accessed on 25 August 2025).
- Ludwig-Monty, S.; Heffernan, J. Spatial and Temporal Analysis of Long-Term Water Quality Data for the Pamlico River Estuary, North Carolina. Master’s Thesis, Duke University, Durham, NC, USA, 2015. Available online: https://dukespace.lib.duke.edu/server/api/core/bitstreams/8fb2857e-b51b-402c-870f-243ed390df6f/content (accessed on 10 September 2025).
- NC Department of Environmental Quality. Recreational Water Quality. Available online: https://www.deq.nc.gov/about/divisions/marine-fisheries/shellfish-sanitation-and-recreational-water-quality/recreational-water-quality#SwimmingAdvisoryList-4002 (accessed on 15 August 2025).
- US EPA Ambient Water Quality Criteria Recommendations: Information Supporting the Development of State and Tribal Nutrient Criteria for Rivers and Streams in Nutrient Ecoregion IX. Report 822-B-00-019. Available online: https://www.epa.gov/sites/production/files/documents/rivers9.pdf (accessed on 28 May 2025).
- Kebedew, M.G.; Tsegaye, S.; James, A.; Bottcher, A.D.; Albrecht, K.K.; Rotz, R. Understanding nutrient loading in a hydrologically sensitive coastal watershed. The Peace River watershed, Florida, USA. Environ. Process. 2025, 12, 40. [Google Scholar] [CrossRef]
- Rixon, S.; May, H.; Persaud, E.; Elsayed, A.; Levison, J.; Binns, A.; Goel, P. Subsurface influences on watershed nutrient concentrations and loading in a clay dominated agricultural system. J. Hydrol. 2024, 645, 132140. [Google Scholar] [CrossRef]
- Spruill, T.B.; Tesoriero, A.J.; Mew, H.E., Jr.; Farrel, K.M.; Harden, S.L.; Colosimo, A.B.; Kraemer, S.R. Geochemistry and Characteristics of Nitrogen Transport at a Confined Animal Feeding Operation in a Coastal Plain Agricultural Watershed, and Implications for Nutrient Loading in the Neuse River Basin, North Carolina, 1999–2002; US Geological Survey Scientific Investigations Report 2004-5283; US Geological Survey Scientific Investigations: Reston, VA, USA, 2005; p. 57.
- Iverson, G.; O’Driscoll, M.A.; Humphrey Jr, C.P.; Manda, A.K.; Anderson-Evans, E. Wastewater nitrogen contributions to coastal plain watersheds, NC, USA. Water Air Soil Pollut. 2015, 226, 325. [Google Scholar] [CrossRef]
- Humphrey, C.P.; O’Driscoll, M.; Iverson, G.; Anderson-Evans, E. Is onsite wastewater a significant source of phosphorus to coastal plain streams? Int. J. Environ. Sci. Technol. 2019, 17, 1199–1210. [Google Scholar] [CrossRef]
- Iverson, G.; Humphrey, C.P., Jr.; O’Driscoll, M.A.; Sanderford, C.; Jernigan, J.; Serozi, B. Nutrient exports from watersheds with varying septic system densities in the North Carolina Piedmont. J. Environ. Manag. 2018, 211, 206–217. [Google Scholar] [CrossRef]
- Neher, T.P.; Ma, L.; Moorman, T.B.; Howe, A.; Soupir, M.L. Seasonal variations in export of antibiotic resistance genes and bacteria in runoff from an agricultural watershed in Iowa. Sci. Total Environ. 2020, 738, 140224. [Google Scholar] [CrossRef]
- Sowah, R.; Zhang, H.; Radcliffe, D.; Bauske, E.; Habteselassie, M.Y. Evaluating the influence of septic systems and watershed characteristics on stream faecal pollution in suburban watersheds in Georgia, USA. J. Appl. Microbiol. 2014, 117, 1500–1512. [Google Scholar] [CrossRef]
- Iverson, G.; Humphrey, C.P.; Postma, M.H.; O’Driscoll, M.A.; Manda, A.K.; Finley, A. Influence of sewered versus septic systems on watershed exports of E. coli. Water Air Soil Pollut. 2017, 228, 237. [Google Scholar] [CrossRef]
- Humphrey, C.; Chaplinski, N.; O’Driscoll, M.; Kelley, T.; Richards, S. Nutrient and E. coli Attenuation in a Constructed Stormwater Wetland in the North Carolina Coastal Plain. Environ. Nat. Resour. Res. 2014, 4, 12–22. [Google Scholar] [CrossRef]
- Royer, T.V.; David, M.B.; Gentry, L.E. Timing of Riverine Export of Nitrate and Phosphorus from Agricultural Watersheds in Illinois: Implications for Reducing Nutrient Loading to the Mississippi River. Environ. Sci. Technol. 2006, 40, 4126–4131. [Google Scholar] [CrossRef]
- Harden, S.L. Surface-Water Quality in Agricultural Watersheds of the North Carolina Coastal Plain Associated with Concentrated Animal Feeding Operations; U.S. Geological Survey Scientific Investigations Report 2015-5080; U.S. Geological Survey Scientific Investigations: Reston, VA, USA, 2015; p. 55. [Google Scholar] [CrossRef]
- North Carolina Department of Environmental Quality Surface Water Standards. 2022. Available online: https://www.deq.nc.gov/about/divisions/water-resources/water-planning/classification-standards/surface-water-standards (accessed on 5 September 2025).
- Guerrero, J.; Mahmoud, A.; Alam, T.; Chowdhury, M.A.; Adetayo, A.; Ernest, A.; Jones, K.D. Water quality improvement and pollutant removal by two regional detention facilities with constructed wetlands in South Texas. Sustainability 2020, 12, 2844. [Google Scholar] [CrossRef]
- Hathaway, J.M.; Hunt, W.F.; Jadlocki, S. Indicator Bacteria Removal in Storm-Water Best Management Practices in Charlotte, North Carolina. J. Environ. Eng. 2009, 135, 1275–1285. [Google Scholar] [CrossRef]
- Hunt, W.F.; Jarret, A.R.; Smith, J.T.; Sharkey, L.J. Evaluating bioretention hydrology and nutrient removal at three field sites in North Carolina. J. Irrig. Drain. Eng. 2006, 132, 600–608. [Google Scholar] [CrossRef]
- Carmen, N.B.; Hunt, W.F.; Anderson, R.A. Volume Reduction Provided by Eight Residential Disconnected Downspouts in Durham, North Carolina. J. Environ. Eng. 2016, 142, 05016002. [Google Scholar] [CrossRef]
- Ghodsi, S.H.; Zhu, Z.; Ghelth, H.; Rabideau, A.J.; Torres, M.T.; Meindl, K. Modeling the effectiveness of rain barrels, cisterns, and downspout disconnections for reducing combined sewer overflows in a city-scale watershed. Water Resour. Manag. 2021, 35, 2895–2908. [Google Scholar] [CrossRef]
- Fleming, P.M.; Savchenko, O.M. Intention versus action: Household adoption of best management practices for water quality. Water Resour. Res. 2022, 58, e2021WRO29684. [Google Scholar] [CrossRef]
- Walsh, C.J.; Roy, A.H.; Feminella, J.W.; Cottingham, P.D.; Groffman, P.M.; Morgan, R.P., II. The urban stream syndrome: Current knowledge and the search for a cure. J. N. Am. Benthol. Soc. 2005, 24, 706–723. [Google Scholar] [CrossRef]
- Saadat, S.; Bowling, L.; Frankenberger, J.; Kladivko, E. Nitrate and phosphorus transport through subsurface drains under free and controlled drainage. Water Res. 2018, 142, 196–207. [Google Scholar] [CrossRef]
- Youssef, M.A.; Strock, J.; Bagheri, E.; Reinhart, B.D.; Abendroth, L.J.; Chighladze, G.; Ghane, E.; Shedekar, V.; Fausey, N.R.; Frankenberger, J.R.; et al. Impacts of controlled drainage on corn yield under varying precipitation patterns: A synthesis of studies across the US Midwest and Southeast. Agric. Water Manag. 2023, 275, 107993. [Google Scholar] [CrossRef]
- Lie, L.; Cloutier, M.; Craiovan, E.; Edwards, M.; Frey, S.K.; Gottschall, N.; Lapen, D.R.; Sunohara, M.; Topp, E.; Khan, I.U.H. Quantitative real-time PCR-based assessment of tile drainage management influences on bacterial pathogens in tile drainage and groundwater. Sci. Total Environ. 2018, 624, 1586–1597. [Google Scholar] [CrossRef]
- Herendeen, N.; Glazier, N. Agricultural best management practices for Conesus Lake: The role of extension and soil/water conservation districts. J. Great Lakes Res. 2009, 35, 15–22. [Google Scholar] [CrossRef]
- Gitau, M.W.; Gburek, W.J.; Jarrett, A.R. A tool for estimating best management practice effectiveness for phosphorus pollution control. J. Soil Water Conserv. 2005, 60, 1–10. [Google Scholar] [CrossRef]
- North Carolina Department of Environmental Quality 319 Grant Program. Available online: https://www.deq.nc.gov/about/divisions/water-resources/water-planning/nonpoint-source-planning/319-grant-program (accessed on 15 September 2025).
- Kunkel, K.E.; Easterling, D.R.; Ballniger, S.; Bililign, S.; Champion, S.M.; Corbett, D.R.; Dello, K.D.; Dissen, J.; Lackmann, G.M.; Luettich, R.A.; et al. North Carolina Climate Science Report. 2020. North Carolina Institute for Climate Studies. Available online: https://ncics.org/nccsr (accessed on 29 October 2025).
- Shepherd, M.; Lucci, G.; Vogeler, I.; Balvert, S. The effect of drought and nitrogen fertilizer addition on nitrate leaching risk from a pasture soil; as assessment from a field experiment and modelling. J. Sci. Food Agric. 2018, 98, 3795–3805. [Google Scholar] [CrossRef] [PubMed]


Disclaimer/Publisher’s Note: The statements, opinions and data contained in all publications are solely those of the individual author(s) and contributor(s) and not of MDPI and/or the editor(s). MDPI and/or the editor(s) disclaim responsibility for any injury to people or property resulting from any ideas, methods, instructions or products referred to in the content. |
© 2025 by the authors. Licensee MDPI, Basel, Switzerland. This article is an open access article distributed under the terms and conditions of the Creative Commons Attribution (CC BY) license (https://creativecommons.org/licenses/by/4.0/).