Article

Impact Analysis of Climate Change on Hydropower Resource Development in the Vakhsh River Basin of Tajikistan

by
Hailong Liu
1,2,*,
Aminjon Gulakhmadov
3 and
Firdavs Shaimuradov
3
1
Xinjiang Institute of Ecology and Geography, Chinese Academy of Sciences, Urumqi 830011, China
2
School of Resources and Environment, University of Electronic Science and Technology of China, Chengdu 611731, China
3
Institute of Water Problems, Hydropower and Ecology of the National Academy of Sciences of Tajikistan, Dushanbe 734042, Tajikistan
*
Author to whom correspondence should be addressed.
Hydrology 2025, 12(11), 294; https://doi.org/10.3390/hydrology12110294
Submission received: 29 September 2025 / Revised: 2 November 2025 / Accepted: 4 November 2025 / Published: 5 November 2025
(This article belongs to the Topic Advances in Hydrological Remote Sensing)

Abstract

With increasing energy demands and environmental pressures, hydropower, as a clean and renewable energy source, has attracted widespread attention for its development and utilization. However, hydropower systems are highly sensitive to climate change, significantly impacting generation, management, and safety. This study addresses the stability of hydropower resources in the Vakhsh River Basin, Tajikistan, using digital analysis, snowmelt runoff simulation, and soil erosion assessment to estimate spatial distribution. Under three climate scenarios (RCP2.6, RCP4.5, and RCP8.5), hydropower trends were simulated, and soil erosion was quantified. Results show annual hydropower potentials: Garm (55.465 billion kWh/a), Rogun (112.737 billion kWh/a), Nurex (78.853 billion kWh/a). Across all scenarios, runoff and hydropower generation increase (162–328,108 kWh/a), with growth rates following RCP4.5 < RCP2.6 < RCP8.5. Soil erosion simulation results indicate that a one millimeter increase in precipitation could lead to sediment deposition of 1.57 × 10⁶ kWh/year in upstream reservoirs. These results demonstrate that climate change has a significant impact on hydropower development in the Vakhsh River Basin. The research provides technical support for hydropower development under climate change.

1. Introduction

With the growing population and continuous socioeconomic development, energy demand and environmental pressures are increasing [1,2]. As a clean and renewable energy source, hydropower exhibits characteristics such as renewability, cost-effectiveness, accessibility, and high efficiency, making its development and utilization widely recognized [3].
With the continuous growth of energy demand and the escalating impacts of global climate change [4], countries worldwide have prioritized hydropower development as a key focus of energy strategy and a shared choice for addressing climate change and achieving sustainable development [5,6]. Currently, hydropower meets approximately 20% of global electricity demand [7], with more than 55 countries relying on it for over half of their power supply, including 24 nations where hydropower accounts for more than 90% of electricity generation [8,9]. Hydropower is highly sensitive to climatic variability and climate change [6,10], particularly in Central Asian countries vulnerable to these impacts [11]. In the Gorno-Badakhshan region of Tajikistan, the Fedchenko Glacier has shown significant shrinkage [12]. Research by Hydro-Québec indicates that climate change-induced phenomena (such as earlier spring snowmelt, reduced summer flows, and increased winter discharges) can severely affect power generation capacity, peak regulation, demand management, and dam safety [13,14].
Central Asia is experiencing a climatic divergence trend of ‘west drying and east wetting [15,16]. Over the past 30 years, the annual average temperature in the basin has risen by 1.2–1.8 °C, accelerating glacier retreat. Simulations indicate that a 2 °C temperature increase could lead to a short-term surge in runoff by 16.51% [17]. Data from the Climatic Research Unit (CRU) reveal intensified spatiotemporal precipitation variability in the basin from 1970 to 2013, with notable autumn drying trends (regional drought indices decreased by 23%) and increased spring moisture. The escalation of extreme rainfall events has exacerbated reservoir sedimentation, while droughts have heightened winter power shortage risks [18].
As the largest tributary of the Amu Darya in Tajikistan, the Vakhsh River is the country’s core basin for hydropower development, supplying 93% of its electricity [19]. The river’s flow is predominantly fed by alpine glaciers and snowmelt, exhibiting strong seasonality: winter runoff accounts for only 15–20% of the annual total, while summer melt contributes over 60% [20]. This unique replenishment mechanism renders the Vakhsh Basin’s hydropower system highly vulnerable to climate change. Increased seasonal runoff fluctuations have reduced winter generation by 30–40%, severely threatening grid stability. Moreover, sediment deposition has raised annual maintenance costs for power plants like Nurek by more than 50%, shortening their designed lifespans [21]. Climate change has also escalated transboundary water disputes, posing challenges to regional harmony [22].
This study will quantitatively analyze the current hydropower resources in the Vakhsh River Basin and their changes under different climate scenarios, while assessing the risks posed by soil erosion on hydropower development. The findings will provide decision-making support for sustainable hydropower development in Central Asia.
This paper focuses on the changes in hydropower resources in the Vakhsh River Basin and primarily conducts the following research: (1) Assessment of hydropower resources in the Vakhsh River Basin; (2) Impact of climate change on runoff and soil erosion; (3) Influence of changes in runoff and soil erosion on hydropower resources.

2. Materials and Methods

2.1. Study Area

This study takes the Vakhsh River Basin in Tajikistan as the research area. The river originates from the Daumuruk Mountains in southern Kyrgyzstan, flows through Kyrgyzstan and Tajikistan, and merges into the Amu Darya. The Vakhsh River has a total length of 524 km and a drainage area of 39,100 km2, with 7900 km2 located within Kyrgyzstan. The upper reaches are situated in the southeastern part of Kyrgyzstan, bordering China and Tajikistan, spanning 39° N to 40° N and 72° E to 74° E [23] (Figure 1). The source region is characterized by towering mountains and deep valleys, with an average elevation exceeding 3000 m. The climate is predominantly temperate continental, with distinct plateau features. The upper reaches (above 3000 m) have an annual average temperature below 10 °C, while the downstream valley areas approach 18 °C. The southeastern part of the basin (such as the Pamir Plateau) receives an average annual precipitation of about 511 mm, which significantly decreases downstream, with some areas receiving less than 200 mm annually.

2.2. Research Framework

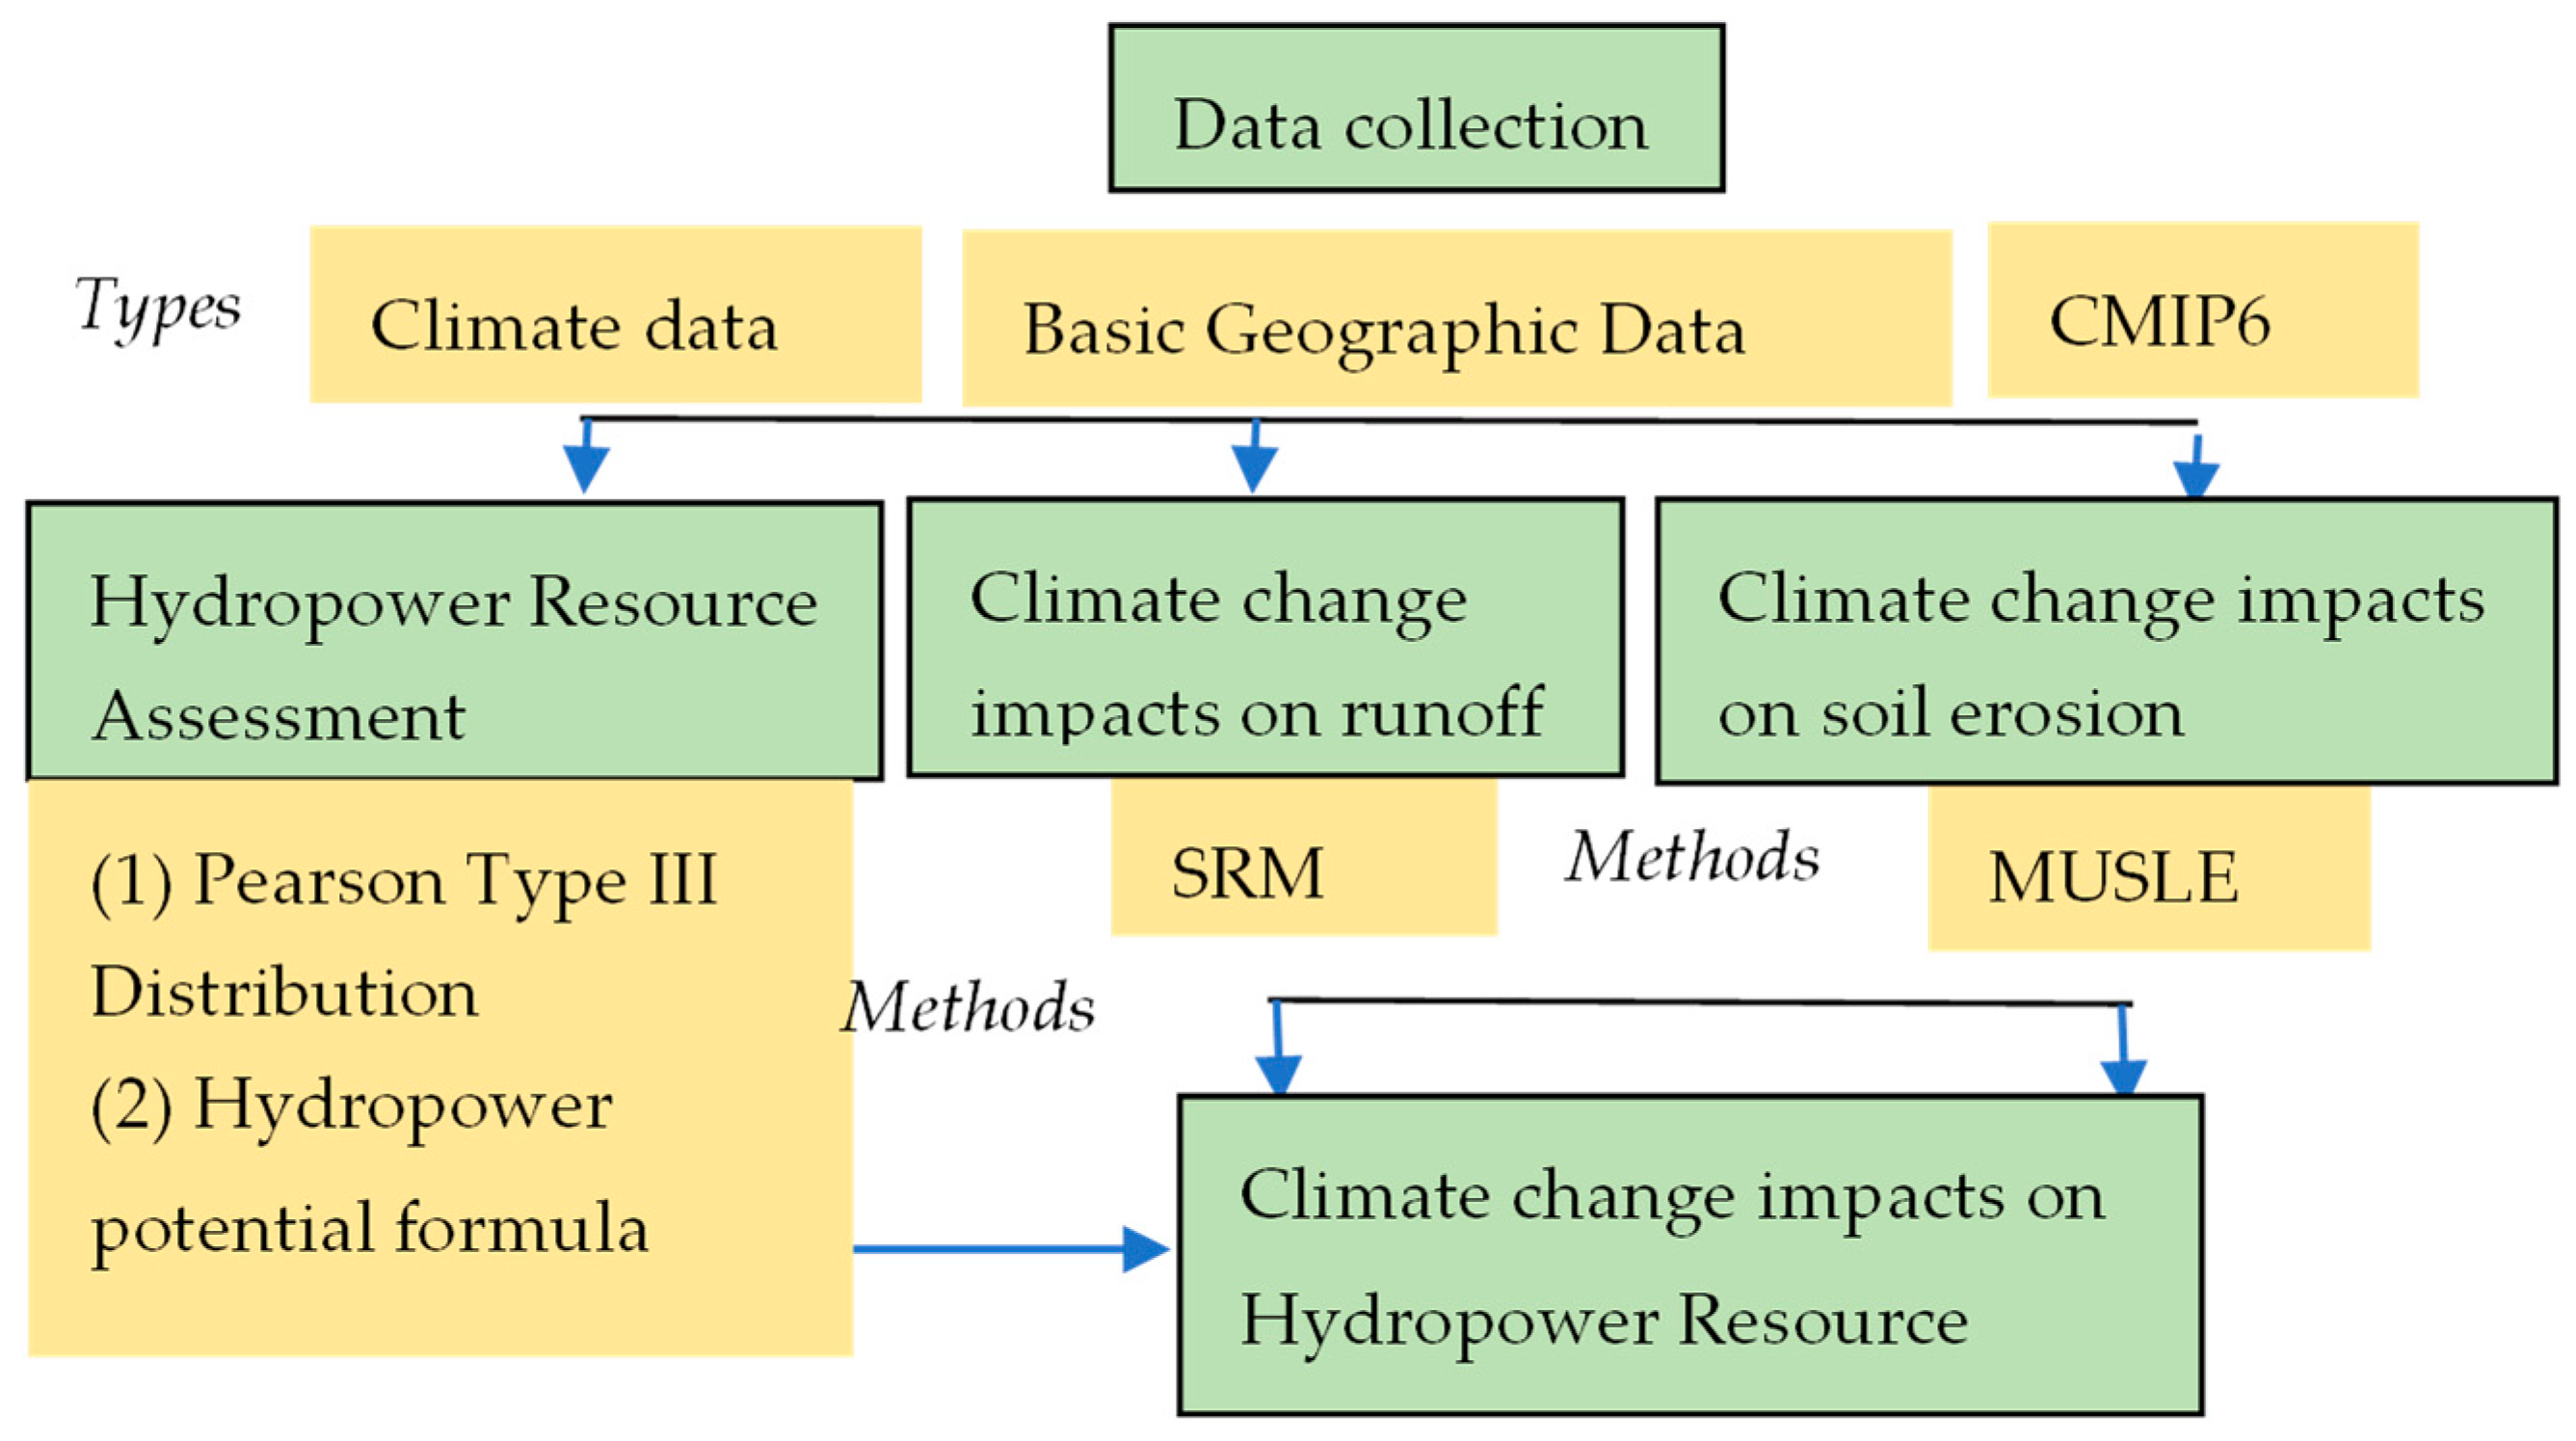
In order to analyze the impact of climate change on hydropower resource development in the Vakhsh river basin of Tajikistan, we designed the research framework as follows (Figure 2).

2.3. Data Collection

The National Hydrometeorology Agency (NHA) (http://meteo.tj (accessed on 2 May 2025)) provided temperature and precipitation data for 1975–2016. CMIP6 projections for 2020–2100 were generated for three Representative Concentration Pathways (RCPs): RCP2.6, RCP4.5, and RCP8.5. These correspond to greenhouse gas emission scenarios with radiative forcing values of 2.6, 4.5, and 8.5 W/m2, respectively, and project CO2 concentrations to reach approximately 420, 540, and 940 ppm by 2100 [23]. Snow (1975–2016) and CMIP6 (2020–2100) datasets were sourced from the National Aeronautics and Space Administration (NASA) (https://www.nccs.nasa.gov/ (accessed on 3 May 2025)) [24].
The 90 m × 90 m SRTM DEM data for the study area was sourced from the Geospatial Cloud (https://www.gscloud.cn/ (accessed on 3 May 2025)). Land use data and runoff data (1976–1990) were obtained from the National Tibetan Plateau/Third Pole Environment Data Center (https://data.tpdc.ac.cn/ (accessed on 3 May 2025)).

2.4. Hydropower Resource Assessment

The theoretical hydropower potential of a river represents the long-term average of its hydraulic potential energy, calculated based on the river’s mean annual flow and sectional elevation differences. This study employs a digital elevation model (DEM) with 20 km segmentation for computation. The theoretical potential is derived from the elevation difference between upstream and downstream cross-sections and the annual average runoff, using the following formula [25]:
E T R W a t e r = ρ · g · Q · H · t
where E T R W a t e r is theoretical hydropower potential of the river (J); ρ is water density (taken as 1.0 kg/L in this study); g is gravitational acceleration (calculated as 9.8014 m/s2 using the 1979 International Gravity Formula at 39° latitude); Q is annual average runoff (m3/s); H is elevation difference between cross-sections (m); t is time duration (8760 h per year).

2.5. Simulation of Climate Change Impacts on Runoff

Given the significant contribution of snowmelt runoff to the Vakhsh River Basin (accounting for a high proportion of total discharge), the SRM (Snowmelt Runoff Model) was employed to simulate hydrological processes under climate change scenarios.
The Snowmelt Runoff Model (SRM) is a conceptual degree-day model that incorporates snow-covered area as a key input variable. Its governing equation is given by Equation (2) [26].
Q n + 1 = C s n · a n T n + T n S n + c R n P n A · 10,000 86,400 1 k n + 1 + Q n k n + 1
such that Q is the average daily discharge [m3·s−1]; C is the runoff coefficient expressing the losses as a ratio of runoff/precipitation; Cs is the runoff coefficient of snowmelt; CR is the runoff coefficient of rain; a is the degree-day factor snowmelt depth resulting from 1-degree day [cm·°C−1·day−1]; ∆T is the extrapolation of temperature from one station to the average hypsometric elevation of the basin or altitudinal zone [°C]; S is the ratio of snow-covered extend to the total area; P is the precipitation contributing to runoff; A is the area of the basin or altitudinal zone [km2]; k is the recession coefficient showing the reduction in discharge in a period without snowmelt or rainfall; n is the sequence of days during the discharge computation period. 10,000 86,400 is the conversion of cm/km2/day to m3/s.
Considering the pronounced effects of climate change in Central Asia, our modeling framework was implemented across all three Representative Concentration Pathways (RCP2.6, RCP4.5, and RCP8.5) using climate projections from the Coupled Model Intercomparison Project Phase 5 (CMIP6) ensemble (https://esgf-node.llnl.gov/projects/ (accessed on 4 May 2025)). Among them, RCP2.6 corresponds to stringent mitigation targets (requiring net-negative emissions by 2100), RCP4.5 represents moderate policy intervention (stabilizing radiative forcing at 4.5 W/m2 by 2100), while RCP8.5 exemplifies a high-emission scenario with ineffective mitigation measures (resulting in 8.5 W/m2 forcing by 2100).

2.6. Impact of Soil Erosion on Hydropower Resources Under Climate Change

Soil erosion was quantified using the Modified Universal Soil Loss Equation (MUSLE), an enhanced erosion model developed by Williams [27] based on the Universal Soil Loss Equation (USLE). MUSLE is a quantitative model that characterizes the relationship between hillslope soil loss and multiple influencing factors. It is widely applied in soil and water conservation, erosion assessment, and the prediction of soil loss rates on sloping agricultural lands. The MUSLE equation is expressed as [28]:
A =   R × K × L S × C × P
In the equation, A is the predicted annual soil erosion amount (t/(km2·a)), R is the rainfall erosivity factor (MJ·mm/(hm2·h)), serving as a kinetic indicator of runoff-induced erosion, where rainfall intensity and duration significantly influence erosion. LS is the topographic factor (dimensionless), with L (slope length factor) representing soil erosion normalized to a 22.13 m slope length and S (slope steepness factor) representing erosion normalized to a 5.14° slope; this study derived LS factors from DEM (Digital Elevation Model) data. K is the soil erodibility factor (t·hm2·h/(hm2·MJ·mm)), reflecting soil sensitivity to detachment and transport by erosive forces. C is the cover and management factor (dimensionless), quantifying the effect of vegetation and management practices on erosion. P is the support practice factor (dimensionless), representing the ratio of soil loss with conservation measures to that under conventional tillage.
In high-altitude regions, soil erosion rates are often underestimated due to snowmelt erosion and freeze–thaw cycles [29], while being overestimated owing to the steep slope effect. DEM is often used to adjust parameters to accommodate this change. Peng et al. successfully employed the USLE model to estimate soil erosion in the high-altitude Qilian Mountain area in China. Given that our study area closely resembles Qilian Mountain, we adopted the same LS parameters as Peng’s [30].
The rainfall erosivity factor R reflects the impact of precipitation on soil erosion, and its calculation formula is [31]:
R   = i = 1 12 1.735   × 10 [ ( 1.5 × l g p p i 2 0.8188 ) ]
In the equation, p i the monthly precipitation (mm), where i represents the month of the year (i = 1, 2,…, 12); p is the mean annual rainfall (mm).
K represents the soil erosion per unit area caused by rainfall erosivity, and its calculation formula is as follows [32]:
K   = 0.2 + 0.3   ×   e x p 0.0256   ×   S A N 1 S I L 100   ×   S I L C L A + S I L 0.3 ×   1 0.25 × C C + e x p ( 3.72 2.95 × C ) ×   1 0.7 × S N 1 S N 1 + e x p ( 5.51 + 22.9 × S N 1 )
Here, SAN, SIL, CLA and C, respectively, represent the mass fractions (%) of sand, silt, clay, and organic carbon. The calculation for SN1 follows: SN1 = 1 − (SAN/100).
LS is the slope length-gradient factor (dimensionless), where L represents the slope length factor and S denotes the slope gradient factor. Under unchanged conditions, LS quantifies the ratio of soil loss on a given slope (with specific length and gradient) to that on a standard runoff plot in a typical slope condition. The calculation formula is as follows [33]:
S   = 10.8 × sin θ + 0.03 ,   θ < 5 ° 16.8 × sin θ 0.50 ,   5 ° θ < 14 ° 21.9 × sin θ 0.96 ,   θ 14 °
where θ denotes the slope ( ° ).
The slope length factor (L) is calculated using the classic RUSLE method, with the formula as follows:
L   = λ 22.13 m
m = 0.2 ,   θ 1 ° 0.3 ,   1 ° < θ 3 ° 0.4 ,   3 ° < θ 5 ° 0.5 ,   θ > 5 °  
Here, λ denotes the slope length (m), and θ represents the slope angle extracted from the DEM (Digital Elevation Model).
The cover and management factor (C) quantifies the ratio of soil loss under a specific vegetation cover to that under cultivated conditions, assuming all other factors remain constant. The calculation formula is as follows [34]:
C   = 1 ,   c   =   0 0.6508 0.3436 lg c ,   0 < c 78.3 0 .   c > 78.3
Here, c represents the vegetation cover degree, with C ranging from 0 (indicating no soil erosion) to 1 (dimensionless).
P is the soil conservation practice factor (dimensionless), representing the ratio of soil loss after implementing conservation measures to that under slope farming. Its value ranges from 0 to 1. For built-up areas and water bodies, P is defaulted to 0 under normal conditions. Based on the study area’s land use, USDA Handbook 703, and watershed characteristics, P values are calibrated for different land use types. The assigned P factors for each land use category are listed in Table 1.

2.7. Pearson Type III Distribution

The Pearson Type III distribution is widely used in hydrological frequency analysis due to its excellent fit with the frequency distributions of hydrological variables (such as floods and runoff) in most regions, particularly its ability to effectively capture the asymmetric characteristics of extreme events [35].
The Pearson Type III curve is an asymmetric, single-peaked, positively skewed distribution with one finite end and one infinite end, mathematically known as the Gamma distribution. Its probability density function is [36,37]:
f ( x ) = β α Γ ( α ) ( x a 0 ) a 1 e β ( x a 0 )
In the equation, Γ(α) represents the gamma function of α; α, β, and a 0 are the three parameters characterizing the shape, scale, and location of the Pearson Type III distribution, respectively, where α > 0 and β > 0.
α = 4 C s 2   β = 2 x ¯ C s C v   a 0 = x ¯ ( 1 2 C v C s )
In the equation, x ¯ represents the mean, C s denotes the coefficient of skewness, and C v stands for the coefficient of variation.
In hydrologic calculations, it is generally necessary to determine the random variable Xₚ corresponding to a specified frequency P. This is achieved by integrating the probability density function and solving for the cumulative frequency P, which is equal to or greater than Xₚ. The relationship can be expressed as:
P   = F x p   =   P x x p   =   β α Γ α x p x a 0 a 1 e β x a 0 d x

2.8. Simulation and Analysis Software

Due to the inclusion of high-altitude areas in the study region, glacier and snowmelt are significant components of runoff. This study introduces the Snowmelt Runoff Model (SRM) for runoff simulation and analysis. SRM is a hydrological model widely used for snowmelt runoff simulation in mountainous watersheds, based on the degree-day method as its core theory. It features a simple structure and a clear physical meaning of parameters [33]. The spatial analysis designed in this paper was conducted using ArcGIS 10.3 software. ArcGIS is a professional Geographic Information System (GIS) software suite developed by ESRI, widely used in spatial data management, analysis, and visualization [38].

3. Results and Discussion

3.1. Water Energy Resource Assessment in the Vakhsh River Basin

3.1.1. Spatial Distribution of Hydropower Resources

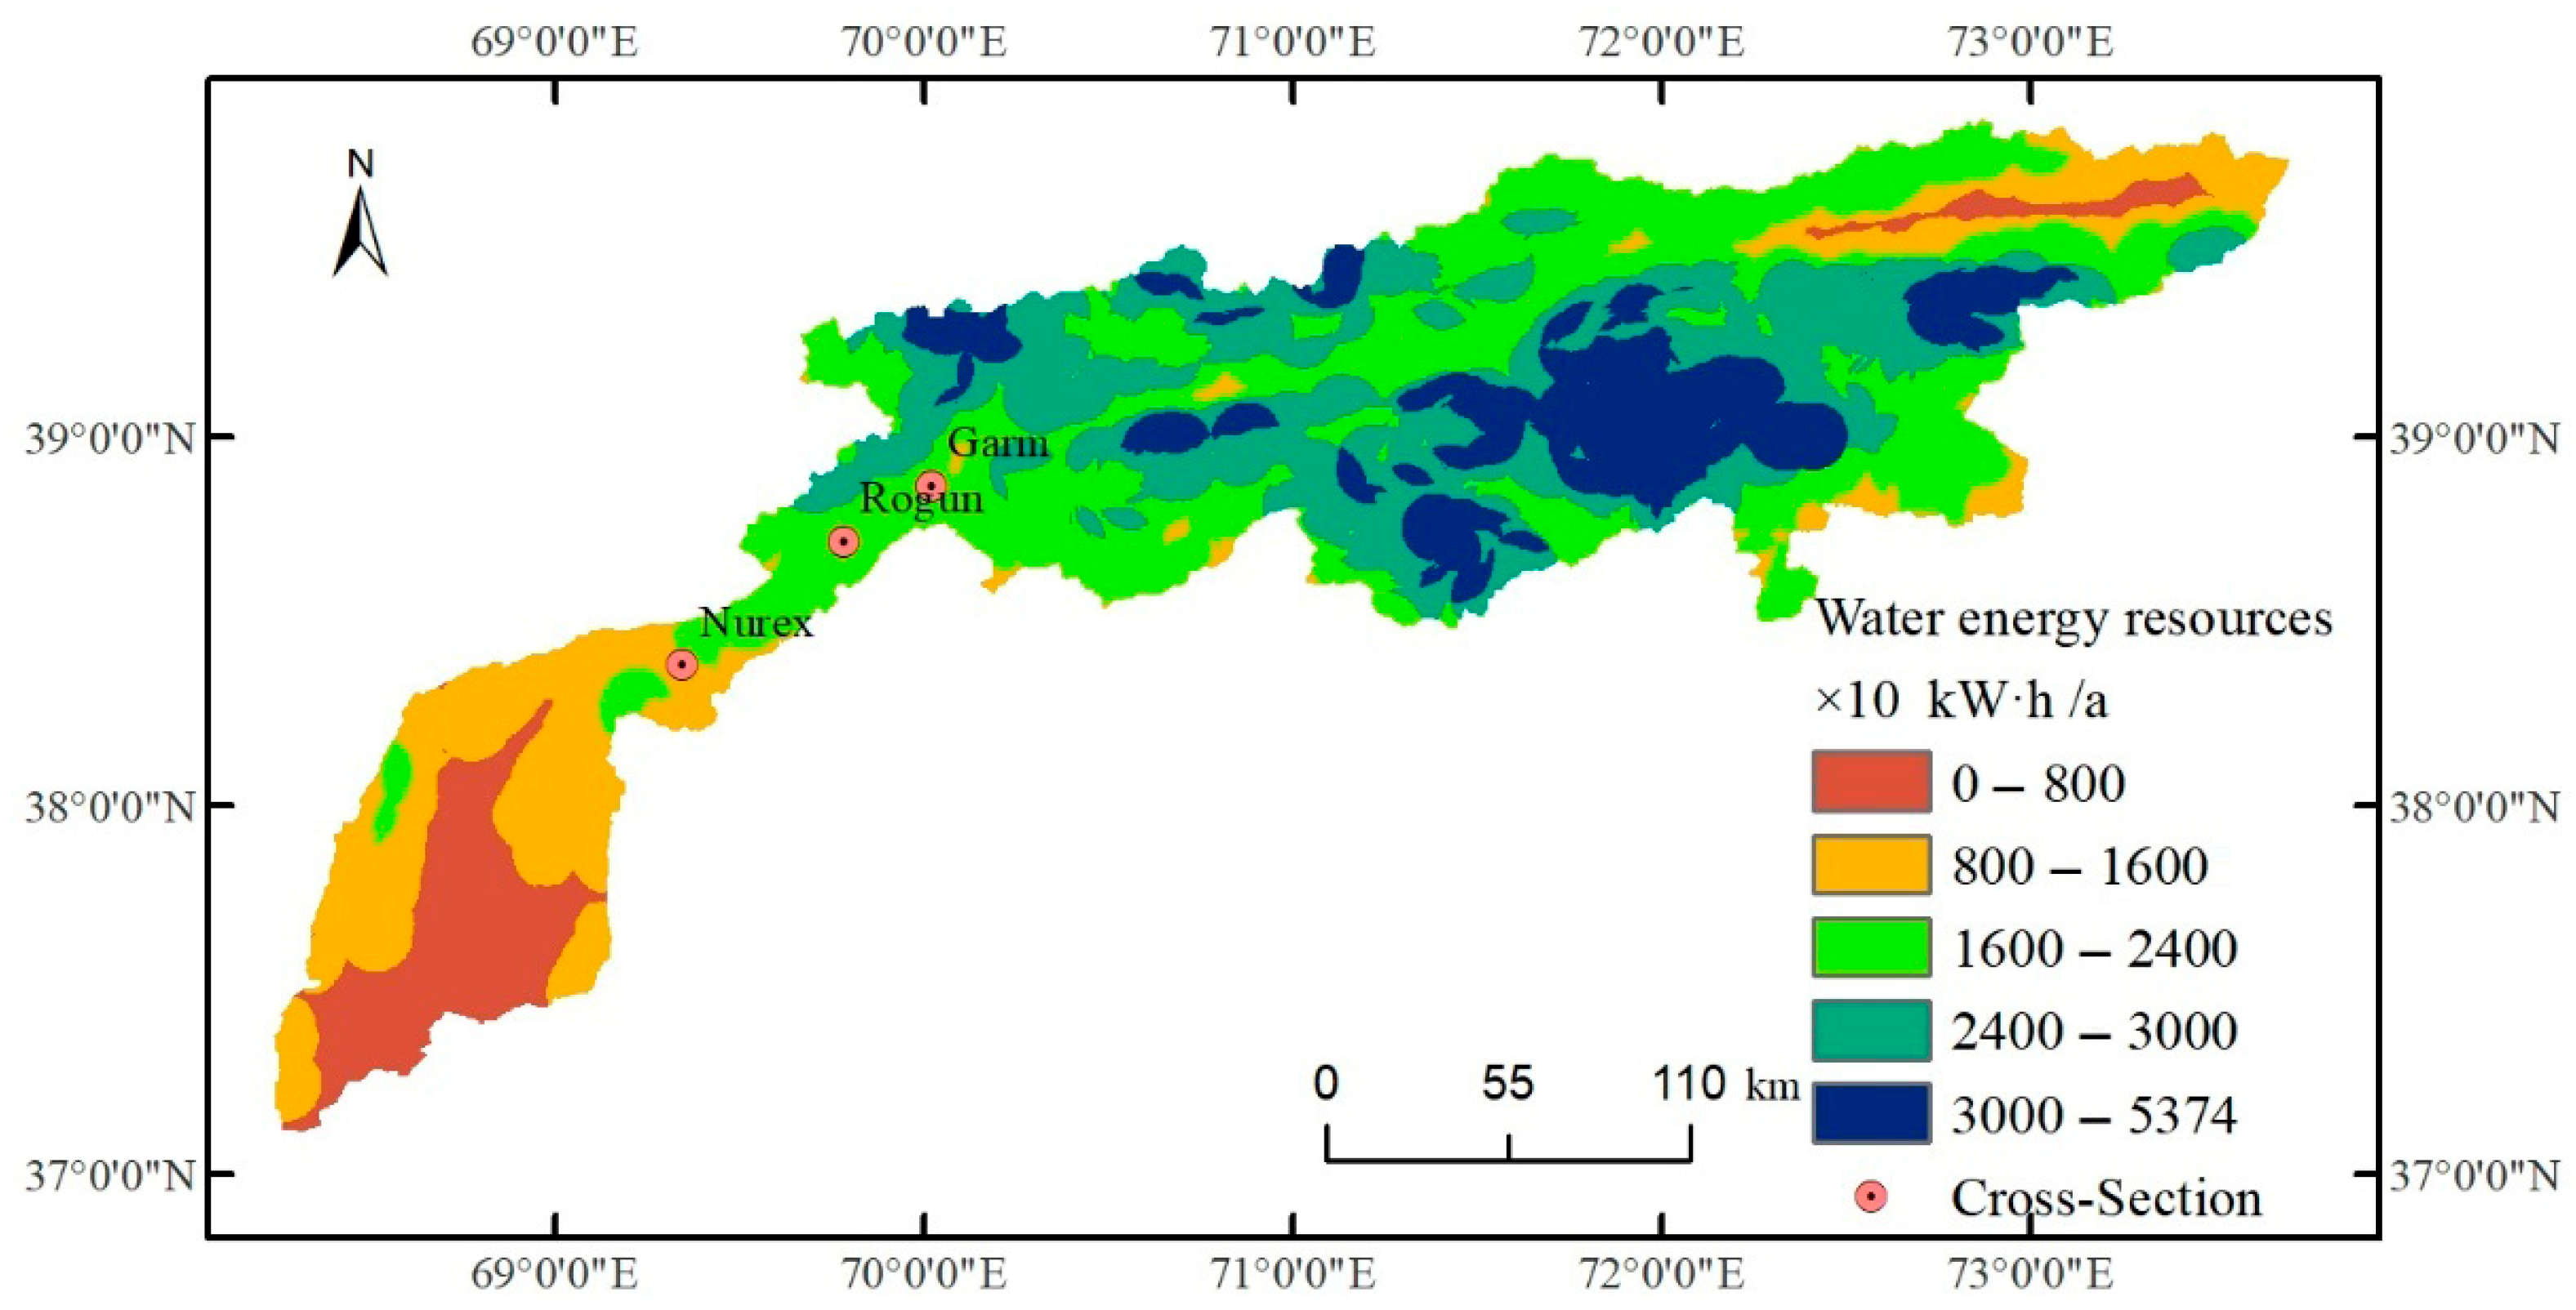
According to the suitable spacing requirements between hydropower station constructions, the elevation drop of unit cells centered at 20 km intervals was evaluated point by point within the basin. The annual average runoff of river sections adopted the multi-year average values from 1976 to 1990. The hydropower resources of the Vakhsh River Basin were calculated using Formula (1), where the water density ρ was taken as 1.0 kg/m3, the gravitational acceleration g as 9.8014 m/s2, and the annual hour count t as 8760 h. The calculation results are shown in Figure 3:
As shown in Figure 3, the hydropower resources in the Vakhsh River Basin range from 52 to 537.4 billion kWh/year, with high-value areas primarily distributed in the mountainous upstream region above Nurex and low-value areas concentrated in the downstream plain regions. Further statistical analysis reveals that 8.90% of the regions have less than 80 billion kWh/year, 17.53% fall between 80 and 160 billion kWh/year, 32.97% are between 240 and 300 billion kWh/year, 26.34% between 240 and 300 billion kWh/year, and 14.26% exceed 300 billion kWh/year. Over 90% of the regions surpass 100 billion kWh/year, indicating abundant hydropower resources in the basin.
Based on existing hydropower infrastructure, three hydrological sections (Garm, Rogun, and Nurek) were selected for assessment (spatial locations shown in Figure 2), with results detailed in Table 2.
Table 2 shows that the hydropower resources of all three sections exceed 50 billion kWh/year, with the ranking Rogun > Nurek > Garm. The data indicate that the distribution of hydropower resources among different sections is not solely governed by upstream-downstream relationships. Although downstream sections (e.g., Garm) exhibit higher annual runoff, a notable elevation difference in specific areas can exert a more pronounced impact on the outcomes.

3.1.2. Frequency Distribution Characteristics of Hydropower Resources

Since annual runoff is highly variable and uncertain, it poses challenges for water energy development. To reduce risks and optimize economic investment, understanding the frequency distribution of hydropower resources is critical. A Pearson Type III distribution analysis was conducted on the hydropower resources of the three representative sections (Garm, Rogun and Nurek), with the results shown below.
Figure 4 shows that when the guarantee rate is between 75% ≤ p ≤ 90%, the distribution range of hydropower resources is: 1.81 × 10¹⁰ kWh/a ≤ E Garm ≤ 1.64 × 10¹⁰ kWh/year, 3.67 × 10¹⁰ kWh/a ≤ ERogun ≤ 3.33 × 10¹⁰ kWh/year, 2.57 × 10¹⁰ kWh/a ≤ ENurek ≤ 2.33 × 10¹⁰ kWh/a. For cascaded hydropower stations, the guaranteed capacity calculation requires coordination between upstream and downstream stations, with the conventional guarantee rate ranging from 75% to 90%, making the three sections suitable for exploitation planning within this range.

3.1.3. Intra-Annual Distribution Characteristics of Hydropower Resources

The intra-annual distribution of hydropower resources is a critical basis for designing the storage capacity of diversion reservoirs in power stations to address water regulation during non-flood seasons. Statistical analysis of multi-year (1976–1985) average data yields the following results (Figure 5):
Figure 5 shows that the intra-annual distribution of hydropower resources is highly uneven, with the lowest values occurring in January-March (6.03 × 10⁸ kW·h, 12.24 × 10⁸ kW·h, 8.58 × 10⁸ kW·h, accounting for 2.77% of the annual total each), and the peak values in June (47.83 × 10⁸ kW·h, 97.04 × 10⁸ kW·h, 68.02 × 10⁸ kW·h, accounting for 21.96% of the annual total each). Overall, the flood season (May–September) accounts for 75.13%, while the other seven months account for 24.87%.

3.2. Impact of Climate Change on Hydropower Resources

3.2.1. Impact of Climate Change on Runoff

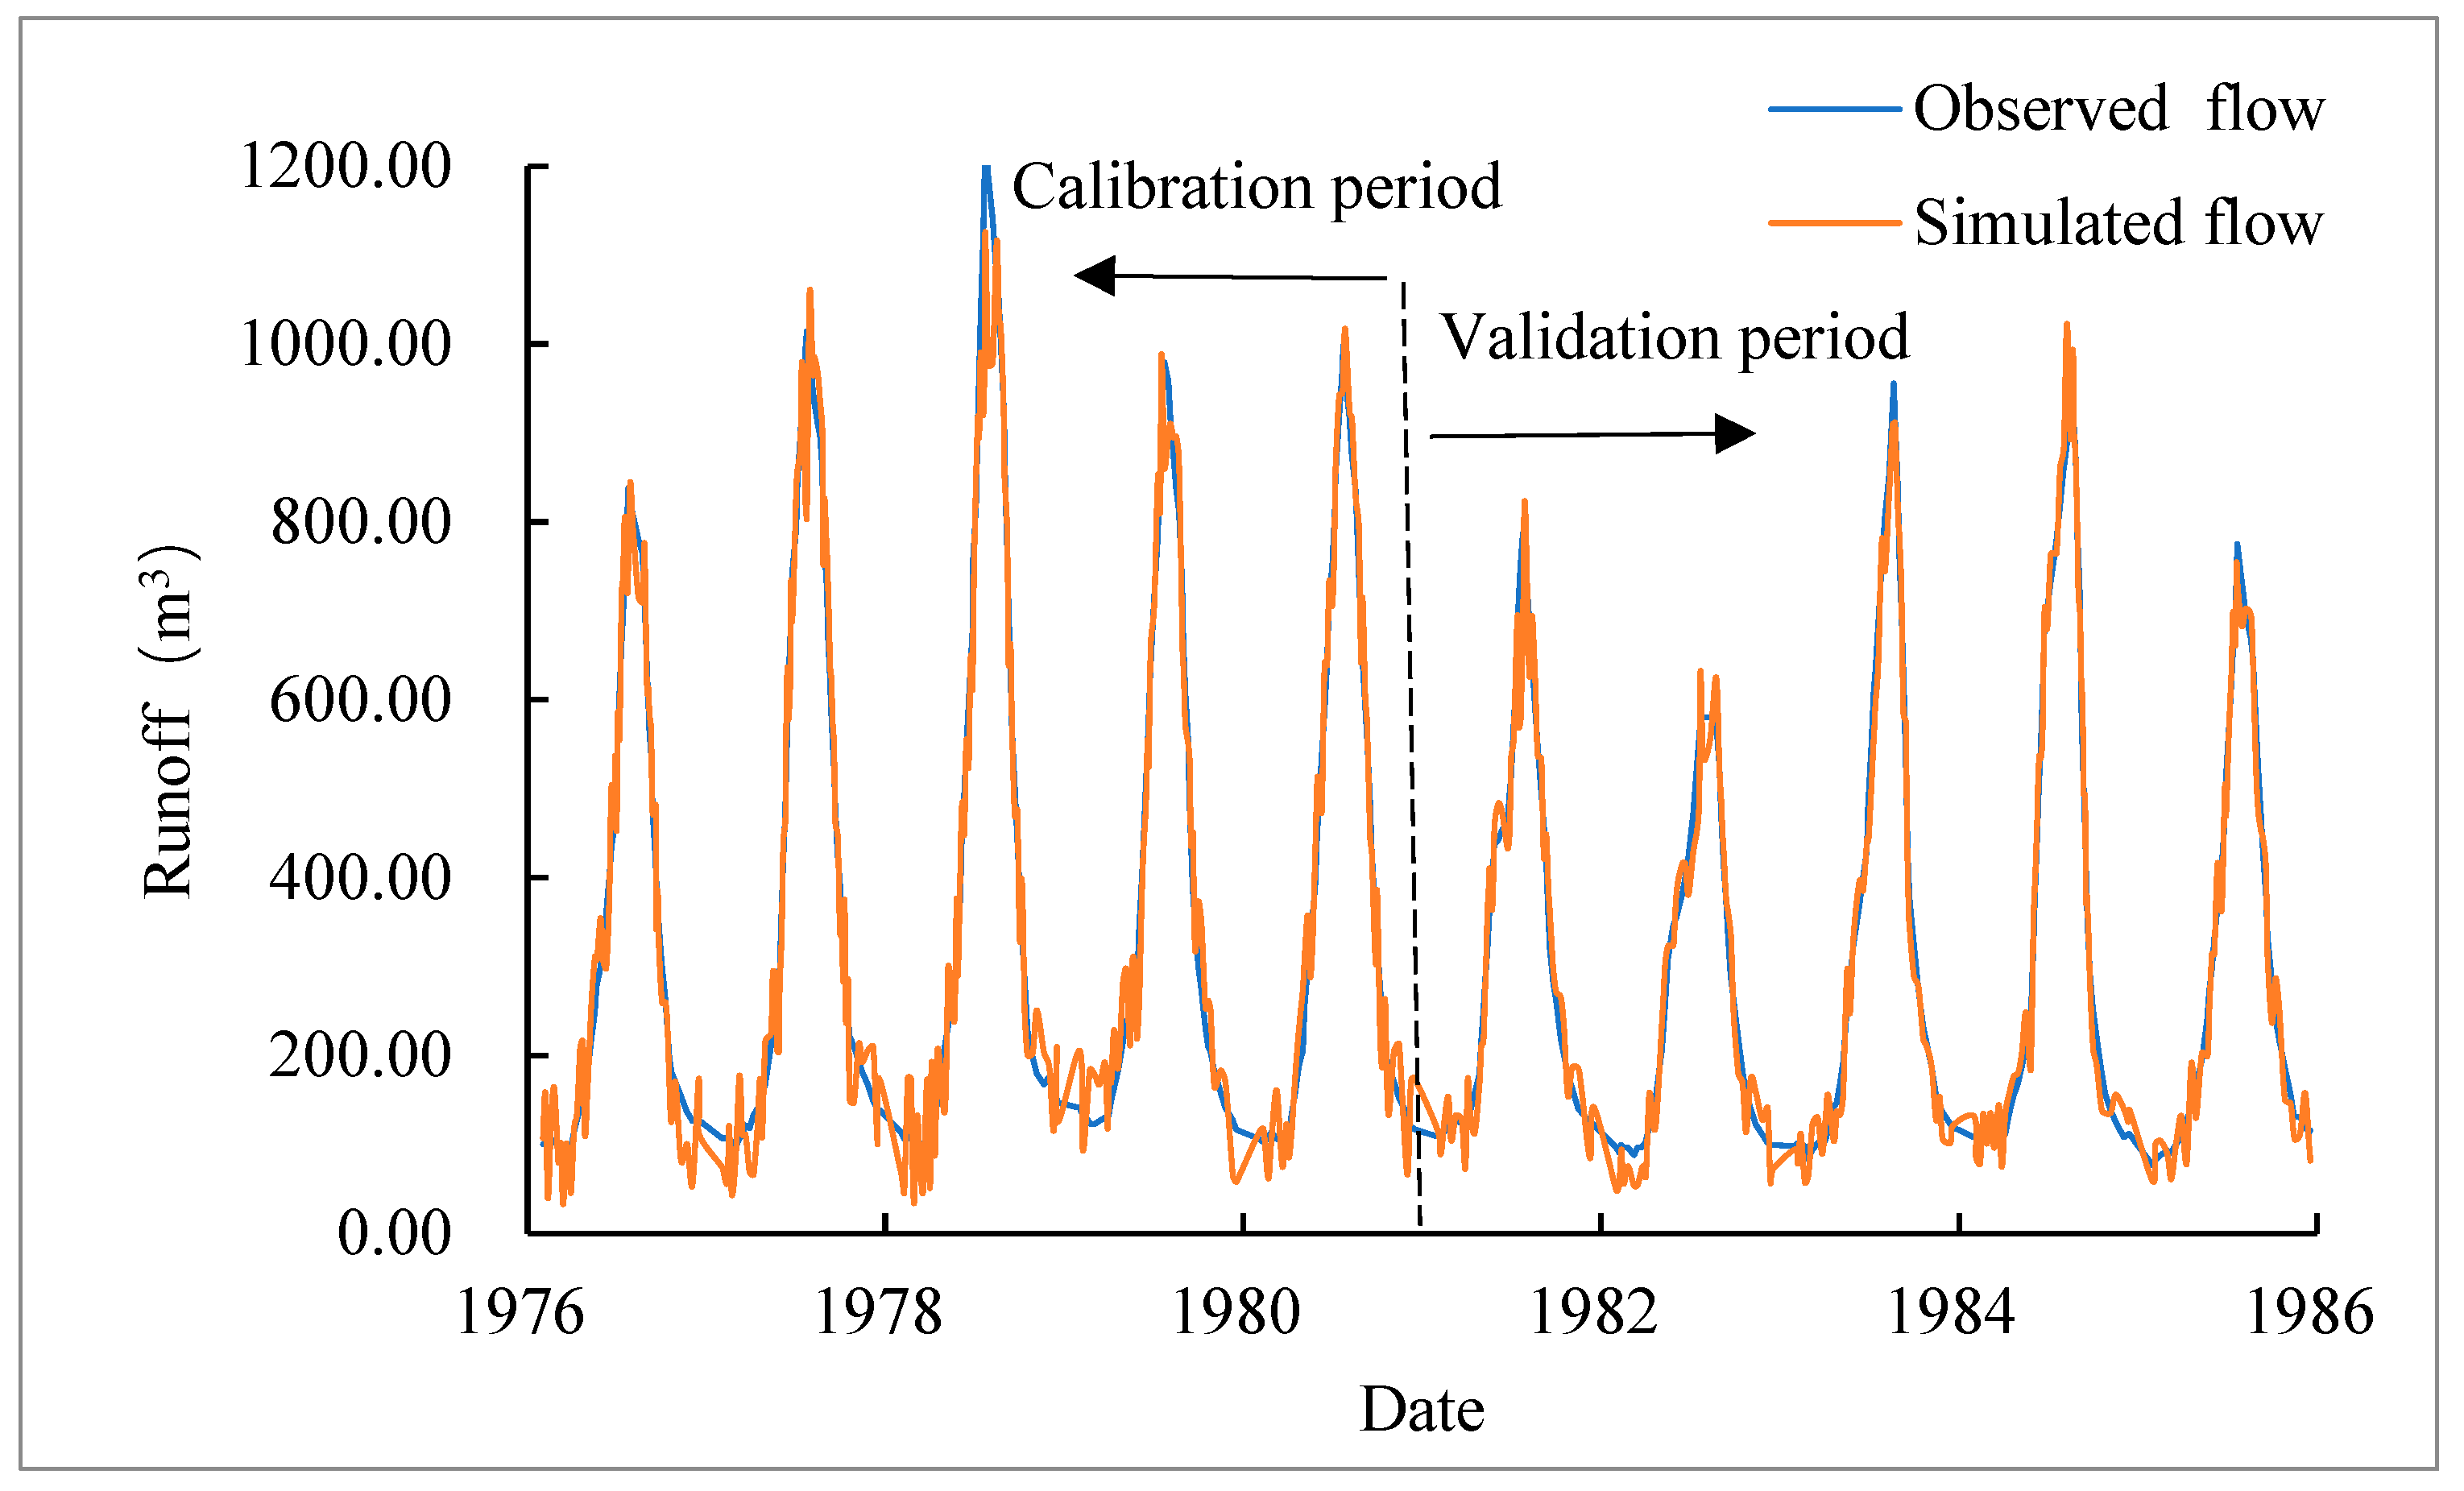
In the Vakhsh River Basin, glacier and snow melt driven by climate change significantly impacts river runoff. Therefore, this study introduces a snowmelt runoff model (SRM) to simulate runoff variations. Based on existing data, the 1976–1980 data from Garm Hydrological Station were used for model calibration, and the 1981–1985 data were used for model validation. The results are shown in Figure 5.
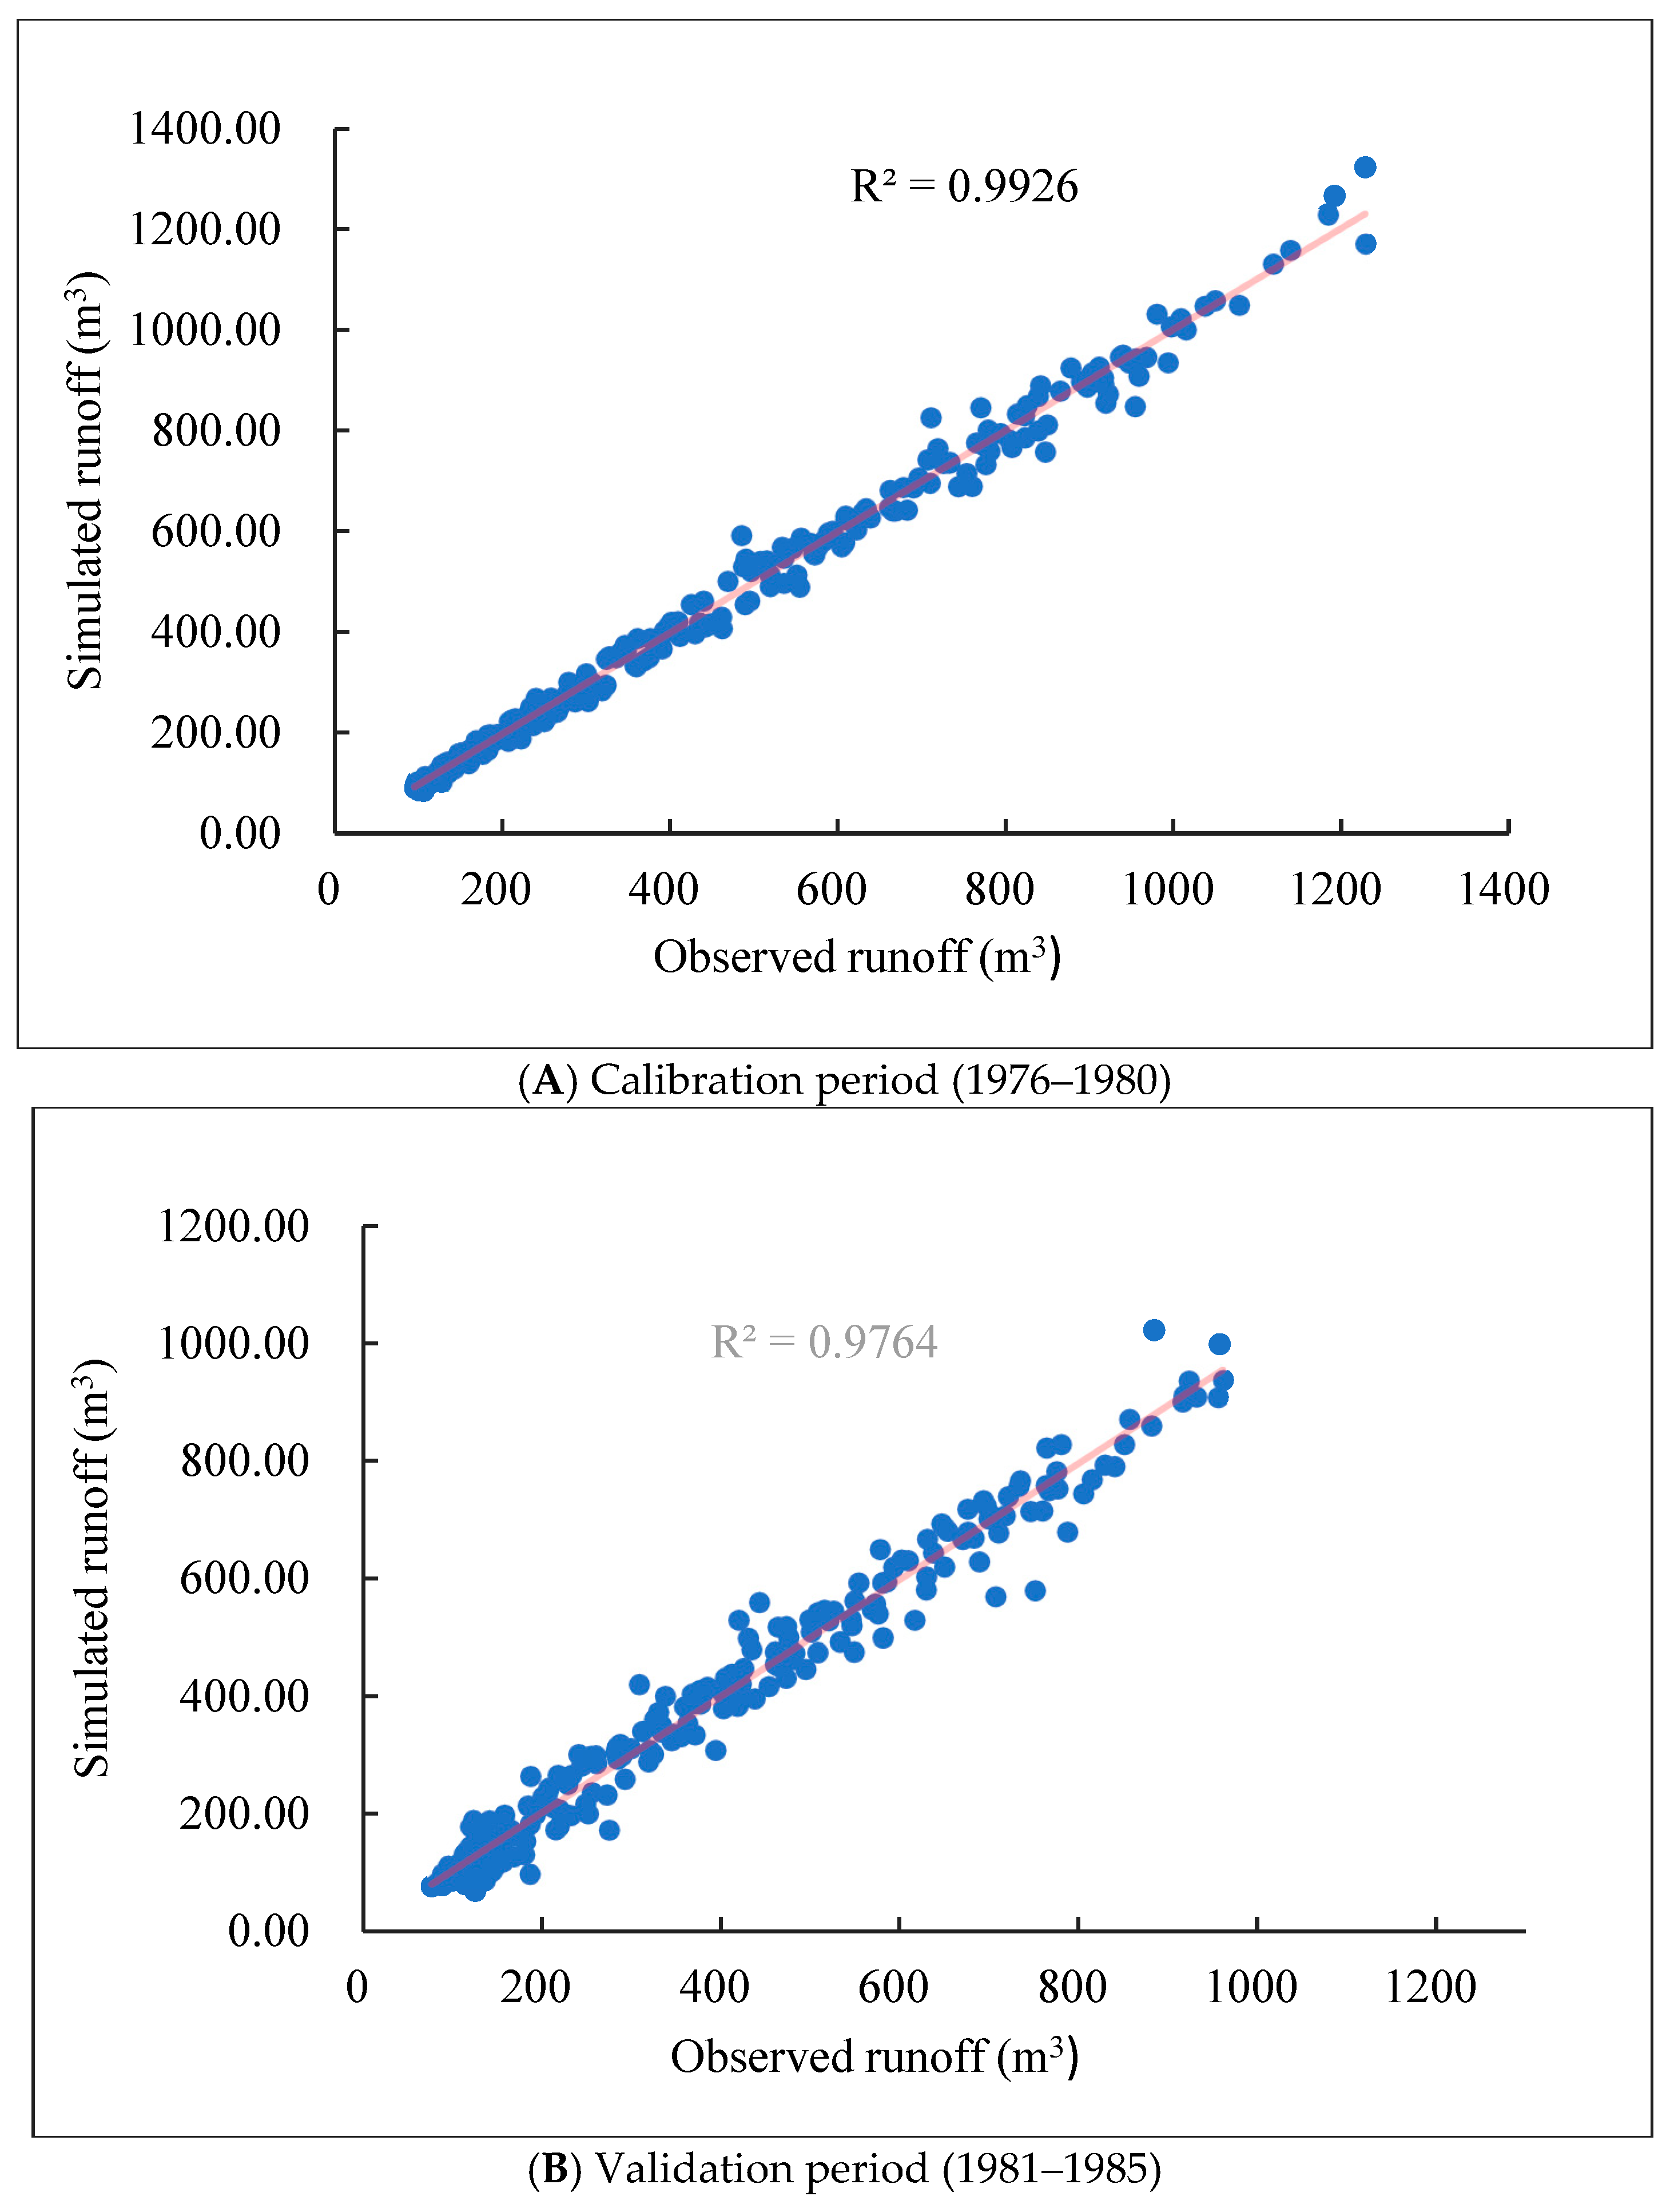
Figure 6 shows excellent consistency between observed and simulated runoff during calibration and validation periods. To further quantitatively analyze its accuracy, the simulation accuracy metrics (Coefficient of Determination R2 and Nash–Sutcliffe Efficiency Coefficient NSE) were calculated. The results are presented in Figure 7.
As shown in Figure 7, during the calibration period, the R2 was 0.9826 and the NSE was 0.9813, while during the validation period, the R2 was 0.9764 and the NSE was 0.9763. The SRM model demonstrates high accuracy in simulating hydrological processes at the Garm Hydrological Station, indicating its practical applicability in the Vakhsh River Basin for further predictive studies. Certainly, the high accuracy of the simulation results may also be related to the relatively short time series used for modeling, which introduces significant uncertainty in the outcomes.
The changes in climate data (maximum temperature (TMax), minimum temperature (TMin), average temperature (Tav) and precipitation(p)) for the study area compared to the simulation period are presented in Table 3.
Table 3 shows that over the next 50 years, the Vakhsh River Basin is projected to experience an overall warming trend, with multi-year temperature increases ranging from 0.31 to 0.82 °C and precipitation increases of approximately 8 mm. From a climate scenario perspective, temperature increases follow the order RCP2.6 < RCP4.5 < RCP8.5, with RCP2.6 showing a slight increase of over 0.3 °C, RCP4.5 showing a slight increase of over 0.4 °C, and RCP8.5 showing an increase exceeding 0.7 °C, while precipitation increases remain within the range of 7.5–8.0 mm across all scenarios.
Based on the calibrated parameters, SRM was used to simulate the average monthly predicted values of MaxT, MinT, Average T, and precipitation under the RCP2.6, RCP4.5, and RCP8.5 scenarios. The simulation results are presented in Figure 8.
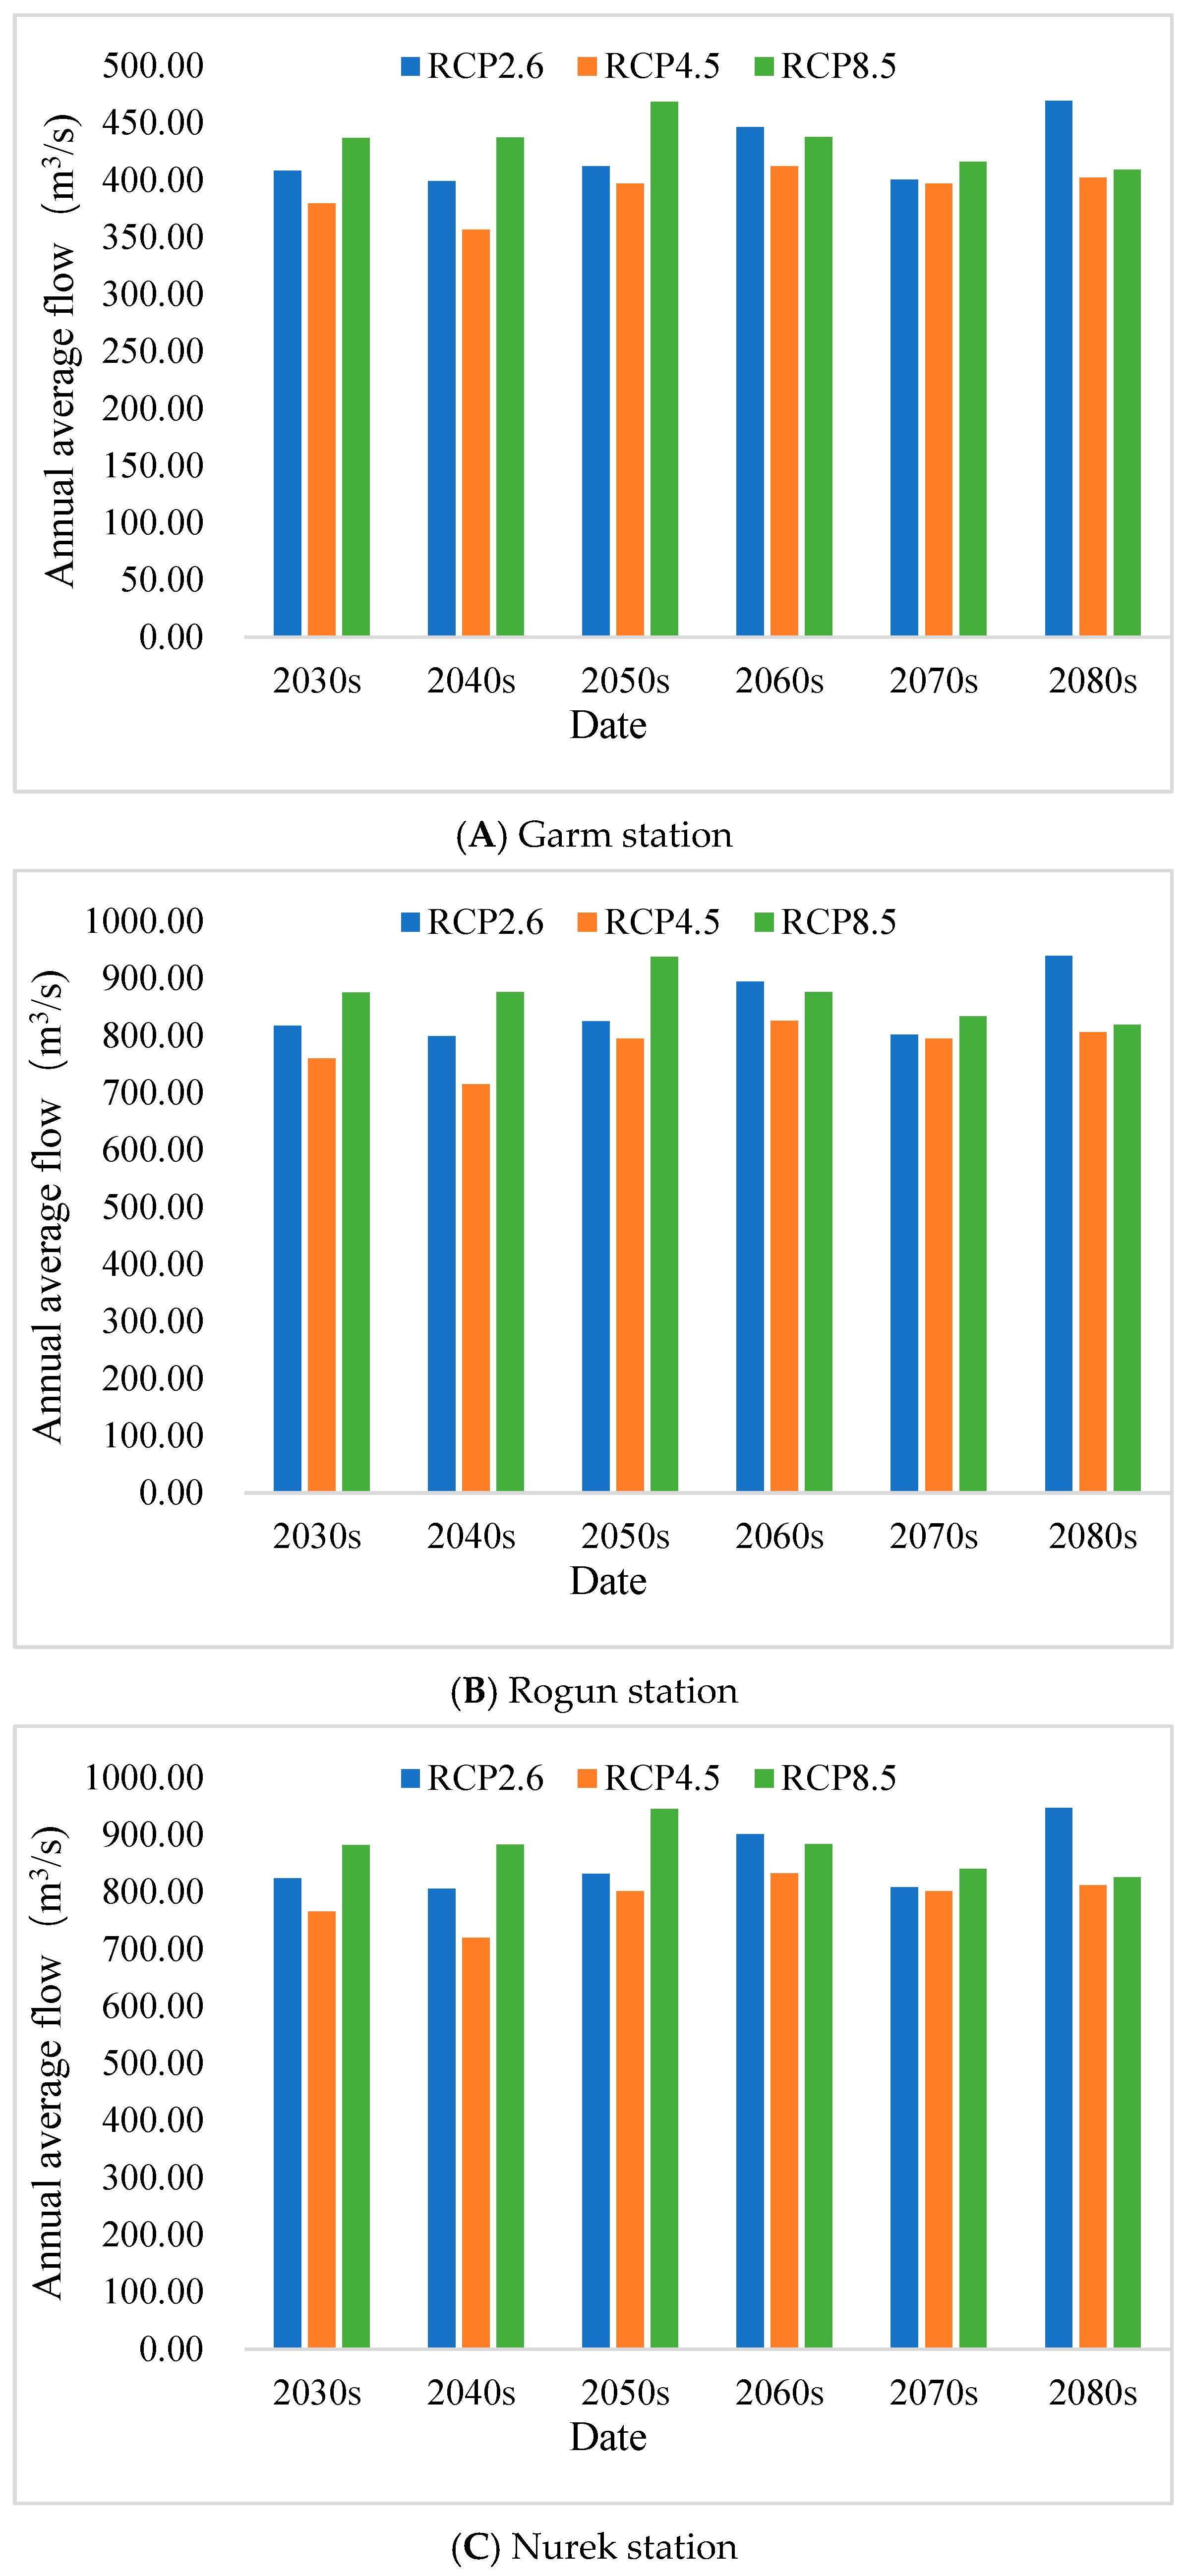
Figure 8 shows that runoff increases to varying degrees with rising precipitation and temperature. Over the next 50 years, with a 95% confidence level, the total flow rates for the Garm, Rogun, and Nurex sections are 415.64 ± 57.77, 832.78 ± 114.52, and 839.30 ± 168.09 m3/s, respectively. The flow increase follows the order RCP4.5 < RCP2.6 < RCP8.5, which differs from the precipitation trend. This inconsistency occurs because the basin relies heavily on snowmelt runoff, where temperature rise also plays a significant role. At the Garm, Rogun, and Nurex sections, with a 95% confidence level, flow increases by 93.72 ± 13.04, 187.78 ± 25.84, and 189.25 ± 37.91 m3/s, respectively, with all three seeing a nearly 30% increase.
The research findings of this paper are consistent with previous studies. Central Asia is projected to shift toward a warmer and wetter climate, with snowmelt leading to increased runoff near glaciers. Such climatic transitions will result in a rise in flood events across Central Asia [38].

3.2.2. Impact of Climate Change on Hydropower Resources

Based on simulated runoff under different climate scenarios, hydropower resource changes were calculated using Formula (1), with the results shown in Figure 9 below.
Figure 9 shows that under the three scenarios (RCP2.6, RCP4.5, and RCP8.5), hydropower resources increase with rising runoff, with increments ranging from 162 ± 22.54 to 328,108 ± 45,652.24 kWh/a with a 95% confidence level. In terms of growth magnitude, the order is: RCP4.5 < RCP2.6 < RCP8.5. From a spatial perspective, Garm exhibits the smallest increase, while Nurex shows the largest growth, followed by Rogun. The trend of change aligns with runoff variations.

3.2.3. Estimation of Soil Erosion

Changes in precipitation and resulting runoff variations under climate change can influence sediment deposition in hydropower reservoirs. This section employs a modified soil erosion equation to assess soil and water loss in the Vakhsh River Basin.
The Modified Universal Soil Loss Equation (MUSLE) is used to estimate soil erosion in the study area based on rainfall erosivity, soil erodibility, topography (slope length and gradient), vegetation cover and management, and soil conservation practices. The calculation method is detailed in Section 2.5. The evaluation results are presented in the following figure.
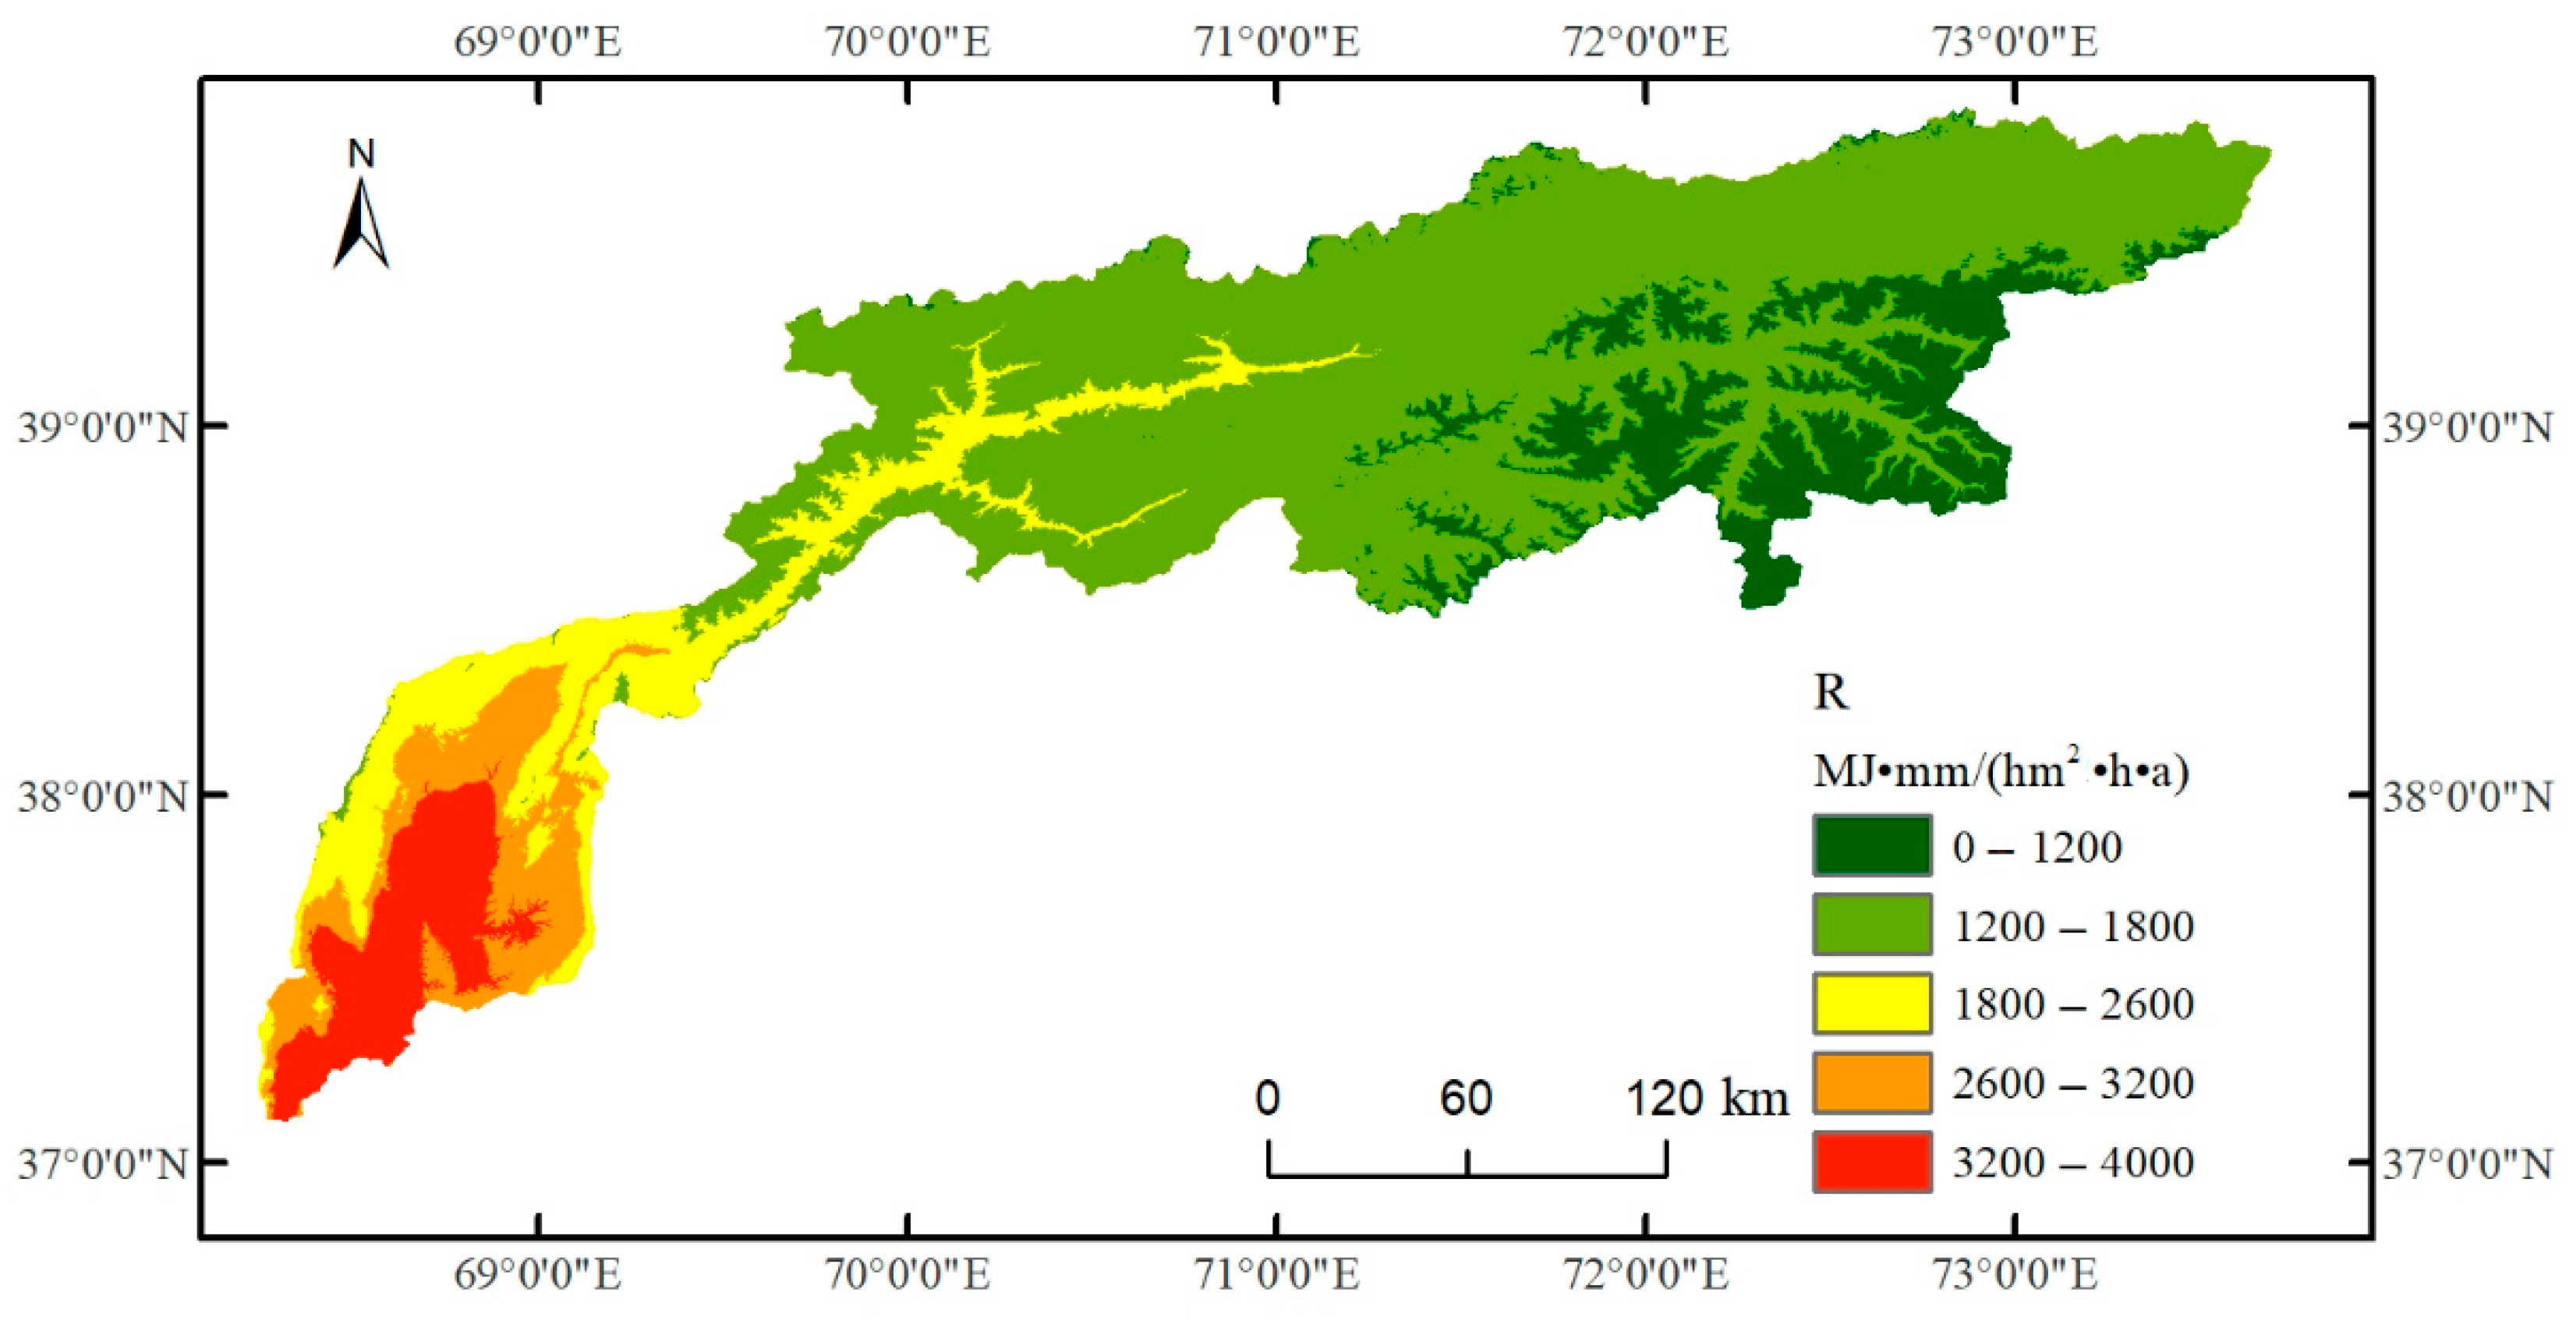
Figure 10 indicates that the rainfall erosivity in the study area ranges between 970–3800 MJ·mm/(hm2·h·a), showing an overall decreasing trend from the southwest to the northeast. High-value zones (generally exceeding 2600 MJ·mm/(hm2·h·a)) are primarily distributed in the downstream plain areas of the basin, while low-value zones (typically below 1800 MJ·mm/(hm2·h·a)) are concentrated in the northeastern upstream regions.
Figure 11 shows that the LS (topographic factor) in the basin ranges from 0 to 21, exhibiting an alternating distribution pattern of high and low values. The western upstream region generally has higher LS values compared to the eastern downstream region. Low-value zones are primarily concentrated near the main river channel, whereas high-value zones are predominantly distributed in the marginal snow-covered areas.
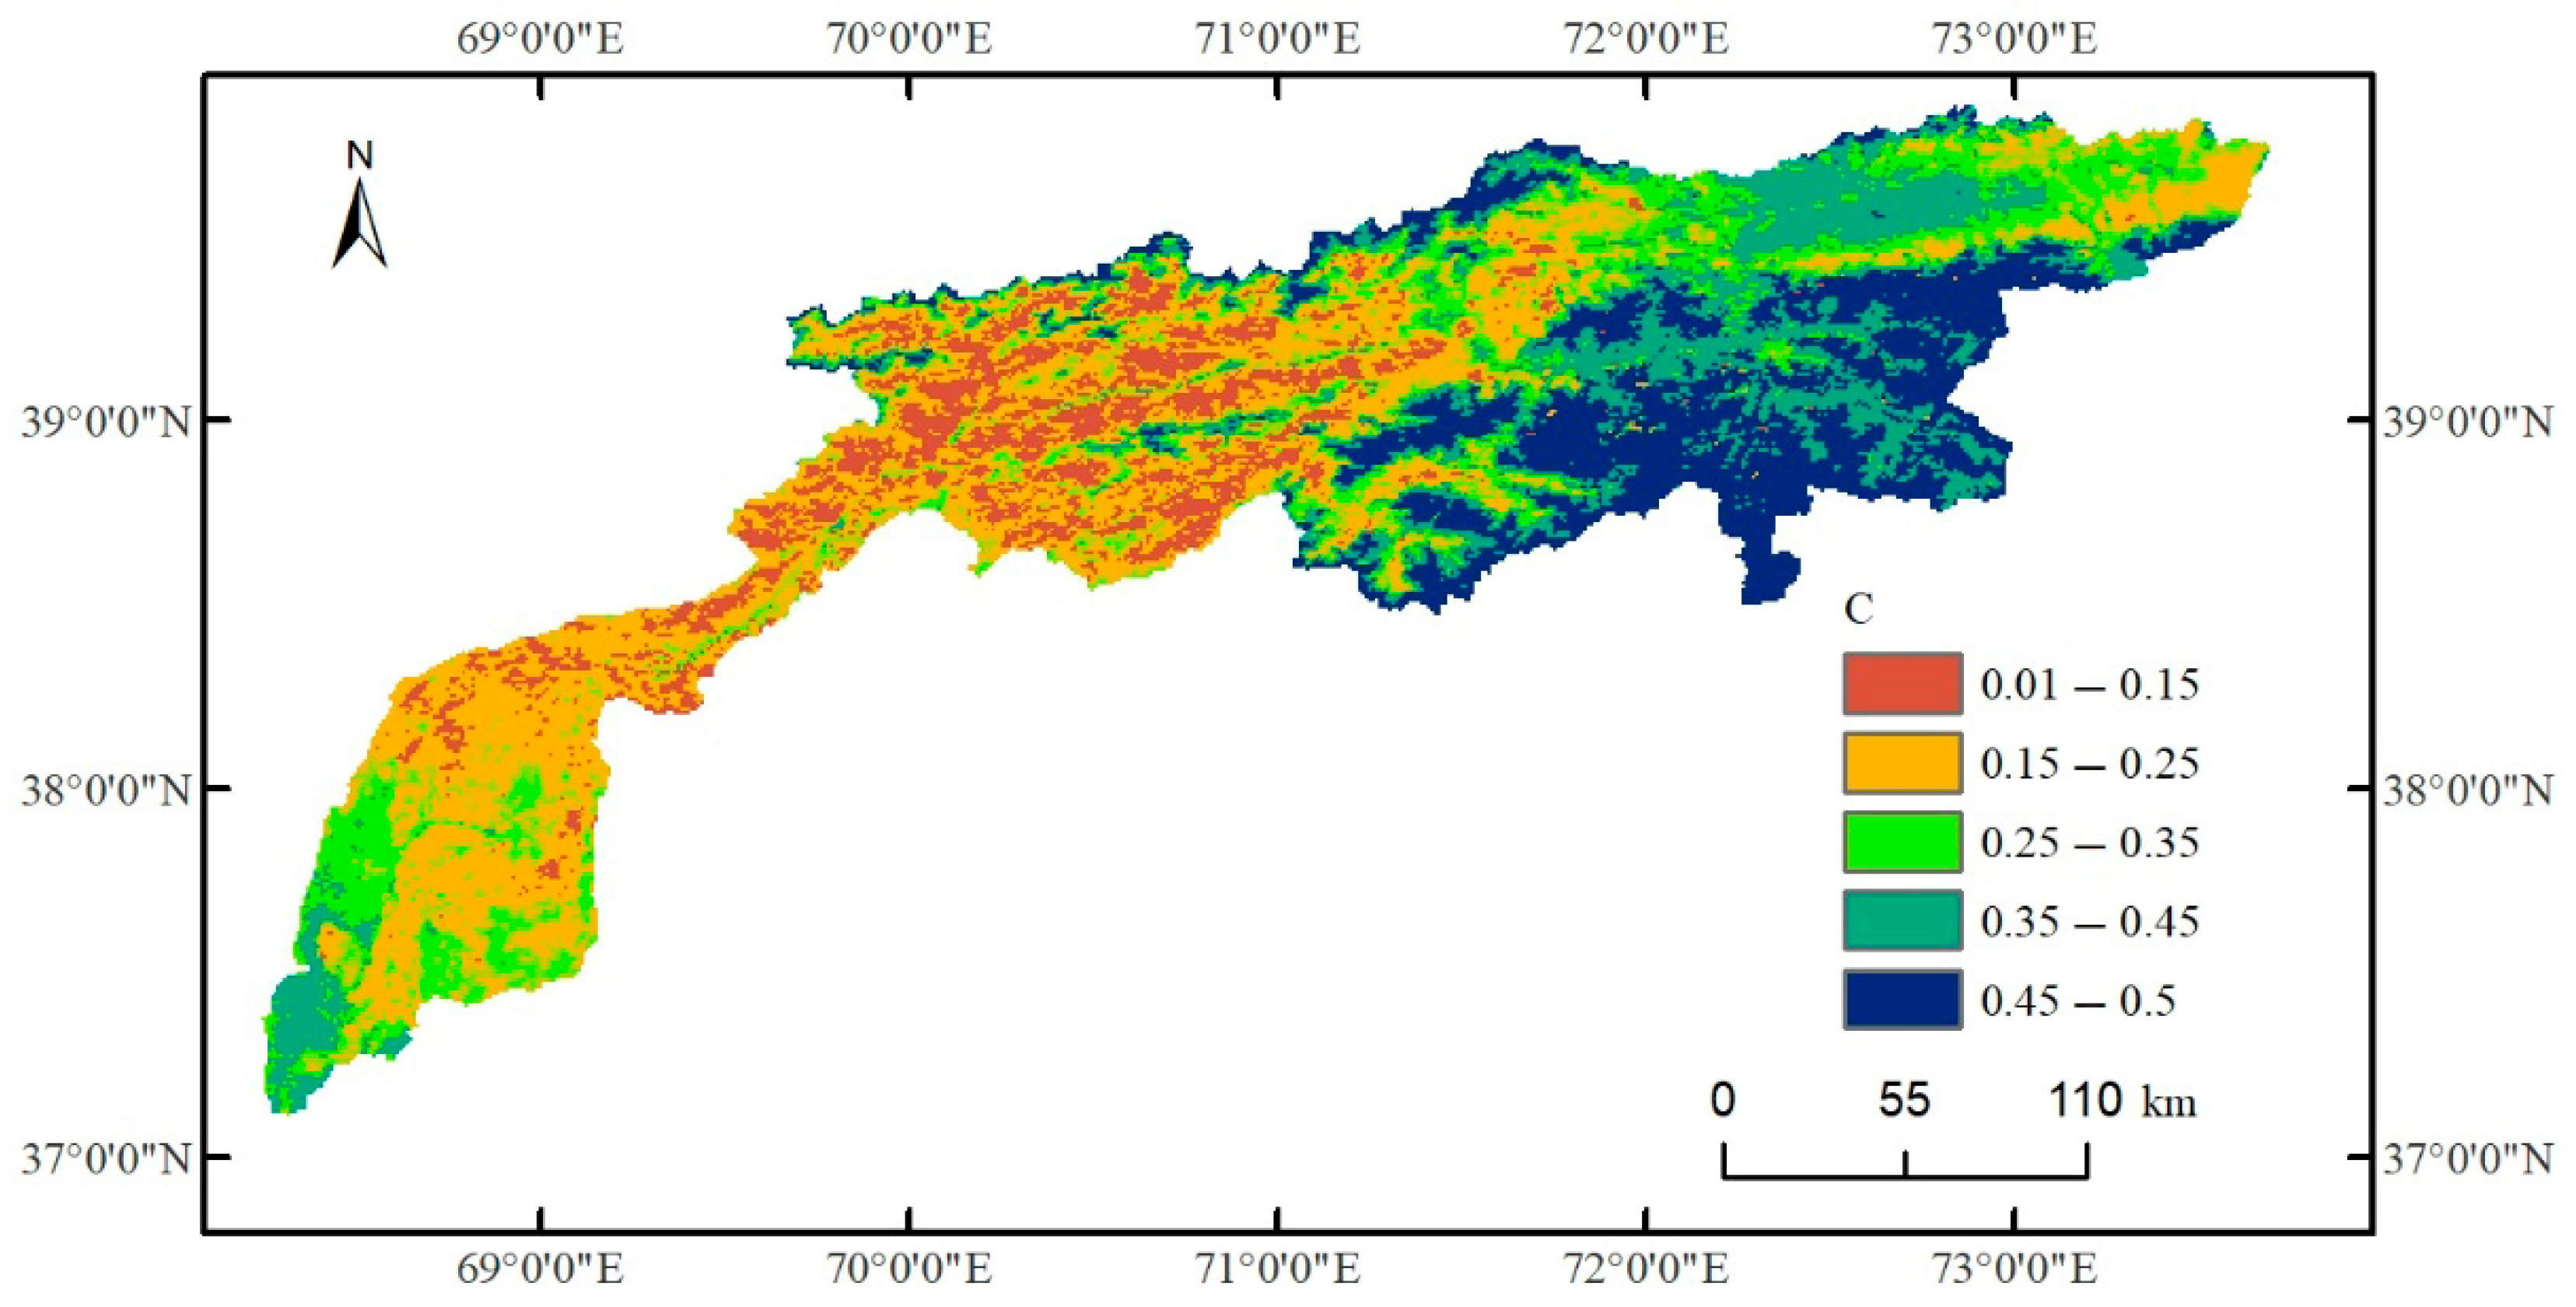
Figure 12 shows that the value of C in the basin ranges between 0.01 and 0.5, displaying an overall trend of higher values in the east and lower values in the west. Most areas in the east exceed 0.25, while most areas in the west are below 0.25. Additionally, there is a local high-value zone in the lower western region, and the western part exhibits a south-to-north decreasing distribution pattern.
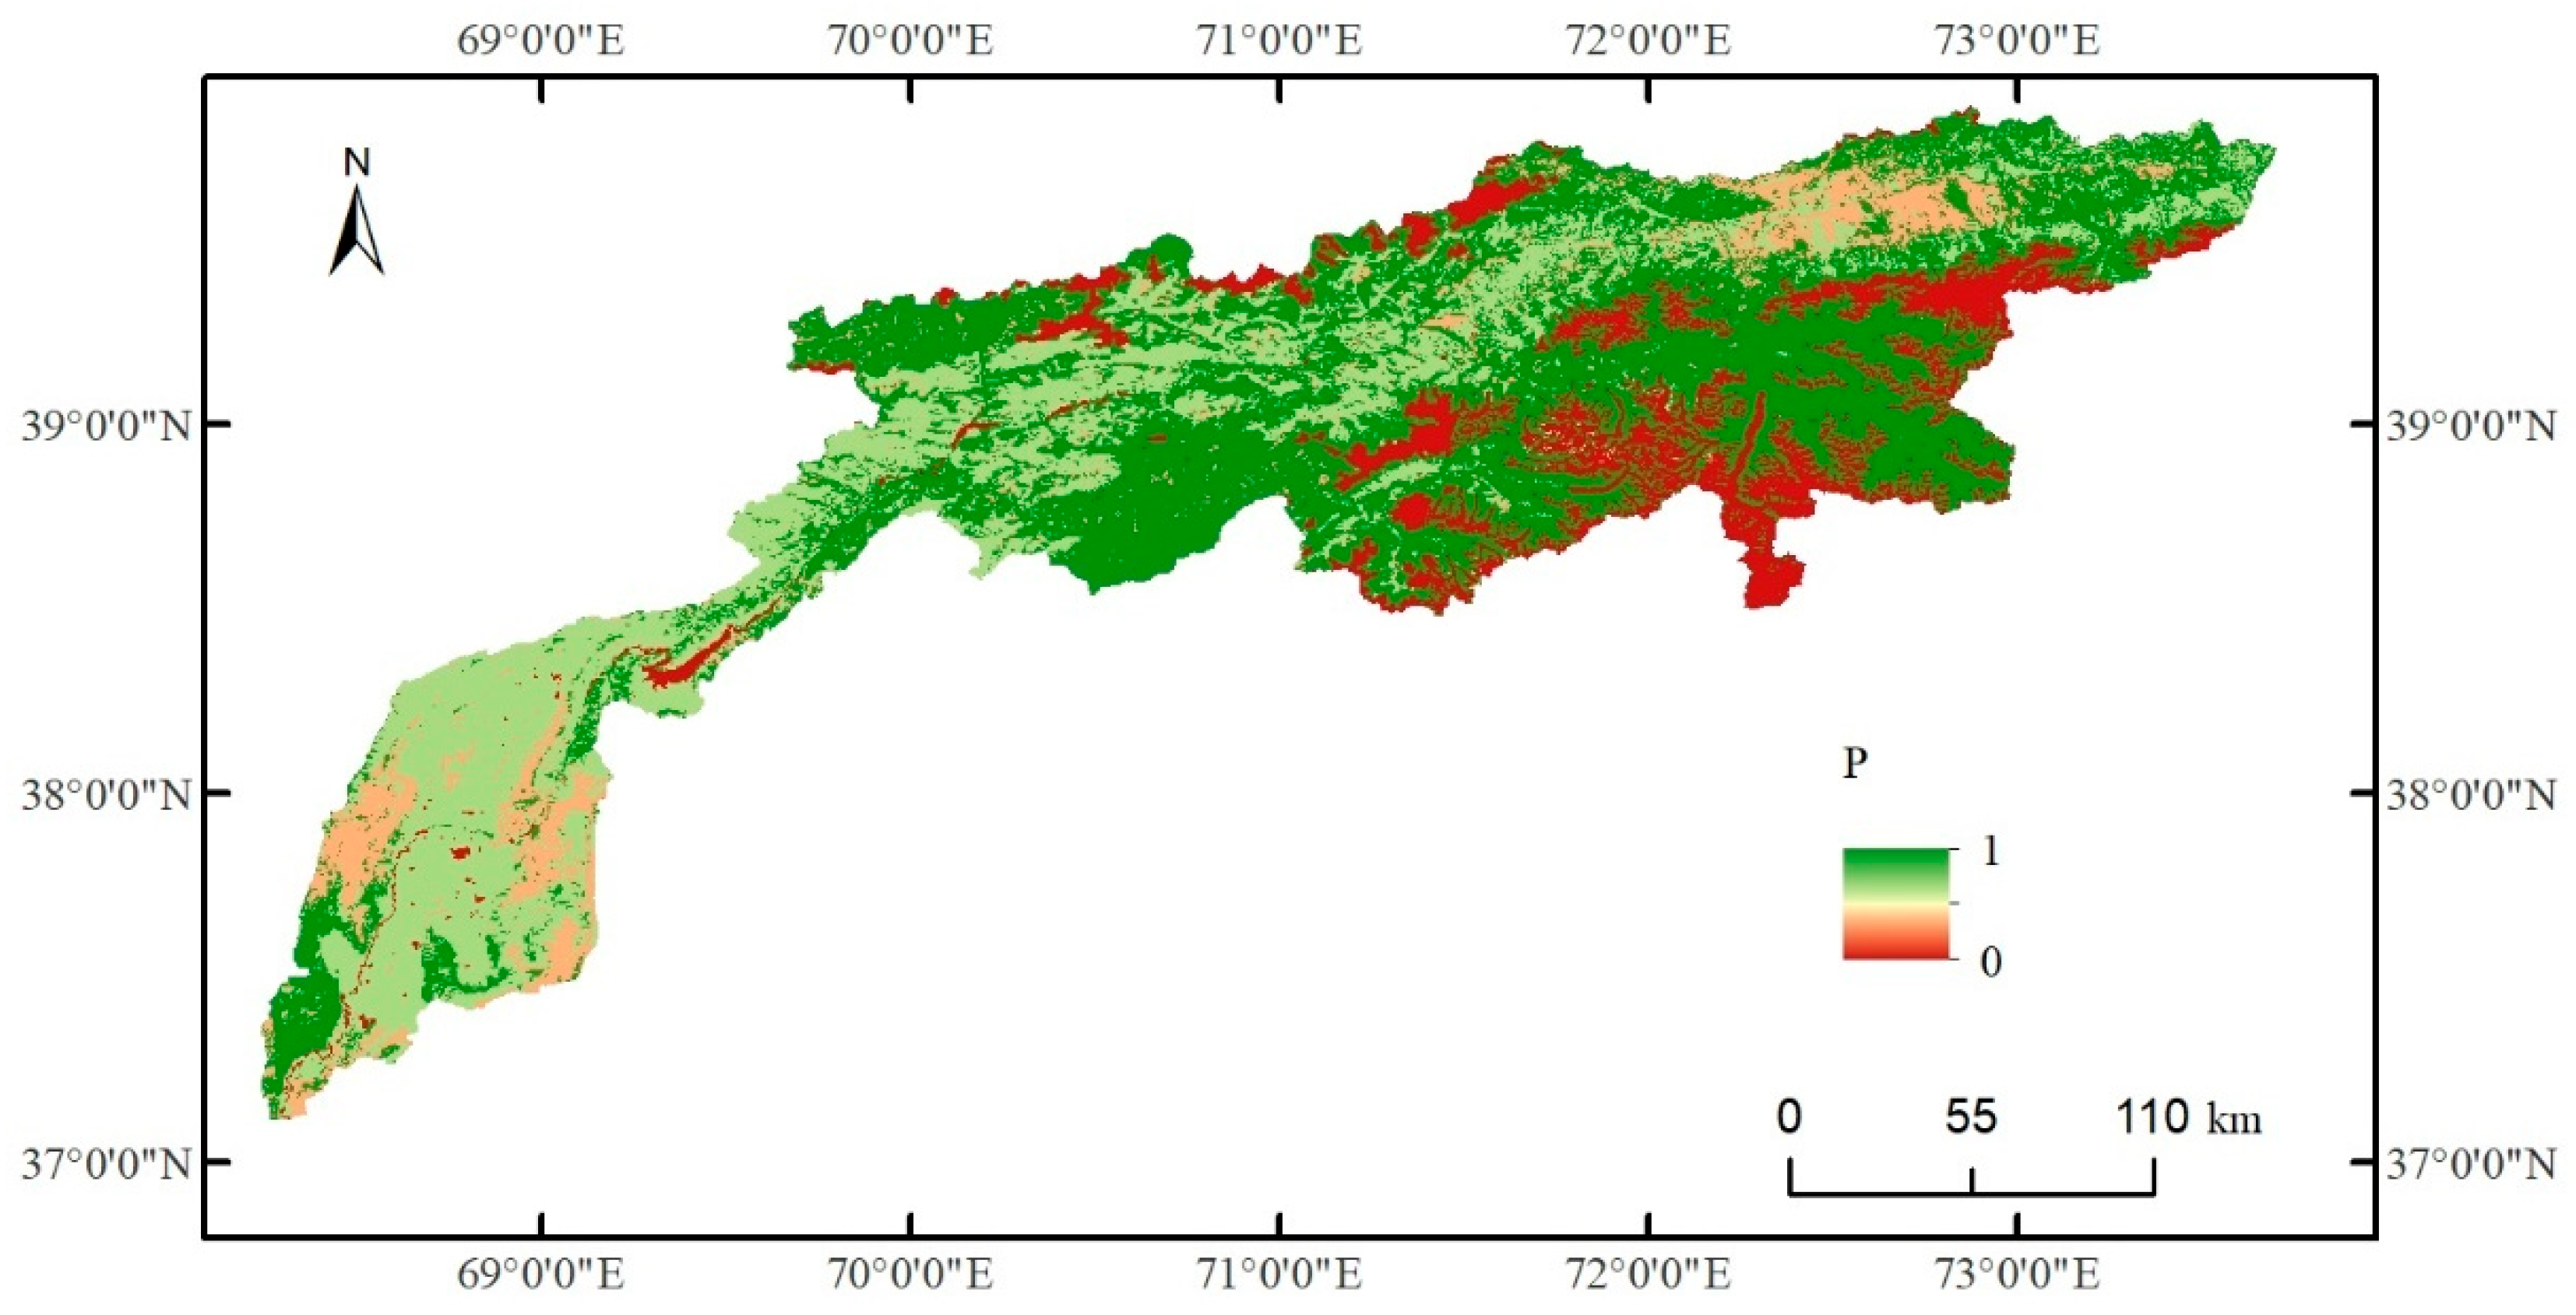
Figure 13 indicates that both the high-value and low-value areas of p in the basin are concentrated in the eastern region, with most eastern areas exceeding 0.25, while most western areas remain below 0.25. This suggests that soil and water conservation efforts are under greater pressure in the upstream areas.
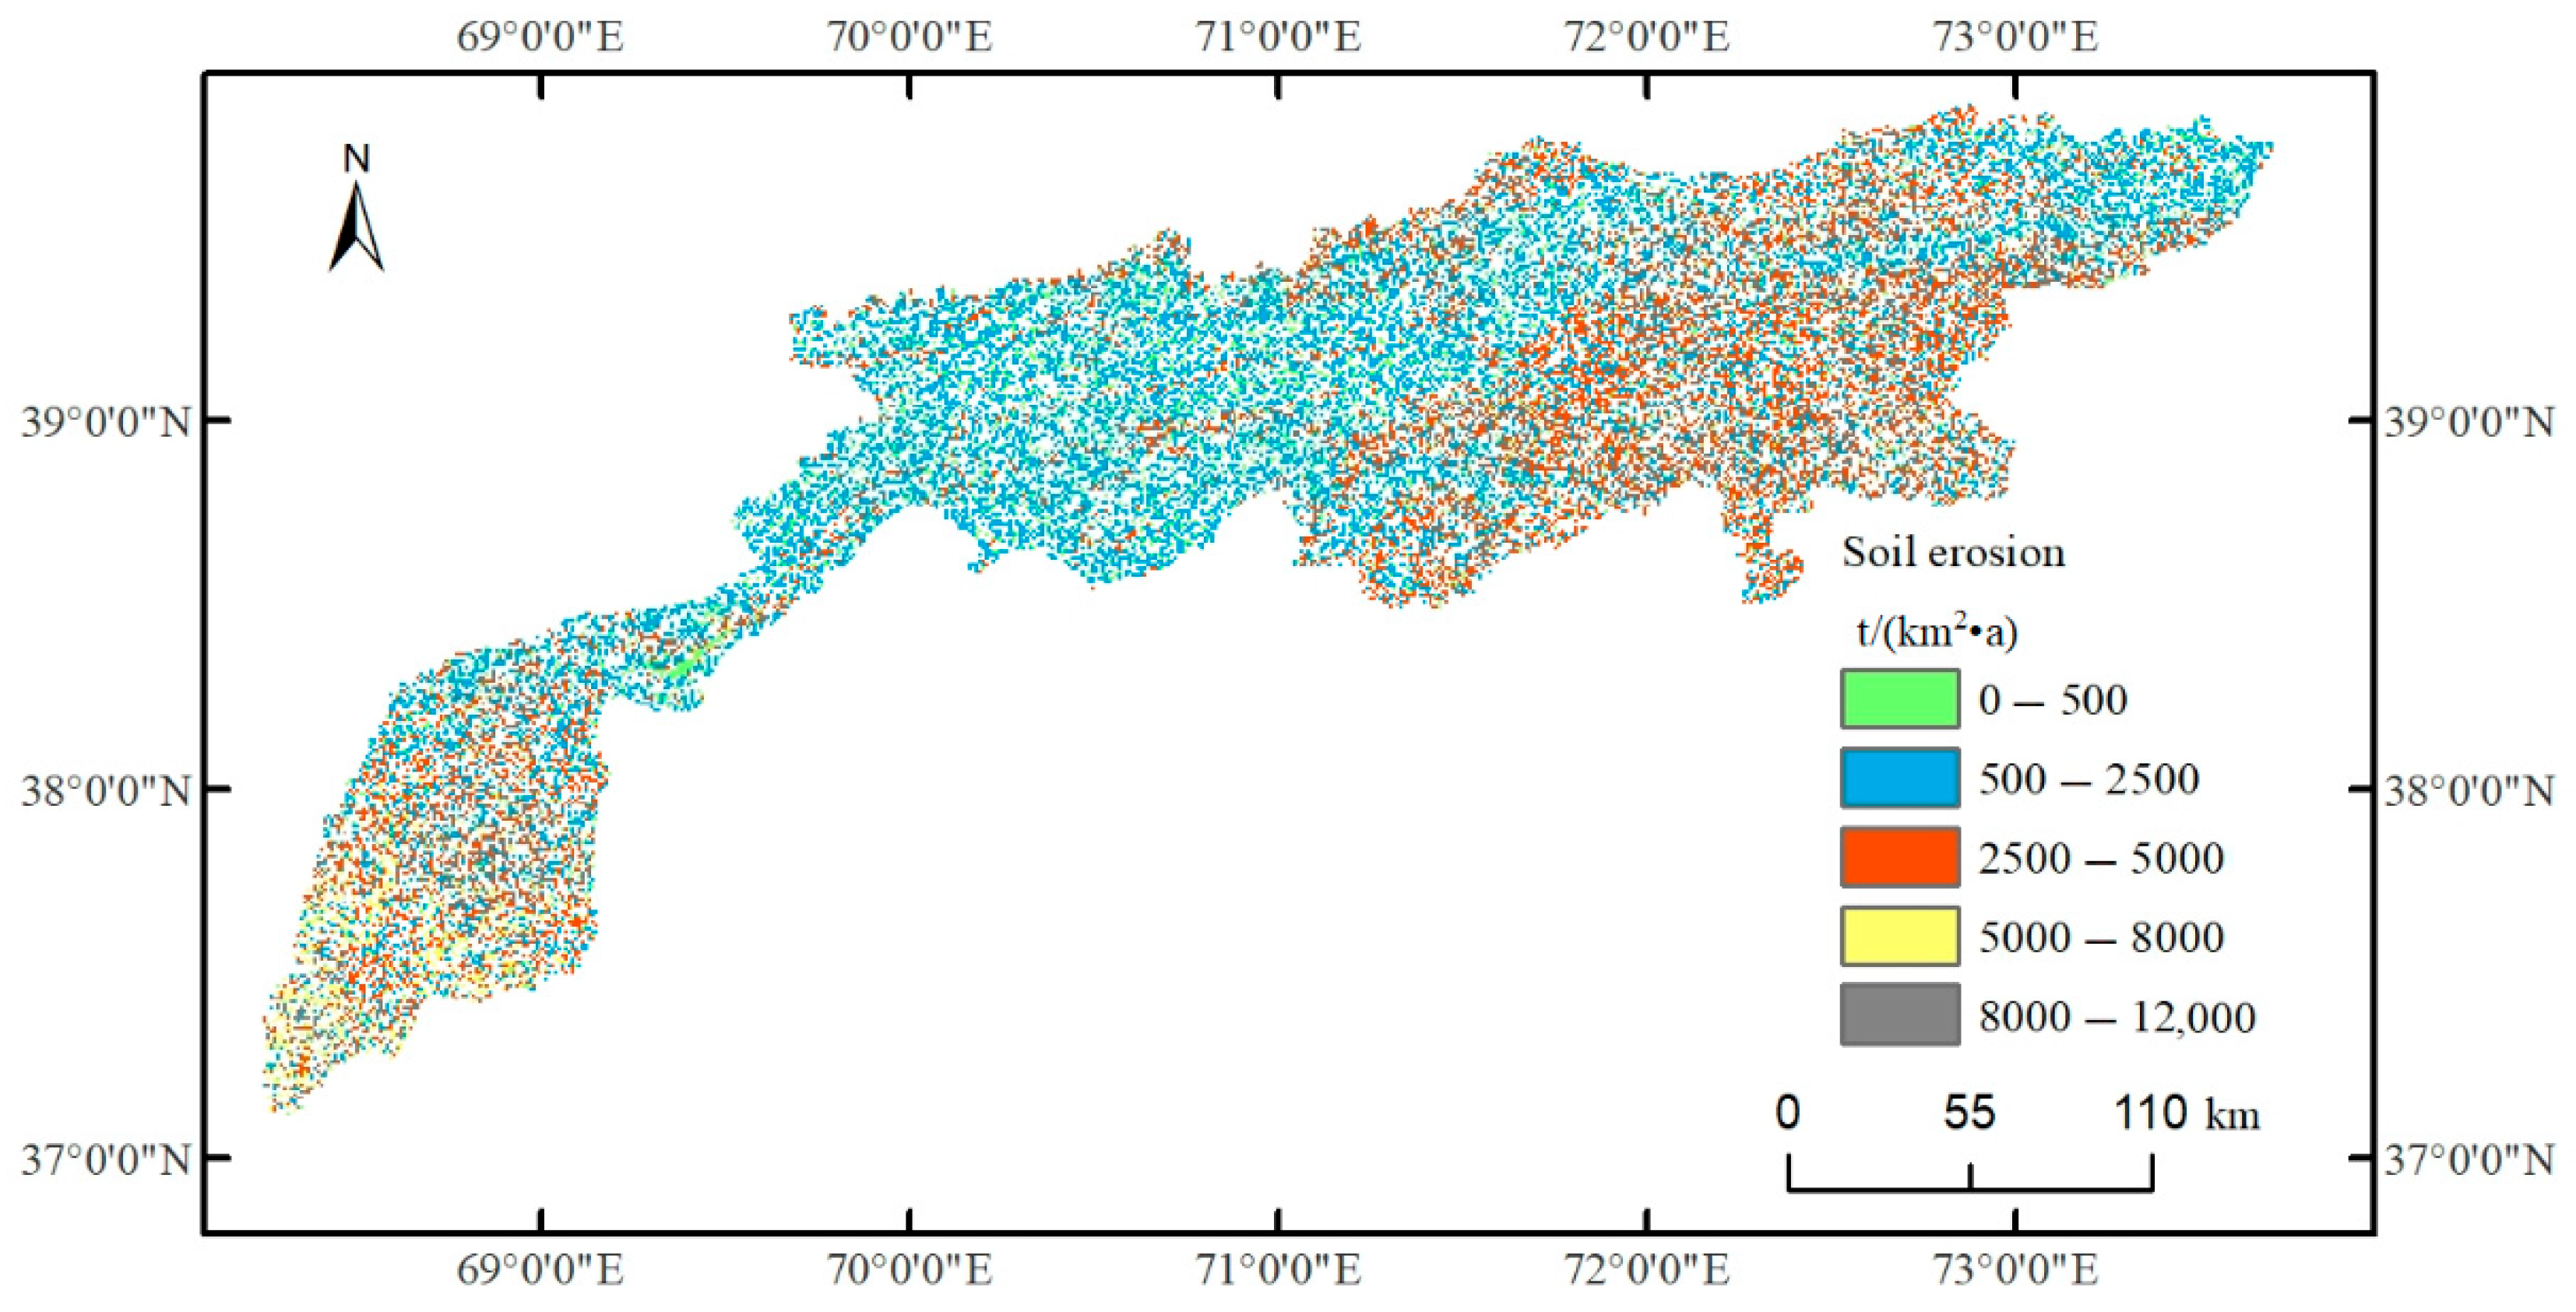
Figure 14 shows that soil erosion in the basin is generally higher in the eastern and western regions than in the central area, with most values below 2500 t/(km2·a). According to the soil erosion classification standard, soil erosion can be categorized into six levels: slight, moderate, severe, very severe, extremely severe, and extreme, with classification thresholds as shown in the legend. Most areas in the east and southwest fall into moderate erosion or higher, with extreme erosion observed in some regions. The results indicate that the headwaters of the Wakash River basin suffer from severe soil erosion, posing a significant threat to sediment deposition in mid- and downstream hydropower reservoirs.

3.2.4. Impact of Soil Erosion Changes on Hydropower Development

Soil erosion affects power generation efficiency primarily through loss of reservoir capacity and head reduction. Sediment deposition directly encroaches on the effective storage capacity of reservoirs, diminishing their water level regulation capabilities. Studies indicate that every cubic meter of sediment deposition reduces usable reservoir capacity by approximately 0.7–1.0 m3.
Head height (water level difference) is a critical parameter for power generation efficiency; sedimentation lowers the H value, directly reducing electricity output. Additionally, sediment accumulation at turbine inlets and diversion channels creates flow resistance, increasing head loss (the mechanical energy lost per unit weight of water flow). The Three Gorges Dam case demonstrates that sediment-induced friction can decrease power generation by 5–15%.
Moreover, equipment wear escalates maintenance costs. Some hydropower stations report annual maintenance expenses rising by 30–50% due to sediment-related damage.
Based on the average soil erosion conditions in the watershed over multiple years, with 75% of sediment deposited along the river channel and hydropower reservoir, head loss is further calculated, followed by energy loss estimation. The results are shown in Table 4.

3.2.5. Uncertainty Analysis

This study primarily employs the SRM (Snowmelt Runoff Model) and MUSLE (Modified Universal Soil Loss Equation) models to analyze changes in water resources and hydropower under climate change scenarios. The uncertainties in the study mainly stem from the following aspects:
(1)
Multi-source input data. The analysis utilizes DEM (Digital Elevation Model), remote sensing data, climate change scenario data, and observed data. Uncertainties arise from the resolution differences among these data sources and the impact of cloud cover on remote sensing data, with climate change scenario data exhibiting particularly prominent uncertainties.
(2)
Hydrological model parameters. The spatial distributotal, tion of three hydrological meteorological stations in the basin is insufficient to accurately represent spatial variations in the Vakhsh River Basin, which features complex topography. Although most model parameters are derived from field observations and information inversion, data errors and calibrated parameters still introduce significant uncertainties.
(3)
MUSLE factor parameters. In practical applications of the MUSLE model, many scholars adapt it to specific scenarios, leading to variations in thresholds across different contexts. Given the study area’s elevation range from low to high altitudes, high-altitude regions are characterized by steeper terrain and significant differences in soil erosion due to snow and glacier influence. This study does not classify these variations, introducing uncertainties into the results.
To address these issues, subsequent research will implement the following improvements: integrate high-resolution remote sensing data; interpolate and fuse spatial hydrological meteorological data; and refine regional segmentation based on terrain and runoff generation conditions. These enhanced measures will establish more robust feedback mechanisms.

4. Conclusions

Hydropower resources are critically important for the development of clean energy in Tajikistan. To address potential fluctuations in hydropower resources caused by climate change, this study takes the Vakhsh River Basin as a case study. Using the SRM model and MUSLE model, along with hydrological observation data, DEM, and CMIP6 datasets, it analyzes the impacts of changes in runoff and soil erosion under RCP2.6, RCP4.5, and RCP8.5 scenarios on hydropower resources. The main findings are as follows:
The analysis of hydropower potential reveals that the basin’s resources range from 5.2 to 537.4 billion kWh/a, with high-value zones concentrated in mountainous areas upstream of Nurex and low-value zones in downstream plains. Over 90% of the region exceeds 100 billion kWh/a. At reliability levels of 75% ≤ p ≤ 90%, hydropower values at different sections surpass 1.81 × 10¹⁰ kWh/a, enabling feasible exploitation planning.
Snowmelt runoff modeling: Results show runoff increases with rising precipitation and temperatures, with a projected 68–226 m3/s rise over 50 years. The trend follows RCP4.5 < RCP2.6 < RCP8.5. Under all three scenarios, hydropower grows in tandem with runoff (162–328,108 kWh/a), spatially and temporally consistent with runoff changes.
Soil erosion analysis reveals that eastern and southwestern regions experience moderate to severe erosion, posing significant siltation threats to downstream reservoirs. A one-millimeter increase in precipitation causes 939.93 kWh/a of hydropower loss due to erosion.
To address the impact of water resource changes on hydropower generation under climate change and ensure the operational safety of water conservancy projects, it is essential to establish a climate assessment system for hydropower stations, optimize site selection and scheduling plans, develop emergency response protocols, and scientifically adjust reservoir water levels to mitigate droughts or floods.

Author Contributions

H.L.: Conceptualization, Methodology, Formal analysis, Visualization, Writing—Original draft, Writing—review and editing. A.G.: Writing—review and editing. F.S.: Writing—review and editing. All authors have read and agreed to the published version of the manuscript.

Funding

This research was funded by the Science and Technology Program of Xinjiang Uyghur Autonomous Region (2025E01030) and the Intergovernmental international scientific and technological innovation cooperation project (2025YFE0102800).

Data Availability Statement

Data used in this study are available under reasonable request from authors.

Acknowledgments

The authors would like to thank the Institute of Water Problems, Hydropower and Ecology of the National Academy of Sciences of Tajikistan for providing us the historical average daily water flow data.

Conflicts of Interest

The authors declare no conflicts of interest.

References

  1. Gilland, B. Population, economic growth, and energy demand, 1985–2020. Popul. Dev. Rev. 1988, 14, 233–244. [Google Scholar] [CrossRef]
  2. Holdren, J.P. Population and the energy problem. Popul. Env. 1991, 12, 231–255. [Google Scholar] [CrossRef]
  3. van Ruijven, B.J.; De Cian, E.; Wing, I.S. Amplification of future energy demand growth due to climate change. Nat. Commun. 2019, 10, 2762. [Google Scholar] [CrossRef]
  4. Siri, R.; Mondal, S.R.; Das, S. Hydropower: A renewable energy resource for sustainability in terms of climate change environmental protection. In Alternative Energy Resources; The handbook of environmental chemistry; Pathak, P., Srivastava, R.R., Eds.; Springer: Cham, Switzerland, 2020; Volume 99. [Google Scholar] [CrossRef]
  5. Andronova, I.V.; Kuzmin, V.V.; Tinkova, A.A. Global Hydropower as the main driver of sustainable development in the context of industry 40. In Industry 4.0; Zavyalova, E.B., Popkova, E.G., Eds.; Palgrave Macmillan: Cham, Switzerland, 2022. [Google Scholar] [CrossRef]
  6. Othman, M.E.F.; Sidek, L.M.; Basri, H.; El-Shafie, A.; Ahmed, A.N. Climate challenges for sustainable hydropower development and operational resilience: A review. Renew. Sustain. Energy Rev. 2025, 209, 115108. [Google Scholar] [CrossRef]
  7. Viers, J.H. Hydropower relicensing and climate change. J. Am. Water Resour. Assoc. 2011, 47, 655–661. [Google Scholar] [CrossRef]
  8. Falchetta, G.; David, E.H.J.; Gernaat, J.H.; Sebastian, S. Hydropower dependency and climate change in sub-Saharan Africa: A nexus framework and evidence-based review. J. Clean. Prod. 2019, 231, 1399–1417. [Google Scholar] [CrossRef]
  9. Neupane, P.; Khanal, A.; Kafle, M.; Bhattarai, S.; Khanal, A. Climate change influence on hydropower energy output variability. J. Appl. Water Eng. Res. 2025, 13, 251–268. [Google Scholar] [CrossRef]
  10. Vliet, M.V.; Wiberg, D.; Leduc, S.; Riahi, K. Power-generation system vulnerability and adaptation to changes in climate and water resources. Nat. Clim. Change 2016, 6, 375–380. [Google Scholar] [CrossRef]
  11. Shu, J.; Qu, J.J.; Motha, R.; Dong, D.F. Impacts of climate change on hydropower development and sustainability: A review. IOP Conf. Ser. Earth Environ. Sci. 2018, 163, 012126. [Google Scholar] [CrossRef]
  12. Zhang, Q.; Kang, S.; Chen, F. Glacier variations in the Fedchenko basin, Tajikistan, 1992–2006: Insights from remote-sensing images. Mt. Res. Dev. 2014, 34, 56–65. [Google Scholar] [CrossRef]
  13. Guay, C.; Minville, M.; Braun, M. A global portrait of hydrological changes at the 2050 horizon for the province of Québec. Can. Water Resour. J. Rev. Can. Des Ressour. Hydr. 2015, 40, 285–302. [Google Scholar] [CrossRef]
  14. Fu, X.; Wang, X.; Gong, Y.; Wang, Y.; Zhang, Y. Impact of snow weather on PV power generation and improvement of power forecasting. In Proceedings of the 2023 International Conference on Power Energy Systems and Applications (ICoPESA), Nanjing, China, 24–26 February 2023; pp. 448–453. [Google Scholar] [CrossRef]
  15. Chen, F.; Chen, J.; Huang, W.; Chen, S.; Huang, X.; Jin, L.; Jia, J.; Zhang, X.; An, C.; Zhang, J.; et al. Westerlies Asia and monsoonal Asia: Spatiotemporal differences in climate change and possible mechanisms on decadal to sub-orbital timescales. Earth-Sci. Rev. 2019, 192, 337–354. [Google Scholar] [CrossRef]
  16. Dilinuer, T.; Yao, J.-Q.; Chen, J.; Mao, W.-Y.; Yang, L.-M.; Yeernaer, H.; Chen, Y.-H. Regional drying and wetting trends over Central Asia based on Köppen climate classification in 1961–2015. Adv. Clim. Change Res. 2021, 12, 363–372. [Google Scholar] [CrossRef]
  17. Woolway, R.I.; Kraemer, B.M.; Lenters, J.D.; Merchant, C.J.; O’Reilly, C.M.; Sharma, S. Global lake responses to climate change. Nat. Rev. Earth Env. 2020, 1, 388–403. [Google Scholar] [CrossRef]
  18. Li, Z.; Li, Y.; Li, H.; Liu, Y.; Wang, C. Analysis of drought change and its impact in Central Asia. Adv. Earth Sci. 2022, 37, 37–50. [Google Scholar] [CrossRef]
  19. Jalilov, S.M.; Keskinen, M.; Varis, O.; Amer, S.; Ward, F.A. Managing the water–energy–food nexus: Gains and losses from new water development in Amu Darya river basin. J. Hydrol. 2016, 539, 648–661. [Google Scholar] [CrossRef]
  20. Yu, J.; Gao, B.; Li, M.; Xiao, P. Improving runoff modelling through strengthened snowmelt and glacier module enhances runoff attribution in a large watershed in Central Asia. J. Hydrol. 2025, 660, 133528. [Google Scholar] [CrossRef]
  21. Tan, Z.; Liu, H.; Gao, F. Experimental research on reduction measures of sediment Deposition of the power plant port under the long period wave. Procedia Eng. 2015, 116, 229–236. [Google Scholar] [CrossRef]
  22. Timmerman, J.G.; Koeppel, S.; Bernardini, F.; Buntsma, J.J. Adaptation to climate change: Challenges for transboundary water management. In The Economic, Social and Political Elements of Climate Change; Climate Change Management; Leal Filho, W., Ed.; Springer: Berlin/Heidelberg, Germany, 2011. [Google Scholar] [CrossRef]
  23. Abuduwaili, J.; Issanova, G.; Saparov, G. Water resources in Tajikistan. In Hydrology and Limnology of Central Asia; Water Resources Development and Management; Springer: Singapore, 2019. [Google Scholar] [CrossRef]
  24. Fallah, B.; Didovets, I.; Rostami, M.; Hamidi, M. Climate change impacts on Central Asia: Trends, extremes and future projections. Int. J. Climatol. 2024, 44, 3191–3213. [Google Scholar] [CrossRef]
  25. Chen, M.; Zeng, S.; Yang, L.; Ren, Y.; Xia, J. Statistical insights into the water exchange process in the Yangtze-Poyang System: The YPWES model. J. Hydrol. Reg. Stud. 2022, 40, 101054. [Google Scholar] [CrossRef]
  26. Bilal, H.; Siwar, C.; Mokhtar, M.B.; Lahlou, F.Z.; Kanniah, K.D.; Al-Ansari, T. Snow runoff modelling in the upper Indus River Basin and its implication to energy water food nexus. Ecol. Model. 2024, 498, 110871. [Google Scholar] [CrossRef]
  27. Williams, J.R. Sediment-yield prediction with universal equation using runoff energy factor. In Present and Prospective Technology for Predicting Sediment Yield and Sources; US Department of Agriculture, Agriculture Research Service: Washington, DC, USA, 1975; pp. 244–252. [Google Scholar]
  28. Sadeghi, S.H.R.; Gholami, L.; Darvishan, A.K.; Saeidi, P. A review of the application of the MUSLE model worldwide. Hydrol. Sci. J. 2014, 59, 365–375. [Google Scholar] [CrossRef]
  29. Yang, L.; Gao, M.; Chen, J.; Shi, W.; Hou, C.; Liu, Z.; Luo, C.; Yu, J.; Yang, X.; Dong, J. Effects of climate variables and human activities on groundwater level fluctuations in unconsolidated sedimentary aquifers: A data-driven approach. Hydrology 2025, 12, 215. [Google Scholar] [CrossRef]
  30. Peng, Q.; Wang, R.; Jiang, Y.; Zhang, W.; Liu, C.; Zhou, L. Soil erosion in Qilian Mountain National Park: Dynamics and driving mechanisms. J. Hydrol. Reg. Stud. 2022, 42, 101144. [Google Scholar] [CrossRef]
  31. Wischmeier, W.H.; Mannering, J.V. Relation of soil properties to its erodibility. Soil Sci. Soc. Am. Proc. 1963, 33, 131–137. [Google Scholar] [CrossRef]
  32. Williams, J.R.; Renard, K.G.; Dyke, P.T. A new method for assessing erosions effect on soil Productivity. J. Soil Water Conserv. 1983, 38, 38–383. [Google Scholar] [CrossRef]
  33. Zhang, M.; Wei, J.C.; Yang, Q.K.; Baartman, J.E.M.; Gai, L.; Yang, X.; Li, S.Q.; Yu, J.; Ritsema, C.J.; Geissen, V. An improved method for calculating slope length(λ) and the LS parameters of the revised universal soil loss equation for large watersheds. Geoderma 2017, 308, 36–45. [Google Scholar] [CrossRef]
  34. Cai, C.; Ding, S.; Shi, Z.; Huang, L.; Zhang, G.Y. Study of applying USLE and geographical information system IDRISI to predict soil erosion in small watershed. J. Soil Water Conserv. 2000, 14, 19–24. [Google Scholar]
  35. Bhagwat, N.; Kumar, R.; Qureshi, M.; Nagisetty, R.M.; Zhou, X. The Status, Applications, and Modifications of the Snowmelt Runoff Model (SRM): A Comprehensive Review. Hydrology 2025, 12, 156. [Google Scholar] [CrossRef]
  36. Phien, H.N.; Ajirajah, T.J. Applications of the log Pearson type-3 distribution in hydrology. J. Hydrol. 1984, 73, 359–372. [Google Scholar] [CrossRef]
  37. Paul, J.; Pilon, K. Adamowski, Asymptotic variance of flood quantile in log Pearson Type III distribution with historical information. J. Hydrol. 1993, 143, 481–503. [Google Scholar] [CrossRef]
  38. Asghari, F.B.; Mohammadi, A.A.; Dehghani, M.H.; Yousefi, M. Data on assessment of groundwater quality with application of ArcGIS in Zanjan, Iran. Data Brief. 2018, 18, 375–379. [Google Scholar] [CrossRef] [PubMed]
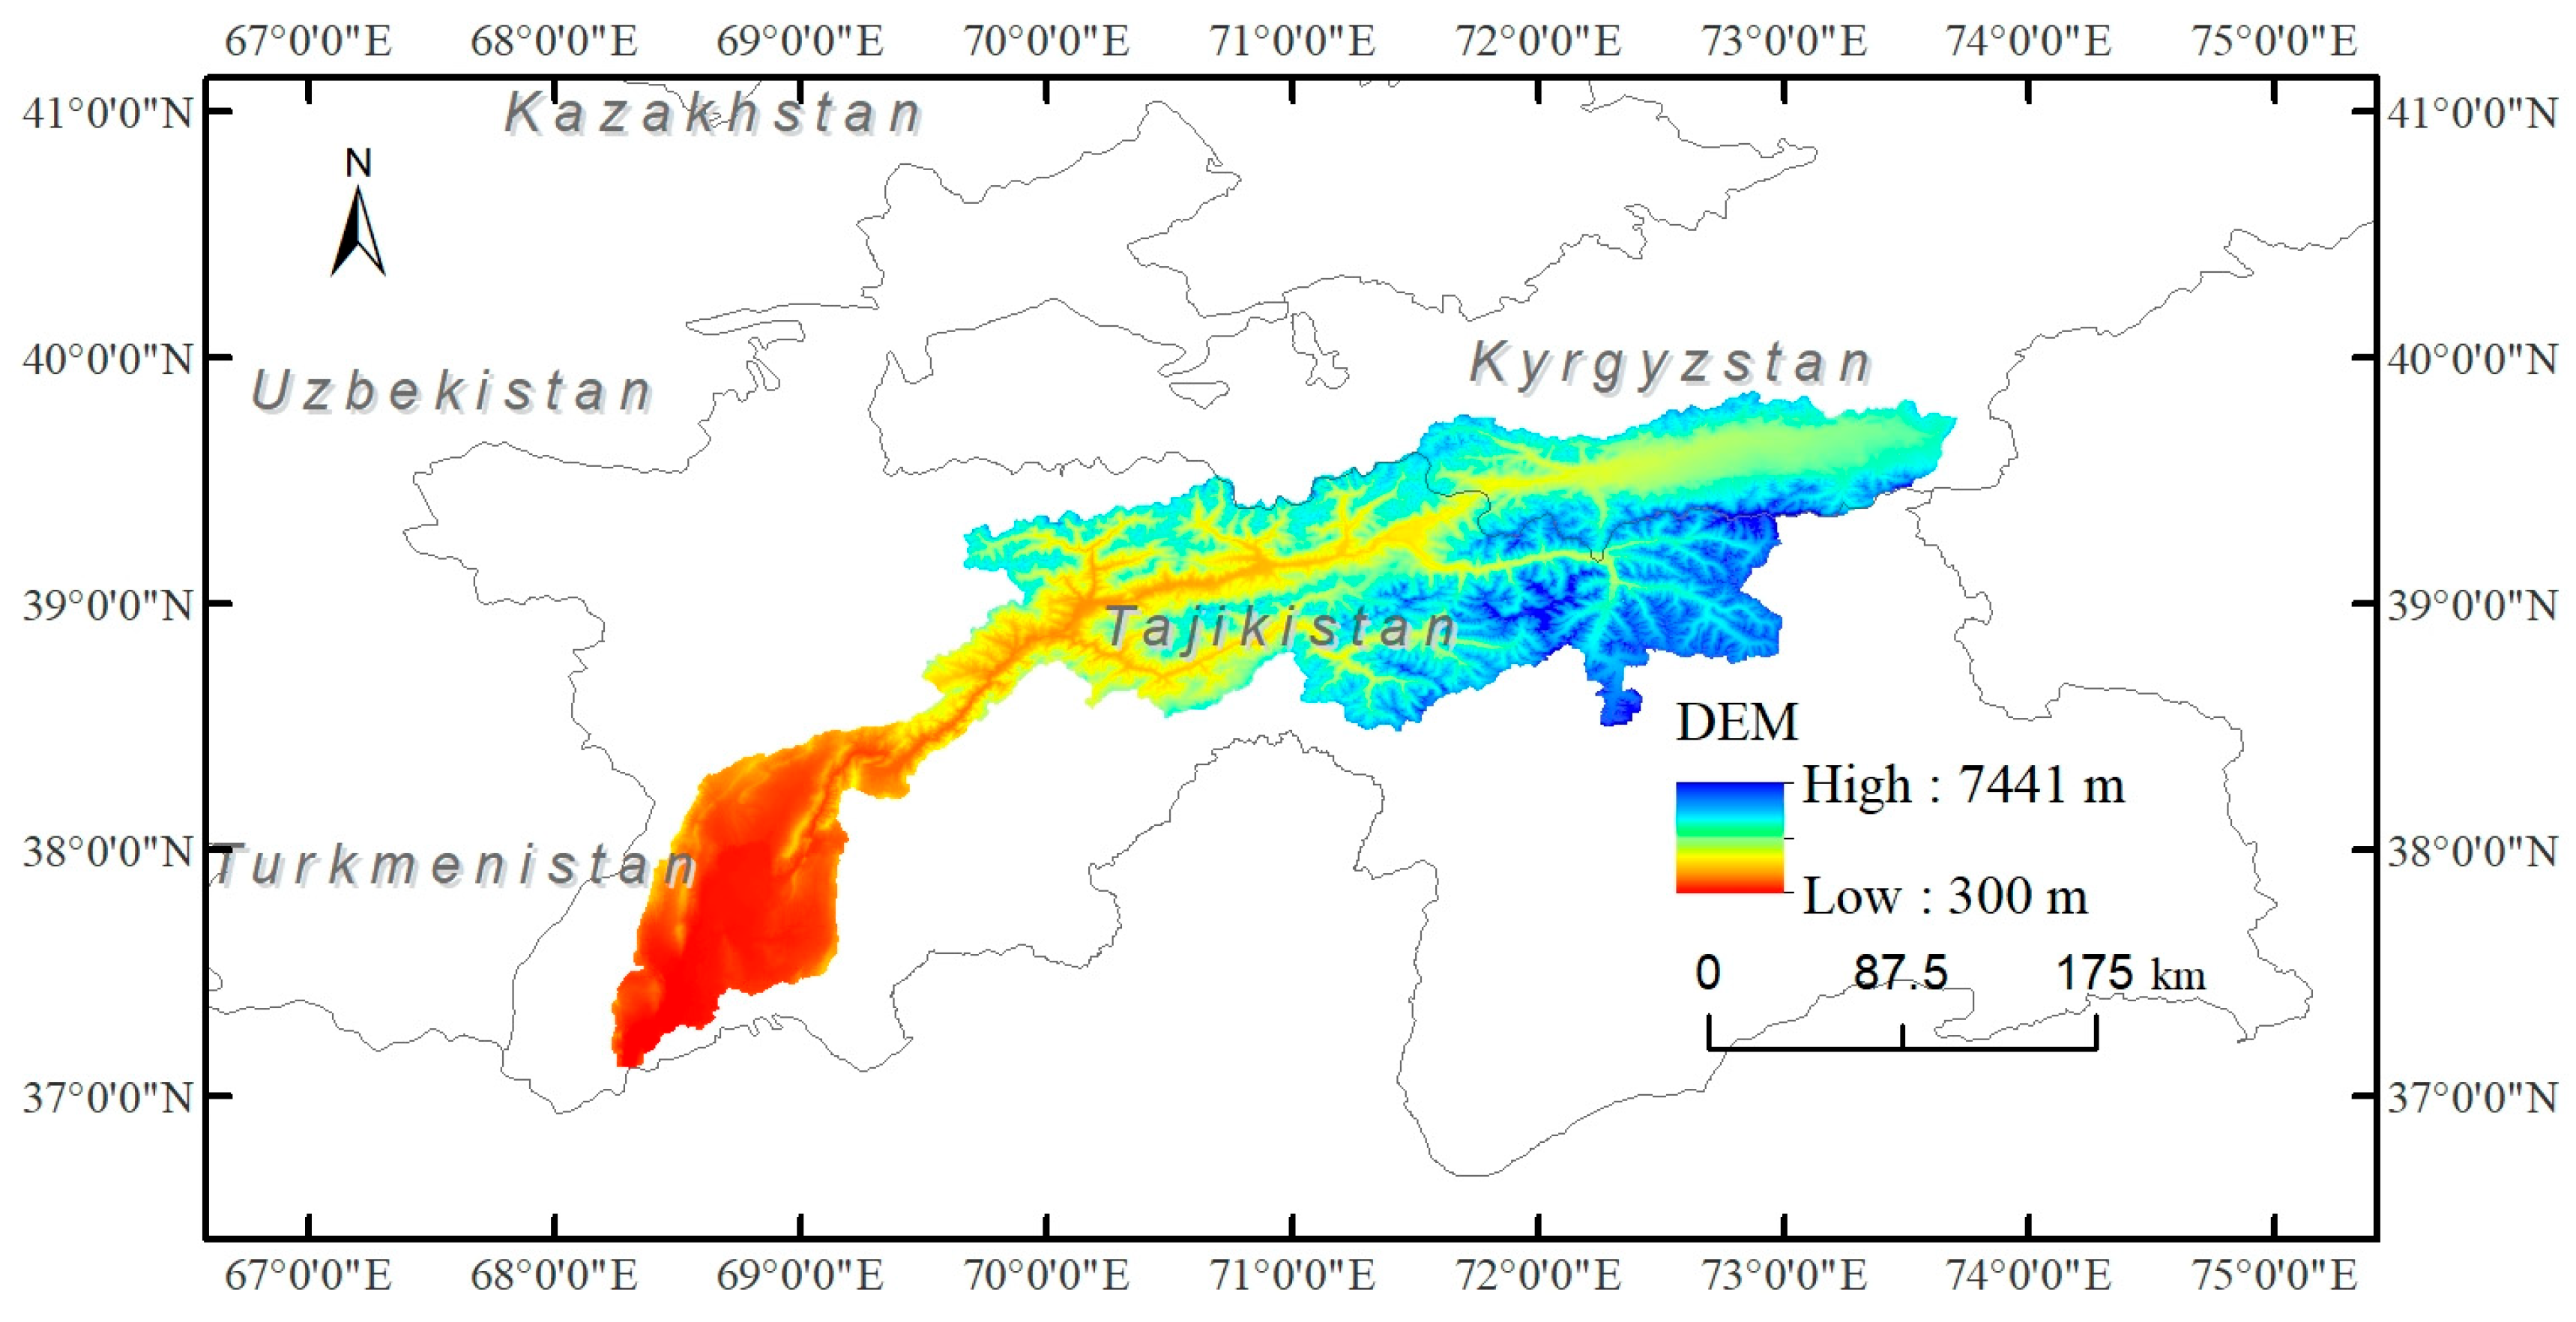
Figure 1. Study area distribution map.
Hydrology 12 00294 g001
Figure 2. Methodology flowchart.
Hydrology 12 00294 g002
Figure 3. Spatial distribution of hydropower resources in the Vakhsh river basin.
Hydrology 12 00294 g003
Figure 4. Frequency distribution of hydropower resources.
Hydrology 12 00294 g004aHydrology 12 00294 g004b
Figure 5. Intra-annual distribution characteristics of hydropower resources.
Hydrology 12 00294 g005
Figure 6. Runoff simulation of the Garm hydrological section based on the SRM model.
Hydrology 12 00294 g006
Figure 7. Comparison of actual and simulated daily runoff using scatter plots.
Hydrology 12 00294 g007
Figure 8. Changes in runoff under different climate scenarios.
Hydrology 12 00294 g008
Figure 9. Changes in hydropower resources under different climate scenarios.
Hydrology 12 00294 g009
Figure 10. Spatial distribution of the R factor in the Vakhsh river basin.
Hydrology 12 00294 g010
Figure 11. Spatial distribution of the LS factor in the Vakhsh river basin.
Hydrology 12 00294 g011
Figure 12. Spatial distribution of the C factor in the Vakhsh river basin.
Hydrology 12 00294 g012
Figure 13. Spatial distribution of the p factor in the Vakhsh river basin.
Hydrology 12 00294 g013
Figure 14. Spatial distribution of soil erosion in the Vakhsh river basin.
Hydrology 12 00294 g014
Table 1. p values for different land use types.
Land Use Typep
Farmland0.01
Forestland0.2
Grassland0.6
Water Body0
Built-up Area1
Bare Land0.8
Table 2. Calculation of hydropower resources at typical hydrological sections.
NameElevation Difference (m)Mean Annual Flow (m3/s)Hydropower Resources (×108 kWh/a)
Garm2007321.92554.65
Rogun2036645.01127.37
Nurek1413650.05788.53
Table 3. Fluctuation values of climate scenarios in the Vakhsh River Basin compared to the baseline (1976–1986) period.
Variable Scenario 2030s 2040s 2050s 2060s 2070s 2080s
TMax (°C)RCP2.60.190.180.330.460.440.27
RCP4.50.200.280.360.520.620.61
RCP8.50.210.510.760.831.191.40
TMin (°C)RCP2.60.220.220.350.400.440.27
RCP4.50.260.320.330.500.490.51
RCP8.50.190.460.630.701.041.15
Tav (°C)RCP2.60.210.200.340.430.440.27
RCP4.50.230.300.350.510.560.56
RCP8.50.200.490.690.761.121.28
p (mm)RCP2.66.675.966.979.606.0611.41
RCP4.56.273.798.189.868.168.75
RCP8.58.198.2210.448.256.726.21
Table 4. The impact of climate fluctuations on the Rogun hydropower station (95% confidence level).
ItemReservoir Capacity (×108 m3)Accumulation of Sediment (m3)Head Loss (m)Hydropower Energy Loss (kWh/a)
p (Multi-year average)133329,818.71(8.31 ± 1.15) × 10−3(1.57 ± 0.22) × 106
p ↑ + 1 mm ↑ 1978.91↑ (4.98 ± 0.69) × 10−5↑ 939.93 ± 130.78
In the table, ↑ represents an increase.
Disclaimer/Publisher’s Note: The statements, opinions and data contained in all publications are solely those of the individual author(s) and contributor(s) and not of MDPI and/or the editor(s). MDPI and/or the editor(s) disclaim responsibility for any injury to people or property resulting from any ideas, methods, instructions or products referred to in the content.