Abstract
In this study, molybdenum disulfide (MoS2)-based water nanofluids were prepared and stabilized using two surfactants with opposite charges: the cationic cetyltrimethylammonium bromide (CTAB) and the anionic sodium lauryl sulfate (SLS). Different MoS2:surfactant ratios (1:1, 1:2, and 1:3) were examined to identify the optimal formulation ensuring stable dispersion. Stability was evaluated through dynamic light scattering (DLS), zeta potential, and UV–Vis spectroscopy analyses. The results showed that the MoS2:SLS (1:3) nanofluid achieved the highest stability, characterized by a zeta potential of −38 mV and a mean particle size of approximately 290 nm. Thermophysical properties were then investigated for nanoparticle concentrations of 0.05, 0.1, and 0.2 wt%. The 0.1 wt% nanofluid exhibited the best performance, showing a thermal conductivity enhancement of about 49% and an increased specific heat capacity compared with pure water. This improvement is attributed to uniform nanoparticle dispersion and enhanced phonon transport. Overall, the results demonstrate that the anionic SLS surfactant at a 1:3 ratio effectively enhances the stability as well as the thermal performance of MoS2–water nanofluids, making them promising candidates for thermal management and energy systems applications.
1. Introduction
Nanofluids are colloidal suspensions consisting of nanoscale particles uniformly distributed in a base fluid, such as water, ethylene glycol, or oil. These nanoparticles typically range between 1 and 100 nm, have dimensions on the nanometer scale, and exhibit large surface area-to-volume ratios, leading to significant enhancements in thermal conductivity, viscosity control, and heat transfer performance [1]. Due to these properties, nanofluids have been widely explored for applications in thermal management, energy systems, and heat exchangers.
Among various nanomaterials, molybdenum disulfide (MoS2) has gained attention as a promising material owing to its layered crystalline structure, high thermal conductivity, and chemical stability [2,3]. MoS2 is a member of the transition metal dichalcogenide (TMDC) family, characterized by the general formula MX2, where M denotes a transition metal and X refers to a chalcogen element (S, Se, or Te). These materials exhibit unique electronic and thermal properties, attributed to their weak Van der Waals forces between the stacked atomic layers [4]. Despite its potential, the practical application of MoS2 nanofluids is hindered by particle aggregation and sedimentation, which degrade long-term stability and performance. Nanoparticles dispersed in fluids tend to aggregate due to gravitational forces, Van der Waals attractions, and electrostatic interactions, leading to a decline in thermal performance over time [5,6]. Two primary approaches are used to mitigate these stability issues: surfactant-assisted stabilization, where surface-active agents modify the particle surface charge to prevent aggregation [7,8] and ultrasonication, which utilizes high-frequency sound waves to break up agglomerates and ensure uniform dispersion [9,10].
In recent studies, surfactants such as sodium lauryl sulfate (SLS), cetyltrimethylammonium bromide (CTAB), polyvinylpyrrolidone (PVP), and gum arabic (GA) have been employed to stabilize various nanoparticle suspensions. For instance, Almanassra et al. [11] investigated carbon nanotube-based nanofluids stabilized with different surfactants, finding that a 1:1 or 1:0.5 surfactant-to-nanoparticle ratio led to long-term stability exceeding six months. Similarly, Almitani et al. [12] demonstrated enhanced thermal conductivity in silica nanofluids stabilized using CTAB and SLS. Other studies on Fe3O4 and Al2O3 nanofluids further emphasize the crucial role of surfactant selection in achieving optimal stability and thermophysical performance [13,14].
However, despite increasing research on surfactant-stabilized nanofluids, only a limited number of studies have specifically addressed the stability of MoS2 nanoparticles in heat transfer nanofluids, particularly in water-based systems. Moreover, investigations correlating stability with thermophysical properties such as specific heat capacity, viscosity, and thermal conductivity remain scarce. This gap represents a significant opportunity to advance the understanding of MoS2–water nanofluids for thermal energy applications.
In the present work, we first compared the stability of MoS2–water nanofluids prepared with two surfactants of opposite charge—anionic SLS and cationic CTAB—at different MoS2:surfactant ratios (1:1, 1:2, and 1:3). Based on the results of dynamic light scattering (DLS), zeta potential, and UV–Vis spectroscopy analyses, SLS was identified as the most effective stabilizing agent. In the second part of the study, SLS was used to formulate MoS2–water nanofluids with varying nanoparticle concentrations (0.05 wt%, 0.1 wt%, and 0.2 wt%), and their thermophysical properties, including specific heat capacity, thermal conductivity, and viscosity, were systematically evaluated.
The novelty of this work lies in its comprehensive evaluation of both the colloidal stability and thermophysical behavior of MoS2-based nanofluids, using water as an environmentally friendly base fluid. By establishing a clear relationship between surfactant type, nanoparticle dispersion, and heat transfer performance, this study contributes new insights toward the design of efficient, stable, and sustainable MoS2–water nanofluids for industrial cooling and energy management applications.
2. Materials and Methods
2.1. Reagents and Equipment
Nanopowder of MoS2 with particle diameters around 90 nm (purity = 99%, MW = 160.07 g/mol, density = 5.06 g/mL at 252 °C) was purchased from Sigma-Aldrich (St. Louis, MO, USA). Sodium lauryl sulfate (CH3(CH2)11OSO3Na) and trimethylcetylammonium bromide (CH3(CH2)15N(CH3)3Br, MW = 364.46 g/mol) were obtained from Carlo Erba Reagents (Val de Reuil, France)
The MoS2 nanoparticles were characterized using multiple techniques to ensure a comprehensive understanding of their structural, morphological, and thermal properties. X-ray diffraction (XRD) was performed on a D8 ADVANCE ECO instrument (Bruker AXS GmbH, Karlsruhe, Germany) using Cu Kα radiation (λ = 1.5406 Å) to determine the crystalline structure. Diffraction patterns were recorded over a 2θ range of 5° to 90°. Scanning electron microscopy (SEM) using a QUATTRO S-FEG instrument (Thermo Fisher Scientific, Eindhoven, The Netherlands) was employed to investigate the morphology and size of the nanoparticles. The samples were placed on carbon planchet stubs for surface imaging and for elemental analysis using Energy Dispersive Spectroscopy (EDS).
Nanoparticle stability was evaluated using a Cilas 1190 particle size and shape analyzer (Cilas, Orléans, France), along with zeta potential measurements on a Stabino® analyzer (Particle Metrix GmbH, Inning am Ammersee, Germany), to monitor aggregation tendencies. Optical properties were measured using UV-visible spectroscopy at 400 nm, a wavelength chosen because the nanofluids exhibit strong absorption at this wavelength, ensuring accurate detection and analysis. Rheological behavior was studied with an Anton Paar RheolabQC (Anton Paar GmbH, Graz, Austria)and thermal conductivity was determined using a THB Linseis instrument (Linseis Messgeräte GmbH, Selb, Germany). Differential Scanning Calorimetry (DSC) was conducted on a DSC-60 Plus instrument (Shimadzu Corporation, Kyoto, Japan) to analyze thermal transitions.
These techniques were selected over alternatives due to their high accuracy, reproducibility, and suitability for analyzing nanofluids.
2.2. Nanofluid Preparation
To evaluate the nanofluids’ stability, MoS2-based water nanofluids were synthesized using the two-step method, which is widely recognized for its effectiveness in dispersing pre-synthesized nanoparticles and achieving stable suspensions.
Initially, nanofluids were prepared with three different MoS2:surfactant ratios (1:1, 1:2, and 1:3) at a nanoparticle concentration of 0.005 wt%. Deionized water was mixed with nanoparticles and sonicated for 10 min using a 200 W Sonopuls HD 2200 device (Bandelin electronic GmbH & Co. KG, Berlin, Germany) at 50% nominal power, with an amplitude of 50% and a pulsed cycle to prevent overheating. During sonication, the sample vial was placed on a water-filled container to ensure cooling and minimize temperature rise caused by the ultrasonic treatment, and the surfactant was then added, followed by 1 h of sonication and 80 min of magnetic stirring at 600 rpm to ensure maximum dispersion and stability. Sonication was chosen over simple stirring because it effectively breaks nanoparticle agglomerates and improves homogeneity, which is critical for consistent thermophysical measurements.
In the second stage, nanofluids with higher nanoparticle concentrations (0.05 wt%, 0.1 wt%, and 0.2 wt%) were prepared using SLS and a 1:3 (MoS2:surfactant) ratio, identified as optimal from initial experiments (Table 1). The preparation followed the same sonication and stirring procedure as above. This systematic optimization ensures that the nanofluids remain stable across a range of concentrations, which is essential for accurate thermophysical analysis, as illustrated in Figure 1.

Table 1.
Nanoparticle masses required for each concentration were calculated for a total suspension volume of 20 mL.

Figure 1.
Heat transfer nanofluids preparation.
The specific masses and volumes used in each formulation were as follows:
Part 1: For initial stability test at 0.005% concentration
Concentration (wt%) = 0.005%
Volume = 40 mL = 0.04 L
Assuming the density of water ≈ 1 g/mL, so:
Mass of base fluid = 40 g
Part 2: For thermophysical property tests at higher concentrations
Concentration (wt%) = 0.05%, 0.1% and 0.2%
Volume = 20 mL = 0.020 L
Assuming the density of water ≈ 1 g/mL, so:
Mass of base fluid = 20 g
3. Results and Discussion
3.1. Characterization of MoS2 Nanoparticles
The morphology of the commercial MoS2 nanopowder (90 nm) was analyzed using Scanning Electron Microscopy (SEM), as shown in Figure 2. The high-magnification image (50,000×) reveals the characteristic layered and sheet-like structure of MoS2, attributed to its two-dimensional (2D) lamellar arrangement. The nanosheets appear stacked and closely packed, indicating van der Waals interactions between layers. At a lower magnification (6500×), the MoS2 particles exhibit a fluffy and wrinkled morphology, forming micron-sized agglomerates composed of nanoscale primary particles. This degree of agglomeration is expected due to the high surface energy and electrostatic interactions between sheets, which are common in commercial MoS2 powders. The observed high surface area and layered morphology make MoS2 a promising candidate for heat transfer nanofluid applications, as it facilitates efficient thermal transport when properly dispersed.
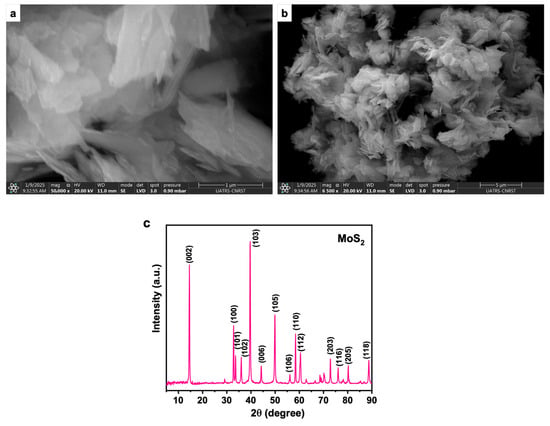
Figure 2.
(a,b) the SEM analysis of commercialized MoS2 nanoparticles, (c) XRD of commercialized MoS2 nanoparticles.
The XRD pattern of the MoS2 nanoparticles, intended for use in heat transfer nanofluid preparation, reveals a series of sharp and well-defined diffraction peaks, indicating high crystallinity. The most intense peak appears at approximately 14.4° (2θ), corresponding to the (002) plane, which is characteristic of the layered structure of 2H-MoS2 and reflects an interlayer spacing of about 0.62 nm. This dominant (002) reflection also suggests a preferred orientation along the c-axis, typical of nanosheet morphology. Additional peaks at higher angles, such as 32.6° (100), 39.5° (103), 44.4° (006), 49.8° (105), and 58.3° (110), confirm the hexagonal crystalline phase of MoS2. The absence of secondary phases or impurity peaks further confirms the high phase purity of the commercial sample. These structural features are crucial for ensuring consistent and reliable performance in nanofluid applications, where the stability and thermal properties of MoS2 are strongly influenced by its crystallinity and purity.
3.2. Stability Analysis
The visual assessment of nanofluids is a fundamental technique for evaluating their stability over time, providing a qualitative and direct observation of sedimentation, aggregation, and dispersion uniformity. The stability of nanofluids is a key factor determining their efficiency in heat transfer applications, as sedimentation and phase separation significantly reduce thermal conductivity and flow performance. The principle of visualization relies on monitoring changes in optical appearance, including color uniformity, particle dispersion, and sediment formation, before and after a set observation period.
The images presented in Figure 3a,c display the freshly prepared MoS2-based water nanofluids, while images Figure 3b,d reveal their stability after more than 30 days of gravity-driven sedimentation. In both CTAB- and SLS-stabilized systems, it is evident that increasing the surfactant concentration enhances the visual stability of the nanofluids, as indicated by the progressively darker and more uniform appearance of the suspensions. This darker coloration corresponds to a higher dispersion of MoS2nanoparticles, suggesting improved stabilization with increased surfactant content. For the CTAB-stabilized samples (MoS2:CTAB at 1:1, 1:2, and 1:3 ratios), all initially appeared well-dispersed, indicating successful surfactant-assisted exfoliation and dispersion. However, after 30 days, these samples showed varying degrees of phase separation, with the 1:1 ratio exhibiting the most pronounced sedimentation. This implies that lower CTAB concentrations may provide insufficient electrostatic or steric stabilization to maintain long-term dispersion, while higher ratios delay but do not fully prevent sedimentation.
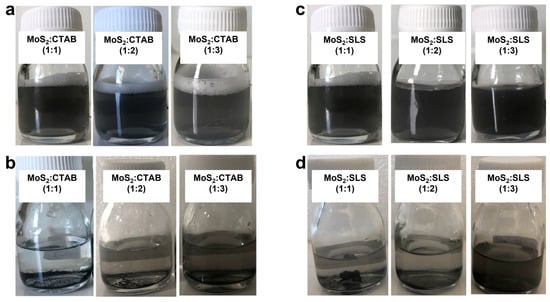
Figure 3.
State of nanofluids (a,c) after formulation, (b,d) after gravity sedimentation observation for more than 30 days.
In contrast, the SLS-stabilized nanofluids (MoS2:SLS at 1:1, 1:2, and 1:3) exhibited markedly better long-term stability. From the beginning, the sample with the 1:3 ratio appeared the darkest and most homogeneously dispersed, indicating superior initial dispersion quality. After 30 days, this formulation retained a high degree of uniformity with minimal visible sedimentation, unlike the 1:1 and 1:2 samples, which showed clear signs of nanoparticle settling. Overall, the findings clearly suggest that the MoS2:SLS (1:3) formulation offers the highest long-term colloidal stability among all tested ratios, making it the most promising candidate for applications where sustained dispersion and reliable nanofluid performance are required.
Compared to visually assessed stabilities in other 2D nanofluid systems, the durability of our MoS2:SLS (1:3) system is notable. For instance, graphene-based nanofluids stabilized with SDS have demonstrated uniform dispersion over 45 days, though some sedimentation appears thereafter [15], Another study on industrial graphene–water nanofluids reports sustained visual stability over tens of days, correlating stability with surfactant concentration and mixing procedure [16], Meanwhile, cold plasma-modified h-BN nanofluids show improved dispersion stability when surface modifications are applied, though full suppression of sedimentation over a month remains challenging [17], Also, h-BN–water systems used in heat exchangers report partial settling after extended times, especially under thermal cycles [18].
These underline that achieving over 30 days of visual stability in a single-component MoS2 nanofluid stabilized by simple anionic surfactants is a competitive result.
The dispersion behavior of the prepared nanofluids was analyzed using UV–VIS spectroscopy by measuring absorbance at a wavelength of 400 nm. The results showed that the nanofluids exhibited strong absorption at this wavelength, allowing for effective monitoring of the concentration of dispersed MoS2 nanoparticles, as illustrated in Figure 4. The stability of MoS2-based water nanofluids dispersed with CTAB and SLS surfactants at different concentration ratios was evaluated over 30 days using absorbance measurements. Initially, the nanofluids exhibited good dispersion, with absorbance values for CTAB-based samples ranging from 0.571 to 0.591 and for SLS-based samples ranging from 0.597 to 0.742. Over time, a decline in absorbance was observed across all formulations, indicating nanoparticle sedimentation or aggregation. In the CTAB-stabilized nanofluids, the absorbance for the 1:1 ratio dropped significantly from 0.591 at day 0 to 0.108 at day 30, while the 1:2 and 1:3 ratios followed a similar trend, decreasing from 0.571 to 0.131 and from 0.578 to 0.18, respectively. This suggests that a higher CTAB concentration slightly improves stability but does not prevent significant sedimentation over time. Conversely, the SLS-stabilized nanofluids exhibited better stability, with the 1:3 ratio showing the highest initial absorbance (0.742) and maintaining a relatively high value (0.35) at day 30. The 1:2 and 1:1 SLS-based samples also demonstrated better retention of absorbance than CTAB-based formulations, with values decreasing from 0.713 to 0.141 and from 0.597 to 0.143, respectively. These results indicate that SLS is more effective than CTAB in stabilizing MoS2 nanoparticles in water-based nanofluids, with the 1:3 SLS ratio providing the best long-term stability. However, despite the improved stability, all formulations exhibited a gradual decrease in absorbance over time, suggesting some level of sedimentation is inevitable.
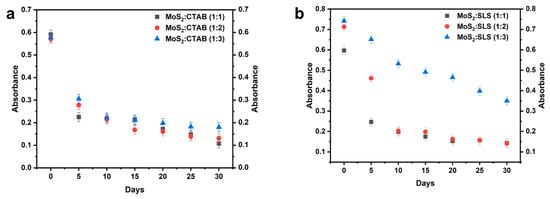
Figure 4.
Absorbance of nanofluids with different ratios of MoS2:surfactant for 30 days (a) with CTAB, (b) with SLS.
Zeta potential refers to the electric potential difference between the dispersion medium and the stationary layer of fluid attached to the dispersed particles. Nanoparticles tend to repel each other due to their surface charges, which creates a barrier against aggregation or flocculation. In effect, a fluid with a zeta potential value of ±5 mV exhibits flocculation during coagulation, values between ±10 mV and ±30 mV indicate the onset of instability, nanofluids exhibit reasonable stability between ±30 and ±40 mV, and good stability between ±40 and ±60 mV [19]. When the value surpasses ± 60mV, high stability is noted [20]. The zeta potential measurements in Figure 5 indicate that MoS2 nanofluids stabilized with SLS (anionic surfactant) initially exhibit high negative values (below −70 mV), suggesting strong electrostatic repulsion and good colloidal stability. However, over time, the absolute zeta potential values decrease significantly, particularly for the (1:1) and (1:2) ratios, reaching values close to −12.7 mV by day 30, which indicates a loss of electrostatic repulsion and increased aggregation. Among the SLS-based water nanofluids, the (1:3) ratio maintains the highest absolute zeta potential (−38.2 mV at day 30), suggesting relatively better stability compared to the other SLS formulations. Conversely, CTAB (cationic surfactant)-stabilized nanofluids initially display high positive zeta potential values (>60 mV), indicating strong electrostatic stabilization. However, these values also decrease over time, particularly for the (1:1) ratio, which drops to 7 mV by day 30, signifying poor stability. The (1:3) ratio of CTAB stabilizer retains a higher zeta potential (+29 mV at day 30) compared to the (1:1) and (1:2) ratios, making it the most stable formulation among the CTAB-stabilized nanofluids. Overall, while both surfactants show a decline in stability over time, SLS at a higher concentration (1:3) exhibits better long-term stability compared to the other ratios.
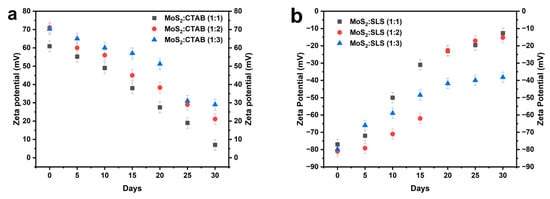
Figure 5.
Zeta potential of nanofluids with different ratios of MoS2:surfactant for 30 days (a) with CTAB and (b) with SLS.
The stability and dispersion efficiency of the MoS2-based water nanofluids were assessed using Dynamic Light Scattering (DLS) to measure the particle size distribution immediately after preparation. The results, presented in Figure 5, compare the effect of SLS and CTAB surfactants on nanoparticle dispersion. The analysis reveals that bare MoS2 nanoparticles exhibit a broad size distribution extending beyond 1000 nm, indicating significant agglomeration due to strong van der Waals interactions. However, upon surfactant stabilization, the particle sizes shift to smaller values, confirming improved dispersion and reduced aggregation. For SLS-stabilized nanofluids (Figure 6a,b), the MoS2:SLS (1:1) sample exhibited a particle size range of approximately 350–500 nm, suggesting moderate stabilization. Increasing the surfactant ratio to 1:2 further reduced the particle size distribution to 300–450 nm, indicating stronger electrostatic repulsion that prevents nanoparticle clustering. The MoS2:SLS (1:3) formulation demonstrated the smallest average particle size (~259–373 nm) with the narrowest distribution, confirming optimal dispersion and minimal aggregation. This result suggests that a higher SLS concentration enhances steric hindrance and electrostatic stabilization, leading to improved long-term colloidal stability.
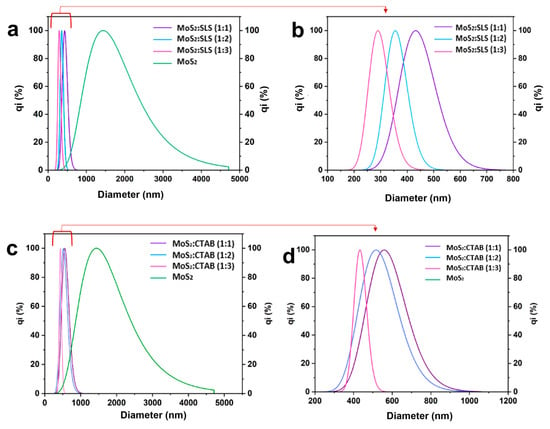
Figure 6.
DLS of prepared nanofluids (a,b): stabilized with SLS measured directly after preparation, prepared (c,d): stabilized with CTAB measured directly after preparation.
In contrast, CTAB-stabilized nanofluids (Figure 6c,d) showed relatively larger particle sizes, implying weaker stabilization compared to SLS. The MoS2:CTAB (1:1) sample exhibited a particle size range of 450–700 nm, as the surfactant ratio increased to 1:2 and 1:3 reduced the size distribution to 400–650 nm and 400–600 nm, respectively. Despite a progressive reduction in aggregation, the CTAB-stabilized samples still displayed larger average particle sizes than their SLS-stabilized counterparts, suggesting less effective electrostatic and steric stabilization mechanisms.
As illustrated in Table 2 the mode diameter (Dmode) represents the most frequently occurring particle size in the distribution, while Dmov (mean diameter) refers to the mean hydrodynamic diameter of the particles. The D10, D50, and D90 values indicate the particle size at which 10%, 50%, and 90% of the cumulative particle population falls below that size, respectively, providing insight into the size distribution. The coefficient of variation (%) quantifies the relative dispersion, with lower values indicating a more uniform size distribution. The results show that water alone, without any surfactant, leads to severe agglomeration, with Dmode = 1413.6 nm and the highest coefficient of variation (42%), confirming poor dispersion. The addition of surfactants significantly reduces particle size, with SLS proving more effective than CTAB. Among the SLS-stabilized nanofluids, increasing the surfactant concentration improves dispersion, as seen in the MoS2:SLS (1:3) formulation, which achieves the smallest particle size (Dmode = 289.8 nm, D50 = 293.7 nm), along with a relatively low coefficient of variation (13.3%), indicating better uniformity. In contrast, CTAB-stabilized nanofluids result in larger particle sizes and higher variation, particularly at 1:1 and 1:2 ratios, suggesting weaker stabilization compared to SLS. The MoS2:CTAB (1:1) formulation exhibits a Dmode of 558.0 nm and a coefficient of variation of 18.1%, demonstrating a less efficient dispersion effect. Overall, the results suggest that SLS is a more effective surfactant than CTAB for dispersing MoS2 in water, and the optimal formulation in this study is MoS2:SLS (1:3), which achieves the smallest and most uniformly distributed particles, enhancing the stability and performance of the nanofluid.

Table 2.
Nanoparticles size distribution in prepared nanofluids.
SLS and CTAB (Figure 7), representing anionic and cationic surfactants, respectively, exhibit markedly different stabilization behaviors when used to disperse MoS2 nanoparticles in water-based nanofluids. SLS imparts a strong negative surface charge through its sulfate head group, enhancing electrostatic repulsion and steric hindrance, which collectively minimize aggregation and maintain long-term colloidal stability. In contrast, CTAB stabilizes MoS2 via electrostatic attraction between its positively charged ammonium head and the negatively charged MoS2 surface. However, this interaction is prone to charge neutralization over time, reducing repulsive forces and leading to sedimentation. Visual observations, UV–VIS absorbance, zeta potential, and DLS analyses consistently demonstrate that SLS is more effective than CTAB in stabilizing MoS2 nanofluids. Notably, the MoS2:SLS (1:3) formulation exhibited the darkest color, highest absorbance retention (0.742 to 0.35), smallest particle size (~289.8 nm), and most stable zeta potential (−38.2 mV after 30 days), confirming its superior dispersion and long-term stability. Conversely, CTAB-based formulations showed more pronounced sedimentation, lower zeta potentials over time, and larger particle sizes. These findings underscore the critical influence of surfactant type and concentration on nanofluid stability and suggest that high-concentration SLS formulations are better suited for heat transfer applications requiring sustained nanoparticle dispersion and minimal phase separation.
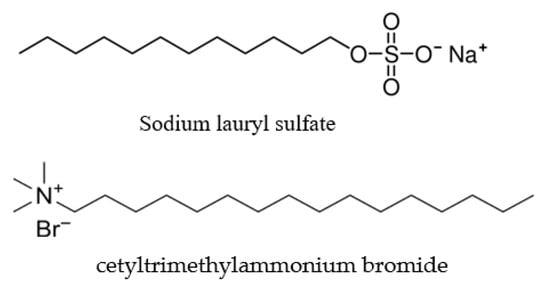
Figure 7.
SLS and CTAB structures.
3.3. Thermophysical Properties
In this section, nanofluids were synthesized with three distinct nanoparticle concentrations (0.05%, 0.1%, 0.2%) to systematically evaluate how varying nanoparticle loadings influence their thermophysical characteristics. The selection of different concentrations was aimed at identifying optimal nanoparticle levels that enhance performance without compromising stability or causing excessive viscosity increases [21,22,23]. To ensure the dispersion stability of the nanoparticles within the base fluid, sodium lauryl sulfate (SLS) was employed as a surfactant. SLS was chosen based on its demonstrated ability to effectively reduce nanoparticle agglomeration and maintain a stable colloidal suspension, which is critical for preserving the desired thermophysical enhancements over time.
3.3.1. DSC and Specific Heat Capacity
In the study of nanofluid heat transfer, Differential Scanning Calorimetry (DSC) is a crucial technique for determining the thermal stability of the nanofluid, the specific heat capacity (Cp), while thermal conductivity measurements provide insights into the fluid’s ability to conduct heat. The specific heat capacity (Cp) influences the nanofluid’s ability to store thermal energy, playing a key role in applications where heat absorption and release are critical, such as cooling systems and energy storage. Conversely, thermal conductivity dictates how efficiently heat is transferred through the nanofluid, directly impacting its performance in heat exchangers and industrial cooling processes. A comprehensive understanding of both properties enables researchers to optimize nanofluid formulations for enhanced thermal performance, ensuring stability and efficiency in practical applications.
As observed in Figure 8a, pure water exhibits a sharp endothermic peak around 70 °C with a maximum heat flow of approximately 0.34 mW, corresponding molecular relaxation and localized evaporation processes. The Water–MoS2 (0.05 wt%) nanofluid shows a broader and reduced peak (~0.23 mW), indicating a lower heat absorption rate at this concentration. Interestingly, the Water–MoS2 (0.1 wt%) formulation demonstrates the highest and most distinct peak, reaching ~0.75 mW near 70 °C. This enhancement suggests improved energy absorption and efficient heat transfer, likely due to optimal nanoparticle dispersion and enhanced phonon interactions.
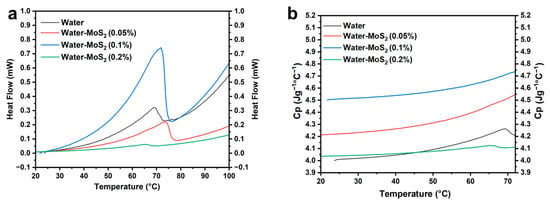
Figure 8.
(a) Differential scanning calorimetry (DSC) curves of prepared nanofluids, and (b) specific heat capacity of prepared nanofluids.
In contrast, at 0.2 wt%, the Water–MoS2 nanofluid displays a nearly flat heat flow curve (~0.13 mW), indicative of reduced thermal responsiveness. This decline in thermal performance can be attributed to nanoparticle agglomeration at higher loading, which hinders effective energy transfer by disrupting thermal conduction pathways and reducing surface interaction with the base fluid.
Following the analysis of heat flow curves Figure 8a, the specific heat capacity (Cp) of the different formulations was calculated using data from Differential Scanning Calorimetry (DSC), as presented in Figure 8b; Cp was calculated up to 70 degrees Celsius, where the nanofluid demonstrated thermal stability.
The calculation of Cp is based on the fundamental thermodynamic relation Equation (1):
where is the measured heat flow (J min−1), m is the sample mass (g), is the specific heat capacity (J g−1·°C−1), and is the heating rate (in °C min−1).
The specific heat capacity (Cp) curves (Figure 8b) clearly illustrate the influence of MoS2 nanoparticles on the thermal energy storage capacity of water-based nanofluids. Pure water shows a steady increase in Cp with temperature, reaching approximately 4.3 J·g−1·°C−1 at 70 °C. Upon the addition of MoS2 nanoparticles, noticeable changes in Cp are observed depending on concentration. At 0.05 wt% MoS2, the Cp moderately increases, reaching around 4.5 J·g−1·°C−1 at 70 °C, indicating a slight enhancement in thermal energy storage. The most pronounced improvement occurs at 0.1 wt%, where Cp reaches about 4.75 J·g−1·°C−1, demonstrating superior heat storage capacity compared to both pure water and the other nanofluid formulations. This significant increase can be attributed not only to the optimal dispersion of MoS2 nanosheets but also to their intrinsic layered structure, which plays a key role in phonon transport. Each MoS2 nanosheet consists of S–Mo–S layers covalently bonded and stacked together via weak van der Waals interactions, forming numerous two-dimensional interfaces capable of storing and transferring vibrational energy. When dispersed in water, these layers generate interfacial nanolayers that couple phonon vibrations between the solid and liquid phases, effectively acting as thermal bridges that enhance energy transfer and retention. The high phonon density of states and low anharmonic scattering in the MoS2 lattice further contribute to efficient phonon propagation and reduced thermal resistance at the solid–liquid interface.
At 0.1 wt%, the nanoparticle concentration is sufficient to establish a percolated network of such interfacial layers, maximizing phonon-assisted heat transport without inducing aggregation. In contrast, at 0.2 wt%, excessive particle–particle interactions lead to agglomeration, disrupting phonon pathways and reducing overall heat capacity. This behavior is consistent with the subdued heat flow profile observed in Figure 8a. Overall, the data confirm that 0.1 wt% MoS2 is the optimal concentration for maximizing specific heat capacity and thermal energy storage while preserving dispersion stability. These findings highlight the crucial contribution of the layered MoS2 structure and interfacial phonon coupling to the superior thermophysical behavior of the nanofluid.
3.3.2. Thermal Conductivity/Thermal Diffusivity
The analysis of thermal conductivity and thermal diffusivity across a temperature range of 10 °C to 70 °C was carried out according to the setup in Figure 9. The sample is placed in the center of the thermostat until it stabilizes at the target temperature. Then, the sensor is placed in the center of the sample, and the measurement is initiated:
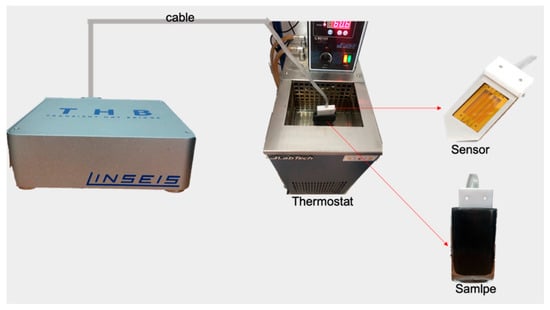
Figure 9.
Setup of thermal conductivity measurement.
The thermal conductivity of water and MoS2-water nanofluids was analyzed across a temperature range of 283 K to 343 K (Figure 10a), The thermal conductivity enhancement (TCE) as illustrated in Figure 10b is also calculated according to Equation (2):
where is thermal conductivity of the nanofluid, and is thermal conductivity of the base fluid.
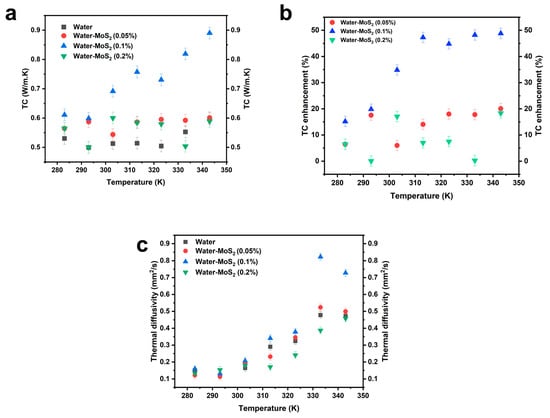
Figure 10.
(a) Variation in the thermal conductivity of the prepared nanofluids with temperature, (b) Thermal conductivity enhancement of prepared nanofluids, (c) Variation in thermal diffusivity of the nanofluids with temperature.
Demonstrating a significant enhancement with the addition of MoS2 nanoparticles. At 283 K, the thermal conductivity of pure water is 0.5302 W/m·K, whereas the MoS2-water nanofluids at concentrations of 0.05%, 0.1%, and 0.2% show increased values of 0.56445 W/m·K, 0.61061 W/m·K, and 0.56445 W/m·K, respectively. This indicates an improvement of 6.45% for 0.05% concentration and 15.16% for 0.1% concentration, while the 0.2% nanofluid does not show a further increase beyond 0.1%.
As the temperature rises, the thermal conductivity of pure water fluctuates slightly, ranging from 0.49957 W/m·K at 293 K to 0.51028 W/m·K at 353 K, with no clear increasing trend. In contrast, the MoS2-water nanofluids show a progressive enhancement in thermal conductivity with temperature. At 293 K, the 0.05% concentration reaches 0.587217 W/m·K, reflecting an increase of 17.5% compared to pure water at the same temperature. The 0.1% concentration reaches 0.59871 W/m·K, an increase of 19.84%, while the 0.2% concentration records 0.499754 W/m·K, which is very close to the thermal conductivity of pure water.
At 303 K, the thermal conductivity of pure water is 0.5128 W/m·K, while for the MoS2-water nanofluids, it is 0.543625 W/m·K (0.05%), 0.691425 W/m·K (0.1%), and 0.6002 W/m·K (0.2%). Notably, the 0.1% concentration shows a sharp an enhancement of about 34.86% relative to water, demonstrating the potential of this concentration for enhanced heat transfer performance.
A similar trend continues at 313 K, where pure water’s thermal conductivity is 0.514075 W/m·K, while 0.05% MoS2-water reaches 0.586125 W/m·K (a 14% increase), and 0.1% concentration rises to 0.7571 W/m·K (a 47.3% increase). Interestingly, the 0.2% concentration records a lower value of 0.584075 W/m·K, which is only marginally higher than 0.05%, suggesting possible aggregation effects limiting heat transfer.
At 323 K, pure water’s thermal conductivity remains relatively stable at 0.504348 W/m·K, while the 0.05% nanofluid reaches 0.59514 W/m·K (an 18% increase), the 0.1% nanofluid reaches 0.7303 W/m·K (a 44.8% increase), and the 0.2% nanofluid records 0.57934 W/m·K, slightly lower than the 0.05% concentration.
As the temperature reaches 333 K, the thermal conductivity of water is 0.5526W/m·K, while the 0.1% nanofluid reaches 0.818957 W/m·K, marking a substantial 48.2% increase, making it the most efficient concentration at this temperature. However, the 0.2% nanofluid drops to 0.5038 W/m·K, nearly identical to water, further supporting the hypothesis of nanoparticles agglomeration reducing its effectiveness.
At 343 K, the trend persists, with pure water having a thermal conductivity of 0.5978 W/m·K, while the 0.05% and 0.1% nanofluids reach 0.6841 W/m·K and 0.89W/m·K, respectively, corresponding to 14.43% and 48.8% enhancements. Meanwhile, the 0.2% concentration records 0.58901 W/m·K, slightly below the 0.05% concentration, reinforcing the observation that an excessive nanoparticle concentration does not necessarily translate into higher conductivity.
Comparable findings have been reported in other studies on nanofluid systems. Yasmin et al. reported that optimized metal oxide nanofluids typically show 10–30% thermal conductivity improvement depending on particle type and dispersion quality [24]. Likewise, CuO nanowire-based nanofluids displayed significantly higher enhancements (up to 60%) due to the anisotropic shape and efficient phonon conduction [25]. Okafor et al. examined systems combining MoS2, graphene nanoplatelets (GnP), TiO2, and Al2O3 in vegetable oils, observing very large conductivity enhancements (even exceeding 90–100% at high wt% loadings) across 25–75 °C [26], while graphene nanoplatelet nanofluids exhibited 25–28% enhancement depending on surface area and temperature [27]. Similarly, h-BN or hybrid h-BN-CNT nanofluids reached ~31–39% enhancement at elevated temperatures [28]. These comparisons indicate that the ~48–49% enhancement observed for the 0.1 wt% MoS2–water nanofluid represents a remarkably high and significant improvement, supporting the conclusion that the layered structure of MoS2 and the strong surfactant-assisted dispersion, minimizing interfacial resistance, enable highly efficient phonon transport across nanoparticle–fluid interfaces.
Figure 10c presents the thermal diffusivity trends of the various nanofluids. Thermal diffusivity (α) quantifies how rapidly a material can transfer thermal energy relative to its capacity to store it, defined by:
where k is thermal conductivity, is density, and Cp is specific heat capacity. A higher thermal diffusivity indicates a faster response of the fluid to temperature changes, which is critical in transient heat transfer applications.
From the figure, it is evident that the 0.1% MoS2 nanofluid exhibits the highest thermal diffusivity across the entire temperature range. This enhanced diffusivity suggests that this formulation not only conducts heat more effectively but also reacts more rapidly to thermal gradients. The 0.05% and 0.2% formulations show moderate improvements over pure water, but consistently lag behind the 0.1% sample. The 0.2% nanofluid, in particular, displays a plateauing behavior at high temperatures, reinforcing the hypothesis of particle agglomeration that restricts heat flow and dynamic thermal response.
The addition of MoS2 nanoparticles significantly enhances both the thermal conductivity and diffusivity of water-based nanofluids, with 0.1 wt% emerging as the optimal concentration for maximum heat transfer efficiency. This remarkable enhancement is supported by the strong correlation between the thermophysical measurements and stability analyses: the DLS and zeta potential results confirm a stable and homogeneous dispersion at 0.1 wt%, while the viscosity data and particle size evolution explain the performance degradation at 0.2 wt%. These correlations provide a consistent physical justification for the observed trends and reinforce that the superior performance at 0.1 wt% results from optimal dispersion and nanolayer-assisted phonon transport, whereas aggregation at higher loading restricts thermal conduction.
3.3.3. Viscosity
According to Newton’s law of internal friction, fluids can be categorized into two types: Newtonian and non-Newtonian. Newtonian fluids exhibit a constant viscosity that remains unaffected by changes in shear rate; hence, their shear stress is linearly proportional to the shear rate, as described by Newton’s law of viscosity. This results in a straightforward, shear stress that varies linearly with shear rate. Conversely, non-Newtonian fluids exhibit a variable viscosity that depends on the shear rate. Additionally, viscosity is influenced by temperature in both types of fluids, but the effects differ. In Newtonian fluids, viscosity generally decreases with increasing temperature due to enhanced molecular mobility and reduced intermolecular forces. In non-Newtonian fluids, temperature variations can lead to complex changes in viscosity, altering the degree of shear-thinning or shear-thickening behavior and affecting the fluid’s microstructural dynamics [29].
The viscosity behavior of MoS2–water nanofluids at a range of concentrations (0.05 wt%, 0.1 wt%, and 0.2 wt%) was analyzed as dependent on temperature and shear rate, providing key insights into their rheological performance for heat transfer applications. As shown in the viscosity vs. temperature plot Figure 11a, pure water exhibited the lowest viscosity across the temperature range, starting around 0.28 mPa·s at 25 °C and gradually decreasing to approximately 0.20 mPa·s at 60 °C. The 0.05 wt% MoS2 nanofluid showed a slightly higher viscosity, starting at ~0.45 mPa·s and decreasing to ~0.35 mPa·s over the same temperature range. The 0.2 wt% sample initially measured at ~0.55 mPa·s, but its viscosity also declined to around 0.40 mPa·s at higher temperatures. Notably, the 0.1 wt% MoS2 nanofluid demonstrated the highest and most stable viscosity profile, starting at approximately 1.15 mPa·s at 25 °C and maintaining values above 1.0 mPa·s even as the temperature approached 60 °C. This indicates that, at 0.1 wt%, the MoS2 nanoparticles are well-dispersed and form stable interactions with the base fluid, contributing to consistent viscosity.
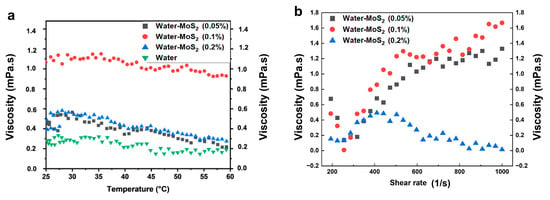
Figure 11.
(a) Variation in the viscosity of the prepared nanofluids with temperature, (b) Variation in the viscosity of the prepared nanofluids with shear rate.
The shear rate-dependent viscosity data further highlight the non-Newtonian behavior of the nanofluids (Figure 11b). At a low shear rate of 200 s−1, the viscosity of the 0.1 wt% sample begins at ~0.2 mPa·s but rapidly increases with shear, reaching a maximum of ~1.68 mPa·s at 1000 s−1, confirming a pronounced shear-thickening (dilatant) behavior. The 0.05 wt% nanofluid exhibits a similar trend, with viscosity rising from ~0.25 mPa·s to ~1.38 mPa·s over the same shear range. In contrast, the 0.2 wt% nanofluid starts at ~0.22 mPa·s but displays shear-thinning (pseudo-plastic) behavior, with viscosity dropping steadily to ~0.06 mPa·s at 1000 s−1. This opposite rheological response between concentrations suggests a shift in the dominant particle interaction mechanisms. At low concentrations (0.1 wt%), weakly interacting nanoparticles form transient hydroclusters under shear, leading to increased resistance to flow and, consequently, dilatant behavior. However, at higher concentrations (0.2 wt%), stronger interparticle attractions promote the formation of larger, loosely bound aggregates that tend to align and disintegrate under shear, reducing viscosity and resulting in shear-thinning behavior. Such contrasting microstructural dynamics indicate that the conversion from shear-thickened to shear-thinned states is governed by the competition between hydrodynamic clustering and shear-induced aggregate breakdown.
In summary, the 0.1 wt% MoS2 nanofluid stands out as the optimal formulation, offering the highest viscosity enhancement, temperature stability, and shear-thickening characteristics, which are favorable for energy storage and high-efficiency cooling applications. Conversely, while the 0.2 wt% sample initially shows increased viscosity, its rapid shear-induced thinning and temperature sensitivity suggest potential dispersion or aggregation issues at higher loadings.
4. Conclusions
This study comprehensively evaluated the influence of cationic (CTAB) and anionic (SLS) surfactants on the colloidal stability of MoS2–water nanofluids. Comparative analyses of zeta potential, UV–Vis absorbance, and DLS results demonstrated that the SLS-based formulation at a MoS2:SLS ratio of 1:3 provided the most effective electrostatic and steric stabilization, maintaining a ζ-potential of −38.2 mV after 30 days and a mean particle size of ~290 nm. Based on this superior performance, SLS was selected to stabilize higher-concentration MoS2–water nanofluids for thermophysical characterization.
Among the studied concentrations, the 0.1 wt% MoS2:SLS (1:3) nanofluid achieved the most significant thermal performance, with a maximum thermal conductivity enhancement of approximately 49% at 70 °C and an increased specific heat capacity of about 4.75 J·g−1·°C−1, outperforming both lower and higher concentrations. Although a mild shear-thickening response was observed at this concentration, the formulation maintained good temperature stability and flow consistency, making it suitable for moderate-flow or energy storage systems. Future optimization could target shear-thinning behavior to meet the requirements of high-flow industrial applications.
The preparation process, based on a two-step method combining controlled sonication and magnetic stirring, demonstrated excellent reproducibility, scalability, and cost-effectiveness, relying solely on water as an environmentally benign base fluid and SLS as a low-cost, biodegradable surfactant. From a broader perspective, this study highlights the potential of MoS2–SLS nanofluids as sustainable candidates for advanced heat transfer and energy management systems.
Future investigations should (i) assess the long-term operational thermal and flow performance of these nanofluids under dynamic and cyclic conditions; (ii) explore hybrid or polymeric stabilizers to fine-tune rheological behavior; (iii) perform techno-economic and life-cycle assessments to evaluate their industrial scalability and environmental footprint; and (iv) incorporate quantitative sedimentation or accelerated sedimentation testing, such as weight-based and centrifugal settling experiments, to enhance comparability, validate long-term colloidal stability, and ensure reproducibility under industrial operating conditions.
Author Contributions
Conceptualization, S.B. and C.E.M.; methodology, S.B., C.R. and O.E.; validation, C.E.M., T.C., H.E.F. and C.R.; formal analysis, S.B. and H.E.F.; investigation, S.B., H.E.F., C.R. and O.E.; resources, T.C.; writing—original draft preparation, S.B.; writing—review and editing, S.B., C.E.M., T.C. and H.E.F.; visualization, S.B. and O.E.; supervision, C.E.M. and T.C. All authors have read and agreed to the published version of the manuscript.
Funding
The authors acknowledge that 10% of the article processing charge for open access publication was funded by the Universidad de Huelva/CBUA.
Data Availability Statement
The raw data supporting the conclusions of this article will be made available by the authors on request.
Acknowledgments
The authors gratefully acknowledge the use of all equipment available at the Laboratory of Chemical Engineering for Resources Valorization provided by IRESEN within the framework of the Nanolubricant Project. We also thank the National Center for Scientific and Technical Research (CNRST) of Morocco for providing access to technical analyses, including SEM, EDS, and XRD. Our appreciation extends to colleagues and collaborators for their valuable discussions and insights, which greatly contributed to this study.
Conflicts of Interest
The authors declare no conflicts of interest.
References
- Said, Z.; Syam Sundar, L.; Tiwari, A.K.; Ali, H.M.; Sheikholeslami, M.; Bellos, E.; Babar, H. Recent advances on the fundamental physical phenomena behind stability, dynamic motion, thermo-physical properties, heat transport, applications, and challenges of nanofluids. Phys. Rep. 2022, 946, 1–94. [Google Scholar] [CrossRef]
- Nagarajan, T.; Khalid, M.; Sridewi, N.; Jagadish, P.; Shahabuddin, S.; Muthoosamy, K.; Walvekar, R. Tribological, oxidation and thermal conductivity studies of microwave synthesised molybdenum disulfide (MoS2) nanoparticles as nano-additives in diesel based engine oil. Sci. Rep. 2022, 12, 16026. [Google Scholar] [CrossRef]
- Jiang, W.; Liang, T.; Xu, J.; Ouyang, W. Twist-dependent anisotropic thermal conductivity in homogeneous MoS2 stacks. Int. J. Heat Mass Transf. 2023, 217, 124662. [Google Scholar] [CrossRef]
- Chaves, A.; Azadani, J.G.; Alsalman, H.; da Costa, D.R.; Frisenda, R.; Chaves, A.J.; Song, S.H.; Kim, Y.D.; He, D.; Zhou, J.; et al. Bandgap engineering of two-dimensional semiconductor materials. npj 2D Mater. Appl. 2020, 4, 29. [Google Scholar] [CrossRef]
- Luo, Y.; Zhao, R.; Pendry, J.B. Van der Waals interactions at the nanoscale: The effects of nonlocality. Proc. Natl. Acad. Sci. USA 2014, 111, 18422–18427. [Google Scholar] [CrossRef]
- Chakraborty, S.; Panigrahi, P.K. Stability of nanofluid: A review. Appl. Therm. Eng. 2020, 174, 115259. [Google Scholar] [CrossRef]
- Rehman, A.; Yaqub, S.; Al, M.; Nazir, H.; Shahzad, N.; Shakir, S.; Liaquat, R.; Said, Z. Effect of surfactants on the stability and thermophysical properties of Al2O3+TiO2 hybrid nanofluids. J. Mol. Liq. 2023, 391, 123350. [Google Scholar] [CrossRef]
- Bayou, S.; El Moujahid, C.; El Farissi, H.; Roman, C.; Cacciola, F.; Chafik, T. Stability and thermophysical properties of PAO-Based nanofluids with MWCNTs, nano-MoS2 and their hybrid formulations for thermal applications. Chem. Eng. Sci. 2026, 320, 122585. [Google Scholar] [CrossRef]
- Li, Y.; Kalbasi, R.; Nguyen, Q.; Afrand, M. Effects of sonication duration and nanoparticles concentration on thermal conductivity of silica-ethylene glycol nanofluid under different temperatures: An experimental study. Powder Technol. 2020, 367, 464–473. [Google Scholar] [CrossRef]
- Asadi, A.; Asadi, M.; Siahmargoi, M.; Asadi, T.; Gholami Andarati, M. The effect of surfactant and sonication time on the stability and thermal conductivity of water-based nanofluid containing Mg(OH)2 nanoparticles: An experimental investigation. Int. J. Heat Mass Transf. 2017, 108, 191–198. [Google Scholar] [CrossRef]
- Almanassra, I.W.; Manasrah, A.D.; Al-Mubaiyedh, U.A.; Al-Ansari, T.; Malaibari, Z.O.; Atieh, M.A. An experimental study on stability and thermal conductivity of water/CNTs nanofluids using different surfactants: A comparison study. J. Mol. Liq. 2020, 304, 111025. [Google Scholar] [CrossRef]
- Almitani, K.H.; Abu-Hamdeh, N.H.; Etedali, S.; Abdollahi, A.; Goldanlou, A.S.; Golmohammadzadeh, A. Effects of surfactant on thermal conductivity of aqueous silica nanofluids. J. Mol. Liq. 2021, 327, 114883. [Google Scholar] [CrossRef]
- Lei, J.; Luo, Z.; Qing, S.; Huang, X.; Li, F. Effect of surfactants on the stability, rheological properties, and thermal conductivity of Fe3O4 nanofluids. Powder Technol. 2022, 399, 117197. [Google Scholar] [CrossRef]
- Mehta, B.; Subhedar, D.; Panchal, H.; Sadasivuni, K.K. Stability and thermophysical properties enhancement of Al2O3-water nanofluid using cationic CTAB surfactant. Int. J. Thermofluids 2023, 20, 100410. [Google Scholar] [CrossRef]
- Ali, N. Graphene-Based Nanofluids: Production Parameter Effects on Thermophysical Properties and Dispersion Stability. Nanomaterials 2022, 12, 357. [Google Scholar] [CrossRef]
- Gal, S.; Cabaleiro, D.; Hassen, W.; Nasri, A.; Lafue, Y.; Pham-Huu, C.; Ba, H.; Estellé, P. Thermophysical Profile of Industrial Graphene Water-Based Nanofluids. Nanomaterials 2024, 14, 1401. [Google Scholar] [CrossRef] [PubMed]
- Duan, Z.; Wang, Z.; Jia, Y.; Wang, S.; Bian, P.; Tan, J.; Song, J.; Liu, X. Dispersion Stability and Tribological Properties of Cold Plasma-Modified h-BN Nanofluid. Nanomaterials 2025, 15, 874. [Google Scholar] [CrossRef]
- Ziyadanogullari, N.B.; Percin, S. An Experimental Investigation of the Effects of Using Hexagonal BN–Water Nanofluids on the Thermal Performance and Pressure Drop of a Concentric Tube Heat Exchanger. Energies 2024, 17, 1269. [Google Scholar] [CrossRef]
- Martínez-Merino, P.; Alcántara, R.; Gómez-Larrán, P.; Carrillo-Berdugo, I.; Navas, J. MoS2-based nanofluids as heat transfer fluid in parabolic trough collector technology. Renew. Energy 2022, 188, 721–730. [Google Scholar] [CrossRef]
- Singh, V.; Kumar, A.; Alam, M.; Kumar, A.; Kumar, P.; Goyat, V. A study of morphology, UV measurements and zeta potential of Zinc Ferrite and Al2O3 nanofluids. Mater. Today Proc. 2022, 59, 1034–1039. [Google Scholar] [CrossRef]
- Mercan, H. Thermophysical and rheological properties of hybrid nanofluids. In Hybrid Nanofluids for Convection Heat Transfer; Elsevier: Amsterdam, The Netherlands, 2020; pp. 101–142. [Google Scholar] [CrossRef]
- Gupta, M.; Singh, V.; Kumar, R.; Said, Z. A review on thermophysical properties of nanofluids and heat transfer applications. Renew. Sustain. Energy Rev. 2017, 74, 638–670. [Google Scholar] [CrossRef]
- Gamal, M.; Radwan, M.S.; Elgizawy, I.G.; Shedid, M.H. Thermophysical characterization on water and ethylene glycol/water-based MgO and ZnO nanofluids at elevated temperatures: An experimental investigation. J. Mol. Liq. 2023, 369, 120867. [Google Scholar] [CrossRef]
- Yasmin, H.; Giwa, S.O.; Noor, S.; Sharifpur, M. Thermal Conductivity Enhancement of Metal Oxide Nanofluids: A Critical Review. Nanomaterials 2023, 13, 597. [Google Scholar] [CrossRef]
- Zhu, D.; Wang, L.; Yu, W.; Xie, H. Intriguingly high thermal conductivity increment for CuO nanowires contained nanofluids with low viscosity. Sci. Rep. 2018, 8, 5282. [Google Scholar] [CrossRef]
- Okafor, A.C.; Abor, T.K.; Valiev, S.E.; Ekengwu, I.E.; Saka, A.; Okoronkwo, M.U. Thermal Conductivity Characterization of High Oleic Vegetable Oils Based Hybrid Nanofluids Formulated Using GnP, TiO2, MoS2, Al2O3 Nanoparticles for MQL Machining. Int. J. Thermophys. 2024, 45, 1–34. [Google Scholar] [CrossRef]
- Sadeghi, R.; Etemad, S.G.; Keshavarzi, E.; Haghshenasfard, M. Investigation of alumina nanofluid stability by UV–vis spectrum. Microfluid. Nanofluidics 2015, 18, 1023–1030. [Google Scholar] [CrossRef]
- Ribeiro, H.; Taha-Tijerina, J.J.; Gomez, O.; Acosta, E.; Pinto, G.M.; Moraes, L.R.C.; Fechine, G.J.M.; Andrade, R.J.E.; Reinoza, J.; Padilla, V.; et al. Thermal Transport and Rheological Properties of Hybrid Nanofluids Based on Vegetable Lubricants. Nanomaterials 2023, 13, 2739. [Google Scholar] [CrossRef] [PubMed]
- Khodadadi, H.; Aghakhani, S.; Majd, H.; Kalbasi, R.; Wongwises, S.; Afrand, M. A comprehensive review on rheological behavior of mono and hybrid nanofluids: Effective parameters and predictive correlations. Int. J. Heat Mass Transf. 2018, 127, 1131–1151. [Google Scholar] [CrossRef]
Disclaimer/Publisher’s Note: The statements, opinions and data contained in all publications are solely those of the individual author(s) and contributor(s) and not of MDPI and/or the editor(s). MDPI and/or the editor(s) disclaim responsibility for any injury to people or property resulting from any ideas, methods, instructions or products referred to in the content. |
© 2025 by the authors. Licensee MDPI, Basel, Switzerland. This article is an open access article distributed under the terms and conditions of the Creative Commons Attribution (CC BY) license (https://creativecommons.org/licenses/by/4.0/).