Article

Optimizing Wastewater Treatment Reactor Design Using Computational Fluid Dynamics: Impact of Geometrical Parameters on Residence Time and Pollutant Degradation

Department of Process Engineering, Research Centre for Biochemical, Environmental and Chemical Engineering, University of Pannonia, Egyetem Street 10, 8200 Veszprém, Hungary
*
Author to whom correspondence should be addressed.
ChemEngineering 2025, 9(6), 124; https://doi.org/10.3390/chemengineering9060124
Submission received: 29 August 2025 / Revised: 13 October 2025 / Accepted: 24 October 2025 / Published: 7 November 2025

Abstract

This study investigates the impact of equipment geometry on residence time distribution (RTD) using computational fluid dynamics (CFD) methods in a wastewater treatment tank with different configurations of static mixer elements. With growing environmental concerns, optimizing wastewater treatment processes is crucial. Proper mixing in these units can be achieved by optimal placement of static mixer elements such as baffle walls to create circulation zones and increase residence time of the fluid within the control volume. A CFD model of a wastewater treatment tank was developed and validated using experimental RTD data under three distinct mixer configurations.The experimentally validated model was subsequently enhanced by investigating the degradation of methylene blue (MB) during ozonation in the system. The results of the model allowed for the analysis of how tank geometry—specifically, the number and placement of baffles—affects the flow field and MB conversion. RTD was characterized using expectancy and standard deviation of residence time, revealing a link between RTD and MB degradation efficiency. Results showed that constructional parameters significantly influence residence time and mixing efficiency, with a potential 60% increase in expectancy. The model demonstrated high predictive accuracy, ranging from 75% in the worst case to nearly 90% in the best case.

1. Introduction

In this work, we wish to present a case study for the optimization of a wastewater treatment tank using computational fluid dynamics (CFD) methods implemented in COMSOL Multiphysics (5.2a). A CFD model for the system was developed and validated based on experimental data. The model was used to test the degradation efficiency of methylene blue test molecule during an ozonation procedure. The effect of treatment tank geometry on the conversion of the reaction was investigated and used to quantify the purification performance and choose an optimal tank construction.
The proper management of waste, especially of wastewater has become a central consideration for industrial practices. Due to the sustainable development goals (SDG), various studies have put the optimization and analysis of wastewater treatment into focus [1,2,3]. The effective optimization of wastewater treatment is a complex matter as it consists of various steps (filtration, sedimentation, biological and chemical treatment) with multiple operating parameters. However, for each step of the treatment process, a common and critical characteristic is the hydrodynamic behavior of the purification unit. The presence of suboptimal flow conditions such as bypass and dead volumes can significantly decrease the efficacy of the treatment procedure at any given stage. As such optimization of the velocity field through modification of treatment unit geometry has become a focal point of research. Subsequently, the use of Computational Fluid Dynamics (CFD) methods for the optimization of wastewater treatment unit geometry and operating conditions has become an active area of academic research over the last few years.
This connection is shown in an analysis and clustering of keywords in articles collected from the Web of Science and visualized using VOSviewer (1.6.20) [4]. Keywords from more than 1000 articles pertaining to wastewater treatment have been collected and clustered. The occurrence of keywords is indicated by marker size, keywords within the same cluster are highlighted with different marker colors and the number and thickness of connection lines indicate co-occurrences of different keywords. The results are displayed in Figure 1. It can be seen that the use of simulation tools, especially CFD is strongly correlated with concepts of optimization, residence time distribution (RTD) based experiments, desalination processes, and SDGs. The analysis shows that the concept of optimization of wastewater treatment methods using CFD is relevant to a broad range of topics such as separation science, waste heat recovery, desalination technologies and sludge treatment and thus is of interdisciplinary interest.
The observation and characterization of multiphase fluid flow is an integral part of the optimization of wastewater treatment. This characterization can be achieved using experimental means or CFD techniques. Studies have addressed the treatment of multi-phase flow within wastewater systems to investigate the flow field in special treatment systems such as cross-flow gas-liquid wastewater treatment units [5], biological reactors used in wastewater treatment [6,7,8], anaerobic digesters for sludge treatment [9], membrane gas strippers [10], cavitation reactors [11], electrochemical flow cells [12] and desalination units [13].
Traditionally, before the use of CFD methods residence time distribution (RTD) analysis and its derived metrics such as the expectancy and variance of residence time were used as common measures for flow field characterization in complex systems. Even in contemporary research, they are often utilized to validate CFD results or to evaluate and optimize wastewater treatment units [14,15].
Their utility has been highlighted for optimizing sampling strategies in wastewater management units [16], detecting dead volume and bypass areas in wastewater treatment plants [17] and improving system geometry to minimize energy consumption and maximize purification efficiency [18].
As mentioned before the chemical treatment of wastewater for pollutant removal is a critical step of the purification process. Use of the ozonation process for removing various organic pollutants and disinfecting water is a common technique with much research background. Research has been done using CFD simulators to analyze the ozonation process for the removal of various microorganisms such as Bacillus subtilis spores [19] and various pharmaceutical drugs [20].
A popular model molecule to investigate the performance of ozonation is methylene blue (MB) an organic compound which is often used as dye in the textile industry as well as having extensive applications in the pharmaceutical industry as a phenotiazine derivative [21]. Due to its frequent presence as a pollutant molecule in industrial wastewater multiple publications investigated its degradation through ozonation. These studies focus mainly on the process conditions of degradation such as impact of the solution pH on the degradation efficacy of MB during normal and carbon-assisted ozonation [22] and developing first principle models to describe the process kinetics under different conditions [23] in the presence of various catalysts [24].
When taking into account liquid-gas systems which are often used during wastewater treatment such as the ozonation process optimizing gas distribution in the liquid phase is critical. Studies have focused on investigating dissolved gas concentration in wastewater treatment oxidation ditches to pinpoint the biological oxygen demand for pollutant degradation [25] and optimize parameters such as bubble diameter and gas phase residence time to maximize degradation efficiency.
While optimization of wastewater treatment has been well-studied in case of the ozonation process the main focus in most studies lies in optimizing process conditions such as temperature, pH and catalyst distribution within the system. There exists no article as per the authors’ current knowledge about the optimization of the flowfield through adjusting system geometry for enhancing the performance of the ozonation process in case of MB. It must be noted that MB is a convenient tracer and a widely used benchmark dye, however it does not capture the full chemical and structural diversity of real wastewater. Therefore, the present study should be regarded as a proof-of-concept demonstrating the methodology rather than a comprehensive assessment of wastewater complexity. The framework developed here—combining hydrodynamic characterization with validated CFD modeling—is not restricted to MB and can be readily extended to other organic contaminants in future work. By explicitly linking reactor geometry to ozonation performance, this study lays the groundwork for more general investigations of diverse pollutants.
The novelty of the present work therefore lies in bridging this gap by linking reactor hydrodynamics to ozonation performance. This study provides experimental investigation of the flow field in an ozonation reactor under systematically varied geometric conditions, a CFD model of the velocity field and MB mass transport validated against experimental RTD measurements, and a quantitative analysis of how reactor geometry influences MB ozonation kinetics and overall conversion. By combining experiments with validated CFD simulations, this work generates new knowledge on the role of reactor design in ozonation performance, thereby offering guidance for choosing efficient reactor geometries in wastewater treatment applications.
To summarize the study offers the following proposed points:
  • Experimental study of the flow field in a reactor under various geometric conditions.
  • A CFD model for the velocity field in the system and the mass transport of MB validated using experimental RTD.
  • Modeling of the MB ozonation process and investigation of the impact of geometry on the conversion of the reaction.

2. Materials and Methods

In the following subsections, the conditions of experimental work and the parameters of numerical CFD simulations are introduced. The goal was to develop a model for the proper approximation of the flowfield within a model reactor and validate the results. Experiments have been performed to register the RTD of MB tracer in a tank under varying geometrical conditions. After registering RTD functions CFD was utilized to properly model the system, and performance was validated through the use of experimental data. The validated model was used to approximate the process of ozonation of MB within the tank under different geometries and compare them.

2.1. Experimental Setup

The goal of the experimental work was to register the RTD function of the tank with different baffle geometry configurations. The RTD function ( E ( t ) ) for a given time stamp ( τ ) gives the ratio of fluid volume elements in the unit whose residence time within the observed system is infinitesimally close to τ . Let B denote the volumetric flow of tracer liquid injected into the investigated unit with control volume (V). Let the concentration of the tracer liquid (c) be defined as per the Dirac delta function ( δ ). We define the measured concentration signal at the outlet of the tank as the funcion C. Under these assumptions the RTD function may be calculated as per Equation (1).
E ( τ ) = C ( τ ) B 0 c B d τ
When a step input is utilized, the F cumulative distribution function is calculated as the integral of the function E as per Equation (2). Alternatively the ratio of the response function and the steady state value of the input tracer concentration ( c 0 ) may be utilized to calculate F.
F ( τ ) = 0 τ E ( t ) d t = C ( τ ) c 0
When comparing residence time distributions of systems with different flow conditions the expected value (M) and standard deviation (S) of residence time are utilized alongside the RTD functions. These metrics are calculated from the E function in accordance with Equations (3) and (4).
M = 0 t E ( t ) d t
S = 0 t 2 E ( t ) d t
During our experiment, we utilized MB dye as tracer fluid. Using MB we registered the step response of a laboratory-scale tank system with varying constructional parameters and calculated the F function. The F function was utilized to characterize the residence time distribution within the unit and establish a link between the flow field and geometry. The simplified layout of the experimental setup is shown in Figure 2.
The inlet stud of the tank was positioned on the left side of the unit when observing the top view. The liquid feed inlet is shown on the side view at 62.5 mm height, and at a 130 mm distance from the outer wall of the tank. The outlet was positioned at the same relative position on the opposing (right) side of the unit when observed in top view. Four points were located within the tank where the insertion of baffle plates (125 mm height, 120 mm length, and 5 mm width) was possible. These baffle plates have been removed methodically to create three distinct tank constructions and compare the flow field within them. The positions and number of employed baffles for each setup are displayed in Table 1. The reference point of the baffle positions (0,0) shown in the table is the bottom left corner of the tank. This point can be seen in Figure 2.
To test the impact the tank geometry had on the residence time of the tracer within the system, the experimental setup shown in Figure 3 has been developed.
MB tracer of 0.1 mol m 3 concentration mixed from commercially available solid methylene blue (CAS 61-73-4) and ion-exchanged water were stored in a tank (1). The tracer was transport into the system by using a diaphragm pump (2). It was noted during the experiments that the pulsation of the pump resulted in the movement of the fluid surface and introduced unwanted fluid mixing within the unit, as such a buffer (3) was inserted into the experimental setup to mitigate pulsation of the fluid surface. The tracer was added to the investigated tank (4) and the effluent after exiting the unit entered a containment tank (5). The unit was filled with pure ion-exchanged water at the start of each experiment, and the change of tracer concentration intensity was logged by using a camera (6). A calibration equation was utilized to calculate the local concentration of the tracer liquid within the tank based on color intensity registered by the camera a (Raspberry Pi high quality camera V1.0 with 8–50 mm zoom lens).
The experiments were conducted for an investigation time limit of 3 h. The average residence time defined as the ratio of tank volume and inlet volumetric flow was one hour in each case. The operational parameters of the each experiment are shown in Table 2.

2.2. Modeling Procedure

To evaluate the system behavior CFD modeling was utilized. COMSOL Multiphysics version 5.2 was utilized to compute the momentum and component mass balance within the mixing tank. Studies have been conducted using both 2D and 3D models of the different mixer geometries however no significant changes have been observed in the resulting RTD functions. Due to the single phase flow present and no sedimentation or stratification effects being present 3D models were discarded and the authors utilized 2D models for subsequent analysis to minimize computation costs. To validate the model the steady-state momentum and dynamic component balance equations have been solved and the RTD function obtained from simulations have been compared to the experimental RTD functions. After validation, the steady-state momentum balance was solved assuming ozone in the inlet of the reactor to evaluate the distribution of ozone gas in the system and quantify the goodness of gas mixing. Finally, the steady-state component mass balance equation was solved to analyze MB degradation in the presence of ozone assuming a gas-liquid mixed flow velocity field. For the validation of experimental results the laminar Navier-Stokes equations have been employed. The flow model was chosen based on the Reynolds number within the mixing tank ( R e = 43). The steady-state momentum balance equations in the form of the Navier-Stokes equations can be seen in Equation (5).
ρ ( u ) = [ ρ I + μ ( u + ( u ) T ) ] + F e x t
The symbols ρ and μ denote the density and viscosity of the fluid respectively. Based on laboratory measurements the viscosity and density of the tracer fluid were roughly identical to that of the ion-exchanged water. As the experiments were conducted at room temperature the viscosity and density of the fluid were assumed to be constant at 20 °C. The symbols u and I are the velocity and momentum vectors of the fluid, and F e x t is the vector of external forces affecting the fluid. The utilized dynamic component mass balance equation is shown in Equation (6). During the calculations only the presence of conductive and convective mass transport were assumed.
d c i d t = u c i ( D i c i ) = 0
The symbol c i refers to the concentration of the i-th chemical species, and D i refers to the diffusion coefficient of the i-th component in the fluid medium. Fluid properties were assumed to be the same as pure water at 20 °C. The diffusion coefficient of methylene blue at 20 °C in aqueous media was calculated as 0.38 · 10 9 ms 2 [26].
The observation of steady-state ozone distribution in the absence of reaction was evaluated using a two-phase bubbly laminar flow model. Ozone was fed into the unit as part of the inlet as a gas phase within the aqueous medium. Bubble movement within the unit was calculated using the pressure-drag balance, and the terminal velocity of the bubbles was estimated using the Hadamard–Rybczynski equation under the assumption that the bubbles are small and spherical in nature with an average bubble size of 10 2 m [27]. The momentum balance equations for calculating the velocity field for the laminar bubbly flow model is shown in Equation (7).
ϕ l ρ l ( u l ) u l = [ ρ l I + ϕ l μ l ( u l + ( u l ) T ) ] + ϕ l ρ l g + F e x t ϕ g ρ g μ g u l + u s l i p = m g
The terms are the same as with Equation (5), subscripts g , l refer to gas and liquid phases respectively, ϕ refers to the volume fraction of the phase denoted by the respective subscript. To subsequently investigate ozonation the component mass balance equation utilized in 6 was adjusted with a reaction term and rewritten into a steady-state form, this can be seen in Equation (8).
u c i ( D i c i ) = R i
The component source term in Equation (9) was used.
R i = k · c M B · c O 3
The form of the source term, as well as the kinetic parameter (k) of the reaction for a pH of 7 and reaction temperature of 20 °C, was calculated based on the work of Benitez et al. [28]. The kinetic term using their experimental findings was determined to be 74.7 ( m 3 · mol 1 ) 1 2 s 1 . Initial and boundary conditions are provided in Table 3 for each investigated modeling case. Boundary conditions were assumed to be uniform at every boundary.
The balance equations have been solved COMSOL’s internal PARDISO algorithm. The computational mesh has been refined by observing the computational cost of the simulations and the relative error of the mass balance within the system. The relative error of the mass balance ( ϵ ) within the system was calculated according to Equation (10) where m is the mass flow rate as the inlet and outlet boundaries and L is the length of the unit.
ϵ = 0 | m x = 0 m x = L | d t 0 m x = 0 d t
To evaluate mesh independence for the simulations three mesh configurations were tested with different element sizes and differing numbers of mesh elements to evaluate mesh independence. Each mesh was triangular in geometry. Characteristics of each mesh have been investigated by solving the steady-state momentum balance and dynamic component mass balance equations within construction C3. The run time and relative error of the mass balance have been logged. These parameters alongside the element size limits are displayed in Table 4.
Mesh M3 was chosen for further calculations as it provided adequately accurate results in terms of relative mass balance error with reasonable computation times. From a mesh independence perspective, it is also noted that the relative change between relative mass balance error between the two mesh configurations was insignificant ( 0.005 % relative error difference).
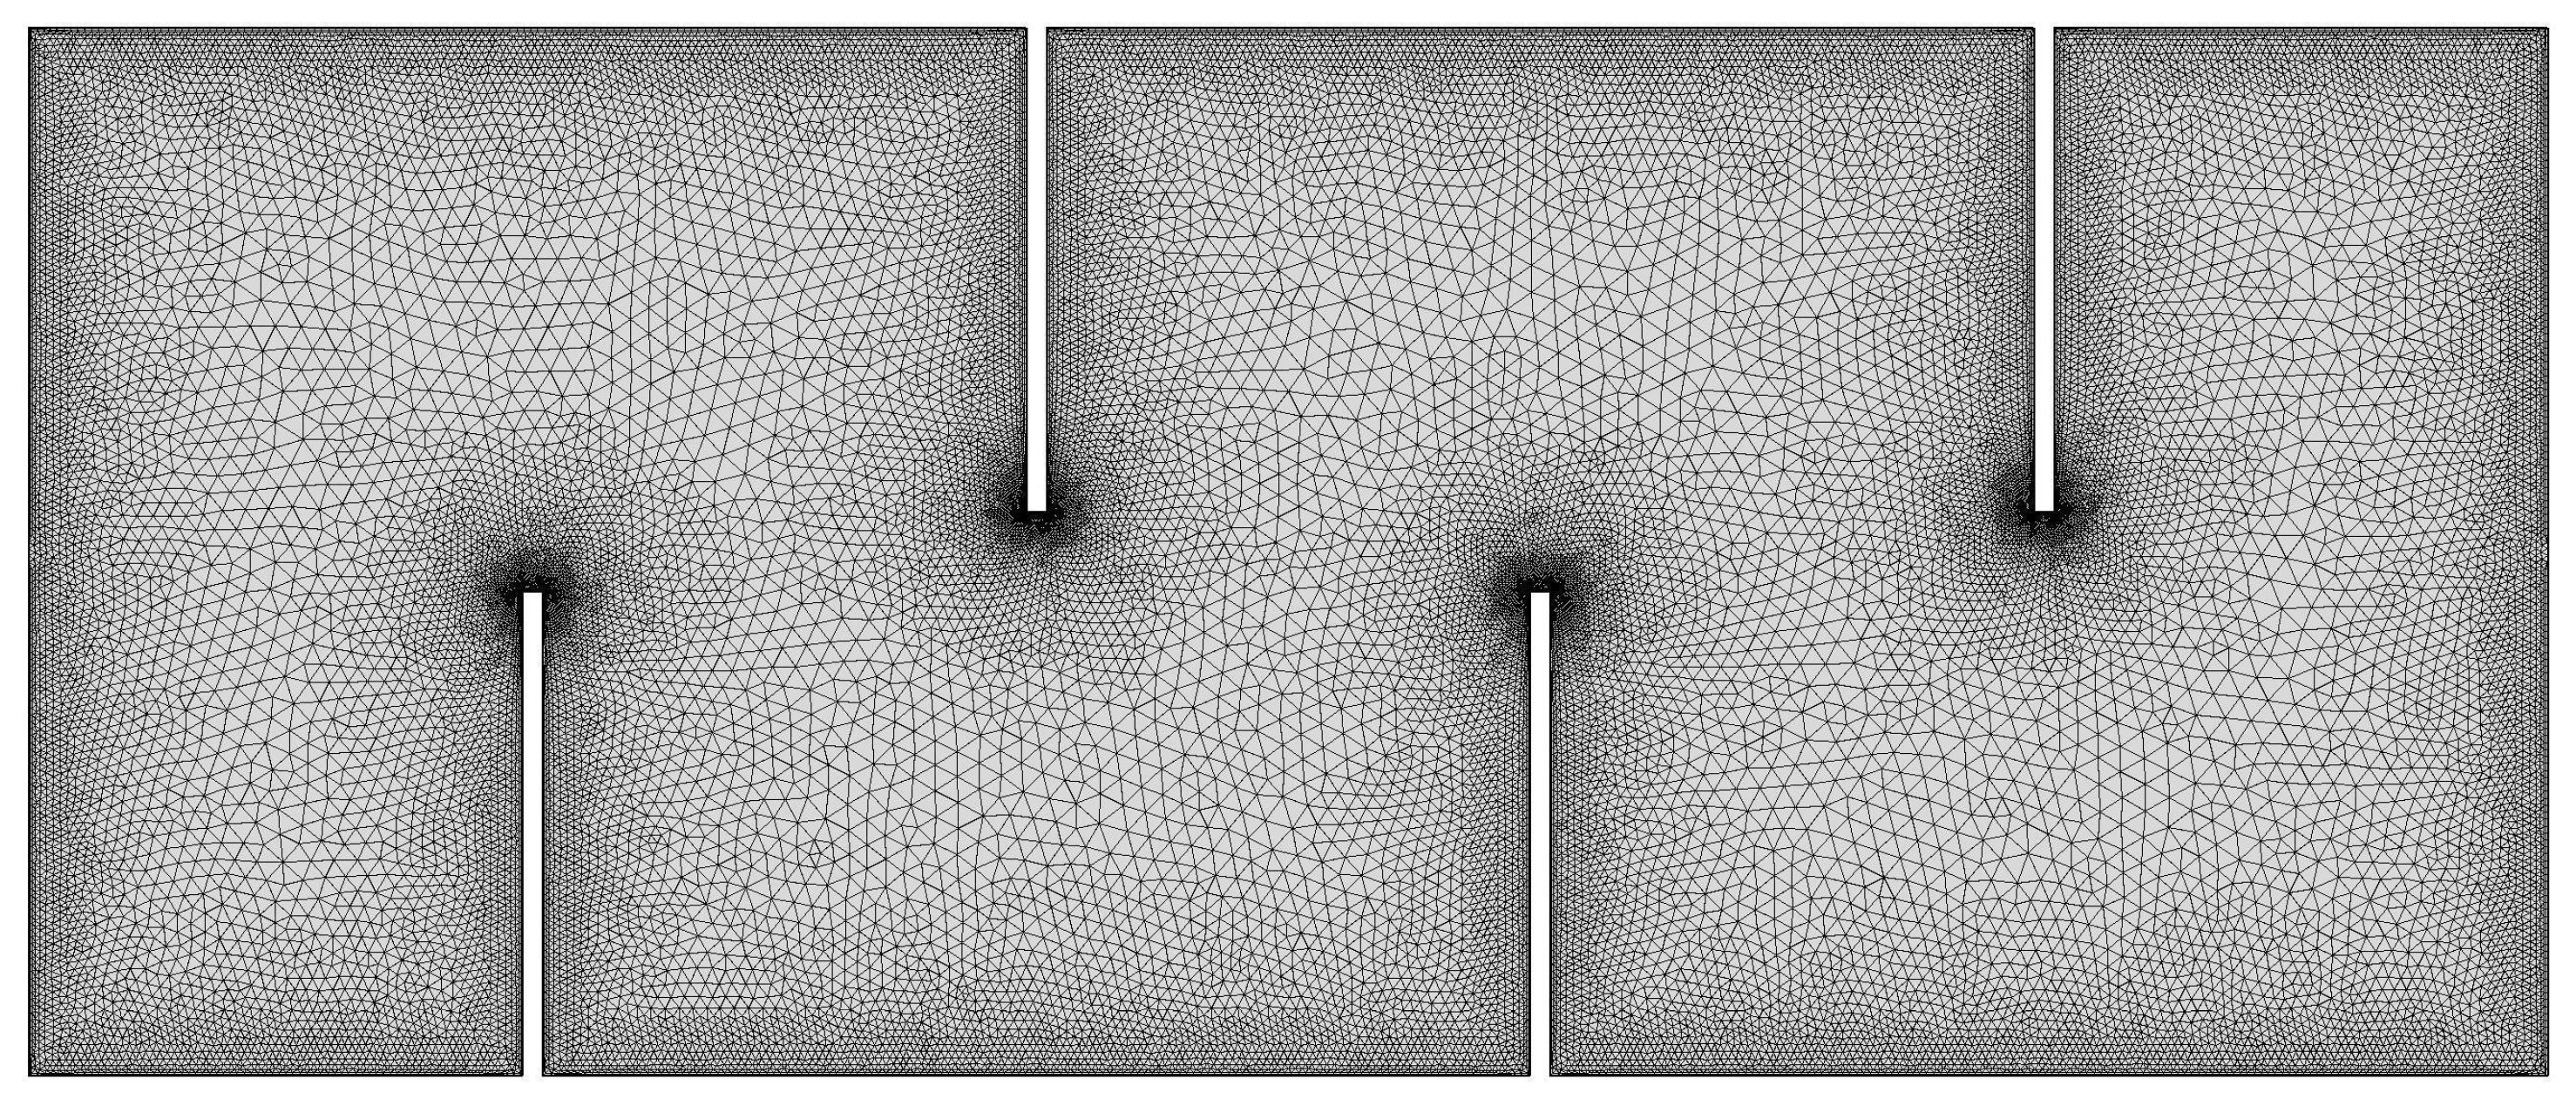
The generated mesh for the most complex C3 geometry is shown in Figure 4. The mesh element number for the three geometries varies between 32,834 (C1) and 54,724 (C3).

3. Results

In the following section, the experimental and simulation results will be presented. First, the CFD results for the approximation of the flow field within the unit are detailed and the experimental validation is showcased. Differences between flow behavior as a function of baffle number are evaluated. Subsequently, a case study for the ozonation process is introduced. The steady-state ozone volume fraction and the steady-state MB concentration profile within the system during ozonation are analyzed. The conversion of MB is used to quantitatively evaluate the performance of each tank construction.

3.1. Flow Field Analysis and Experimental Validation

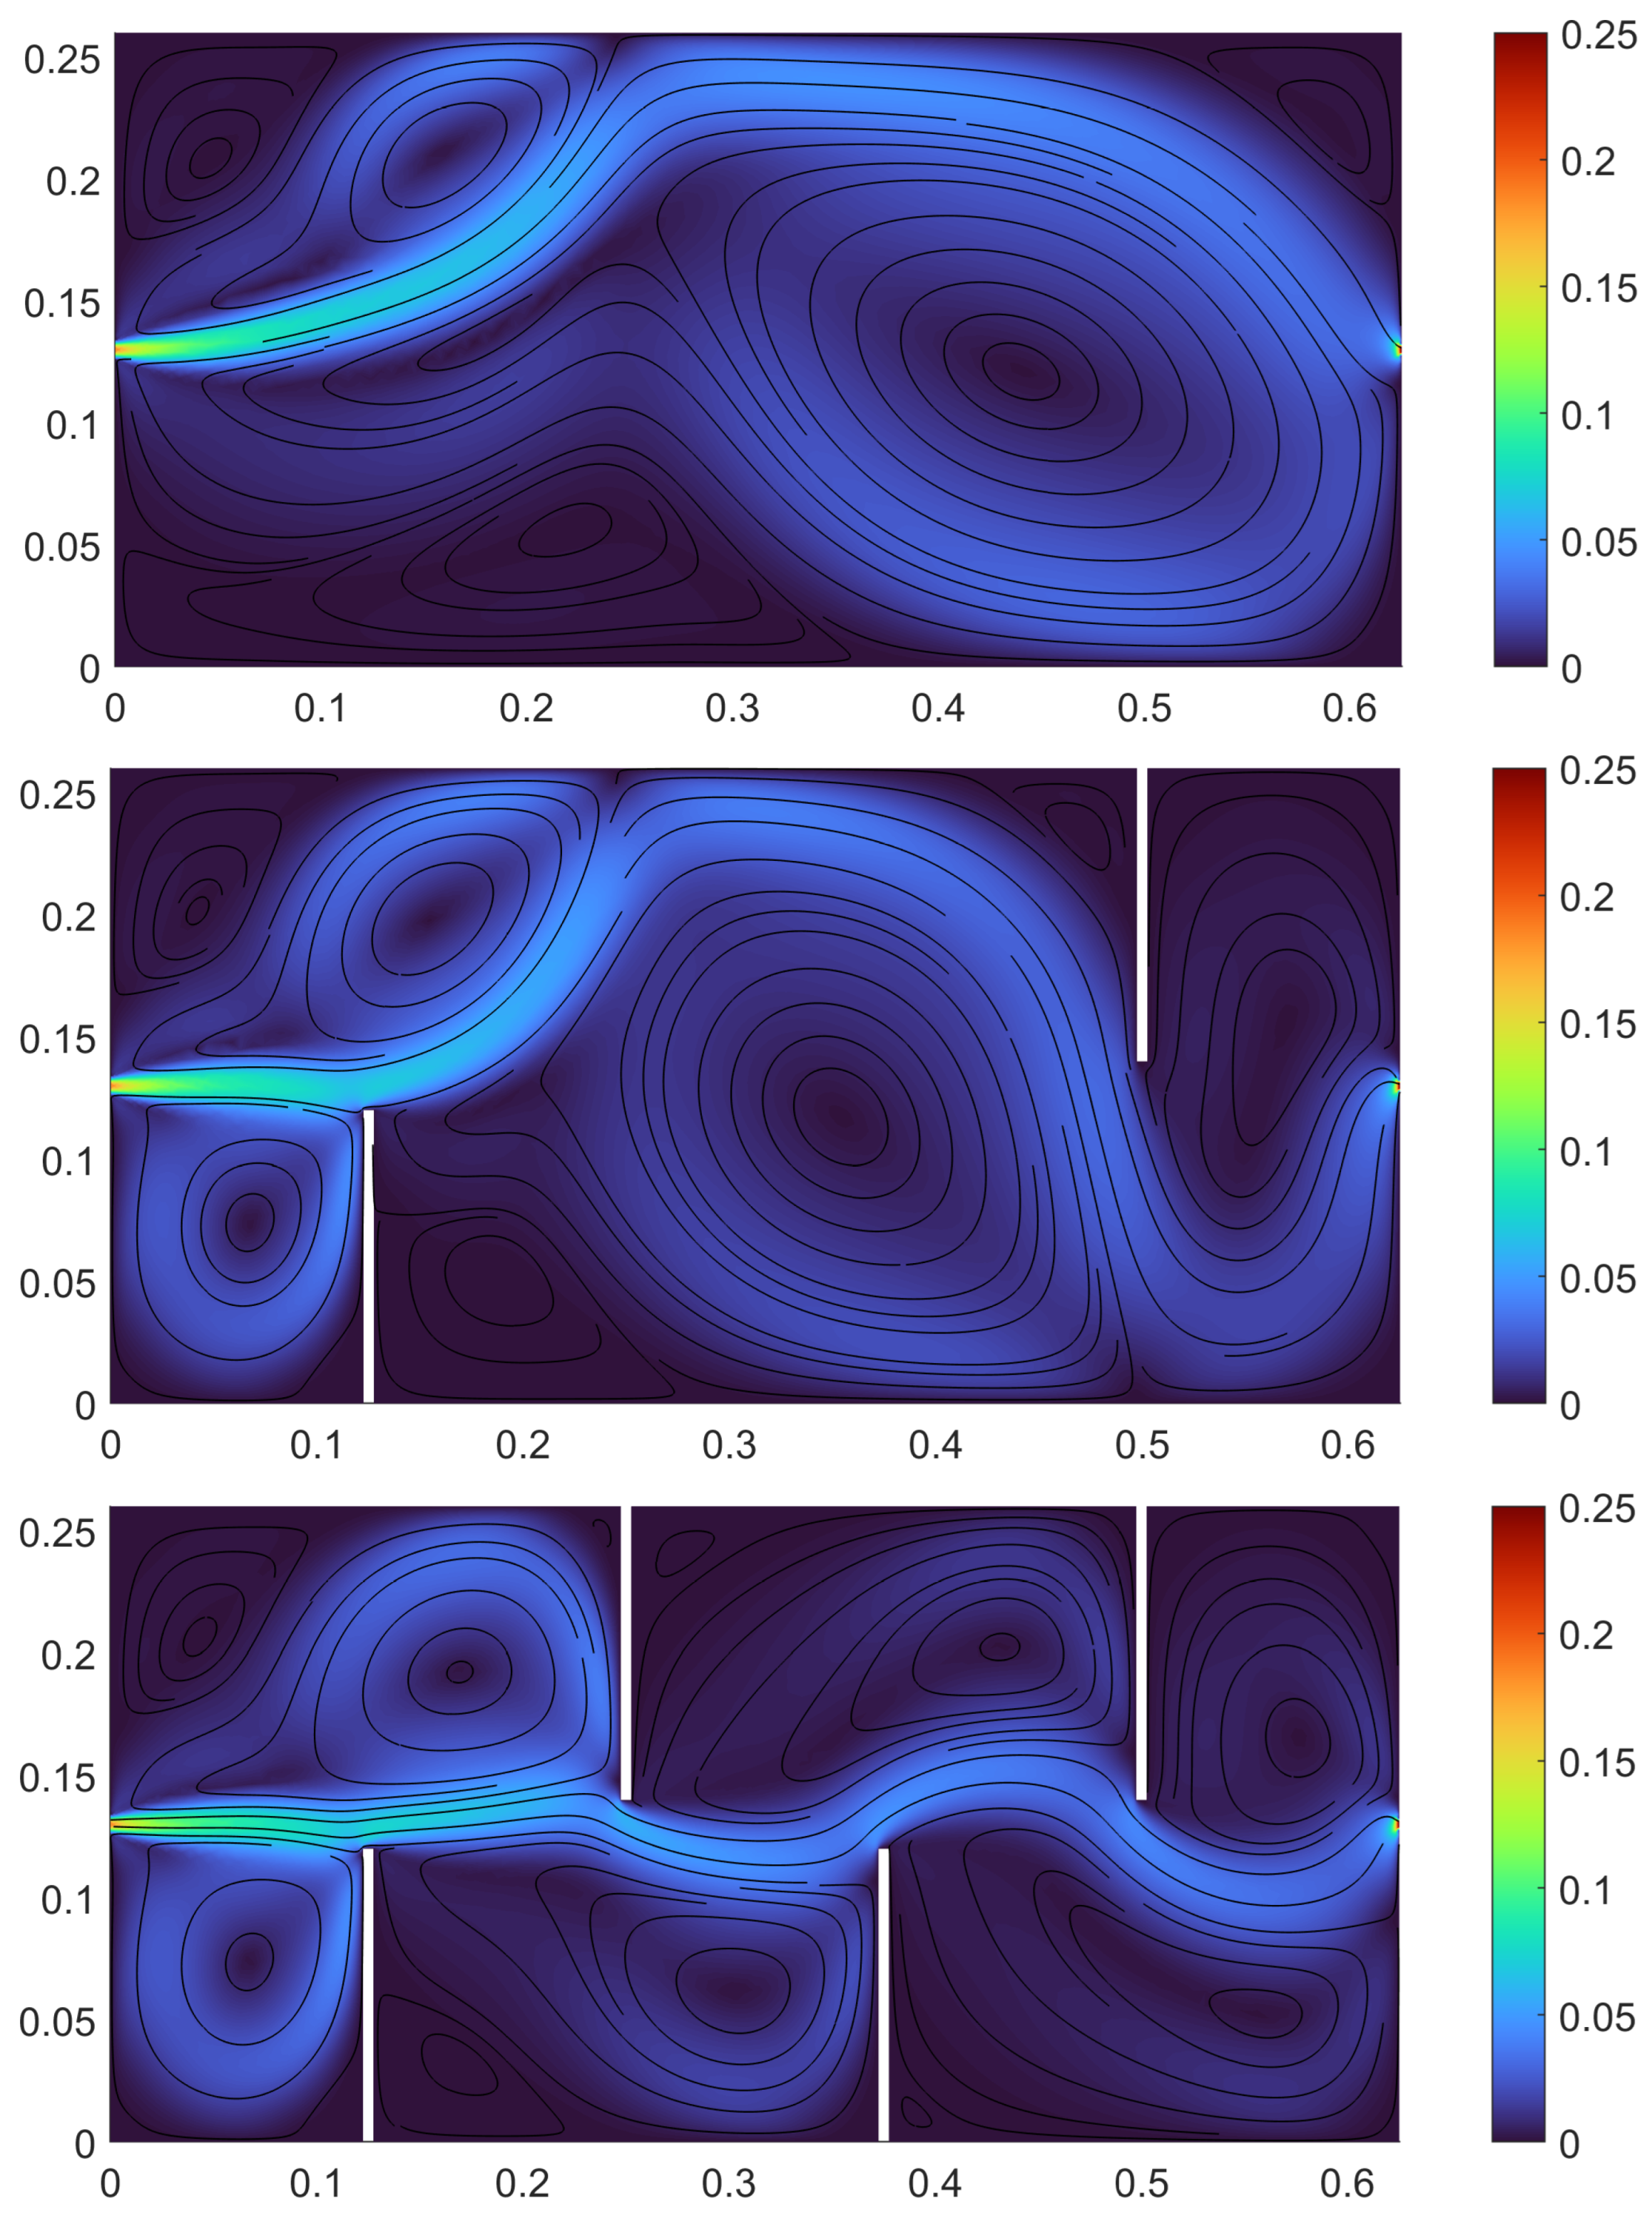
The velocity fields and streamlines for the three investigated constructions are displayed in Figure 5. Velocity uniformly distributed streamlines were utilized to showcase the main flow and circulation paths of the liquid within the control volume.
From the velocity field shown in Figure 5, it can be hypothesized that in the C1 tank construction no significant mixing or recirculation areas are present due to the absence of baffles. The flow is skewed to the sides of the tank and traverses the mixer in a plug-flow-like fashion. In construction C2 strong circulation zones appear in front of the first baffle and between the first and second baffles which allow for longer residence times of the fluid due to back-mixing. In case of geometry the previously mentioned circulation zones can still be observed but in greater number. The intermediate baffles between the first and last baffle create subsequent zones of mixing albeit with lower velocity fluctuations. At the outlet, the flow takes on a shape similar to that of the C2 geometry. To validate the flow fields obtained through the CFD model we display Figure 6 which displays the RTD F function of all mixer geometry variants obtained through experimental means and CFD side-by-side.
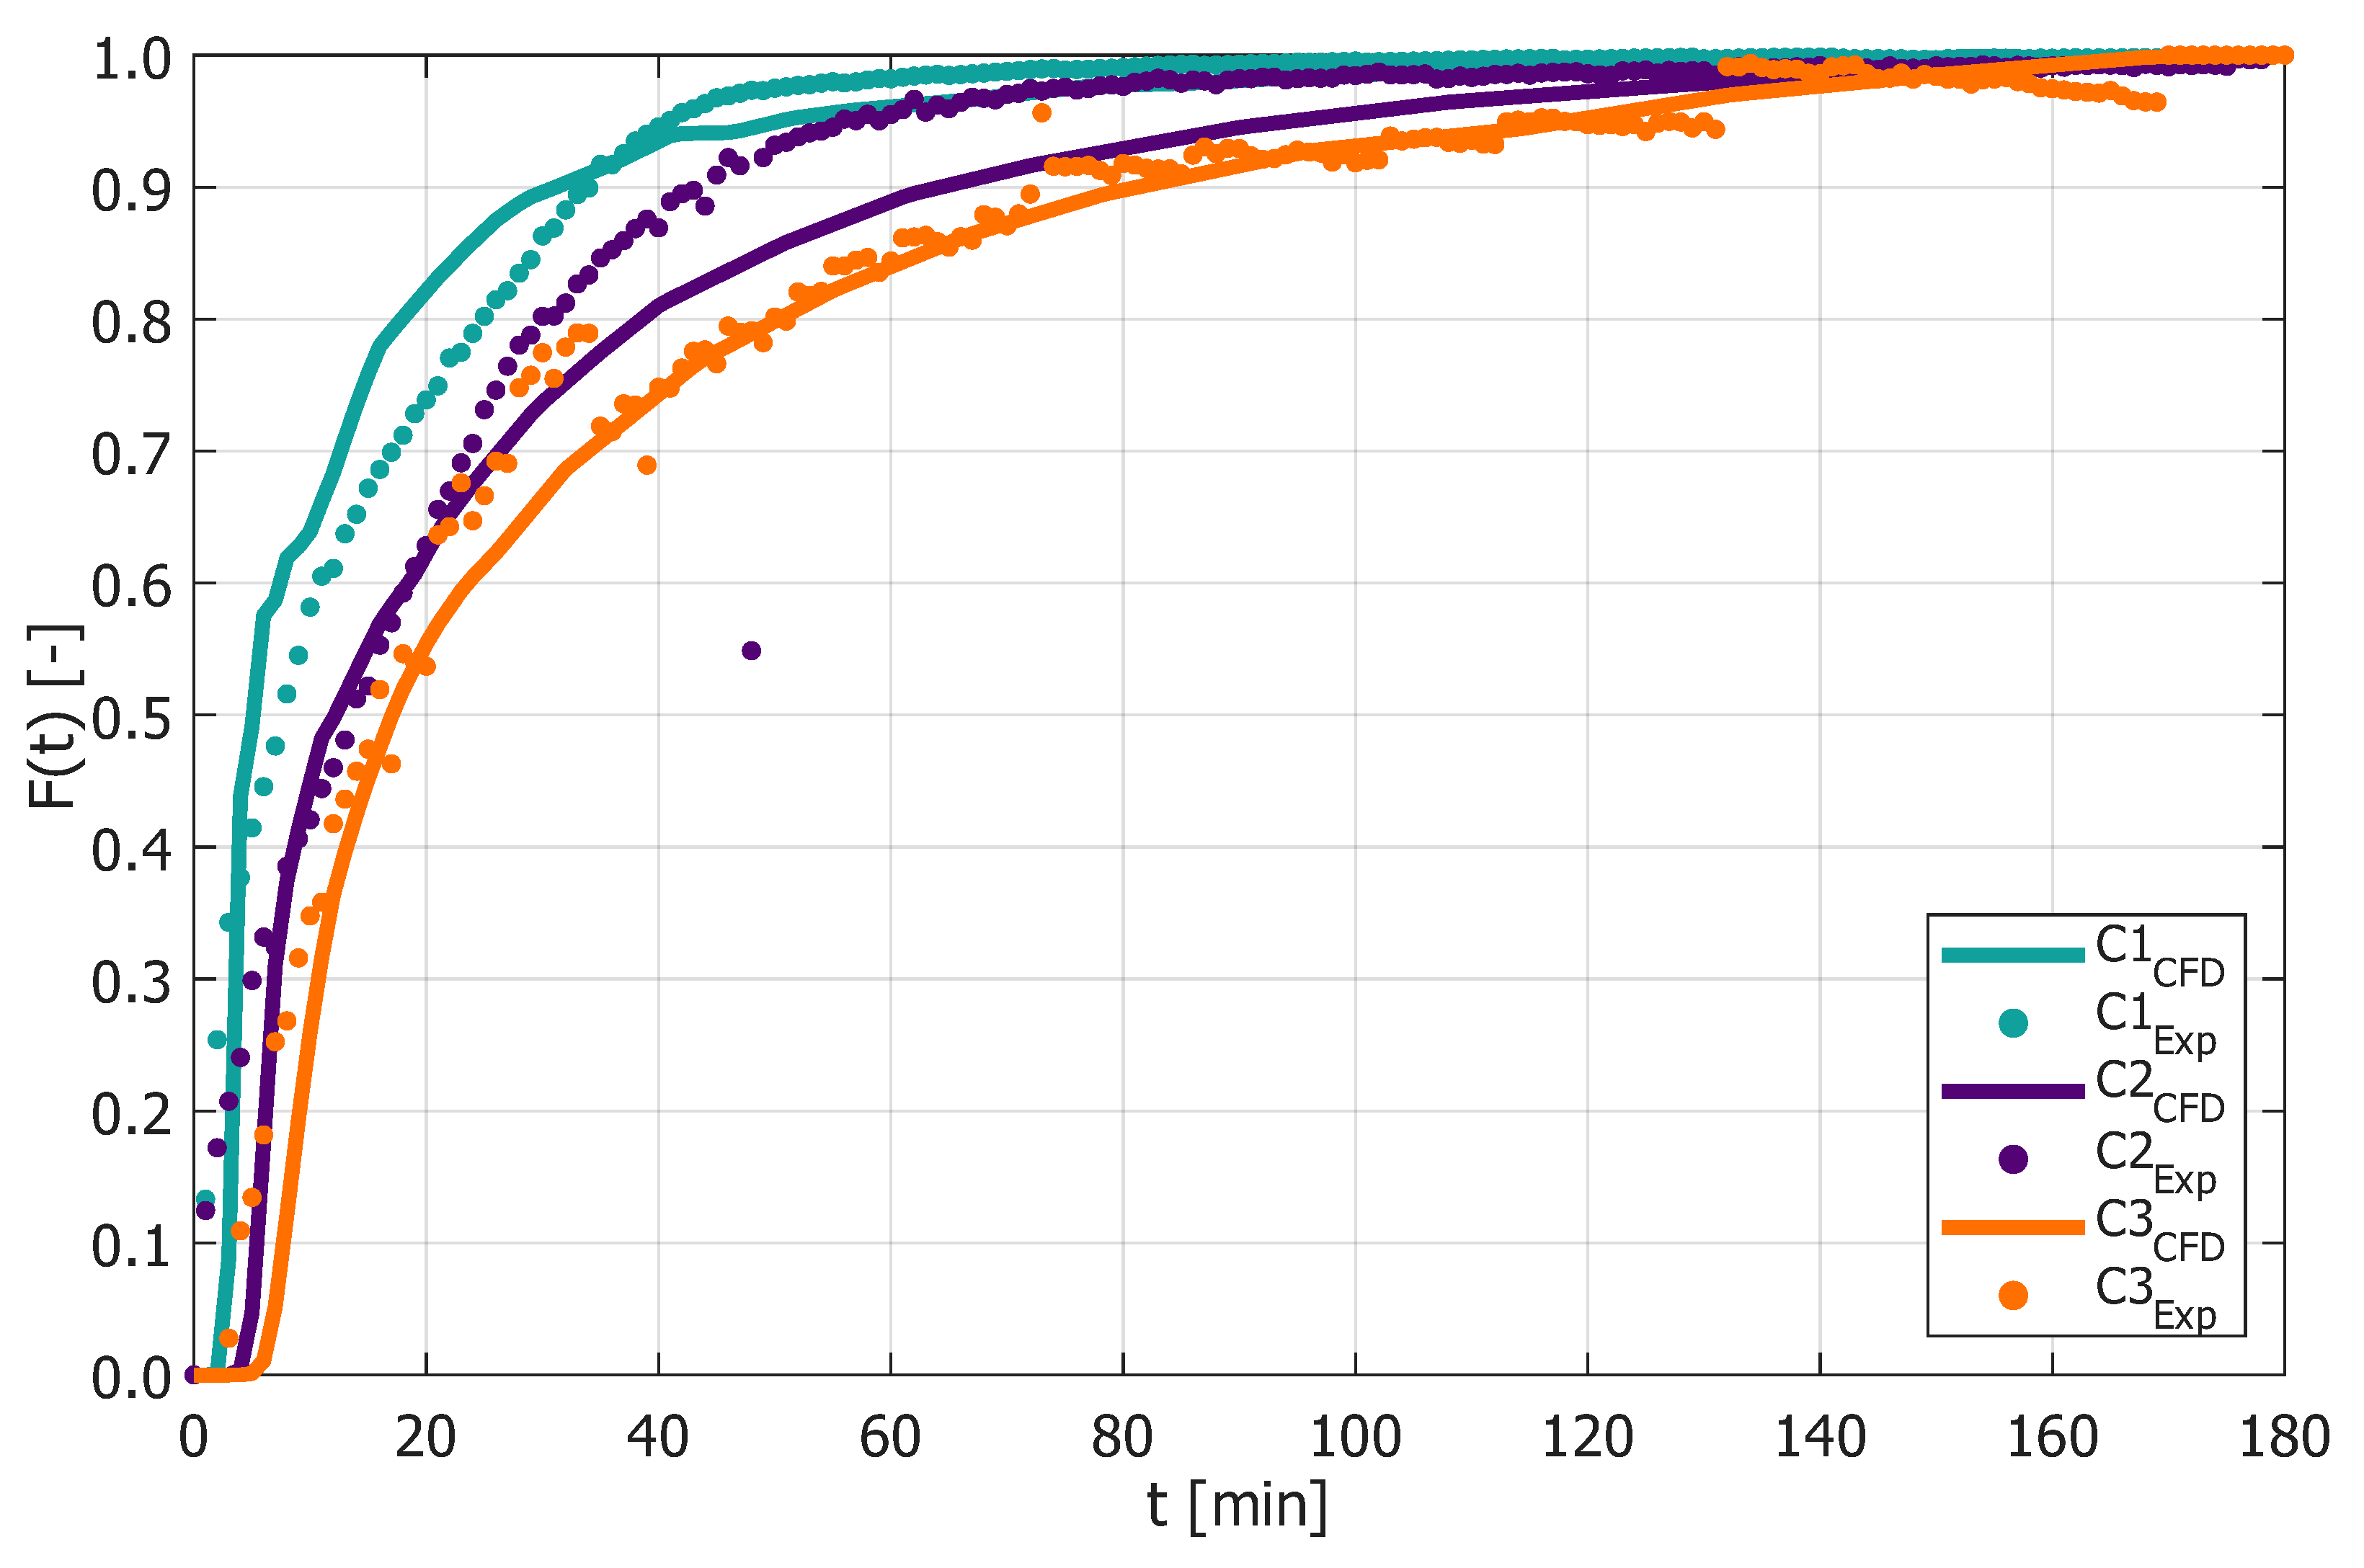
Figure 6 showcases the RTD function of the different mixer geometries in case of simulation and experiments. The figure indicates that with the exception of experimental noise introduced by the camera the CFD model accurately captures the residence time trends of the real tank constructions. Greater inaccuracies can be observed in the C2 construction case but nonetheless, the change of RTD tendency aligns in both cases with a reasonably good fit. It can be seen from the figures that the RTD functions also show clear differences in tendency. As the number of baffles increases the speed of tracer concentration change within the outlet decreases. Visibly the expectancy of the residence time also increases with the number of baffles. The C1 construction with no baffles shows an almost plug-flow-like tendency in its RTD function while C2 and C3 behave more like idealized continuous stirred systems. To quantitatively evaluate the differences between the model and the experimental findings as well as to properly characterize each construction the standard deviation and expectance of the residence time were calculated as per Equations (3) and (4). The calculated metrics for each tank construction are shown in Figure 7.
Figure 7 shows that the experimental and CFD results align strongly and not just for construction C3, the tendency of increasing expectancy as well as the standard deviation of residence time can also be observed in the figures. Differences between the expectancy and standard deviation were the greatest in the case of construction C2 where the RTD function also has the greatest differences between experimental and modeled cases. The relative error of the model was calculated from the expectancy and standard deviation similar to the relative error of the mass balance seen in Equation (9). The most significant discrepancies between experimental and modeling-based metrics can be noticed in case C2 where the model accuracy is around 75 % while in the other instances, the model accuracy for both expectance and the standard deviation is over 85 %. These discrepancies may be attributed to several factors such as the inaccuracy of the calibration curves used to estimate local MB concentration from the color intensity in the tank as well as local non-ideal mixing conditions near the inlet and outlet studs, wall effects and minor geometric imperfection of the tanks which are not captured within the CFD model. Despite these limitations, the model captures the dominant transport and mixing phenomena that govern the spatio-temporal evolution of MB concentration across the system.

3.2. Case Study of MB Ozonation, Conversion and Ozone Distribution as a Function of Geometry

In this section, the case study of the MB ozonation process is introduced. The section addresses two questions, the first being the distribution and average ozone concentration in the unit with a fixed ozone inlet and no MB present as a function of tank construction. The second is the conversion of MB within the system assuming a constant ozone inlet in the unit under the different geometrical constructions. In both instances, steady-state conditions are estimated and used to quantify the impact geometry has on ozone distribution and conversion. In the following, the ozone distribution in the tank will be showcased without the presence of MB. In this case, we may observe the ozone distribution as a function of tank geometry. The volume fraction of the gaseous phase within the liquid medium for all constructions may be observed in Figure 8.
It may be observed that the distribution of ozone volume fraction is strongly dependent on the geometrical construction of the unit. With the increase of baffle number an increase in number and decrease in size of zones with higher ozone volume fraction are observable. For construction C1 only two major ozone spots are detectable near the inlet and outlet of the unit respectively. In the case of C2, this number is five, and in the case of C3 6. This suggests that a more uniform distribution of the gas is achieved by increasing the baffling number. It must also be noted that the zones with the highest ozone concentration in constructions C2 and C3 are observable near the inlet, due to recirculation caused by the baffles while C1 is located near the outlet. The absence of baffles results in there being only one major recirculation zone within the C1 system, and in the midst of the circulation stream is the dead volume where the gas may accumulate.
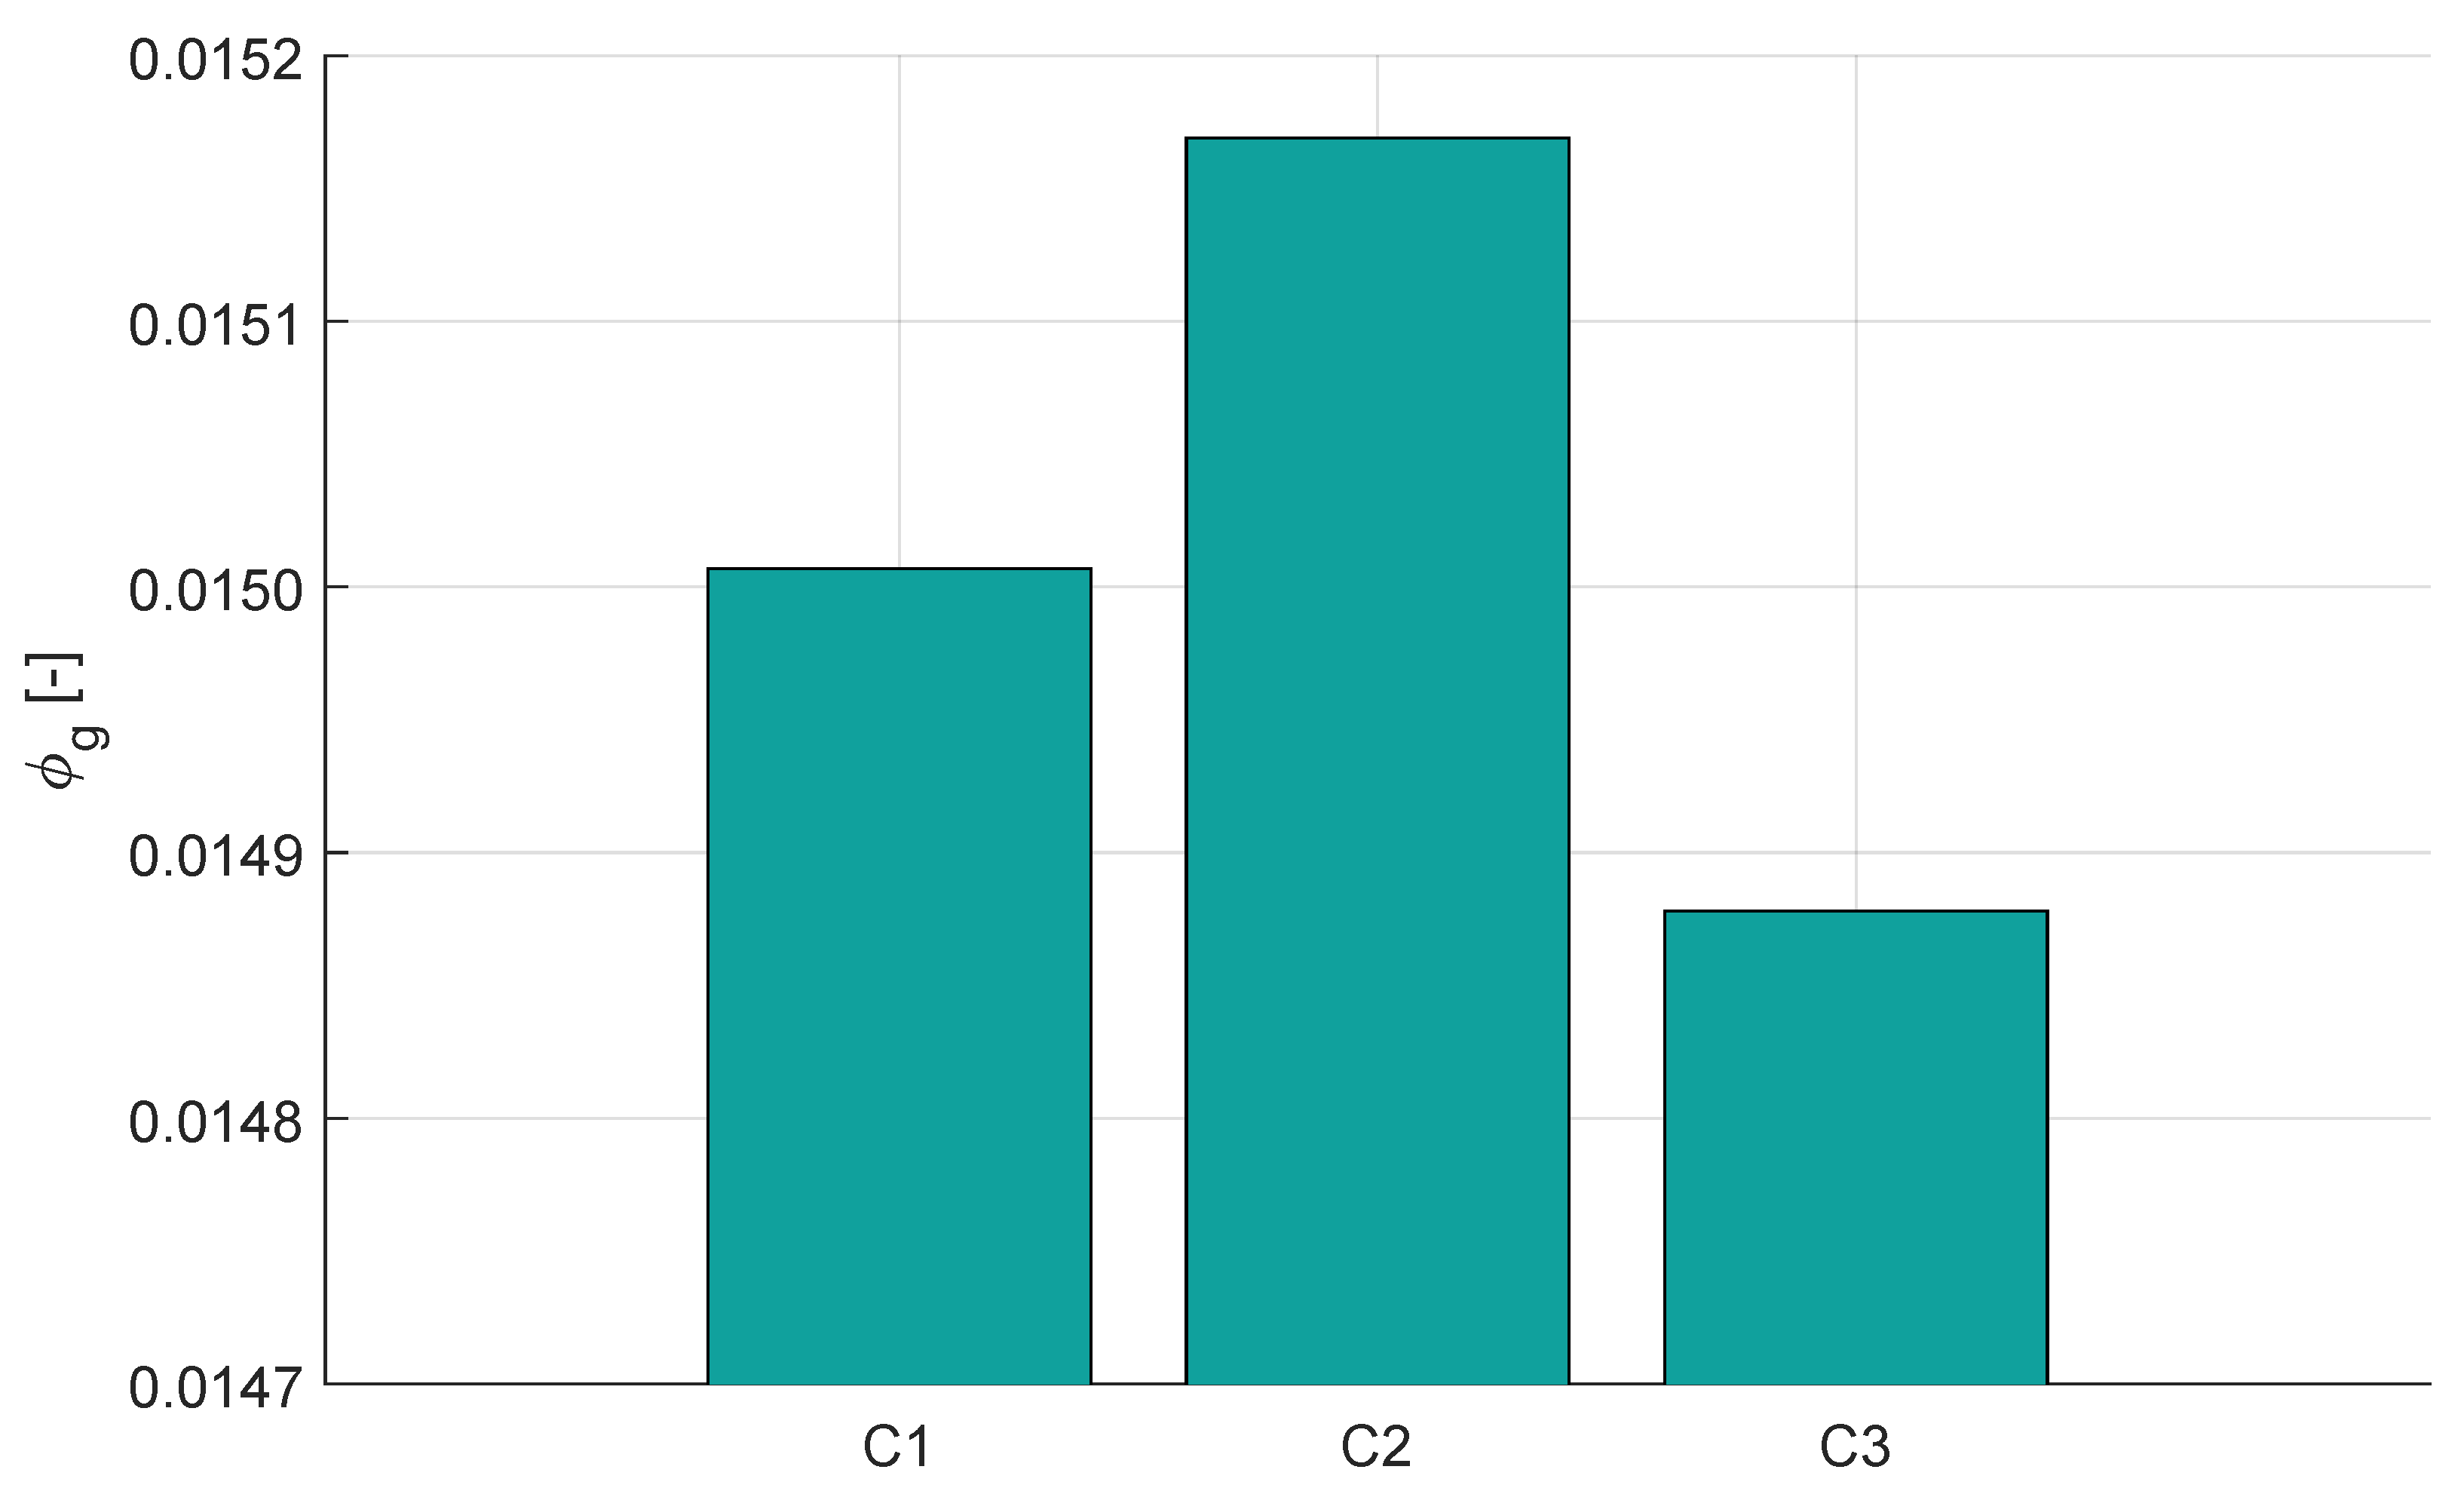
To numerically evaluate the gas volume fraction within each construction the average ozone volume fraction in the system was calculated. The results are displayed in Figure 9.
The results show that construction C2 has the greatest average ozone volume fraction. It can be noted that C2 and C3 share the same large circulation zones near the inlet in which greater ozone accumulation is notable as seen in Figure 9 The difference is that after this C3 shows various zones with smaller ozone volume fractions while C2 includes a great circulation area within the two baffles where significant ozone accumulation can be observed. It is also clearly seen when comparing the results with Figure 6 that ozone gas accumulates in dead volumes within the middle of liquid circulation areas. The ozone may accumulate in these parts without being flushed out by the liquid flow which is why the geometry with the highest expected residence time and best flow distribution C3 has the least amount of accumulated ozone.
The ozonation reaction and the resulting conversion of MB were also observed with the defined boundary and initial conditions. The results for the MB distribution within the system are shown in Figure 10.
It must be noted that as per the observations of Benitez et al., ozonation is an extremely rapid reaction which can also be inferred from the introduced kinetic constant [28]. This results in extremely low average MB concentration being present in the tank all around.
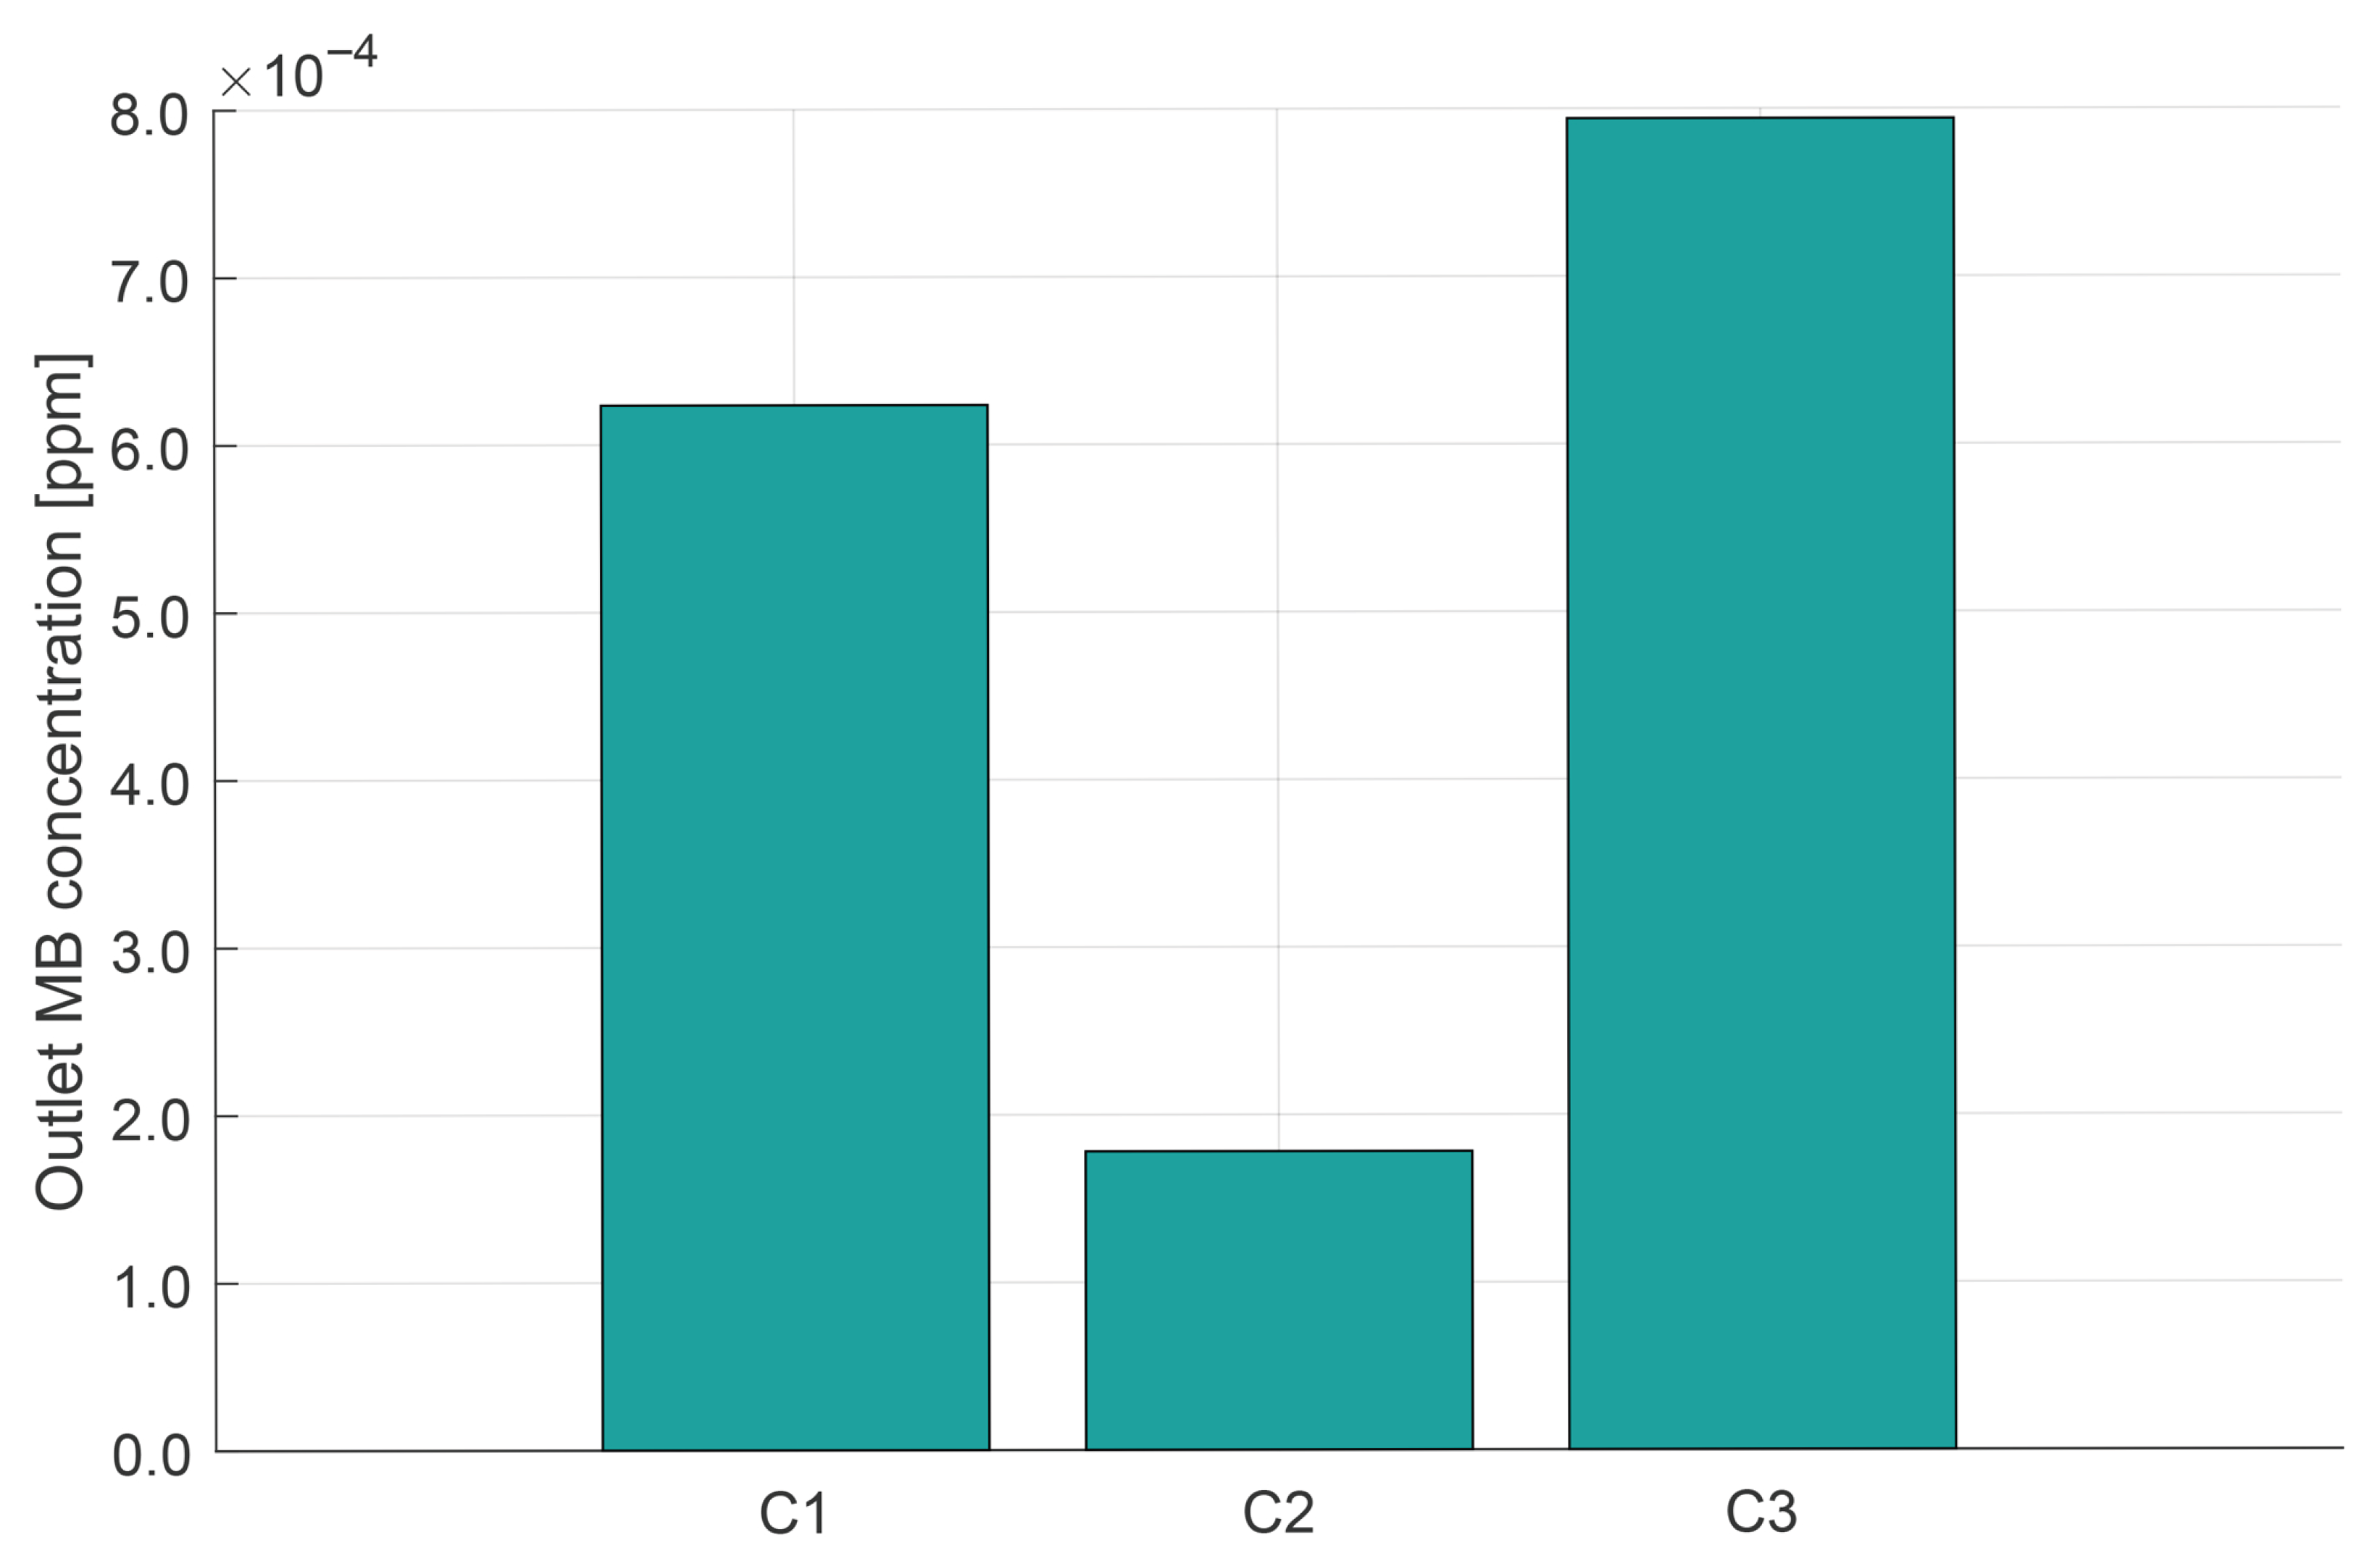
The tendencies of the concentration change can be well explained based on the results of Figure 6 and Figure 8. In the main pathline of liquid MB flow the MB concentration is higher as seen when compared with Figure 8 while in dead zones within the middle of circulation areas the ozone does not get flushed out resulting in almost instantaneous degradation of MB. The outlet concentration of MB at the outlet was calculated for all 3 geometries. The results are displayed in Figure 11.
The results show the same tendency as Figure 9. Since C2 has the greatest retained ozone volume fraction the outlet ozone concentration within the construction is the smallest in ppm.
The results derived from the laboratory-scale reactor and subsequent CFD simulations provide insight into the hydrodynamic optimization potential for wastewater treatment and contain broader implication for scale-up questions. Geometric modifications that improve ozonation efficiency at small scale may not scale linearly due to changes in flow regime, mixing patterns, and gas–liquid mass transfer. Larger reactors require higher gas input and circulation rates, which can increase energy costs for ozone generation and pumping. Therefore, assessing the trade-off between enhanced degradation performance and additional energy demand is critical for practical deployment which can be addressed by the framework discussed in this paper.In terms of integration with existing wastewater infrastructure, ozonation units with properly optimized geometry could be retrofitted as polishing steps following conventional biological treatment. Future work will address the scalability of the proposed design modifications in pilot-scale systems, propose additional machine learning based surrogate modeling strategies with lower computational cost for optimization and evaluate energy efficiency. For these investigations 3D models will be utilized to capture effects which were absent in this study such as sedimentation of flowing solids, stratification and vertical momentum effects.

4. Conclusions

In this article, the authors utilize experiments and computational fluid dynamics (CFD) to examine the residence time distribution (RTD) function and ozonation performance of methylene blue in a tank with different geometrical constructions (C1–C3).
Tracer experiments using methylene blue were conducted to obtain the RTD function and validate the CFD model. Subsequently, the validated model was used to estimate the conversion of MB in the differing geometries during ozonation. The steady-state ozone volume fraction and MB conversion were observed and used to characterize the geometries. It was found that the geometry with two baffles contained the greatest volume fraction of ozone ( 1.51 · 10 2 ) and also provided the greatest conversion of MB (less than 2 ·   10 4 ppm at the outlet). The authors theorize that this was due to the ozone hold-up being greater in the dead volumes within circulation zones leading to increased degradation of MB.
In conclusion in this case the optimal baffle number was found to be two (construction C2). The validation results prove that the model was appropriate for the investigation of ozonation in the system and that the geometry of the unit influences the outlet water quality.
The authors showed that the conversion of the ozonation reaction can be effectively influenced by optimizing system geometry. Adjustments in the operating conditions may allow the established technique to observe ozonation in differing geometries where the impact of the geometry and thus the flow field is even more significant (much more rapid feed velocity, different material properties, etc.). Thus the framework may be extended to address optimal design of wastewater treatment units with different wastewater components present from a pilot scale to industrial volume.
It must be noted that the work focused only on three predefined geometry constructions and performed optimization in a grid search approach. The authors wish to expand upon the foundation laid by this research for further investigation of optimization of wastewater treatment units by adjusting geometrical parameters. Subsequent work will focus on the use of machine learning methods to create surrogate models (Physics Informed Neural Networks) based on CFD results and estimate optimal geometry conditions such as baffle number and position to maximize mixing and ozonation efficiency.

Author Contributions

Conceptualization, B.L.T., A.E., A.K., L.B. and L.N.; methodology, B.L.T. and A.E.; software, A.E.; validation, B.L.T. and J.K.; formal analysis B.L.T. and J.K.; investigation, B.L.T., A.K., L.B. and J.K.; resources, A.E.; data curation, B.L.T., A.K., L.B. and J.K.; writing—original draft preparation, B.L.T.; writing—review and editing, B.L.T., A.E. and L.N.; visualization, B.L.T.; supervision, A.E. and L.N.; project administration, A.E.; funding acquisition, A.E. All authors have read and agreed to the published version of the manuscript.

Funding

This research received no external funding.

Data Availability Statement

The raw data supporting the conclusions of this article will be made available by the authors on request.

Conflicts of Interest

The authors declare no conflict of interest.

References

  1. Malik, O.A.; Hsu, A.; Johnson, L.A.; de Sherbinin, A. A global indicator of wastewater treatment to inform the Sustainable Development Goals (SDGs). Environ. Sci. Policy 2015, 48, 172–185. [Google Scholar] [CrossRef]
  2. Delanka-Pedige, H.M.K.; Munasinghe-Arachchige, S.P.; Abeysiriwardana-Arachchige, I.S.A.; Nirmalakhandan, N. Evaluating wastewater treatment infrastructure systems based on UN Sustainable Development Goals and targets. J. Clean. Prod. 2021, 298, 126795. [Google Scholar] [CrossRef]
  3. Obaideen, K.; Shehata, N.; Sayed, E.T.; Abdelkareem, M.A.; Mahmoud, M.S.; Olabi, A. The role of wastewater treatment in achieving sustainable development goals (SDGs) and sustainability guideline. Energy Nexus 2022, 7, 100112. [Google Scholar] [CrossRef]
  4. Shah, S.H.H.; Lei, S.; Ali, M.; Doronin, D.; Hussain, S.T. Prosumption: Bibliometric analysis using HistCite and VOSviewer. Kybernetes 2020, 49, 1020–1045. [Google Scholar] [CrossRef]
  5. Le Moullec, Y.; Potier, O.; Gentric, C.; Leclerc, J.P. Flow field and residence time distribution simulation of a cross-flow gas–liquid wastewater treatment reactor using CFD. Chem. Eng. Sci. 2008, 63, 2436–2449. [Google Scholar] [CrossRef]
  6. Le Moullec, Y.; Gentric, C.; Potier, O.; Leclerc, J. CFD simulation of the hydrodynamics and reactions in an activated sludge channel reactor of wastewater treatment. Chem. Eng. Sci. 2010, 65, 492–498. [Google Scholar] [CrossRef]
  7. Dabiri, E.; Noori, M.; Zahmatkesh, S. Modeling and CFD simulation of volatile organic compounds removal from wastewater by membrane gas stripping using an electro-spun nanofiber membrane. J. Water Process Eng. 2019, 30, 100635. [Google Scholar] [CrossRef]
  8. Wang, C.; Jin, M.; Yue, S.; Wang, X.; Liu, B.; Shi, Y.; Qiao, N.; Yu, D. Computational fluid dynamics analysis of Trichosporon fermentans flocculation in refined soybean oil wastewater and flocculation rate prediction method. Sci. Total Environ. 2022, 835, 155415. [Google Scholar] [CrossRef]
  9. Dapelo, D.; Bridgeman, J. Euler-Lagrange Computational Fluid Dynamics simulation of a full-scale unconfined anaerobic digester for wastewater sludge treatment. Adv. Eng. Softw. 2018, 117, 153–169. [Google Scholar] [CrossRef]
  10. Sabeti, M.B.; Hejazi, M.A.; Karimi, A. Enhanced removal of nitrate and phosphate from wastewater by Chlorella vulgaris: Multi-objective optimization and CFD simulation. Chin. J. Chem. Eng. 2019, 27, 639–648. [Google Scholar] [CrossRef]
  11. Hong, F.; Tian, H.; Yuan, X.; Liu, S.; Peng, Q.; Shi, Y.; Jin, L.; Ye, L.; Jia, J.; Ying, D.; et al. CFD-assisted modeling of the hydrodynamic cavitation reactors for wastewater treatment—A review. J. Environ. Manag. 2022, 321, 115982. [Google Scholar] [CrossRef]
  12. Gharibian, S.; Hazrati, H.; Rostamizadeh, M. Continuous electrooxidation of Methylene Blue in filter press electrochemical flowcell: CFD simulation and RTD validation. Chem. Eng. Process.-Process Intensif. 2020, 150, 107880. [Google Scholar] [CrossRef]
  13. Yu, J.; Jin, S.; Xia, Y. Experimental and CFD investigation of the counter-flow spray concentration tower in solar energy air evaporating separation saline wastewater treatment system. Int. J. Heat Mass Transf. 2019, 144, 118621. [Google Scholar] [CrossRef]
  14. Rodrigues, A.E. Residence time distribution (RTD) revisited. Chem. Eng. Sci. 2021, 230, 116188. [Google Scholar] [CrossRef]
  15. Borroto, J.; Domınguez, J.; Griffith, J.; Fick, M.; Leclerc, J. Technetium-99m as a tracer for the liquid RTD measurement in opaque anaerobic digester: Application in a sugar wastewater treatment plant. Chem. Eng. Process. Process Intensif. 2003, 42, 857–865. [Google Scholar] [CrossRef]
  16. Majewsky, M.; Gallé, T.; Bayerle, M.; Goel, R.; Fischer, K.; Vanrolleghem, P.A. Xenobiotic removal efficiencies in wastewater treatment plants: Residence time distributions as a guiding principle for sampling strategies. Water Res. 2011, 45, 6152–6162. [Google Scholar] [CrossRef] [PubMed]
  17. Collivignarelli, M.C.; Carnevale Miino, M.; Manenti, S.; Todeschini, S.; Sperone, E.; Cavallo, G.; Abbà, A. Identification and localization of hydrodynamic anomalies in a real wastewater treatment plant by an integrated approach: RTD-CFD analysis. Environ. Process. 2020, 7, 563–578. [Google Scholar] [CrossRef]
  18. Pham, L.A.; Laurent, J.; Bois, P.; Wanko, A. A coupled RTD and mixed-order kinetic model to predict high rate algal pond wastewater treatment under different operational conditions: Performance assessment and sizing application. Biochem. Eng. J. 2020, 162, 107709. [Google Scholar] [CrossRef]
  19. Talvy, S.; Debaste, F.; Martinelli, L.; Chauveheid, E.; Haut, B. Development of a tool, using CFD, for the assessment of the disinfection process by ozonation in industrial scale drinking water treatment plants. Chem. Eng. Sci. 2011, 66, 3185–3194. [Google Scholar] [CrossRef]
  20. Khataee, A.; Farshchi, M.E.; Fathinia, M.; Aghdasinia, H. Photocatalytic ozonation process for degradation of an anthelmintic drug using ceramic coated TiO2 NPs: CFD simulation coupling with kinetic mechanisms. Process Saf. Environ. Prot. 2020, 141, 37–48. [Google Scholar] [CrossRef]
  21. Petzer, A.; Harvey, B.H.; Wegener, G.; Petzer, J.P. Azure B, a metabolite of methylene blue, is a high-potency, reversible inhibitor of monoamine oxidase. Toxicol. Appl. Pharmacol. 2012, 258, 403–409. [Google Scholar] [CrossRef] [PubMed]
  22. Zhang, S.; Wang, D.; Zhang, S.; Zhang, X.; Fan, P. Ozonation and carbon-assisted ozonation of methylene blue as model compound: Effect of solution pH. Procedia Environ. Sci. 2013, 18, 493–502. [Google Scholar] [CrossRef]
  23. Al jibouri, A.K.H.; Wu, J.; Upreti, S.R. Continuous ozonation of methylene blue in water. J. Water Process Eng. 2015, 8, 142–150. [Google Scholar] [CrossRef]
  24. Rauf, M.A.; Meetanim, M.A.; Khaleel, A.; Ahmed, A. Photocatalytic degradation of Methylene Blue using a mixed catalyst and product analysis by LC/MS. Chem. Eng. J. 2010, 157, 373–378. [Google Scholar]
  25. Matko, T.; Chew, J.; Wenk, J.; Chang, J.; Hofman, J. Computational fluid dynamics simulation of two-phase flow and dissolved oxygen in a wastewater treatment oxidation ditch. Process Saf. Environ. Prot. 2021, 145, 340–353. [Google Scholar] [CrossRef]
  26. Leaist, D.G. The effects of aggregation, counterion binding, and added NaCl on diffusion of aqueous methylene blue. Can. J. Chem. 1988, 66, 2452–2457. [Google Scholar] [CrossRef]
  27. Parkinson, L.; Sedev, R.; Fornasiero, D.; Ralston, J. The terminal rise velocity of 10–100 μm diameter bubbles in water. J. Colloid Interface Sci. 2008, 322, 168–172. [Google Scholar] [CrossRef]
  28. Benitez, F.J.; Beltran-Heredia, J.; Gonzalez, T.; Pascual, A. Ozone treatment of methylene blue in aqueous solutions. Chem. Eng. Commun. 1993, 119, 151–165. [Google Scholar] [CrossRef]
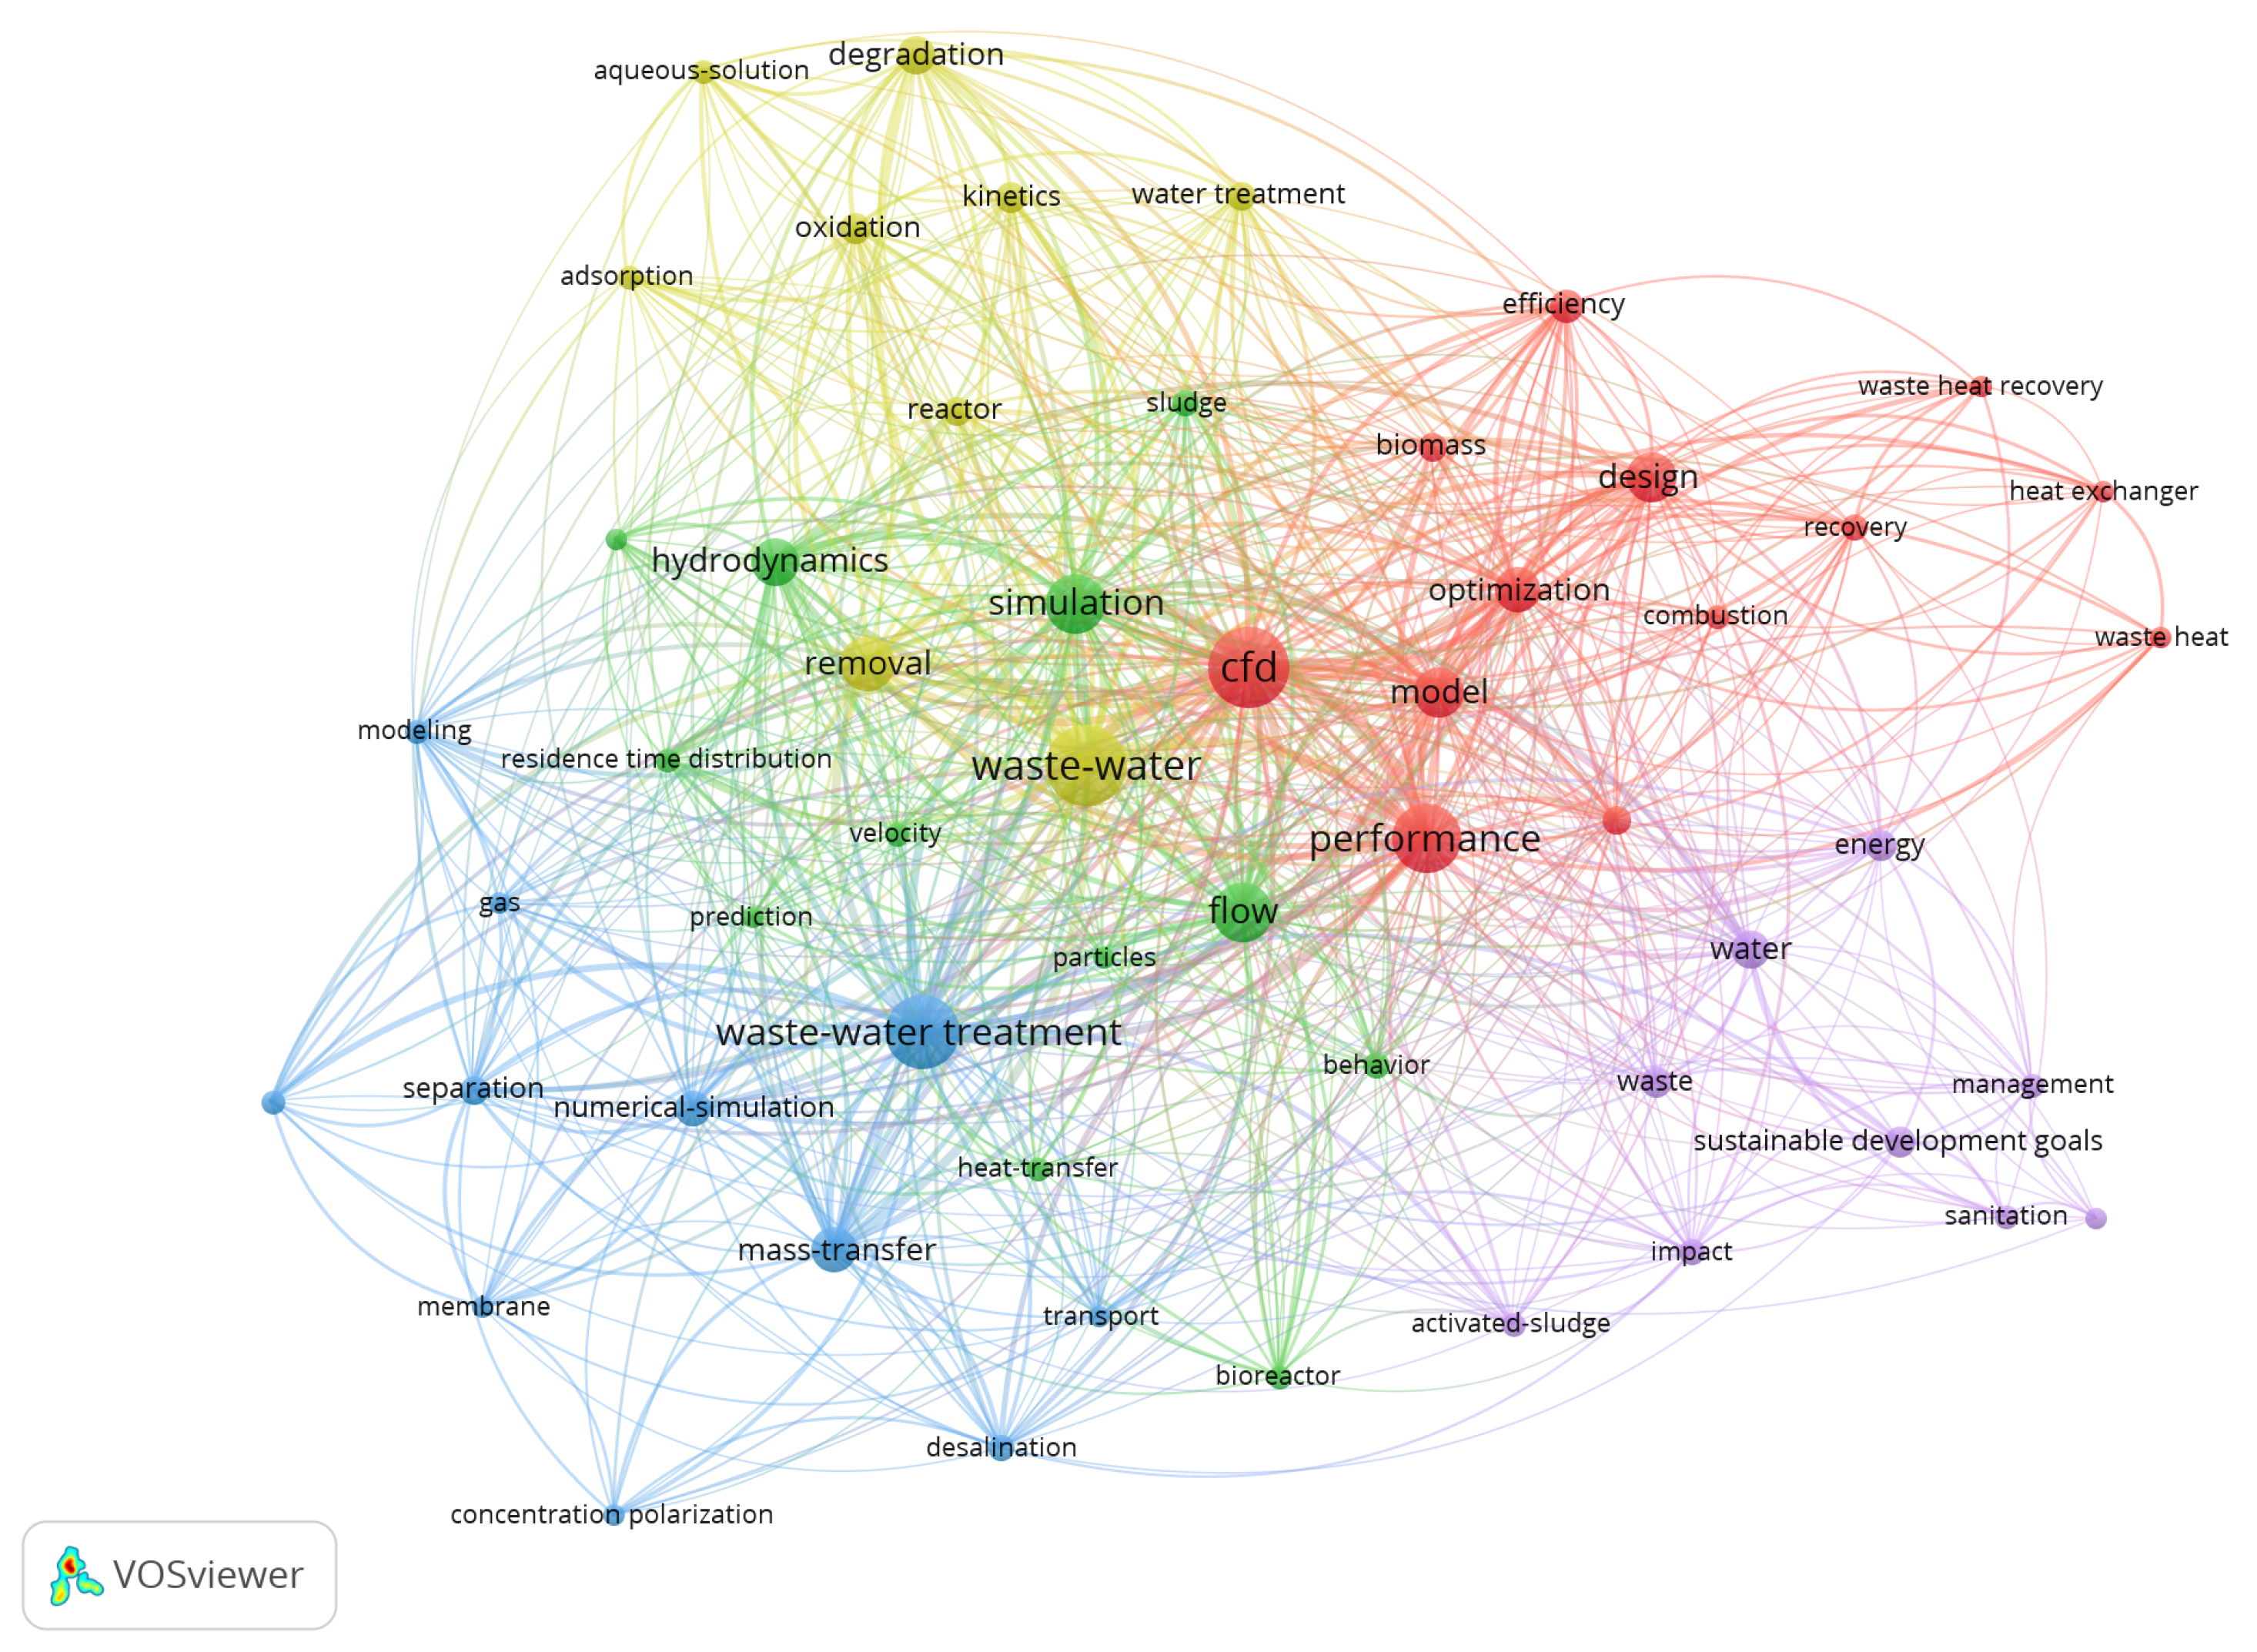
Figure 1. Related keywords for waste-water treatment, SDG and CFD.
Chemengineering 09 00124 g001
Figure 2. Geometry of the observed unit from top (left) and side (right) view [mm].
Chemengineering 09 00124 g002
Figure 3. Layout of the experimental setup.
Chemengineering 09 00124 g003
Figure 4. View of the generated mesh for the C3 geometry (mesh element number 54,724).
Chemengineering 09 00124 g004
Figure 5. The velocity field [ms−1] and streamlines for the three investigated mixer geometries (C1 (top), C2 (middle) and C3 (bottom)).
Chemengineering 09 00124 g005
Figure 6. RTD F function of the constructions obtained through experimental means and CFD.
Chemengineering 09 00124 g006
Figure 7. Comparison of expectancy of residence time for experimental and CFD results for all tank constructions.
Chemengineering 09 00124 g007
Figure 8. Steady-state ozone volume fraction distribution within the unit for different constructions without reaction sink term (C1 (top), C2 (middle) and C3 (bottom)).
Chemengineering 09 00124 g008
Figure 9. Average steady-state ozone volume fraction in the three investigated constructions.
Chemengineering 09 00124 g009
Figure 10. Steady-state MB distribution ( mol m 3 ) within the reactor during ozonation in the three investigated constructions (C1 (top), C2 (middle) and C3 (bottom)).
Chemengineering 09 00124 g010
Figure 11. Steady-state MB concentration [ppm] within the reactor during ozonation in the three investigated constructions.
Chemengineering 09 00124 g011
Table 1. Positions and numbers of baffles for different tank constructions (reference point of the baffle positions (0,0) located at the bottom left position of the tank in top view (Figure 2)).
ConstructionNumber of BafflesLongitudinal Baffle
Position [mm]
Lateral Baffle
Position [mm]
C10Not applicableNot applicable
C121250
500140
C341250
250140
3750
500140
Table 2. Operation parameters of the unit during RTD experiments.
Process ConditionValueUnit
Tank volume12.5L
Inlet volumetric flow12.5 L h 1
Average residence time1h
Inlet velocity0.17 ms 1
Inlet concentration0.1 mol m 3
Table 3. Initial and boundary conditions for the investigated cases.
Study CasePhenomenonStateInitial ConditionsBoundary Conditions
Experimental
validation
Laminar flowSteady u = 0 Inlet velocity of 0.17 m s 1
Outlet pressure of 0 Pa
MB mass balanceDynamic c M B = 0 Inlet concentration of 0.1 mol m 3
Investigation of MB
degradation during
ozonation
Steady u = 0 Inlet O 3 density of 0.032 kg m 3
Laminar bubbly flow ρ O 3 = 0 Outlet pressure of 0 Pa
MB, O 3 mass balance Outlet O 3 density of 0 kg m 3
Steady c M B = 0 Inlet MB concentration of
0.1 mol m 3
c O 3 = 0 Inlet O 3 concentration of
0.1 mol Y 3
Table 4. Investigated mesh parameters and results for mesh choice.
Mesh
Identifier
Number of CellsMin. Element
Size [mm]
Max. Element
Size [mm]
ϵ Computation
Time [h]
M117,322 8 · 10 2 17 6 · 10 2 0.17
M254,724 2 · 10 2 13 2.2 · 10 2 0.3
M382,413 10 3 7 1.7 · 10 2 0.35
Disclaimer/Publisher’s Note: The statements, opinions and data contained in all publications are solely those of the individual author(s) and contributor(s) and not of MDPI and/or the editor(s). MDPI and/or the editor(s) disclaim responsibility for any injury to people or property resulting from any ideas, methods, instructions or products referred to in the content.