Article

Modeling of Temperature and Moisture Dynamics in Corn Storage Silos with and Without Aeration Periods in Three Dimensions

by
F. I. Molina-Herrera
1,
H. Jiménez-Islas
1,
M. A. Sandoval-Hernández
2,
N. E. Maldonado-Sierra
3,
C. Domínguez Campos
3,
L. Jarquín Enríquez
3,
F. J. Mondragón Rojas
3 and
N. L. Flores-Martínez
3,*
1
Departamento de Ingeniería Bioquímica y Ambiental, Tecnológico Nacional de México en Celaya, Antonio García Cubas Pte #600, esq, Ave. Tecnológico, Celaya, Gto. 38010, Mexico
2
Centro de Bachillerato Tecnológico Industrial y de Servicios, No. 190. Av. 15 S/N esq. Calle 11, Col. Venustiano, Carranza, Boca del Río, Ver. 94297, Mexico
3
Departamento de Ingeniería en Alimentos, Universidad Politécnica de Guanajuato, Av. Universidad Sur 1001, Cortázar, Gto. 38496, Mexico
*
Author to whom correspondence should be addressed.
ChemEngineering 2025, 9(4), 89; https://doi.org/10.3390/chemengineering9040089
Submission received: 8 April 2025 / Revised: 14 July 2025 / Accepted: 5 August 2025 / Published: 15 August 2025

Abstract

This study analyzes the dynamics of temperature and moisture in a cylindrical silo with a conical roof and floor used for storing corn in the Bajío region of Mexico, considering conditions both with and without aeration. The model incorporates external temperature fluctuations, solar radiation, grain moisture equilibrium with air humidity through the sorption isotherm (water activity), and grain respiration to simulate real storage conditions. The model is based on continuity, momentum, energy, and moisture conservation equations in porous media. This model was solved using the finite element method (FEM) to evaluate temperature and interstitial humidity variations during January and May, representing cold and warm environmental conditions, respectively. The simulations show that, without aeration, grain temperature progressively accumulates in the center and bottom region of the silo, reaching critical values for safe storage. In January, the low ambient temperature favors the natural dissipation of heat. In contrast, in May, the combination of high ambient temperatures and solar radiation intensifies thermal accumulation, increasing the risk of grain deterioration. However, implementing aeration periods allowed for a reduction in the silo’s internal temperature, achieving more homogeneous cooling and reducing the threats of mold and insect proliferation. For January, an airflow rate of 0.15 m3/(min·ton) was optimal for maintaining the temperature within the safe storage range (≤17 °C). In contrast, in May, neither this airflow rate nor the accumulation of 120 h of aeration was sufficient to achieve optimal storage temperatures. This indicates that, under warm conditions, the aeration strategy needs to be reconsidered, assessing whether a higher airflow rate, longer periods, or a combination of both could improve heat dissipation. The results also show that interstitial relative humidity remains stable with nocturnal aeration, minimizing moisture absorption in January and preventing excessive drying in May. However, it was identified that aeration period management must be adaptive, taking environmental conditions into account to avoid issues such as re-wetting or excessive grain drying.

1. Introduction

The proliferation of fungi and insects is a primary biological issue that causes grain spoilage during storage in silos and warehouses, as both are heavily influenced by temperature and moisture inside the grain mass. Monitoring temperature and moisture content during storage is crucial to reducing biological deterioration risk and maintaining stored grain’s safety and quality [1,2,3,4]. Most fungi that affect stored grains grow best between 20 °C and 30 °C [5,6]. Higher temperatures can increase their development, but very high or very low temperatures can inhibit their growth. Likewise, insect activity and reproduction depend on temperature. Most grain-infesting insects reproduce more rapidly within the 25 °C to 35 °C range [5,6,7]. Very low temperatures can disable or kill them, while high temperatures, if not lethal, may slow their activity or cause death. Besides temperature, moisture in the interstitial spaces is a key factor in the growth of fungi and insects. Fungi need water activity levels above 70%, which helps spores germinate and mycelia grow [8,9,10]. Not only do fungi consume grain nutrients, but they can also produce mycotoxins that are harmful to health. Similarly, insects benefit from high interstitial moisture, which supports their reproduction and development. Species like grain beetles and moths can multiply rapidly under these conditions [4].
Monitoring interstitial temperature and relative humidity during grain storage is essential to maintaining the quality and integrity of stored grain, boosting operational efficiency, and ensuring long-term profitability. Various techniques and tools are available for taking these measurements in the field, each with its own advantages and disadvantages. A standard method for monitoring temperature and interstitial humidity during grain storage involves using thermocouples, infrared sensors, and hygrometers, which are installed inside the silo or warehouse to provide real-time measurements of air temperature and relative humidity [4,11].
These sensors can be placed at various locations to create a detailed map of storage conditions [12]. However, installing multiple sensors can be expensive and require regular maintenance by trained personnel. Additionally, these devices offer point measurements, so if they are not adequately spaced, they may not accurately reflect the overall thermal and humidity conditions within the silo or warehouse [2,13,14,15].
Therefore, Computational Fluid Dynamics (CFD) is a complementary method that enhances the accuracy and effectiveness of managing these variables. CFD enables detailed simulation of complex interactions between the fluid (air) and the porous medium (stored grain) while accounting for environmental conditions. It covers airflow modeling, humidity distribution, and the effects of external factors such as ambient temperature changes and solar radiation. Additionally, it allows for the evaluation of aeration periods and durations within the silo or storage facility, aiding in optimizing post-harvest management strategies [2,5,11,15,16,17,18].
Aeration during grain storage in silos is a key post-harvest management technique that employs forced air, driven through the grain mass by fans to control temperature and relative humidity inside the silo or storage facility. This process is vital to prevent heat and moisture buildup, which could harm the quality of the stored grain. Forced air circulates through the grain, absorbing heat and moisture, helping to cool the grain and reducing its moisture content if the air is dry enough. Then, the heat- and moisture-laden air is expelled from the silo, preventing conditions that favor mold growth and insect infestation [5,19,20,21]. The air entering the silo or storage facility via the fans can be pre-conditioned to regulate its temperature and humidity, optimizing its impact on the grain. These systems can operate independently of external weather conditions, useful in regions with extreme or highly variable climates [11,16]. However, this approach has economic and operational limitations that must be considered. Installing systems capable of adjusting air temperature and humidity, such as heaters, coolers, dehumidifiers, or humidifiers, involves a significant initial cost. Additionally, these systems need to handle large volumes of air to be effective. They are also prone to failures and may require frequent maintenance to operate efficiently, which impacts costs and operational continuity, as any failure could compromise the controlled environment needed for grain preservation [16,22,23].
Therefore, post-harvest management practices favor using immediate outdoor air in aeration systems, which offers both advantages and disadvantages depending on environmental conditions and specific storage needs. Using outdoor air lowers operating costs because it does not require pre-treatment such as artificial heating or cooling. Additionally, systems relying on ambient air are generally simpler, easier to install, and easier to maintain. In climates with favorable environmental conditions, this strategy can be energy-efficient and highly beneficial [23]. However, the effectiveness of outdoor air aeration is directly influenced by local weather conditions [17,24,25,26]. In regions with high humidity or extreme temperatures, outdoor air may introduce excess moisture or heat, which can worsen rather than improve storage conditions. Moreover, climate variability can make this method less reliable, as ideal aeration conditions might be limited or unpredictable.
Due to this, the objective of this study is to use Computational Fluid Dynamics (CFD) as an engineering tool to optimize aeration processes during grain storage, precisely identifying the most suitable aeration periods and optimal conditions to maximize effectiveness [5,17,18,22,23,27]. The use of CFD is crucial for understanding how external temperatures influence grain temperature and relative humidity inside the silo at different times of the day. Additionally, CFD allows for predicting heat and moisture buildup and the potential formation of zones conducive to fungal and insect development, enabling proper management to maintain safe storage conditions.
Computational Fluid Dynamics (CFD) in grain storage provides a rigorous engineering approach to optimize aeration through transport phenomena. This tool is essential for preventing grain spoilage, as it helps create a controlled environment that reduces conditions favorable for spoilage agents, thereby maintaining the quality and safety of stored grain.

2. Materials and Methods

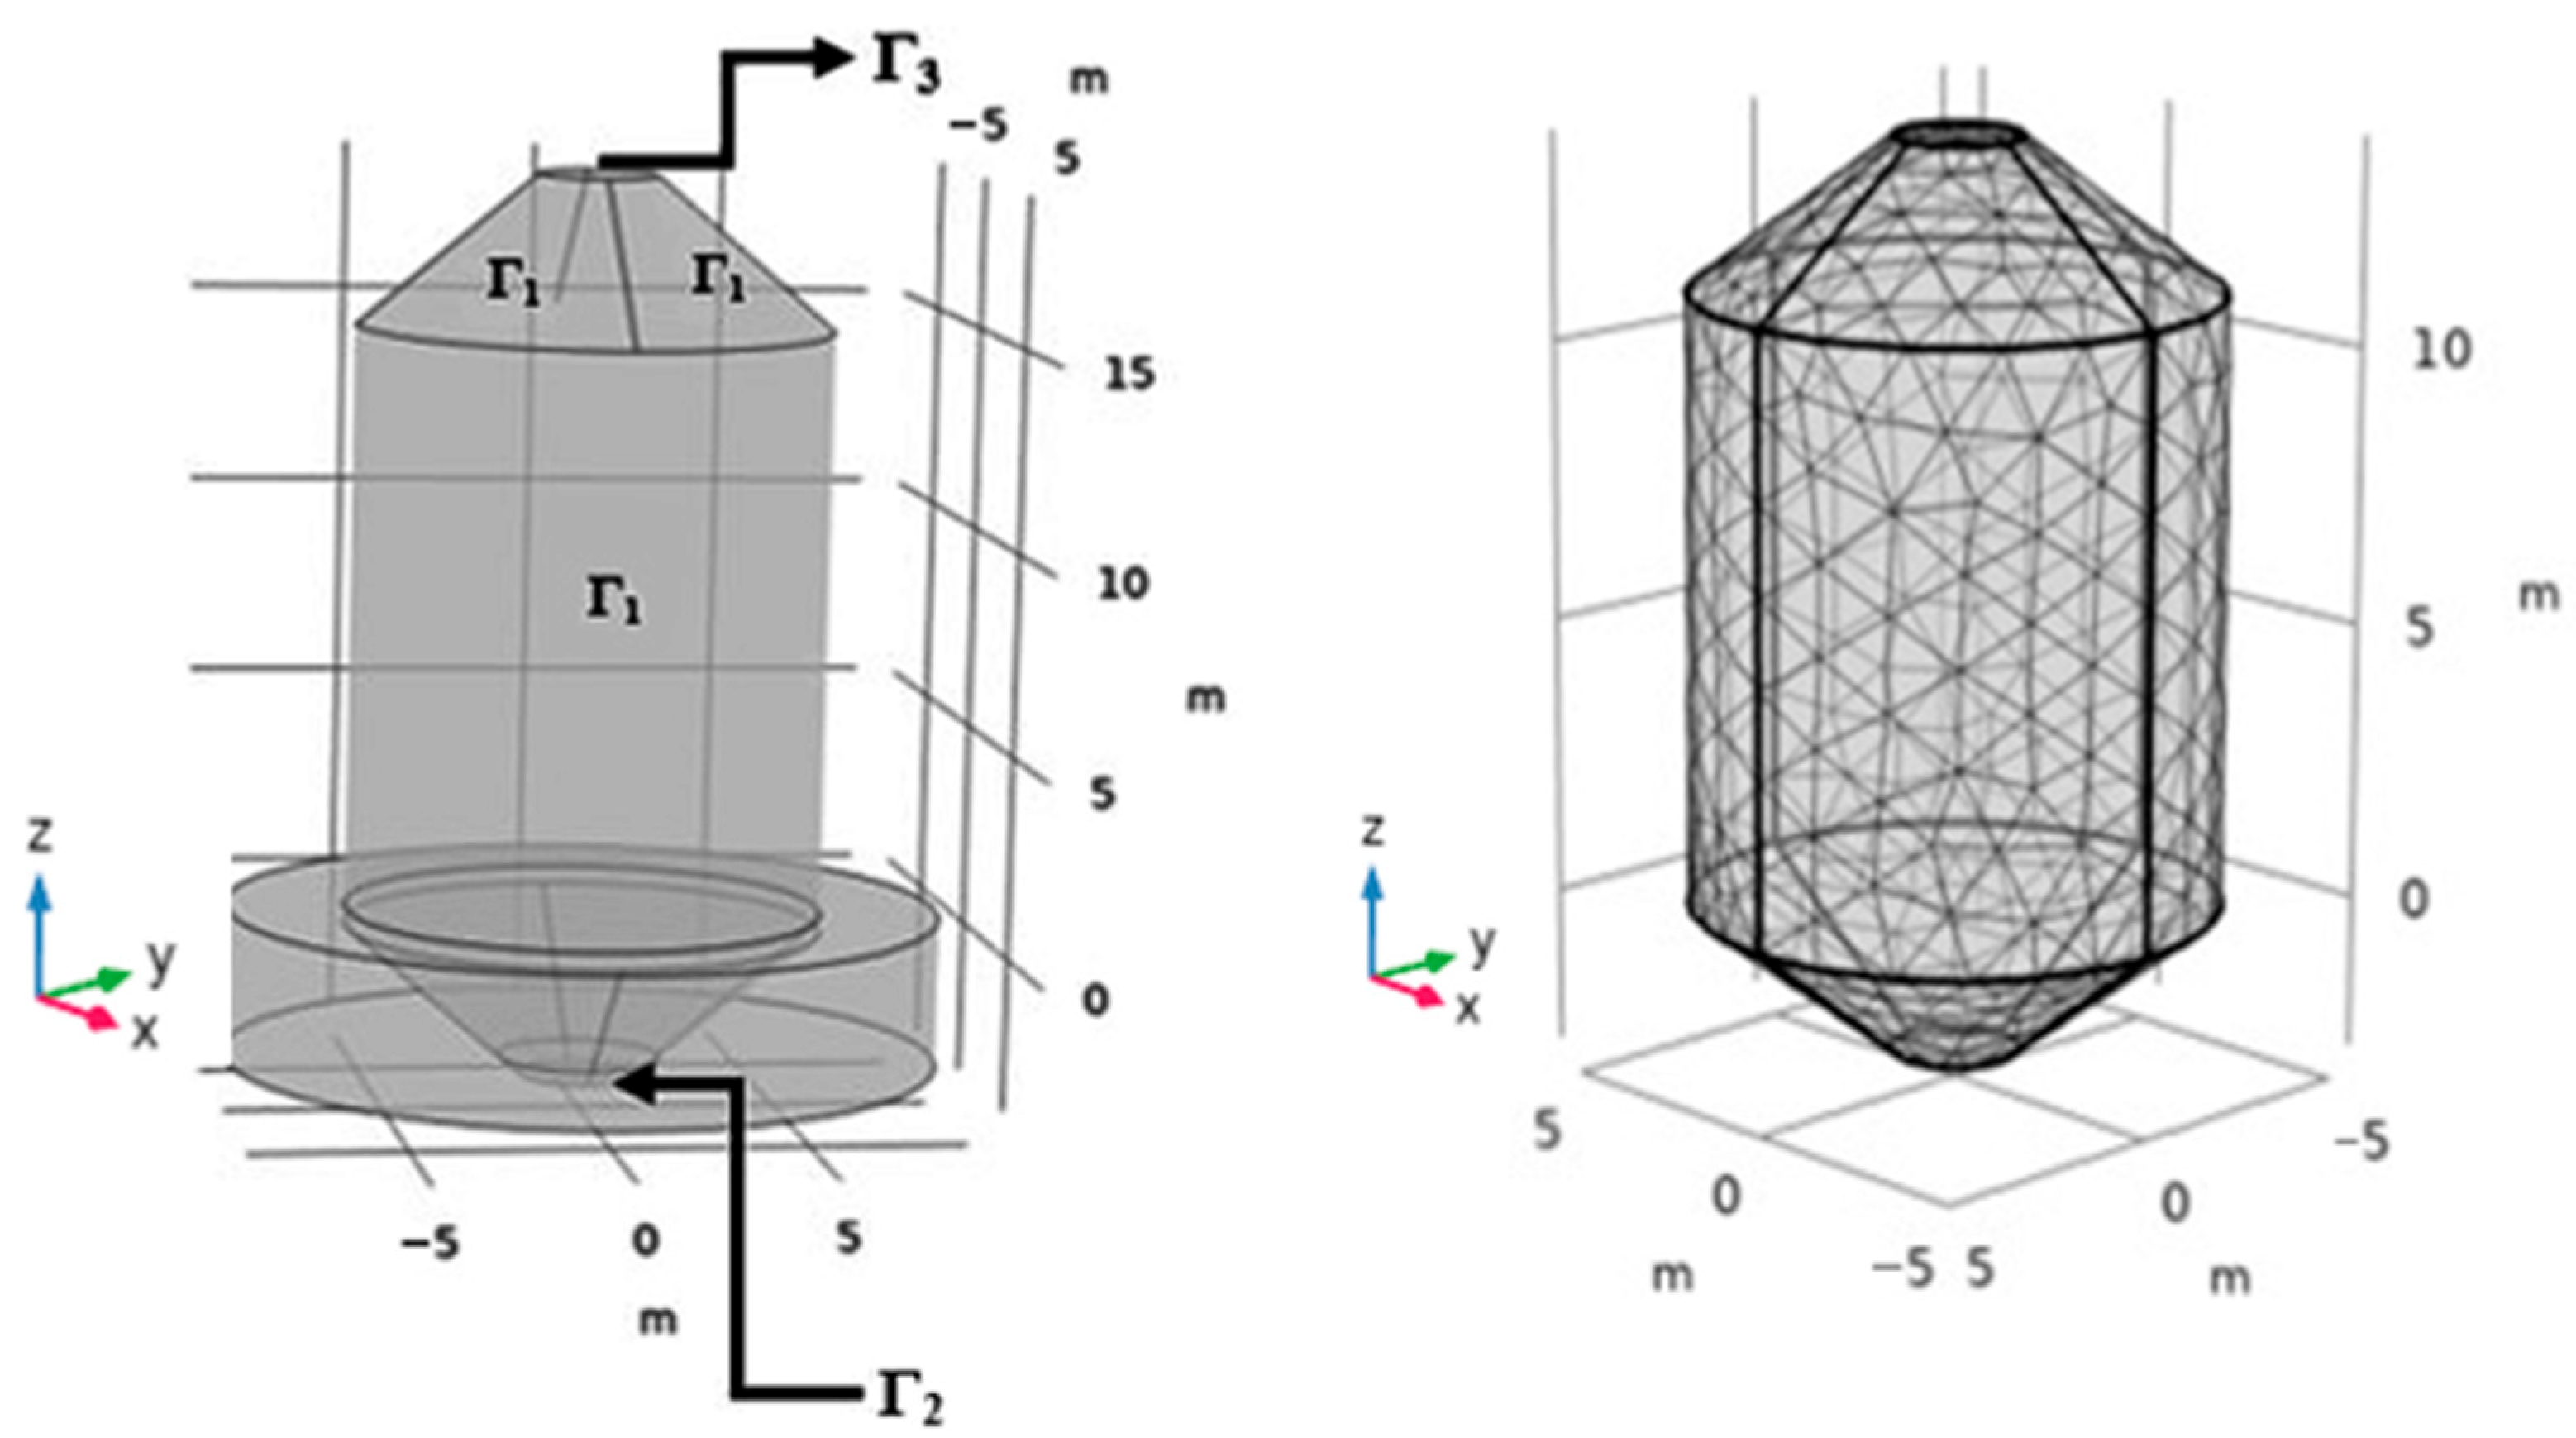
This study analyzes a cylindrical galvanized steel silo with a conical roof and floor, featuring a radius of 5 m and a total height of 11 m. Both the roof and the conical floor each make up one-quarter of the total height. The floor is below ground level and insulated from temperature variations and solar radiation. The silo is situated in the Bajío region, specifically in Cupareo, Salvatierra Municipality, Guanajuato, Mexico. It has a capacity of 1250 tons of corn, and its strategic location near farmland allows producers to harvest at the optimal time, avoiding transportation delays or congestion issues at more distant storage sites. Figure 1 shows the external and internal structure of the silo, while Figure 2 displays the computational domain used for the three-dimensional model.

2.1. Mathematical Model

The equations governing transport processes in a grain-filled silo include the continuity, momentum, energy, and mass equations. By applying microscopic balances to the discontinuous phase ω (grain) and the continuous phase γ (interstitial air), the equations for an effective medium are derived [28,29].
Continuity equation:
ρ γ · u γ = 0
Momentum equation (Darcy’s Law with Brinkman extension):
ρ γ ε u γ t + u γ · u γ = · P I + μ u γ + u γ T μ κ 1 u + g ρ γ
Energy equation:
ρ c p γ T t + u γ · T = k e f f 2 T γ + Q 0 λ v k y ρ γ a v Y Y i
Mass equation for grain moisture:
ρ ω c ω t = D 1 2 c ω + P 0 k y ρ γ a v Y i Y
Mass equation for air humidity:
ρ γ c γ t + u γ · c β = D 2 2 c γ + k y a v Y i Y
Table 1 shows the description of the variables used in the mathematical model.
It is also important to note that the model equations were solved under transient conditions, such as time-dependent partial differential equations. To represent the month of January, a time step of one hour was used, starting the simulation at 00:00 and running for 744 h, with the same method applied for May. This approach enabled the analysis of day-night variations in temperature and solar radiation and their impact on heat and moisture generation during storage.
The model represented by Equations (1)–(5) was used to analyze grain storage during periods with and without aeration. In this model, Equation (1) represents mass conservation within the control volume for an incompressible fluid, meaning there are no significant volumetric changes in the fluid due to pressure or temperature, and density is considered constant except in the body force term, which includes the combined effect of buoyancy forces due to temperature and concentration gradients. This results in the phenomenon known as double diffusion ρ γ = ρ 0 1 β T T 0 β c C C 0 [28]. It is also important to mention that, although grain permeability is on the order of κ ~ 10 8 , Darcy equation is unsuitable for describing the flow during aeration periods and must be corrected using the Brinkman extension. The Brinkman extension modifies Darcy equation to include the effect of viscous stresses, allowing for the description of complex flows in porous media. The Darcy-Brinkman equation combines elements of Darcy law and Navier–Stokes equations, ensuring that Darcy equation remains valid for low-velocity porous media flows (natural convection). Meanwhile, Brinkman equation incorporates viscous effects μ κ 1 u and better approximates the behavior of free fluid. In the limit κ , the Navier–Stokes equations are recovered. Equation (3), which represents the energy balance, includes heat generation from grain metabolic respiration as a function of grain temperature and moisture content. The last term considers water vapor generation from glucose metabolism, contributing to increased interstitial air relative humidity. Equation (4) represents the moisture balance in the grain, where like the energy equation, the last two terms account for water production due to metabolic processes as a function of respiration heat. The final term represents a source or sink of water vapor, considering the sorption equilibrium between grain and air. Finally, Equation (5) represents the moisture balance in interstitial air, where the last term accounts for moisture input from grain respiration and metabolic processes. These mathematical relationships are presented in Table 2, some of which were obtained through nonlinear regression of experimental measurements [28,30]. Jiménez-Islas et al. [28] and Quemada Villagómez et al. [31] presented a detailed derivation of this model.
Table 2 summarizes the physical and thermal properties used in the model, including key thermodynamic and empirical functions. Air density ρ γ is calculated using the Boussinesq approximation, accounting for variations in temperature T and concentration C relative to reference values T 0   and C 0 , through thermal and concentration expansion coefficients β and β c . The term Q 0   represents the metabolic heat generation rate in the grain, as a function of moisture content, temperature T, and time t, modeled using nonlinear exponential and hyperbolic tangent functions. Water vapor generation from respiration, denoted as P 0 , is directly proportional to Q 0 . The sorption isotherm a w defines the relationship between water activity and temperature. The water vapor saturation pressure P V 0   is calculated using an empirical logarithmic expression, while the equilibrium moisture at the grain–air interface Y i depends on P V 0 , the total pressure P. These parameters enable accurate modeling of heat and mass transfer processes inside the silo. Jiménez-Islas et al. [28] and Quemada Villagómez et al. [31] presented a detailed derivation of this model.
Table 3 shows the description of variables previously used.
In both cases, the silo is assumed to be filled with corn kernels, with an initial moisture content X0 (kg of water per kg of dry solid) and interstitial spaces saturated with air, which has an initial absolute humidity Y0 (kg of water per kg of dry air) and an initial dry-bulb temperature T0. The stored grain is also considered an isotropic porous medium, saturated with a Newtonian fluid, and possessing effective transport properties. Table 4 shows the thermodynamic properties of corn and air used in the simulations. The validation of the mathematical model is provided in Appendix A.

2.2. Boundary Conditions for the Transfer

The boundary conditions include the interfacial resistance between the ambient temperature and the silo walls, as well as the incident solar radiation on the structure. Therefore, ambient temperature and solar radiation are time-dependent. For the simulations with and without aeration, January and May were selected as representative months because they correspond to temperature extremes in the Guanajuato/Bajío region of Mexico. January is typically the coldest month, with average temperatures ranging from 5 °C to 15 °C. Additionally, the solar radiation intensity during this month is lower, which reduces silo heating and promotes natural cooling. This helps decrease biological activity and the grain respiration rate effectively. In contrast, May is among the warmest months, with average temperatures between 25 °C and 35 °C. During this period, solar radiation is more intense, heating the exposed silo surface and increasing the need for heat management to prevent grain deterioration. Figure 3 shows the recorded average maximum and minimum temperatures throughout the year. The data display the minimum and maximum temperatures and the solar radiation intensity during these months. These contrasting environmental conditions allow us to assess the effectiveness of aeration under cold and warm conditions, providing insights for optimal grain storage strategies at different times of the year.
For these reasons, Equation (3) is associated with the following initial and boundary conditions:
T r , z , θ , t = 0 = T 0 r , z , θ
1 k w T n = h w T T a m b + ξ c σ T 4 T s k y 4 a G
Equation (7) describes the boundary condition, which accounts for natural convection between the silo walls and the ambient temperature. It also considers the steel’s emissivity, which enables heat dissipation during colder hours, and the steel’s absorptivity, which determines how much solar radiation is absorbed by the silo and converted into heat [33,34,35].
A high absorptivity means the silo retains more heat, increasing the internal temperature. In contrast, steel with a high emissivity can dissipate heat more efficiently into the environment, helping to reduce internal temperatures, particularly at night. Table 5 presents the expressions and values for these heat and mass transfer parameters.

2.3. Boundary Conditions for the Aeration Process

Aeration in silos is crucial for maintaining optimal conditions during grain storage. Air inlets in silos are essential components of the aeration process. They are designed with specific shapes and sizes, such as rectangular and circular vents, allowing for controlled and uniform airflow, facilitating gradual cooling or drying of the grain mass.
Considering the design of the aeration system in the conical-bottom silo shown in Figure 1, the bottom section includes a circular duct with a 45 cm radius located at the center of the cone, along with three perforated grates measuring 8 cm in width and 220 cm in length. The airflow analysis focuses solely on the circular duct, the primary and dominant airflow path due to its central position. Therefore, the lateral grates are not included in this study, since their contribution to the total airflow is less than that of the central circular duct. These considerations ensure that flow air enters at a controlled velocity and with ambient conditions, such as external temperature and relative humidity [11,18,22]. Additionally, the inlet airflow through the duct is assumed to have a uniform and fully developed profile, depending only on the spatial coordinates (r, θ). It is also assumed that the airflow is fully developed, allowing turbulence to be neglected (laminar flow). This assumption is reasonable for moderate-velocity flows, simplifying the model by avoiding the complexity of turbulence calculations. These considerations establish the initial and boundary conditions, considering aeration periods.
T r , θ , t = 0 = T a m b r , θ c 1 r , θ , t = 0 = x a m b r , θ u r , θ , t = 0 = u ¯ r , θ
2 T = T a m b f r , θ ;   c 1 = x a m b f r , θ ; u = u ¯ f r , θ
3 T n = c 1 n = u ¯ n = 0

2.4. Numerical Solution

The numerical solution of the system described by Equations (1)–(9), along with their initial and boundary conditions, was performed using CFD software COMSOL Multiphysics® version 5.4. COMSOL enables the definition and simulation of the model outlined earlier, which is based on a system of PDEs that captures the complex physical and biochemical processes occurring during grain storage in silos, both with and without aeration. The model considers the behavior of the air mass, velocity components, energy balance, moisture content, and environmental boundary conditions. The following section provides a general overview of how COMSOL facilitates the implementation of each equation and model setup.
Stored grain can be modeled as an isotropic porous medium using the Porous Media Flow module in COMSOL, where the effective transport properties are defined. This approach enables the representation of both the discontinuous phase ω and the continuous phase γ through weighted averages, utilizing thermodynamic property data for the solid (grain) and the fluid (air). These definitions are essential for simulating heat and mass transfer. The mass conservation equations for air and the velocity components in three dimensions (r, θ, z) are implemented in the Fluid Flow modules of COMSOL. The momentum equation, which incorporates Darcy’s law and the Brinkman extension, is used to simulate the behavior of interstitial airflow, adjusting for the permeability and porosity of the grain. Regarding the energy balance, which considers both heat generated from grain respiration and the energy needed for water evaporation within the grain mass, it is defined in the Heat Transfer module. COMSOL allows for the inclusion of specific source terms that represent temperature-dependent metabolic heat and an evaporation term, which can be configured based on the latent heat involved in the phase change of water.
To model moisture content in the grain and air, the Mass Transfer in Porous Media module is used, allowing the inclusion of source terms to represent water production from metabolic processes and the sorption equilibrium between grain and air. For moisture in interstitial air generated by grain respiration, a specific source term can be defined to represent the moisture contribution. Regarding the boundary conditions for Ambient Temperature and Solar Radiation, COMSOL allows for defining boundary conditions, including natural convection between the silo walls and the ambient air, as well as incident solar radiation. The ambient temperature and solar radiation can be configured as functions of geographic location and time, enabling the simulation of day-night variations and the specific conditions of January (cold month) and May (warm month) during storage with and without aeration periods in the Guanajuato/Bajío region of Mexico.
For solving 3D models, COMSOL Multiphysics® uses the finite element method (FEM), which reformulates the system of partial differential equations (PDEs) into their weak form and discretizes the domain into finite elements. This process converts the continuous PDEs into a system of algebraic equations, which are then solved numerically using suitable solvers, such as the Newton–Raphson method for nonlinear systems [36,37].
In the simulation of natural and forced convection in porous media to predict temperature and moisture distribution, the mesh size is a crucial factor that directly affects the accuracy and computational efficiency of the results. Mesh size analysis is a fundamental tool in CFD simulation, especially when modeling natural convection during grain storage, because a coarse mesh (low density) could lead to errors in identifying risk zones within the silo, such as areas where heat and moisture may build up, encouraging the growth of fungi and insects. However, an overly fine mesh involves a greater number of computational elements, which increases both computation time and resource requirements. In large-scale problems like CFD models of grain storage silos, using a very tiny mesh size can make the simulation impractical due to high computational costs. This point is critical because grain storage simulations typically need long-duration runs to analyze how temperature and moisture change over days or months.
For this reason, to ensure that the mesh size used in the CFD simulation of grain storage is optimal and accurately captures temperature and flow gradients without compromising computational time, mesh independence analyses were conducted to predict temperature profiles over a 24-hour storage period, both with and without aeration in the middle section of the silo. The domain discretization was performed with mesh refinement along the silo walls, where the most significant temperature gradients occur, as shown in Figure 2.
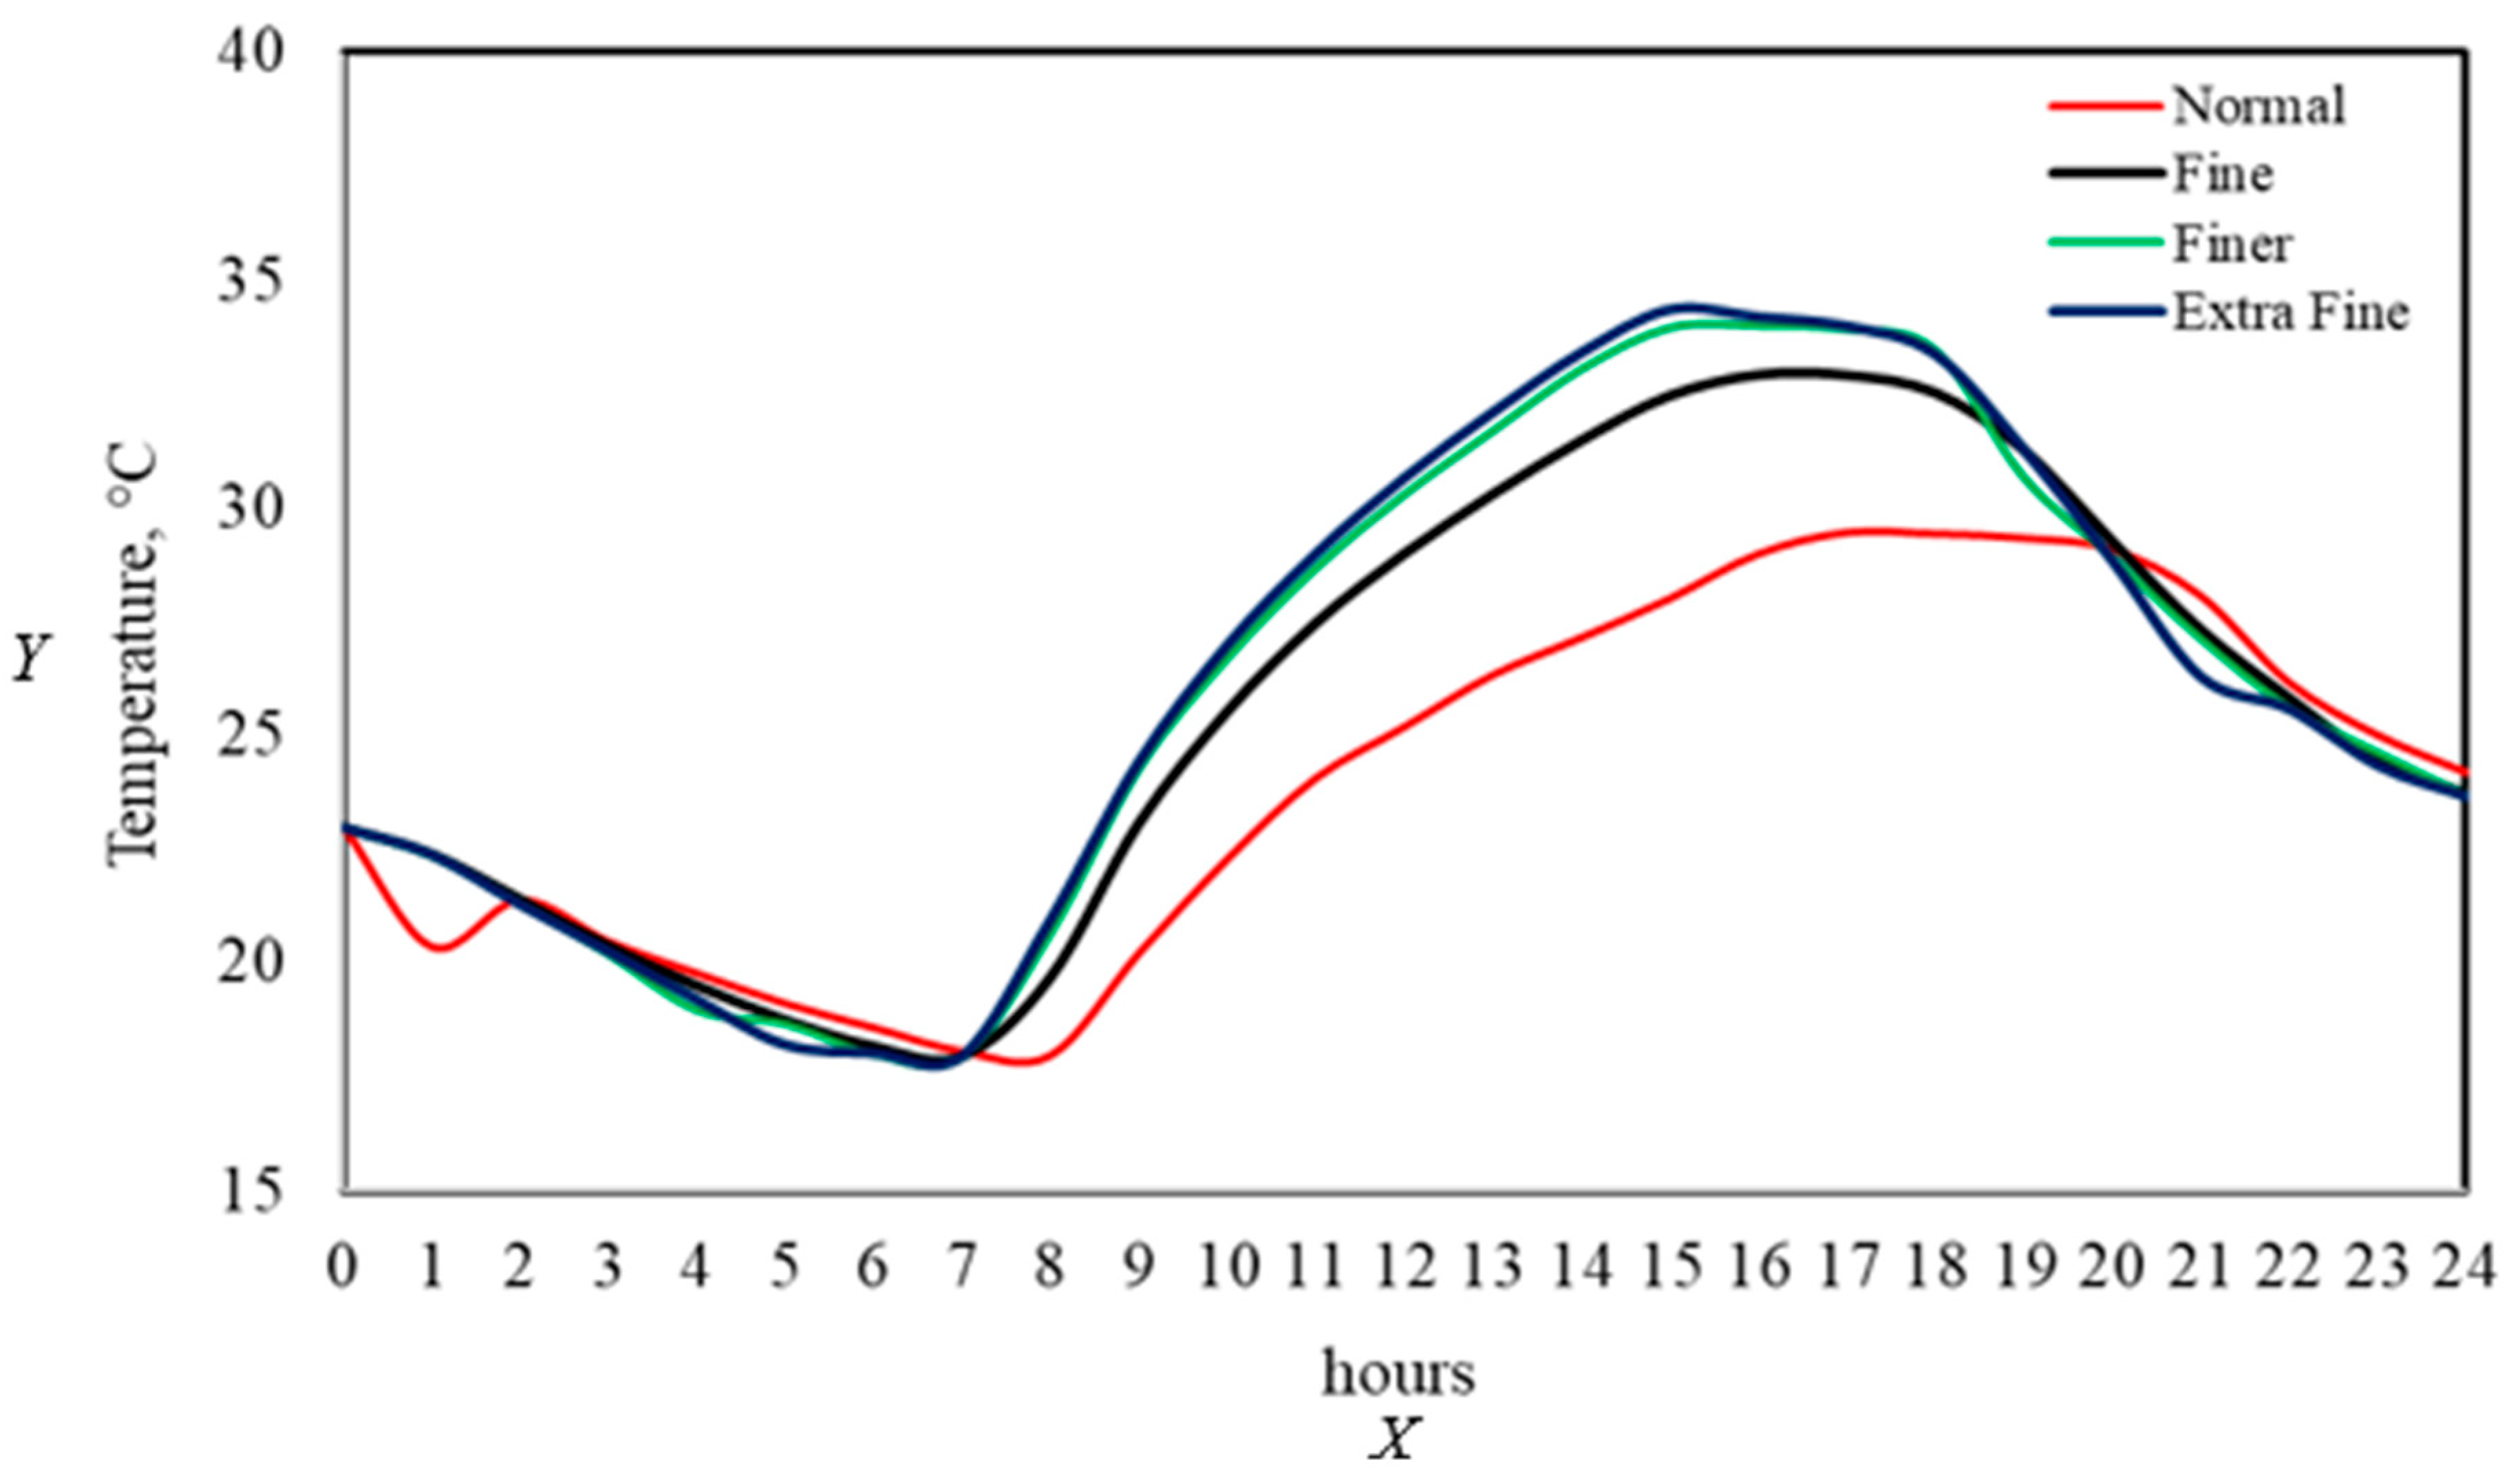
The effect of mesh size was examined to predict temperature profiles without considering aeration periods, as shown in Figure 4. The computational domain was discretized with a fixed number of 23,183 tetrahedral elements inside the silo, while different mesh refinements—ranging from normal, fine, finer, to extra fine—were applied along the silo boundaries. Table 6 displays the total number of elements for each refinement level. The results show that using a normal mesh produces an underestimation of up to 10% in the maximum predicted temperature compared to the fine mesh. The relative error between fine and finer meshes decreases to 3.1%, while the difference between finer and extra fine meshes drops significantly to only 0.48%. These findings suggest that finer and extra fine meshes provide sufficiently accurate temperature predictions. However, due to computational time limits, the simulations in this study used a finer mesh. Additionally, it is important to note that grain temperatures at the silo’s center follow the ambient diurnal and nocturnal temperature variations with a slight delay. This behavior is due to the insulating properties of the grain. It is a widely reported phenomenon in the literature as a typical thermal inertia effect in porous media under transient conditions [11,13,16].
To verify the accuracy of results based on mesh refinement, Table 6 provides a comparative analysis of predicted maximum and minimum temperatures, along with the corresponding computation times, for simulations with and without aeration. In all cases, a fixed number of 23,183 tetrahedral elements were used inside the silo, while the number of boundary elements (NEB) varied according to the refinement level. The table shows that, under non-aerated conditions, using a standard mesh results in a significant underestimation of the maximum temperature, with differences close to 5 °C compared to more refined meshes. This discrepancy is due to coarse meshes’ inability to accurately capture thermal gradients near the silo walls, where temperature variations caused by solar radiation and ambient exposure are more significant. Conversely, the difference between the finer and extra-fine meshes is less than 1%, indicating both meshes provide sufficient resolution of temperature gradients during storage and produce comparable results in predicting the system’s thermal behavior. Additionally, the predicted minimum temperatures remain practically constant across different mesh sizes. This behavior suggests that the estimation of the lowest temperature values—typically located in areas less exposed to radiation or near the silo’s center—is not heavily affected by the refinement level. This is because the thermal conditions in these regions change more slowly and exhibit smoother gradients, which can be effectively captured even with a coarser discretization.
Table 6 also presents the predicted maximum and minimum temperatures during periods with aeration, as a function of the number of elements applied along the silo boundaries. Unlike the non-aerated case, the results show that the difference in maximum temperature between the normal and extra fine mesh is only 0.088 °C. In comparison, the difference in minimum temperature reaches a maximum of 0.594 °C. This behavior can be attributed to the fact that aeration interrupts the progressive accumulation of heat inside the silo by reducing the metabolic activity of the grain and limiting the development of pronounced thermal gradients. By promoting continuous renewal of the interstitial air, aeration homogenizes the temperature field, allowing even less refined meshes to capture the overall thermal behavior of the system adequately. In this sense, the effect of mesh size on temperature prediction becomes less critical when aeration strategies are applied, reinforcing the model’s efficiency under dynamic cooling conditions.
In addition to the temperature analysis, Table 6 shows the computational times required for each mesh size under non-aerated and aerated conditions. As observed, increasing the number of elements along the boundaries significantly increases simulation time. For instance, in the case without aeration, the extra fine mesh required over 68 min, whereas the finer mesh reduced this time to approximately 45 min without compromising the accuracy of the predicted maximum and minimum temperatures. A similar trend was observed for the aerated case, with the computational time for the finer mesh being 33 min compared to 57 min required by the extra fine mesh.
Considering these aspects of computational efficiency and based on the minimal relative errors observed, the finer mesh was selected for all simulations without aeration. The aeration simulations also used the same finer mesh to ensure a direct and consistent comparison between both conditions (with and without aeration).
Finally, it is important to mention that all simulations were conducted using COMSOL Multiphysics® version 5.4, installed on a personal computer with a 13th Gen Intel® CoreTM i5-13450HX 2.40 GHz processor, 8 GB of RAM, and Windows 11 Home.

3. Results

The mathematical model was used to analyze temperature and moisture changes in stored corn in Guanajuato state, Mexico, specifically in the Bajío agricultural region, during 2023. For this purpose, temperature and solar radiation data preloaded in the libraries of COMSOL Multiphysics® software were utilized. These data compile meteorological information from the American Society of Heating, Refrigerating, and Air-Conditioning Engineers (ASHRAE), including temperature, relative humidity, wind speed, solar radiation, and other relevant climatic parameters.
The simulations started on 1 January at 00:00 h and continued for 31 days. Subsequently, simulations were conducted for May, starting 1 May at 00:00 h and ending 31 May. Simulations were performed with and without aeration periods to analyze the effect of aeration on storage conditions. These simulations allow for an evaluation of how aeration influences temperature and interstitial relative humidity inside the silo, under the characteristic climatic conditions of each month. The mathematical model was used to study the variation in temperature, moisture, and natural and forced convection due to climatic variations in stored corn in Guanajuato, particularly in the agricultural region of Bajío, for 2023. This study employed temperature and solar radiation averages preloaded in the libraries of the specialized software COMSOL Multiphysics®, which compiles meteorological data from the American Society of Heating, Refrigerating, and Air-Conditioning Engineers (ASHRAE). The dataset includes temperature, relative humidity, wind speed, solar radiation, and other relevant climatic data [29].
The simulations began on 1 January at 12:00 a.m. and lasted for 31 days. Then, simulations were carried out for May, starting 1 May at 12:00 a.m. and ending 31 May. These simulations aimed to analyze the impact of aeration during January and May, considering storage periods with and without aeration. They provide an assessment of how aeration affects temperature and interstitial relative humidity inside the silo under the typical climate conditions of each month.

3.1. Temperature Distribution in January Without Aeration

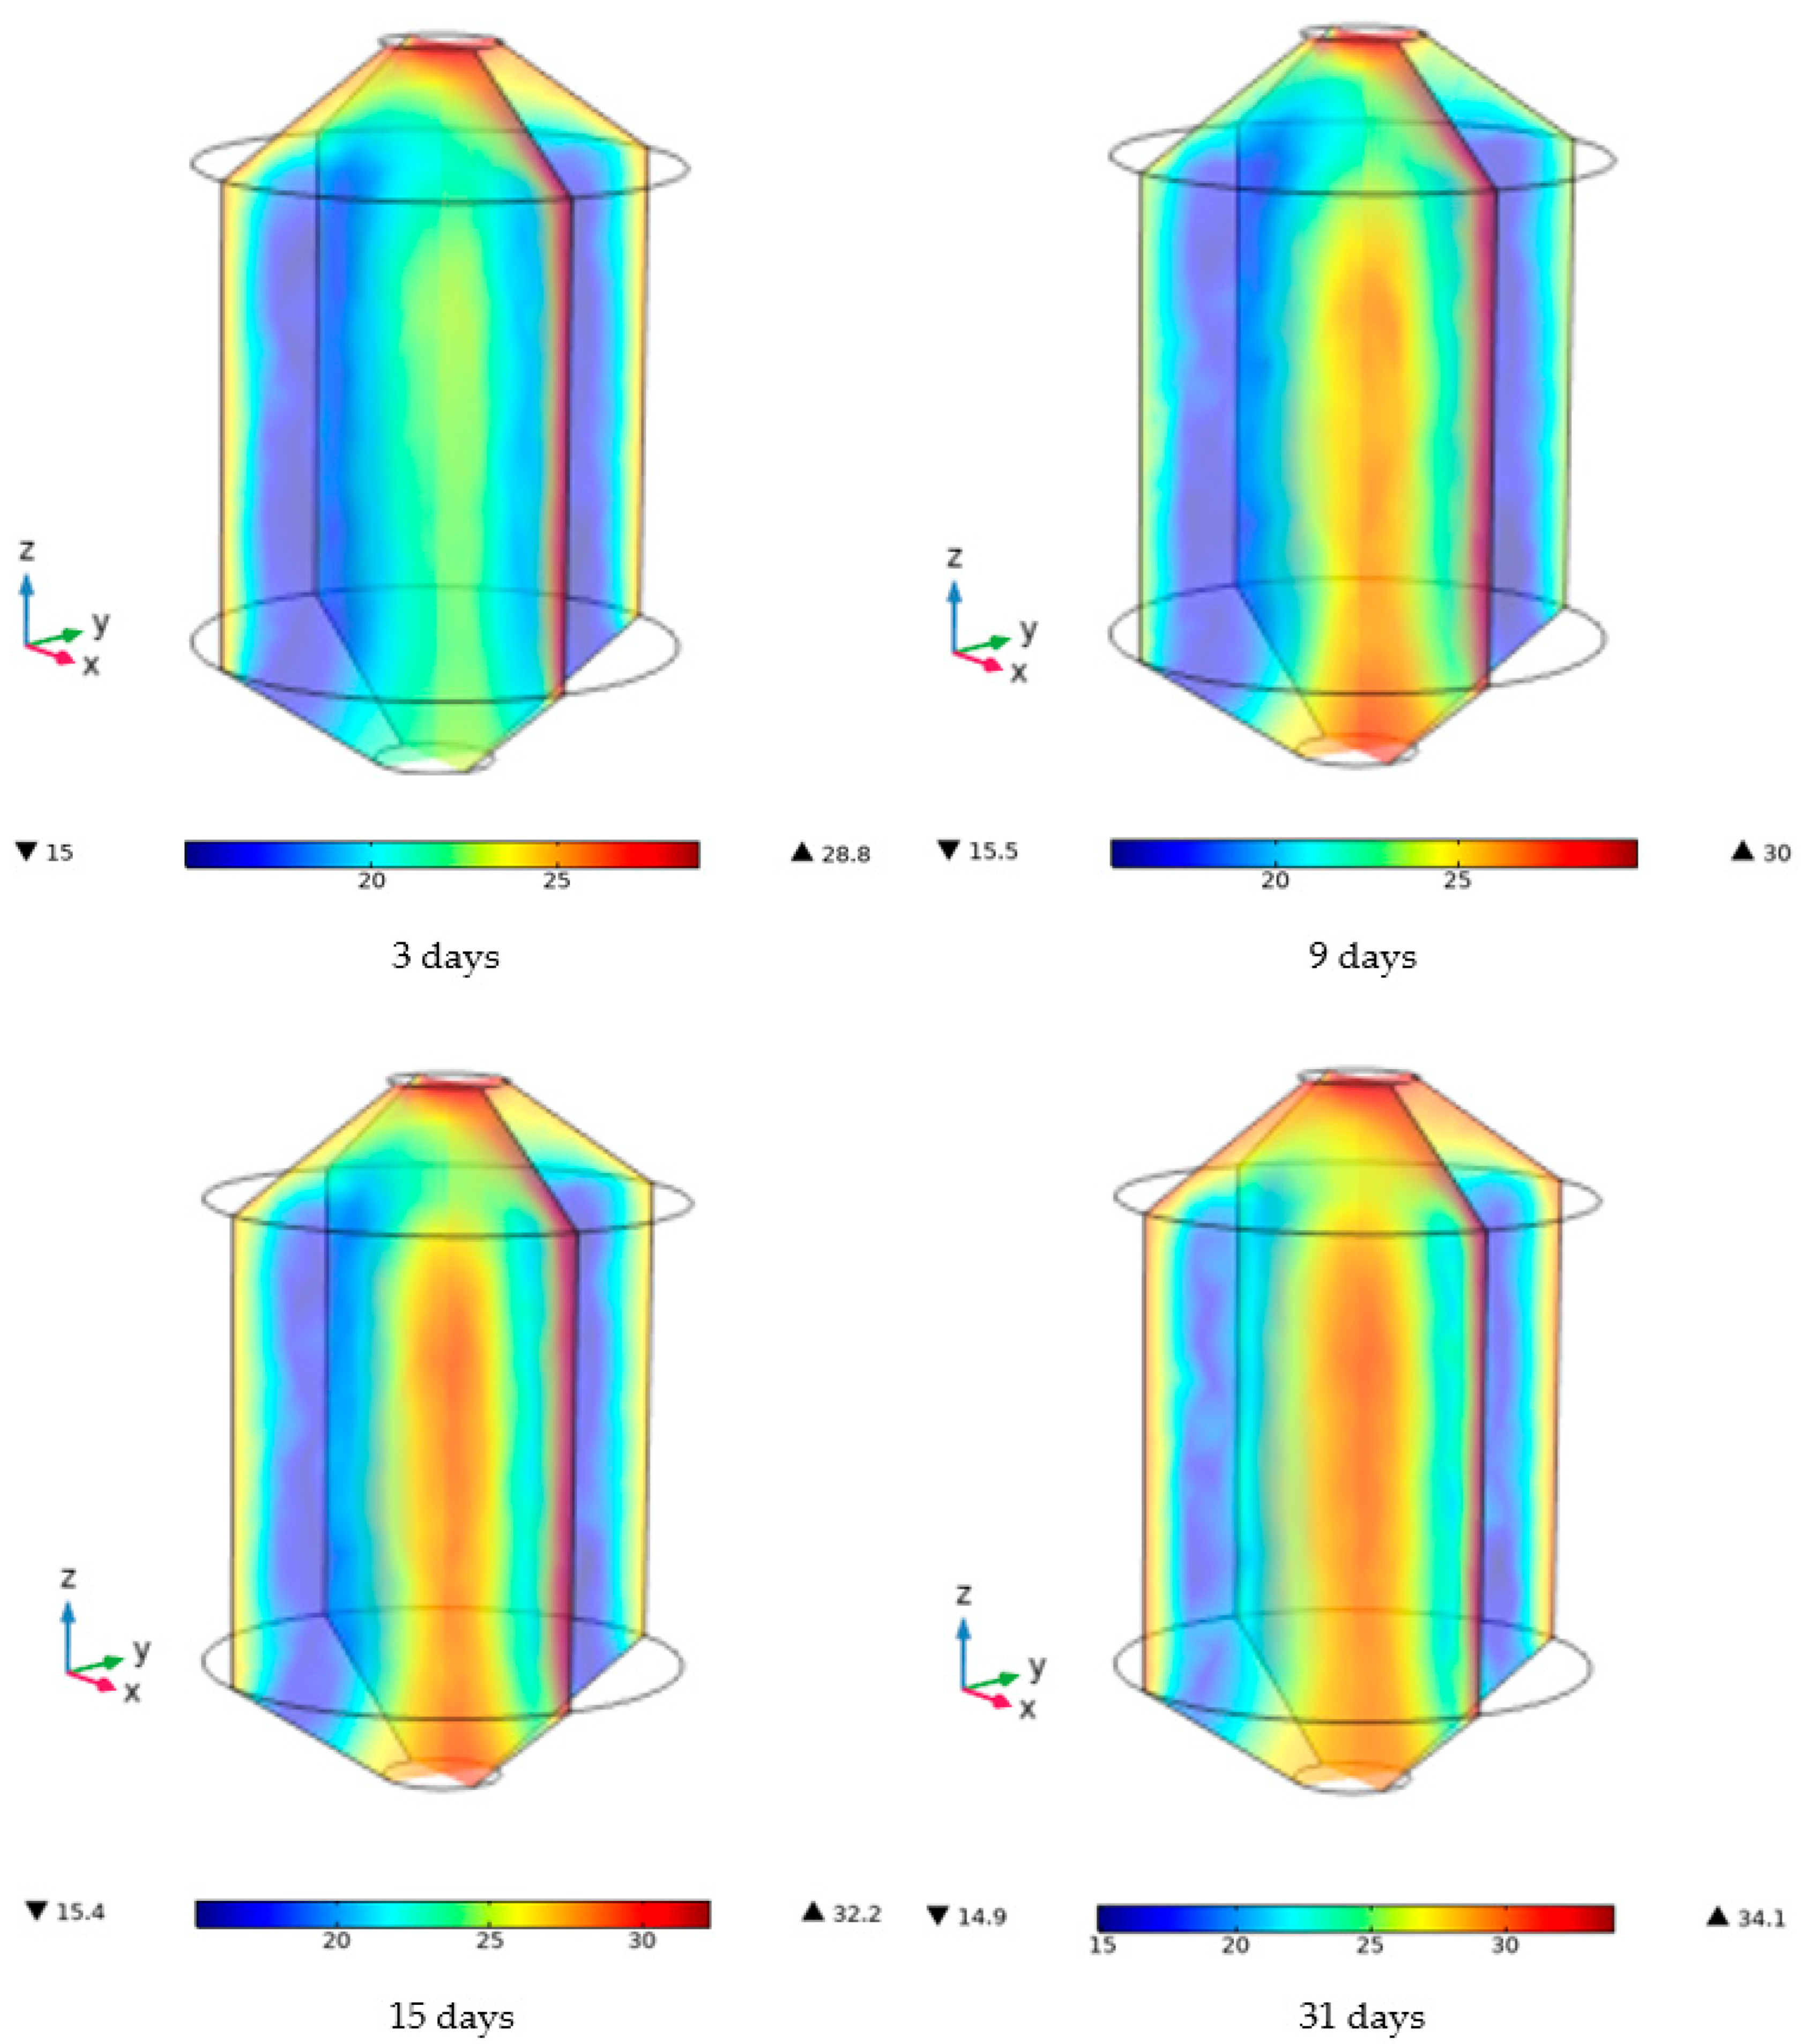
Figure 5 displays the temperature contours for January during a 31-day storage period without aeration. In Guanajuato during this month, minimum temperatures often drop significantly, especially at night and early morning, reaching between 8 °C and 12 °C in the Bajío region. Meanwhile, solar radiation intensity is lower during this time, resulting in less heating of exposed surfaces like roofs and silo walls. In the initial three days of storage, temperatures inside the silo range from 7 °C in the coldest areas (shown in blue) to 18 °C in the warmest areas (shown in red). This thermal gradient extends from a warmer top region (conical roof) toward an intermediate zone, with higher temperatures along the walls. Solar radiation and the walls’ absorption properties cause grain layers near the walls to absorb and retain more heat, increasing wall temperatures and the temperature of the grain in contact with these surfaces. This temperature difference can generate internal airflow, which helps distribute heat but may also create hot spots. By the ninth day, a hot zone begins to form along the axial axis, starting at the bottom, indicating limited heat dissipation in the central part of the silo. Due to the low thermal conductivity of the grain, this central zone acts as a heat accumulation area, trapping heat produced by grain respiration [21]. Grain respiration, a continuous heat source especially in long-term storage [19,31,32,38], causes heat to build up in areas with minimal airflow, like the center. Over time, temperatures increase, particularly in insulated zones such as the conical bottom, trapping heat in the lower part and allowing it to rise toward the center [5,39]. By the 15th day, the hot zone along the axial axis and at the base has intensified compared to day 9’s temperature contour, showing ongoing heat buildup. Grain respiration concentrates heat in the central axis and base, where heat transfer is limited. As storage continues, metabolic heat does not dissipate effectively, raising temperatures further in these zones. By the end of January (31 days), heat from grain respiration has accumulated at the silo’s center, significantly increasing temperatures in this area. Without natural heat dissipation, this results in a persistent hot zone, raising temperatures over time and forming a hot core reaching 20 °C. The grain stored at the center and bottom is now at risk [20,32,40]. Although these temperatures are moderate, they accelerate grain respiration, further increasing heat levels and creating conditions ideal for fungal and insect development.
These initial results highlight the influence of silo geometry and material properties on internal temperature distribution. Natural convection conditions, combined with solar radiation and the absorptivity and emissivity properties of the steel, create significant temperature variations in the stored grain [16,21,33]. This internal temperature gradient, particularly in sun-exposed zones and the insulated conical bottom, must be considered when designing aeration strategies to ensure safe storage conditions, minimizing the risk of fungal and insect development due to high temperatures and moisture accumulation.

3.2. Temperature Distribution in May Without Aeration

Figure 6 shows the temperature contours during storage in May. During this month, the highest temperatures are typically documented in Guanajuato, Mexico. May indicates the end of the dry season and the beginning of summer, just before the rainy season starts. At the beginning of storage dynamics for this month, during the first three days, an intensification of the hot core in the center of the silo can be observed, like what developed in January. The temperature in this central core reaches up to 24.4 °C, representing a significant increase compared to the temperatures observed in January [16,20,32]. Regarding the silo walls exposed to solar radiation, their temperature fluctuations follow ambient temperature variations directly through natural convection with the surrounding air, maintaining moderately high temperatures [16,31]. For the temperature contours corresponding to nine days of storage in May, an intensification of the hot core in the center of the silo is observed, with temperatures approaching 27 °C. This hot zone is notably warmer than the rest of the silo, due to progressive heat accumulation from grain respiration and limited heat dissipation to the exterior. Continuing with the storage dynamics, the temperature contour corresponding to 15 days of storage in May shows that the hot core in the center of the silo has reached temperatures up to 28 °C. This increase in core temperature indicates that heat generated via grain respiration accumulates quickly and that thermal dissipation in this zone is insufficient. In contrast, grains near the silo walls exhibit temperatures that follow environmental and solar radiation fluctuations, indicating that, although the walls are exposed to temperature variations due to external conditions, these zones do not reach the critical temperatures observed in the central core [13,21]. However, these fluctuations can also impact grain quality, especially during the warmest hours of the day, due to direct solar radiation.
By the end of the month, after 31 days of storage, the hot core in the center of the silo has reached maximum temperatures of up to 34 °C [14,21]. This high temperature in the central core has now become dominant throughout the silo, posing a critical risk to grain storage. The accumulation of heat over the month, caused by grain respiration and limited heat dissipation in the core, combined with the warm temperatures of May, has resulted in this continuous increase, reaching unfavorable values for safe grain storage [16,18].
This persistent temperature rise can accelerate grain metabolic activity, producing even more heat and creating a cycle that increases the risk of fungal and insect proliferation. For this reason, it is essential to implement aeration strategies in the central core to reduce temperature in this critical zone.
Based on the predicted temperatures for corn storage during January and May, considering periods without aeration, ideal conditions for developing fungi and insects are observed, as shown in Table 7 and Table 8, where temperature and interstitial relative humidity conditions for insect and fungal development are presented. These tables clearly show that the predicted temperatures in both storage periods exceed, in several cases, the safe ranges needed to prevent the proliferation of these pests. For example, insects that affect grain storage, such as weevils and beetles, thrive in temperatures between 25 and 32 °C, providing ideal conditions for reproduction [17]. The temperatures observed in May are particularly favorable for the rapid reproductive cycle of these insects, increasing the risk of infestation and grain deterioration. Additionally, if humidity and heat from grain respiration are not adequately controlled, warm microenvironments could develop further promoting insect proliferation. Regarding fungi, species such as Aspergillus flavus, Aspergillus niger, and Fusarium spp. exhibit optimal growth conditions at 20 to 35 °C [8,41]. During May, the internal temperatures of the silo reached values close to or above 30 °C, particularly in zones near the walls exposed to solar radiation. These conditions not only fall within the optimal range for fungal growth, but when combined with high humidity, they can actively promote the production of hazardous mycotoxins, such as aflatoxins, which compromise the quality and safety of stored grain.
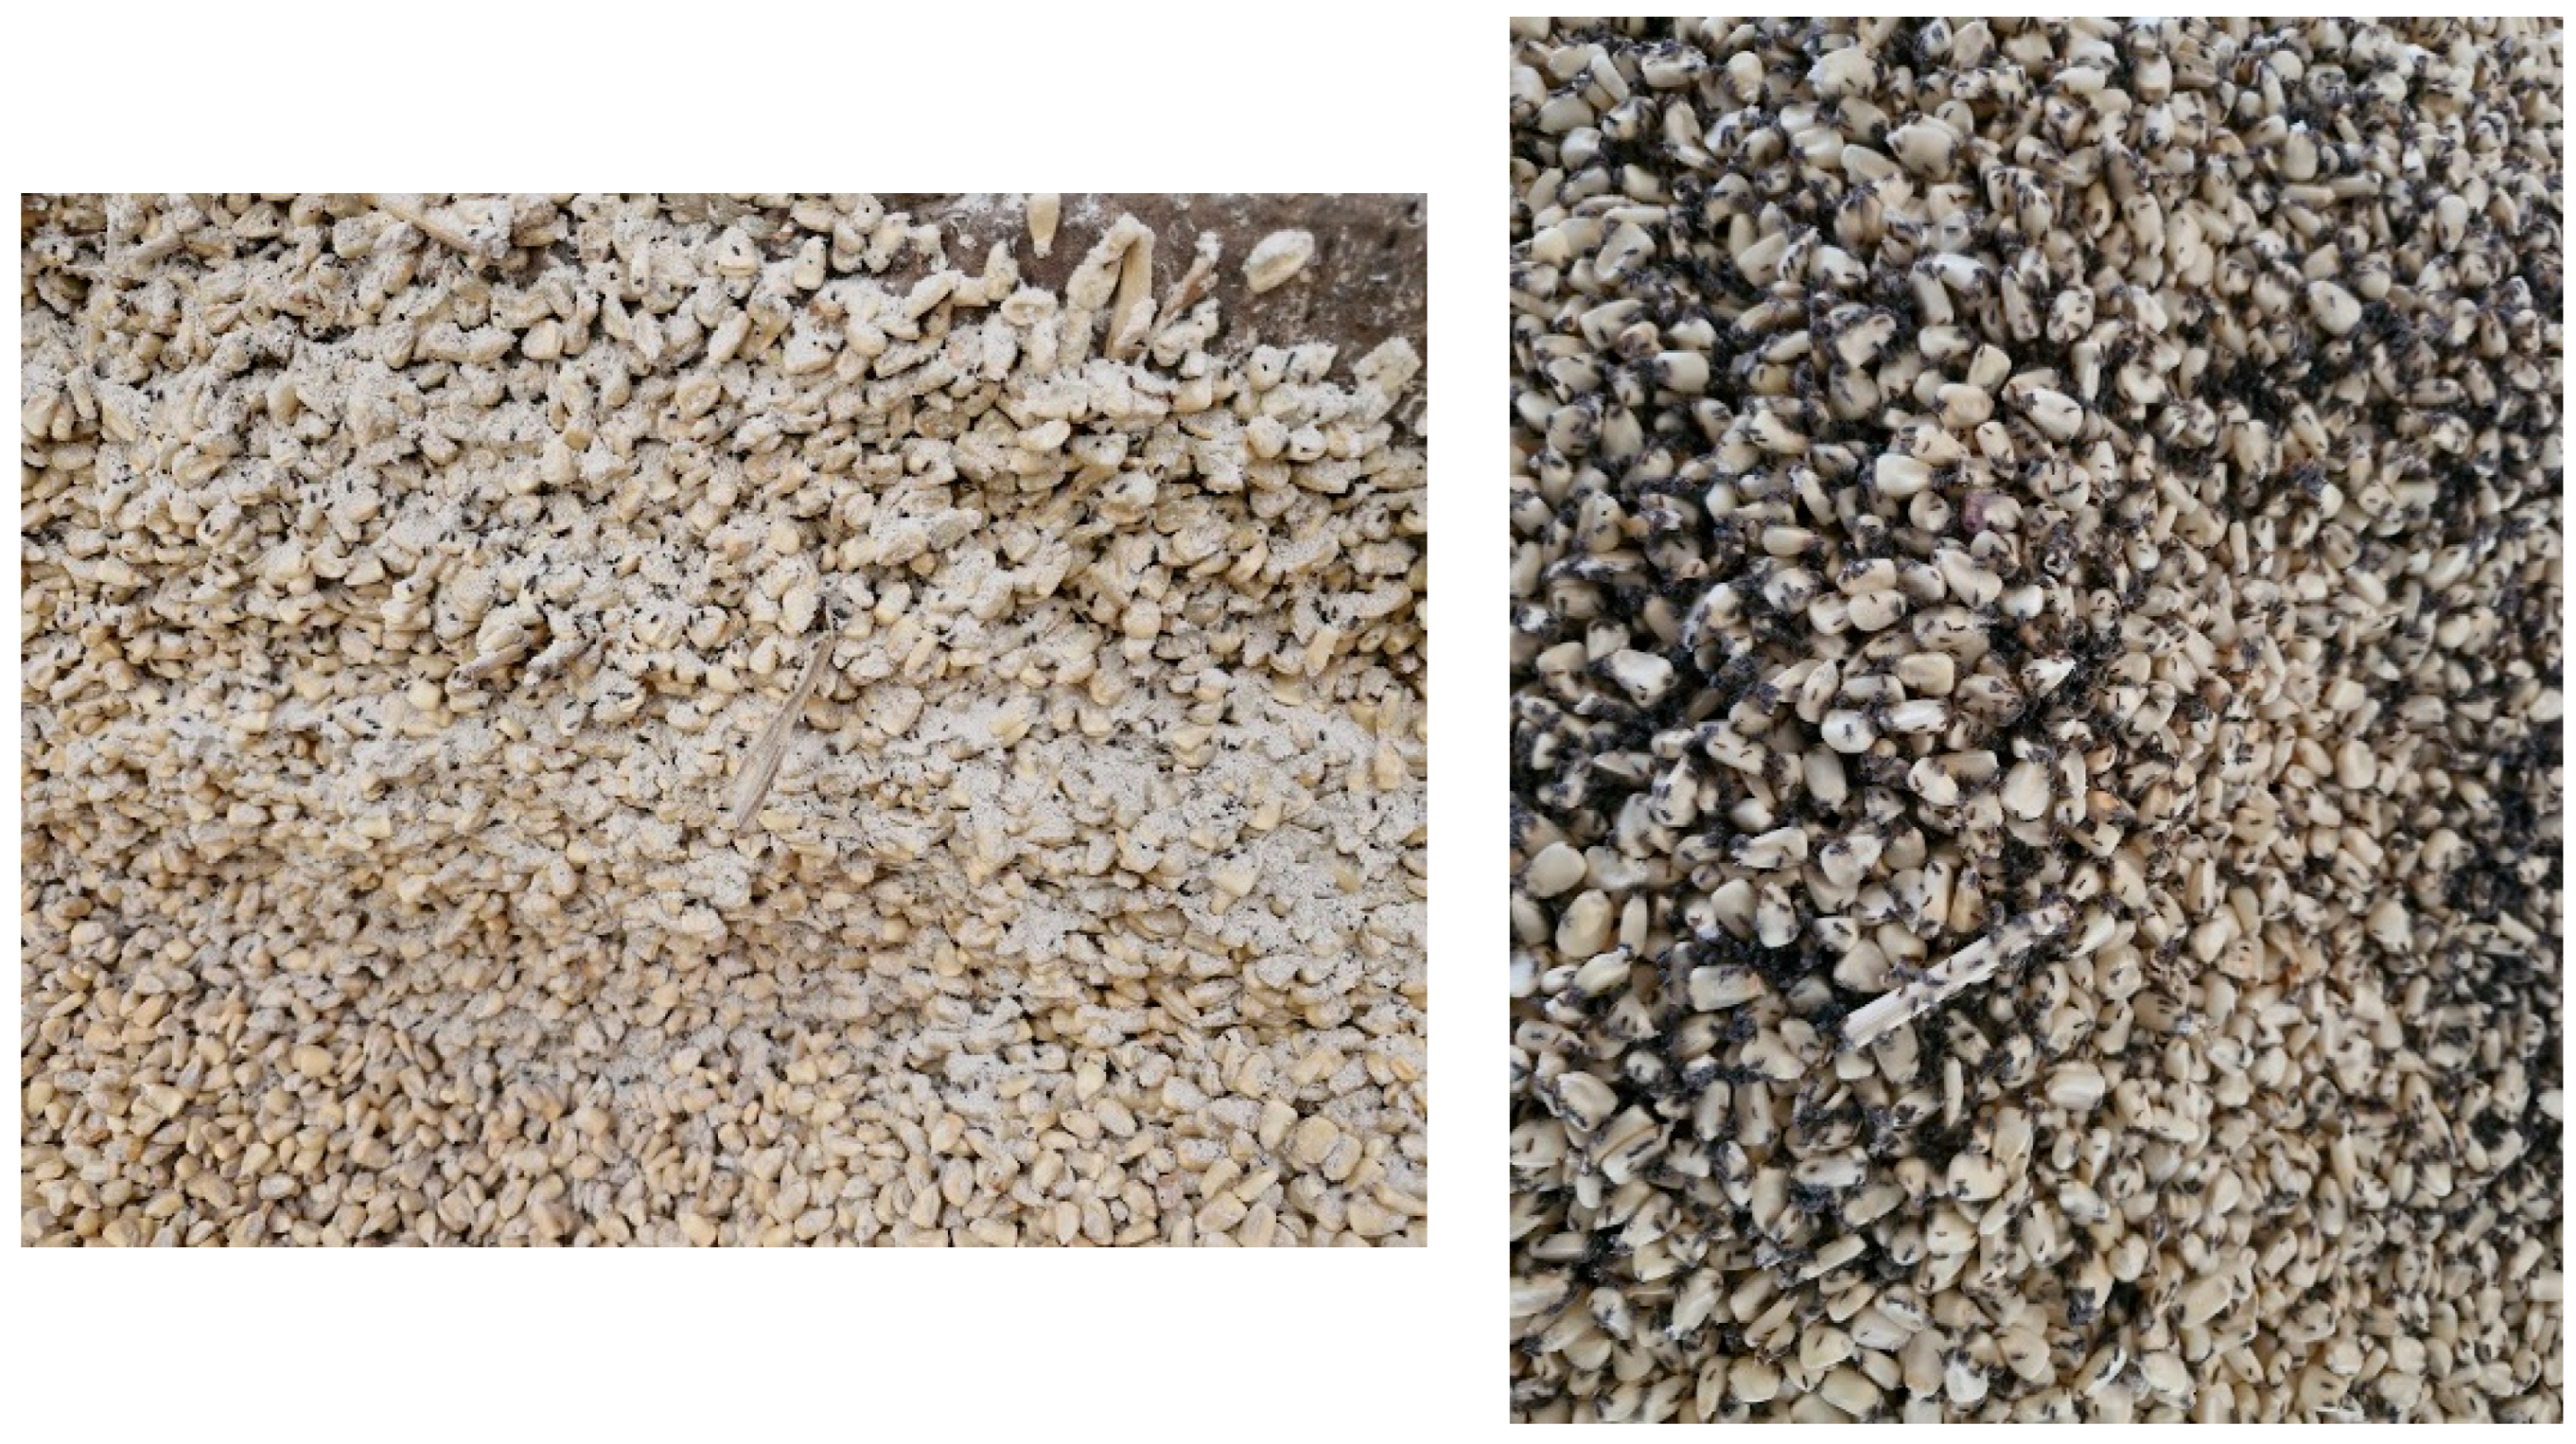
Figure 7 displays field photos taken during corn storage affected by high humidity (left image). The grain appears clumped together, as fungi and insects tend to infest it under these conditions, leading to unpleasant odors. This results from a combination of grain respiration, insect metabolic activity, and the growth of microorganisms like fungi. Meanwhile, the right image shows corn severely damaged by weevil infestation due to poor storage conditions, mainly due to high temperatures caused by a lack of aeration. These conditions create an ideal environment for pests like weevils to thrive, as they proliferate in warm temperatures.

3.3. Silo with Aeration

Aeration is a fundamental process for the safe storage of grain in silos, particularly in changing climatic conditions that can affect the temperature and moisture content of the grain [23,42]. A proper aeration system helps maintain the grain in optimal conditions, reducing temperature and controlling moisture, which minimizes the proliferation of fungi and insects [11]. To achieve this, it is essential to manage optimal airflows that ensure a uniform distribution of fresh air within the silo, allowing for the cooling of the grain without introducing undesirable levels of temperature and humidity that could affect the grain quality.
The airflows required for the aeration process and grain cooling in silos depend on various factors, such as the size and shape of the silo, the density and type of grain, the ambient temperature, and the desired cooling rate. Generally, an airflow of approximately 0.1 to 0.2 m3/(min·ton) is recommended for grain aeration under moderate climatic conditions. For rapid cooling, such as required in warm months or for grains with a high initial temperature, the airflow can be increased to values between 0.3 and 0.5 m3/(min·ton) [2,18,25].
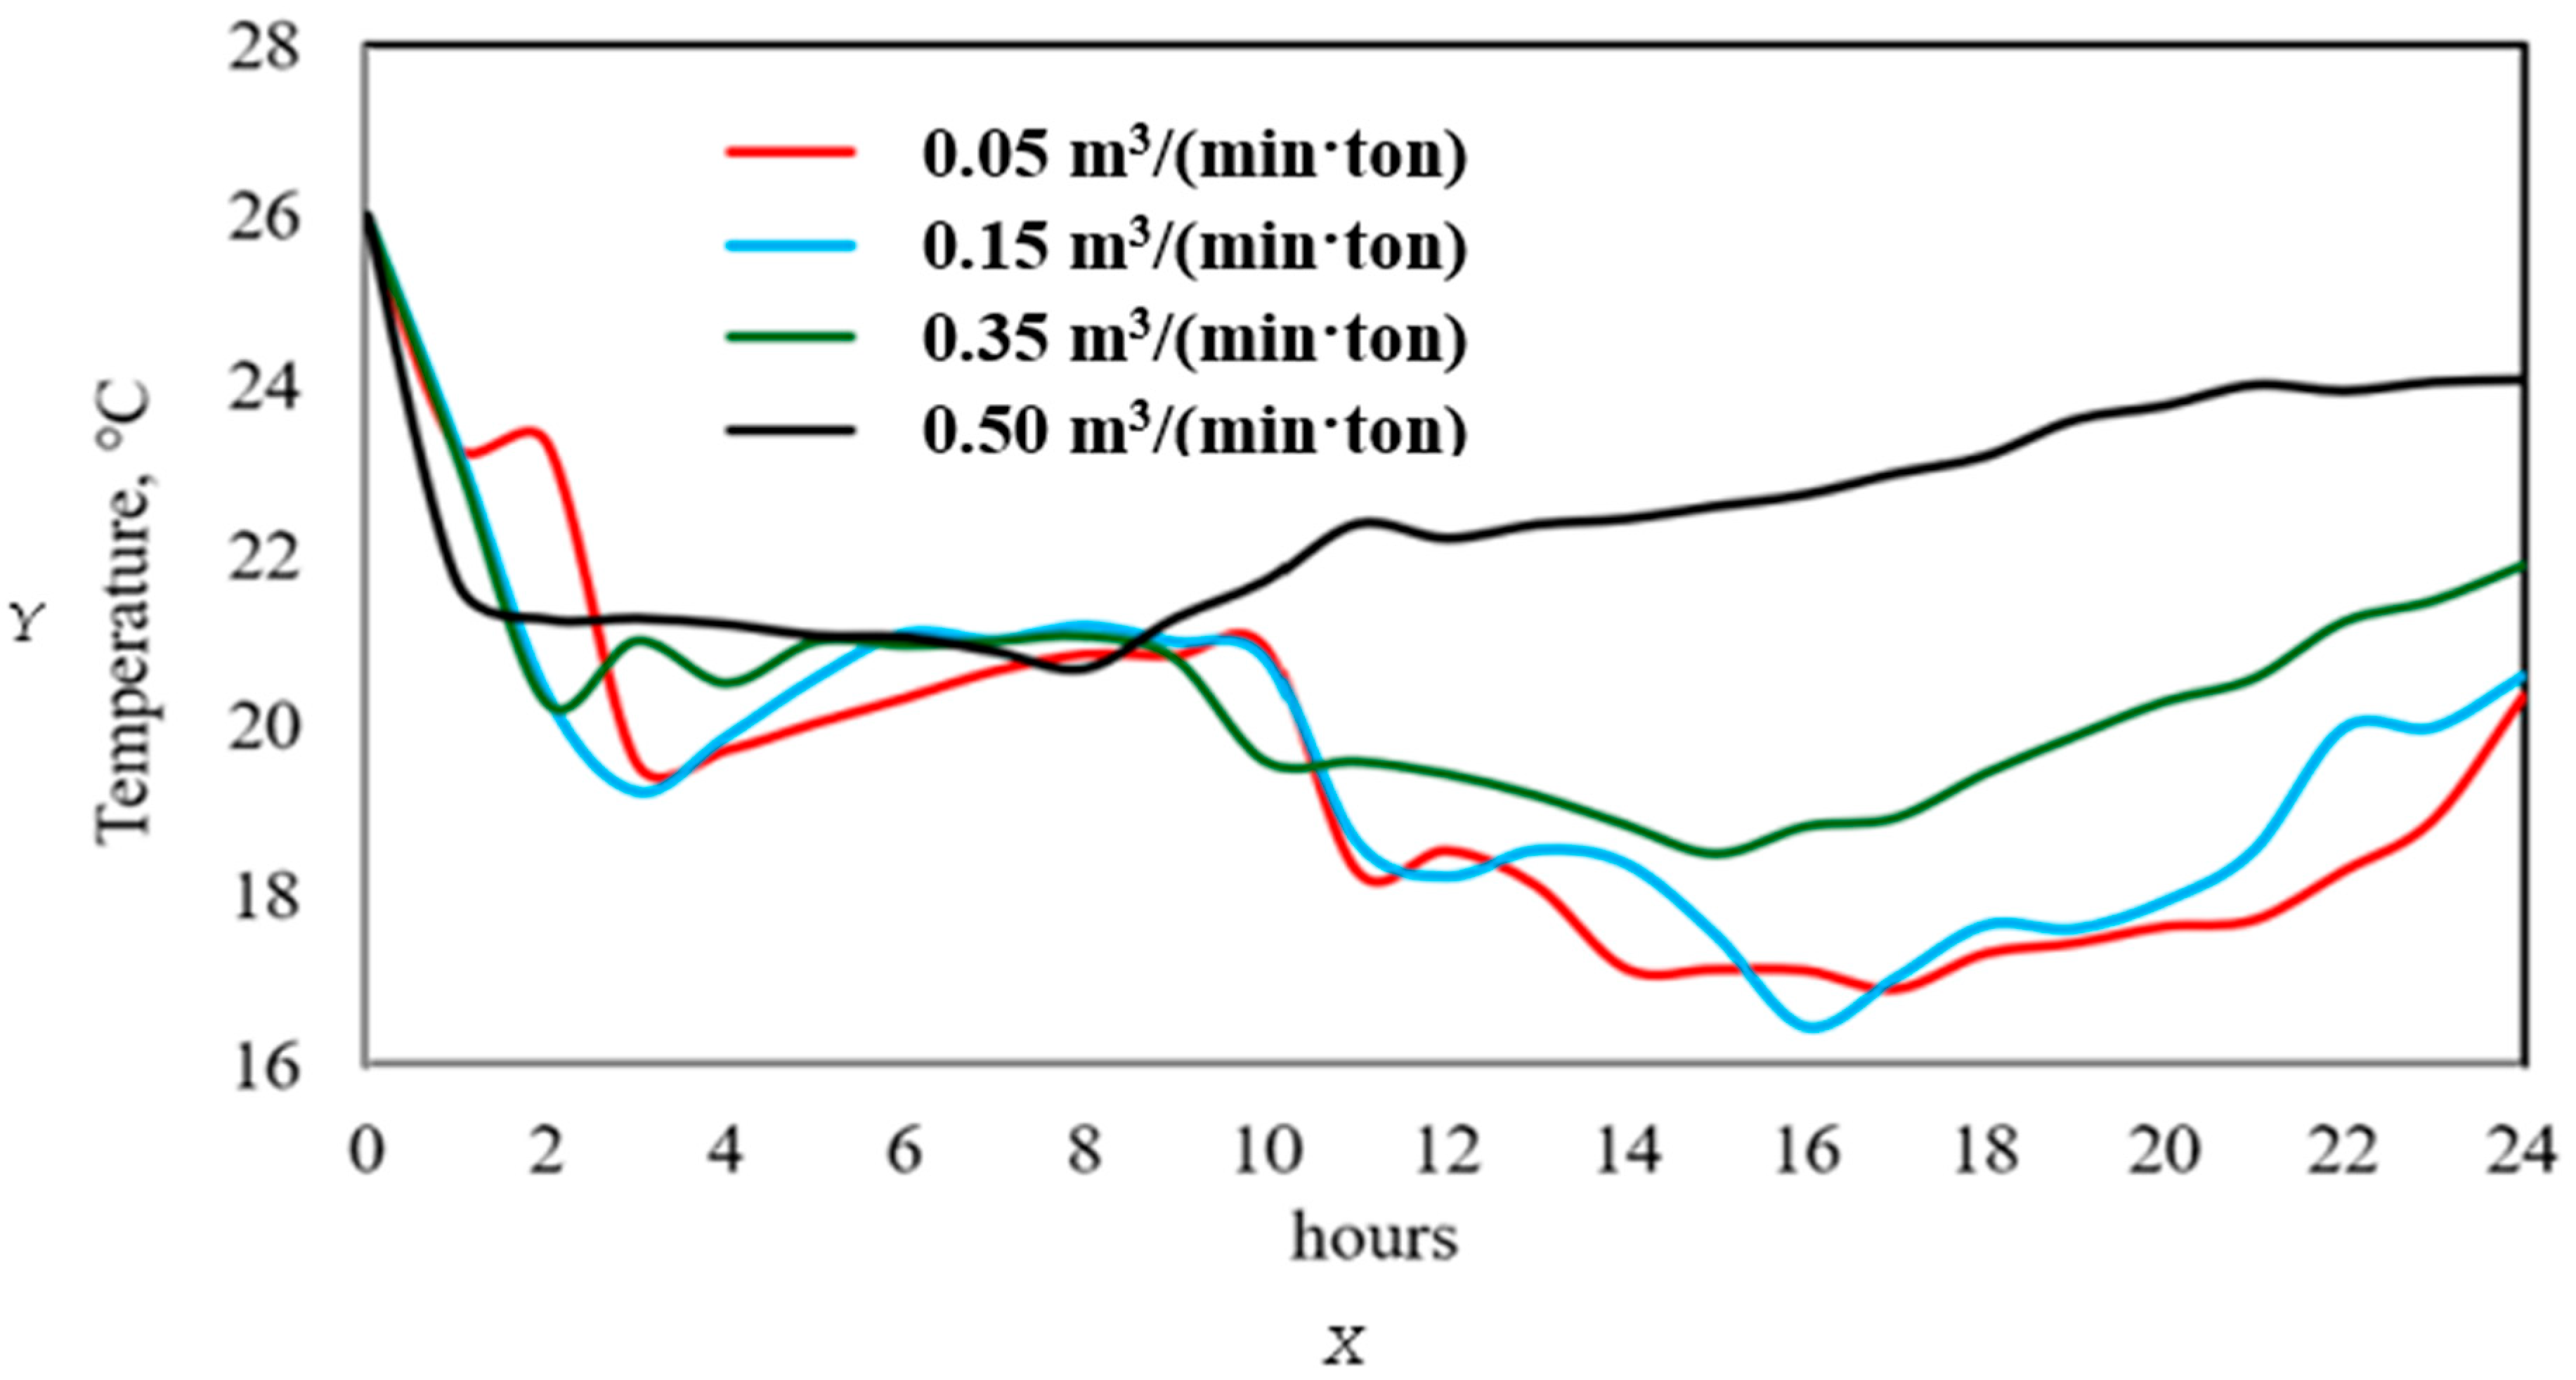
For this reason, to identify the ideal airflow for the aeration of the silo considered in this study, simulations were conducted for different flow rates during May, which is characterized by warm day-night temperatures. Figure 8 shows the temperature at the center of the silo over 24 continuous hours of aeration for different airflows. The 0.5 m3/(min·ton) airflow, being the highest, initially shows a decrease in temperature. However, after the first few hours, the opposite effect is observed, as instead of keeping the temperature low, it seems to increase, particularly during the warmest hours of the day. This behavior occurs because such a high airflow introduces a considerable volume of air into the silo, and during warm hours, the outside air may be hotter than the grain. This excessive airflow facilitates heat transfer to the grain, rather than cooling it. Meanwhile, the 0.35 m3/(min·ton) airflow shows constant cooling throughout the day, without significant temperature increases during the warmest hours. This behavior indicates that the airflow is sufficient to maintain good heat transfer outward, without introducing an excess of hot air into the silo.
Although the 0.15 m3/(min·ton) airflow is lower, it shows stable and effective behavior for grain cooling. The blue line follows a temperature reduction trend and remains relatively low throughout the day. Despite being slower in the initial cooling, this airflow allows for adequate temperature control without the risks associated with the introduction of excessively hot air. This airflow seems ideal for maintaining a low temperature efficiently and in a controlled manner, without the temperature increases observed in the higher airflows [22,42]. Meanwhile, the 0.05 m3/(min·ton) airflow shows a similar behavior with a constant and stable trend. Although it is the lowest airflow, it reduces and maintains the temperature within an adequate range, like that of the 0.15 m3/(min·ton). This behavior occurs because the airflow can dissipate heat without exposing the grain to high thermal gradients. However, this airflow is slower in achieving cooling and may not be ideal if fast temperature reduction is required.
Based on this analysis, the 0.15 m3/(min·ton) airflow proved to be the most suitable for the aeration process of this silo. This airflow provides efficient cooling and maintains the temperature controlled throughout the day, without the risk of overheating that is observed in the 0.5 m3/(min·ton) airflow.
It is essential to implement proper aeration strategies to minimize the risk of fungal and insect development during storage, especially during high-temperature periods like May. Once the optimal airflow for aeration is determined, Figure 9 and Figure 10 display the temperature contours for January and May, respectively, considering 5 h daily aeration periods starting at 01:00 and ending at 05:00 a.m. These hours are chosen because they have lower ambient temperatures and more stable relative humidity. This ensures the incoming air is cooler, aiding in grain cooling without increasing the risk of moisture absorption.

3.4. Temperature Distribution in January with Aeration

Figure 9 shows the temperature contours during 120 h of accumulated aeration corresponding to January. The introduction of fresh air between 1:00 a.m. and 5:00 a.m., when ambient temperatures are lower, allows for a noticeable reduction in temperature compared to the predicted temperatures considering periods without aeration. The applied aeration helps control heat accumulation inside the silo, particularly in the central zones, resulting in a more uniform and safer temperature distribution for storage. In this figure, it is observed that during the first 30 h of accumulated aeration in January, the cold air entering from the base of the silo begins to influence the central zone, forming a cooling pattern along the vertical axis [22]. Although the temperature inside the silo does not show a significant drop compared to the temperatures observed without aeration, the temperature distribution shows that aeration is achieving effective cooling in the central core, although it is a gradual process. Continuing with the aeration hours, the temperature contours corresponding to 60 h of accumulated aeration show that the central core of the silo presents a significant redistribution of temperature. Although the lower zone, where the cold air enters, does not show a notable temperature drop, the accumulation of 60 h of aeration has led to the formation of a hot core that moves toward the upper part of the silo. This happens because the cold air rises from the base, gradually reducing the temperature in these zones, which is why it is necessary to continue with the aeration periods [24].
Concerning the temperature contours corresponding to 90 h of accumulated aeration, a significant drop in temperature is observed compared to the predicted temperatures without aeration periods. The temperature with aeration periods ranges from 9.8 °C to 18.5 °C, indicating that the aeration process effectively cools the grain. The temperature throughout the silo has decreased significantly, approaching the safe storage temperature range, which is approximately 17 °C, suggesting that aeration is working well, allowing for the dissipation of accumulated heat in the center and reducing the risk of grain deterioration [22]. By the end of January, and with 120 h of aeration application, a thermal distribution shows the complete elimination of the hot core in the silo. The temperatures now range from 4.8 °C to 16.2 °C, which are considered within the safe temperature range for grain storage. The temperature has been redistributed to safe levels throughout the mass of the silo, indicating that the aeration strategy has been successful in achieving proper cooling to preserve the grain quality. The lowest temperature of 4.8 °C is found in the zones near the silo walls, which follow ambient and seasonal temperature fluctuations during this cold month, maintaining low temperatures in these zones and complementing the effect of aeration. However, the bottom of the silo presents the highest temperature, around 16.2 °C [5]. This value is at the upper limit of the safe storage range, but it is still adequate for preserving the grain quality [4].

3.5. Temperature Distribution in May with Aeration

Figure 10 shows the temperature variation of the grain during aeration periods in May, where the aeration hours were the same as those in January. The temperature contour corresponding to the first 30 h of accumulated aeration shows that temperatures reach up to 25.9 °C in the middle of the silo. Despite the 30 h of aeration, the temperature in the silo does not show a significant decrease compared to the predicted temperatures for this month without aeration, indicating that aeration has not been fully effective in reducing the temperature to safe storage levels. Regarding the temperature contours corresponding to 60 h of accumulated aeration, a hot core forms in the central zone of the silo, reaching temperatures of 24 °C [23]. This hot core is a heat accumulation zone formed due to the aeration. Continuous aeration begins to displace the hot core from the central zone, suggesting that the airflow is starting to influence the temperature distribution. Although the temperature has decreased in some zones, the hot core persists. The temperature difference between the core and the rest of the silo remains significant, which can generate airflows that affect cooling efficiency. After 90 h of accumulated aeration, it is observed that the hot core has expanded in size. Still, its temperature has decreased by approximately 3 °C compared to the 60-hour contour, showing a shift toward the upper part, specifically toward the conical roof, in the outflow direction [22]. Meanwhile, the temperatures at the bottom of the silo are between 18 °C and 20 °C, which is closer to the safe temperature range for grain storage [5]. This cooling at the base also shows the effectiveness of aeration in the lower layers, helping stabilize the temperature in zones where heat accumulates.
By the end of May, with 120 h of accumulated aeration, it is observed that the hot core, although reduced in size, is still present and has shifted toward the upper conical part of the silo, which indicates that the aeration process is achieving a redistribution of temperature. Still, it has not been sufficient to eliminate the higher temperature zones. A warm region around 22.6 °C still exists at the bottom of the silo, particularly in the conical bottom, which, by design, is insulated from heat transfer to the environment, and the temperatures in the rest of the silo range between 18 °C and 20 °C [22].
However, these values still do not reach the optimal range for safe storage, ideally below 17 °C. This result indicates that, for May—a warmer month compared to January—additional aeration periods or increased airflow intensity would be necessary to maintain proper temperatures for grain preservation. Compared with January, when lower ambient temperatures helped with cooling and maintaining safer storage conditions, it becomes clear that aeration management in May needs adjustments due to the warmer temperatures typical of that month. In summary, it is necessary to increase aeration hours or implement additional cooling strategies, such as increasing the airflow entering the silo during warmer months, to prevent deterioration of stored grain [42].

3.6. Effect of Airflow on Temperature Reduction in May

To evaluate the effect of increasing airflow on the reduction in grain temperature during May, the airflow was doubled. To analyze the effectiveness of this strategy, Figure 11 compares the temperature contours in the silo during the first 30 h of aeration and then after 120 h of accumulated aeration. The results show that increasing the aeration flow from 0.15 to 0.30 m3/(min·ton) generates a significant reduction in the temperature of the stored grain. The temperature contours show that, with a flow of 0.15 m3/(min·ton), aeration during the first 30 h is not sufficient to effectively reduce the temperature of the grain and maintain it in optimal storage conditions, as the maximum temperatures inside the silo reach 25.9 °C, which is above the recommended temperature for safe storage [22,42]. However, increasing the airflow to 0.30 m3/(min·ton) reduces the grain temperature by up to 7 °C compared to the 0.15 m3/(min·ton) airflow, showing a more uniform temperature distribution with more homogeneous cooling throughout the entire silo mass. The grain temperature approaches the safe storage range (≤17 °C).
Regarding the temperature contours after 120 h of accumulated aeration at a flow rate of 0.15 m3/min per ton, a hot core at the top of the silo is observed, with temperatures reaching 22.6 °C. Although the aeration has lowered the temperature somewhat compared to the first 30 h, it remains insufficient, and the presence of this core indicates that the airflow is not adequate to remove the heat properly [5]. However, when the airflow was increased to 0.30 m3/(min·ton), and after 120 h of aeration, the temperature contours show a significant difference. Temperatures have decreased to safe levels for storage, the hot core has disappeared, and the temperature distribution is more uniform throughout the silo, with lower temperatures at the center, reducing the risk of grain deterioration. Additionally, the airflow covers the entire silo, encouraging even heat dissipation. Increasing airflow beyond 0.15 m3/(min·ton) is not feasible, as it could cause excessive drying, reducing moisture below optimal storage levels. This could make the grain more fragile, increasing the risk of fractures, weight loss, and dust, promoting pests and fungi. To prevent these issues, it is advisable to slightly increase airflow during colder periods and continuously monitor grain moisture and temperature to ensure adequate aeration without affecting quality [5,43,44].

3.7. Radial and Axial Temperature Profiles with and Without Airation Periods

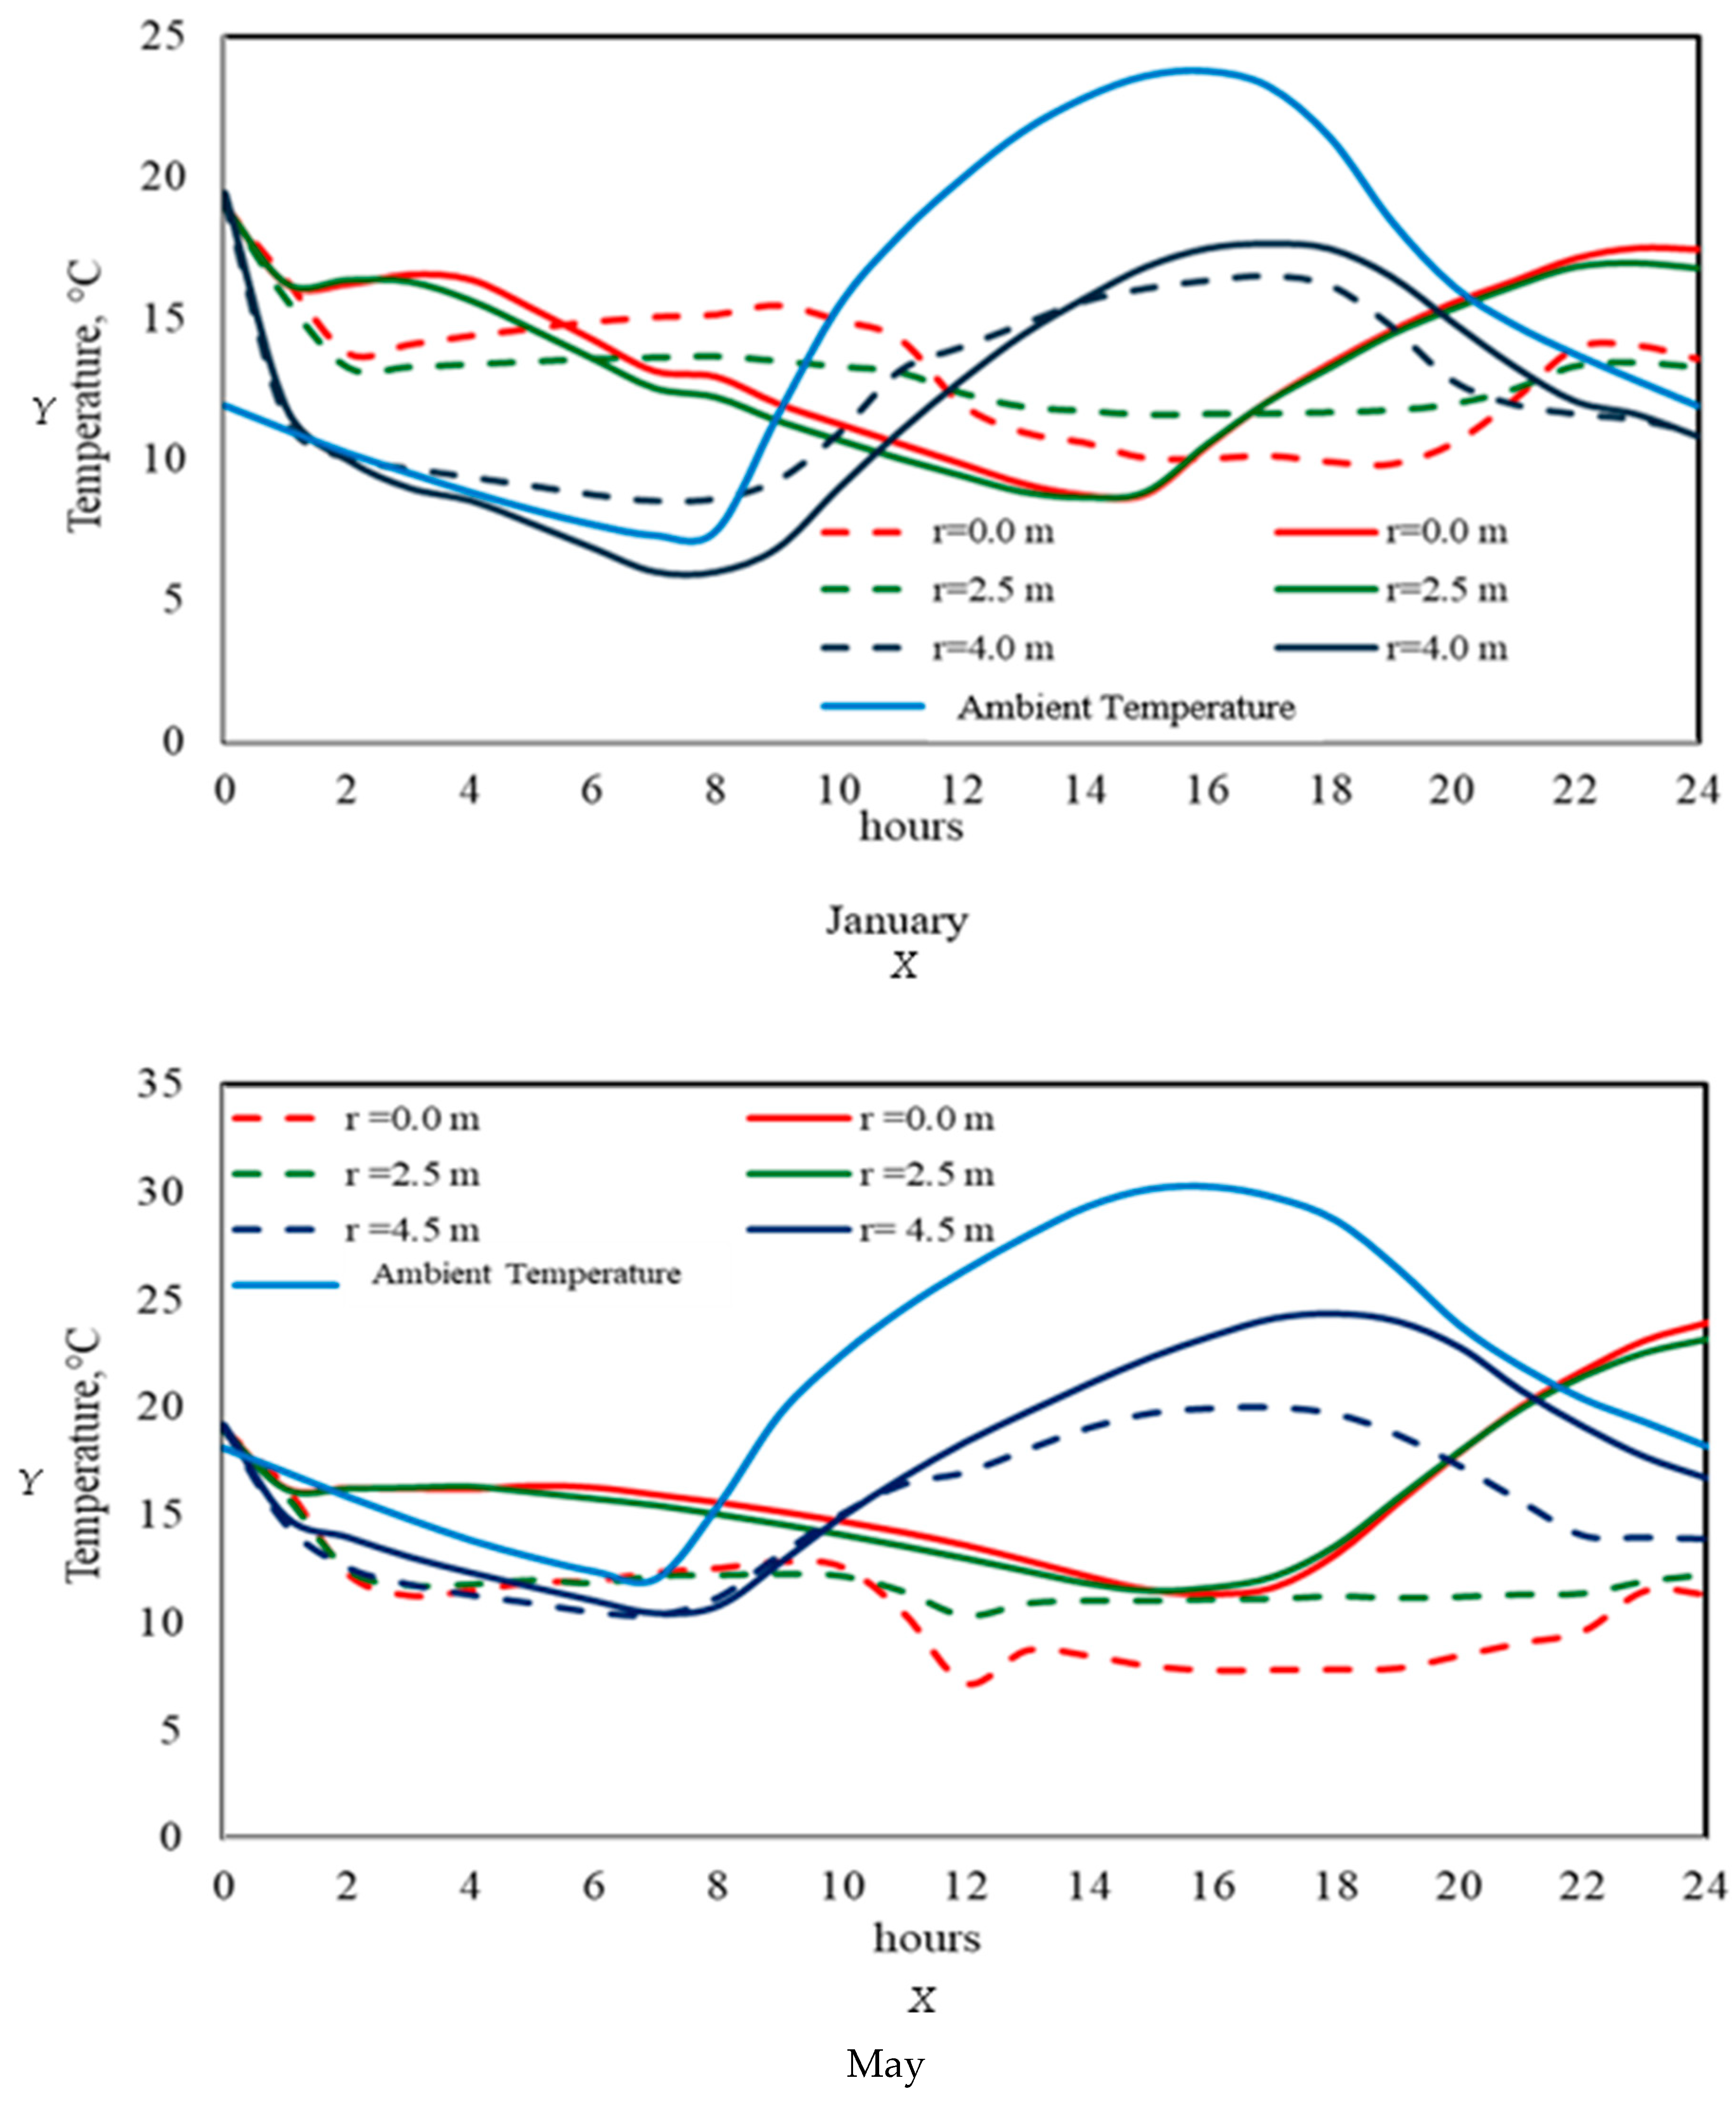
Figure 12 shows the radial temperature profiles along the silo’s radius during one day of storage in January and May, considering periods with no aeration (solid lines) and with aeration (dashed lines). January is characterized by cold ambient temperatures and relatively stable weather conditions. Also, Figure 12 displays the effect of aeration on the grain’s radial temperature profile inside the silo. The curves represent three positions: the center of the silo, the intermediate zone, and the area near the wall (red lines), with solid lines indicating the non-aerated case and dashed lines the aerated case. Aeration was applied between 01:00 and 05:00 h, a period strategically chosen because these are the coldest hours of the day, allowing fresh air to enter the silo without causing heating. At the silo’s center, a significant temperature drop occurs when aeration is applied. The blue dashed line descends between 01:00 and 05:00, demonstrating that the cold incoming air effectively penetrates the silo’s core and removes the accumulated heat. However, after 06:00 h, air intake is no longer beneficial when the ambient temperature rises. If the aeration system remained active beyond this period, it could introduce warmer air and increase the grain temperature, making the process counterproductive. In contrast, the solid blue line (without aeration) shows a smoother, more gradual cooling throughout the day, caused solely by natural heat dissipation through the silo and the low metabolic activity of the grain during winter. In the intermediate zone, the thermal behavior is similar but less pronounced. The green dashed line also decreases during the aeration period (01:00 to 05:00). However, the cooling is more moderate, indicating some of the cold air loses effectiveness as it passes through the outer layers before reaching this area. After 06:00 h, the curve rises again, reflecting the change in incoming air temperature. Meanwhile, the solid green line maintains a more stable profile, suggesting that under cold conditions, non-aerated storage may be sufficient to keep temperatures safe in these regions. Near the silo wall, the effect of ambient temperature is more direct. The red dashed line (with aeration) stays slightly above the solid red line (without aeration) for most of the day. This is because the metal walls of the silo respond quickly to external temperature changes, transmitting heat to the grain in contact with them. In the early morning, the cold air entering through the conical base tends to warm upon contact with the relatively warmer walls, reducing its cooling capacity [17]. As the morning progresses, the walls absorb solar radiation and ambient heat, increasing their temperature and raising the grain temperature in this outer zone. This behavior indicates that aeration is not always beneficial near the wall areas, especially if the system’s activation time is not correctly controlled [17,19,21,43].
In May, the behavior of the temperature profiles changes significantly due to the warmer temperatures. The temperature in the center of the silo remains lower throughout the 24 h compared to the temperature without aeration. This indicates that the introduction of cooler air during the early morning hours (01:00 a.m. to 05:00 a.m.) is effective in reducing the temperature in the core of the silo. However, it does not reach the lowest ambient temperature due to the heat generation from the metabolism of the grain. Meanwhile, the temperatures in the intermediate zones of the silo without aeration periods are very similar to those in the center, indicating that heat transfer in this zone is limited due to the low thermal conductivity of the grain. As for the temperatures in the zones near the wall, the difference between periods with and without aeration is notable. The solid lines show significantly higher temperatures compared to the dashed lines, with a difference of approximately 6.0 °C. This is because the silo wall is in contact with the hot outside air, and in the absence of aeration, this zone absorbs and retains more heat. The aeration process helps dissipate some heat, keeping the temperature near the wall at lower values [24]. In conclusion, the graph for May shows that aeration is crucial for maintaining safe temperatures inside the silo during this hot month. In contrast, natural cooling and low thermal conductivity in January allow for safer storage [16]. This highlights the need to adapt the aeration strategy to seasonal conditions to extend storage periods [26].
Figure 13 shows the axial temperature profiles along the silo during one day of storage in January and May, considering periods with no aeration (solid lines) and with aeration (dashed lines). In January, it is observed that the temperature profiles without aeration along the silo (2 m < z < 11 m) remain constant and unaffected by ambient temperature fluctuations, due to the low thermal conductivity of the grain, which acts as a natural insulator [21]. In contrast, the temperatures near the silo roof, where temperatures are higher at around 15 °C, are compared to the ambient temperature. This indicates that heat is transferred from the warmer grains to the cooler environment, a phenomenon characteristic of January due to the thermal gradient generated by the low temperatures [14,40]. As for the temperature profiles with aeration, it is observed that continuous aeration during one day in January manages to cool the grain down to 10 °C, which is below 17 °C, the optimal temperature for safe grain storage, and aeration is sufficient to dissipate the heat, maintaining optimal storage conditions.
In contrast, in May, the warmer environmental conditions significantly affect the temperature profiles with and without aeration. This month’s environmental temperature exceeds 30 °C, which is typical for May. The temperature profiles with aeration exhibit uniform behavior along the axial axis of the silo, showing that the aeration system effectively homogeneously cools the silo. These temperatures follow the same trend as the ambient temperature, though moderated by the effect of the aeration system. Regarding the temperature profiles without aeration, it is observed that they remain constant along the axial axis, as the grain acts as a natural insulator. However, in the zones near the silo roof, the grain temperatures follow the fluctuations of the ambient temperature, showing the effect of external conditions due to the heat transfer from the warmer environment to the upper layers of the grain [14,21,26,40].

3.8. Effect of Natural and Forced Convection on Temperature Distribution

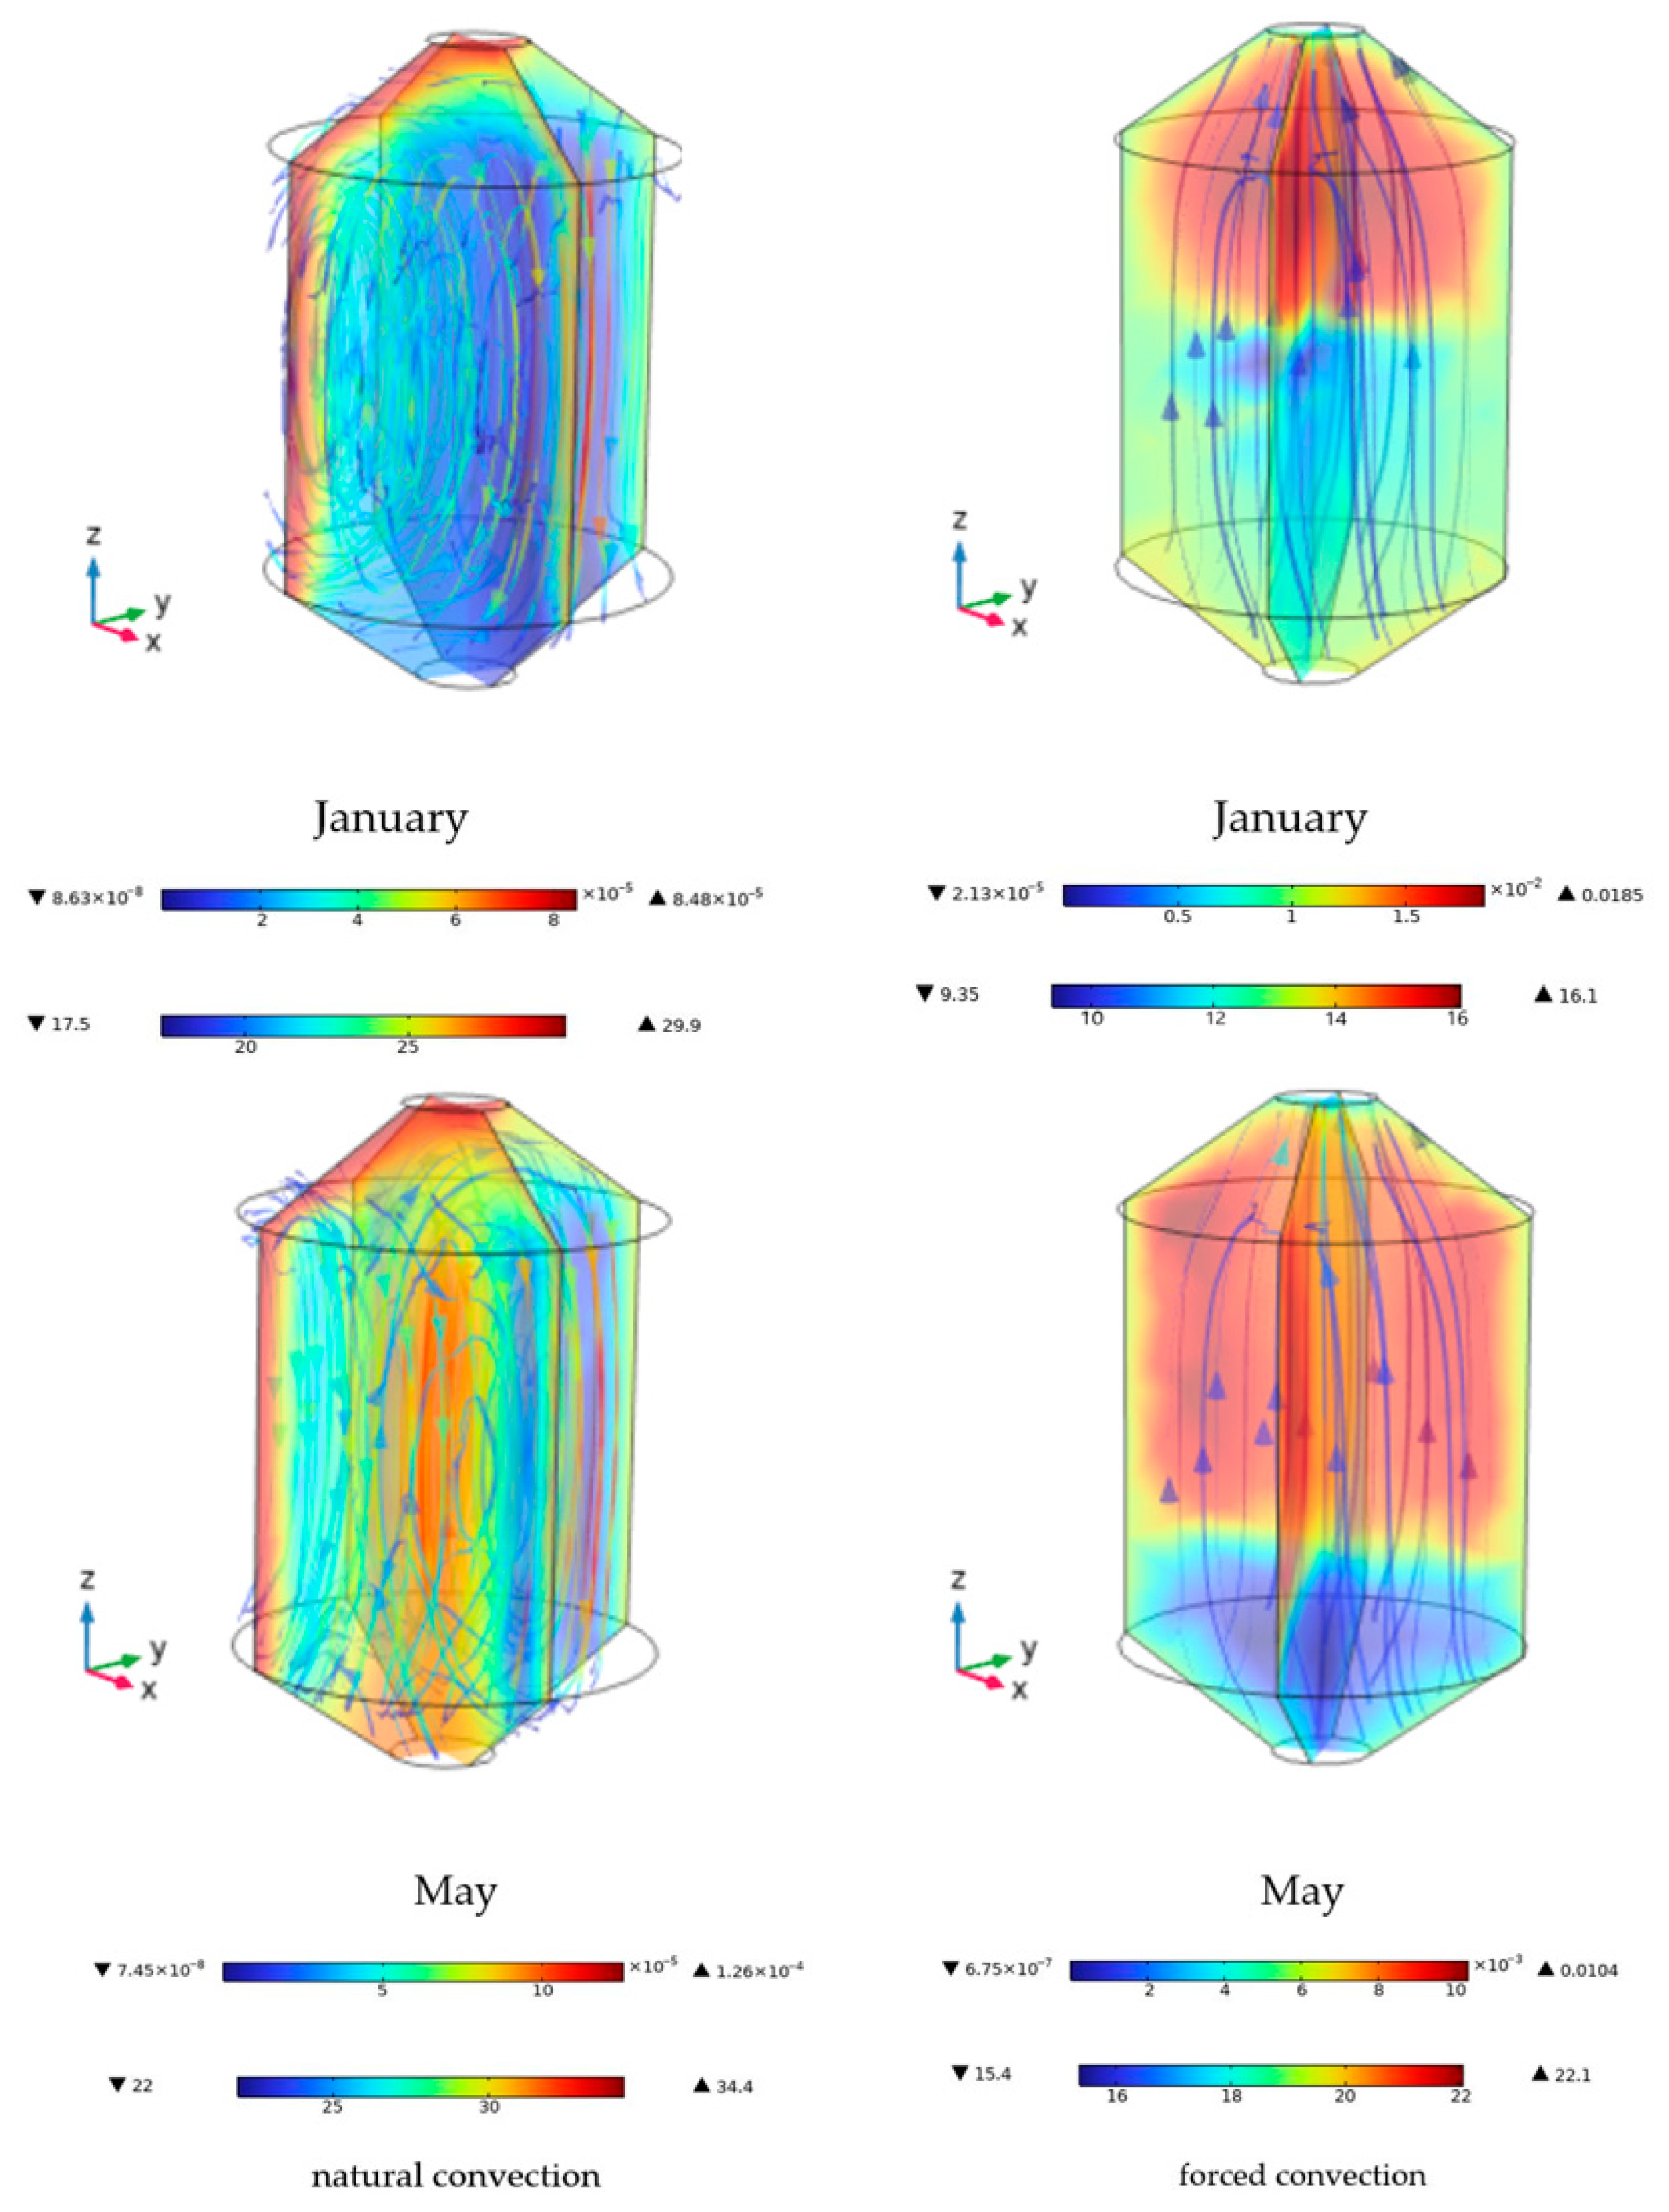
Regarding the effect of natural convection and forced convection on the temperature distribution at the end of January and May, Figure 14 shows that during January, the airflow generated by natural convection distributes the temperature uniformly within the silo, with temperatures around 20 °C, which exceeds the recommended limit of 17 °C for grain storage. During May, it is observed that natural convection is insufficient to dissipate the accumulated heat in the center, reaching temperatures above 30 °C, due to the grain metabolism and the limited capacity of convective currents to dissipate the heat. Therefore, under these conditions, natural convection during January and May is insufficient to ensure safe storage, and it is necessary to implement strategies such as aeration.
In the case of forced convection during January and May, Figure 14 shows how the cold air in January effectively displaces the heat generated by the grain metabolism, managing to reduce the internal temperature of the silo to levels around 9 °C, which is below (≤17 °C) the recommended limit for safe storage. During forced convection at the end of May, it is observed that, despite the aeration process, the environmental conditions are not favorable to maintain temperatures at safe storage levels, and the internal temperatures of the silo remain above 22 °C, increasing the risk of grain deterioration and the proliferation of fungi and insects. Although the air introduced from the bottom of the silo generates upward currents, allowing the redistribution of grain heat toward the upper outlet, it is not enough to counteract the high ambient temperatures typical of May. For this reason, to ensure safe storage under these conditions, it is necessary to increase the aeration airflow to 0.30 m3/(min·ton) during this month to improve the dissipation of accumulated heat and prevent the formation of hot cores in the center of the silo [17,22,23].

3.9. Thermal Response of Stored Grain During Accumulated Aeration Periods

Figure 15 shows the thermal response of the grain for January and May during a total of 60 h of accumulated aeration, distributed in 5 h periods starting at 01:00 a.m. and ending at 05:00 a.m. The figure shows a distinct behavior for January and May due to the differences in ambient temperature and the heat transfer dynamics within the silo. In January, the grain temperature is higher than the ambient temperature during the aeration periods, which is due to the ambient temperatures being considerably low during the early morning hours, allowing the grain to cool through the introduction of fresh air During each 5 h aeration cycle, the grain temperature decreases but does not reach the level of the ambient temperature, indicating that the grain loses heat progressively. However, its temperature remains elevated due to the heat generated by grain respiration and thermal accumulation in the silo. These results show that the nighttime aeration strategy in January effectively reduces the grain temperature. However, due to the low thermal conductivity of the grain and internal heat accumulation, a prolonged and consistent approach is required to achieve a significant temperature reduction [16,21,42].
On the other hand, in May, the thermal response of the grain shows a different behavior. In this case, the grain temperature is generally lower than the ambient temperature during the aeration periods. Even though the daytime temperatures are higher in May, the cool air introduced during the early morning hours helps cool the grain, thus taking advantage of the cooler conditions of this month. The decrease in temperature in the early morning indicates that the nighttime aeration strategy is particularly effective in May, as it efficiently reduces the grain temperature [11,42].
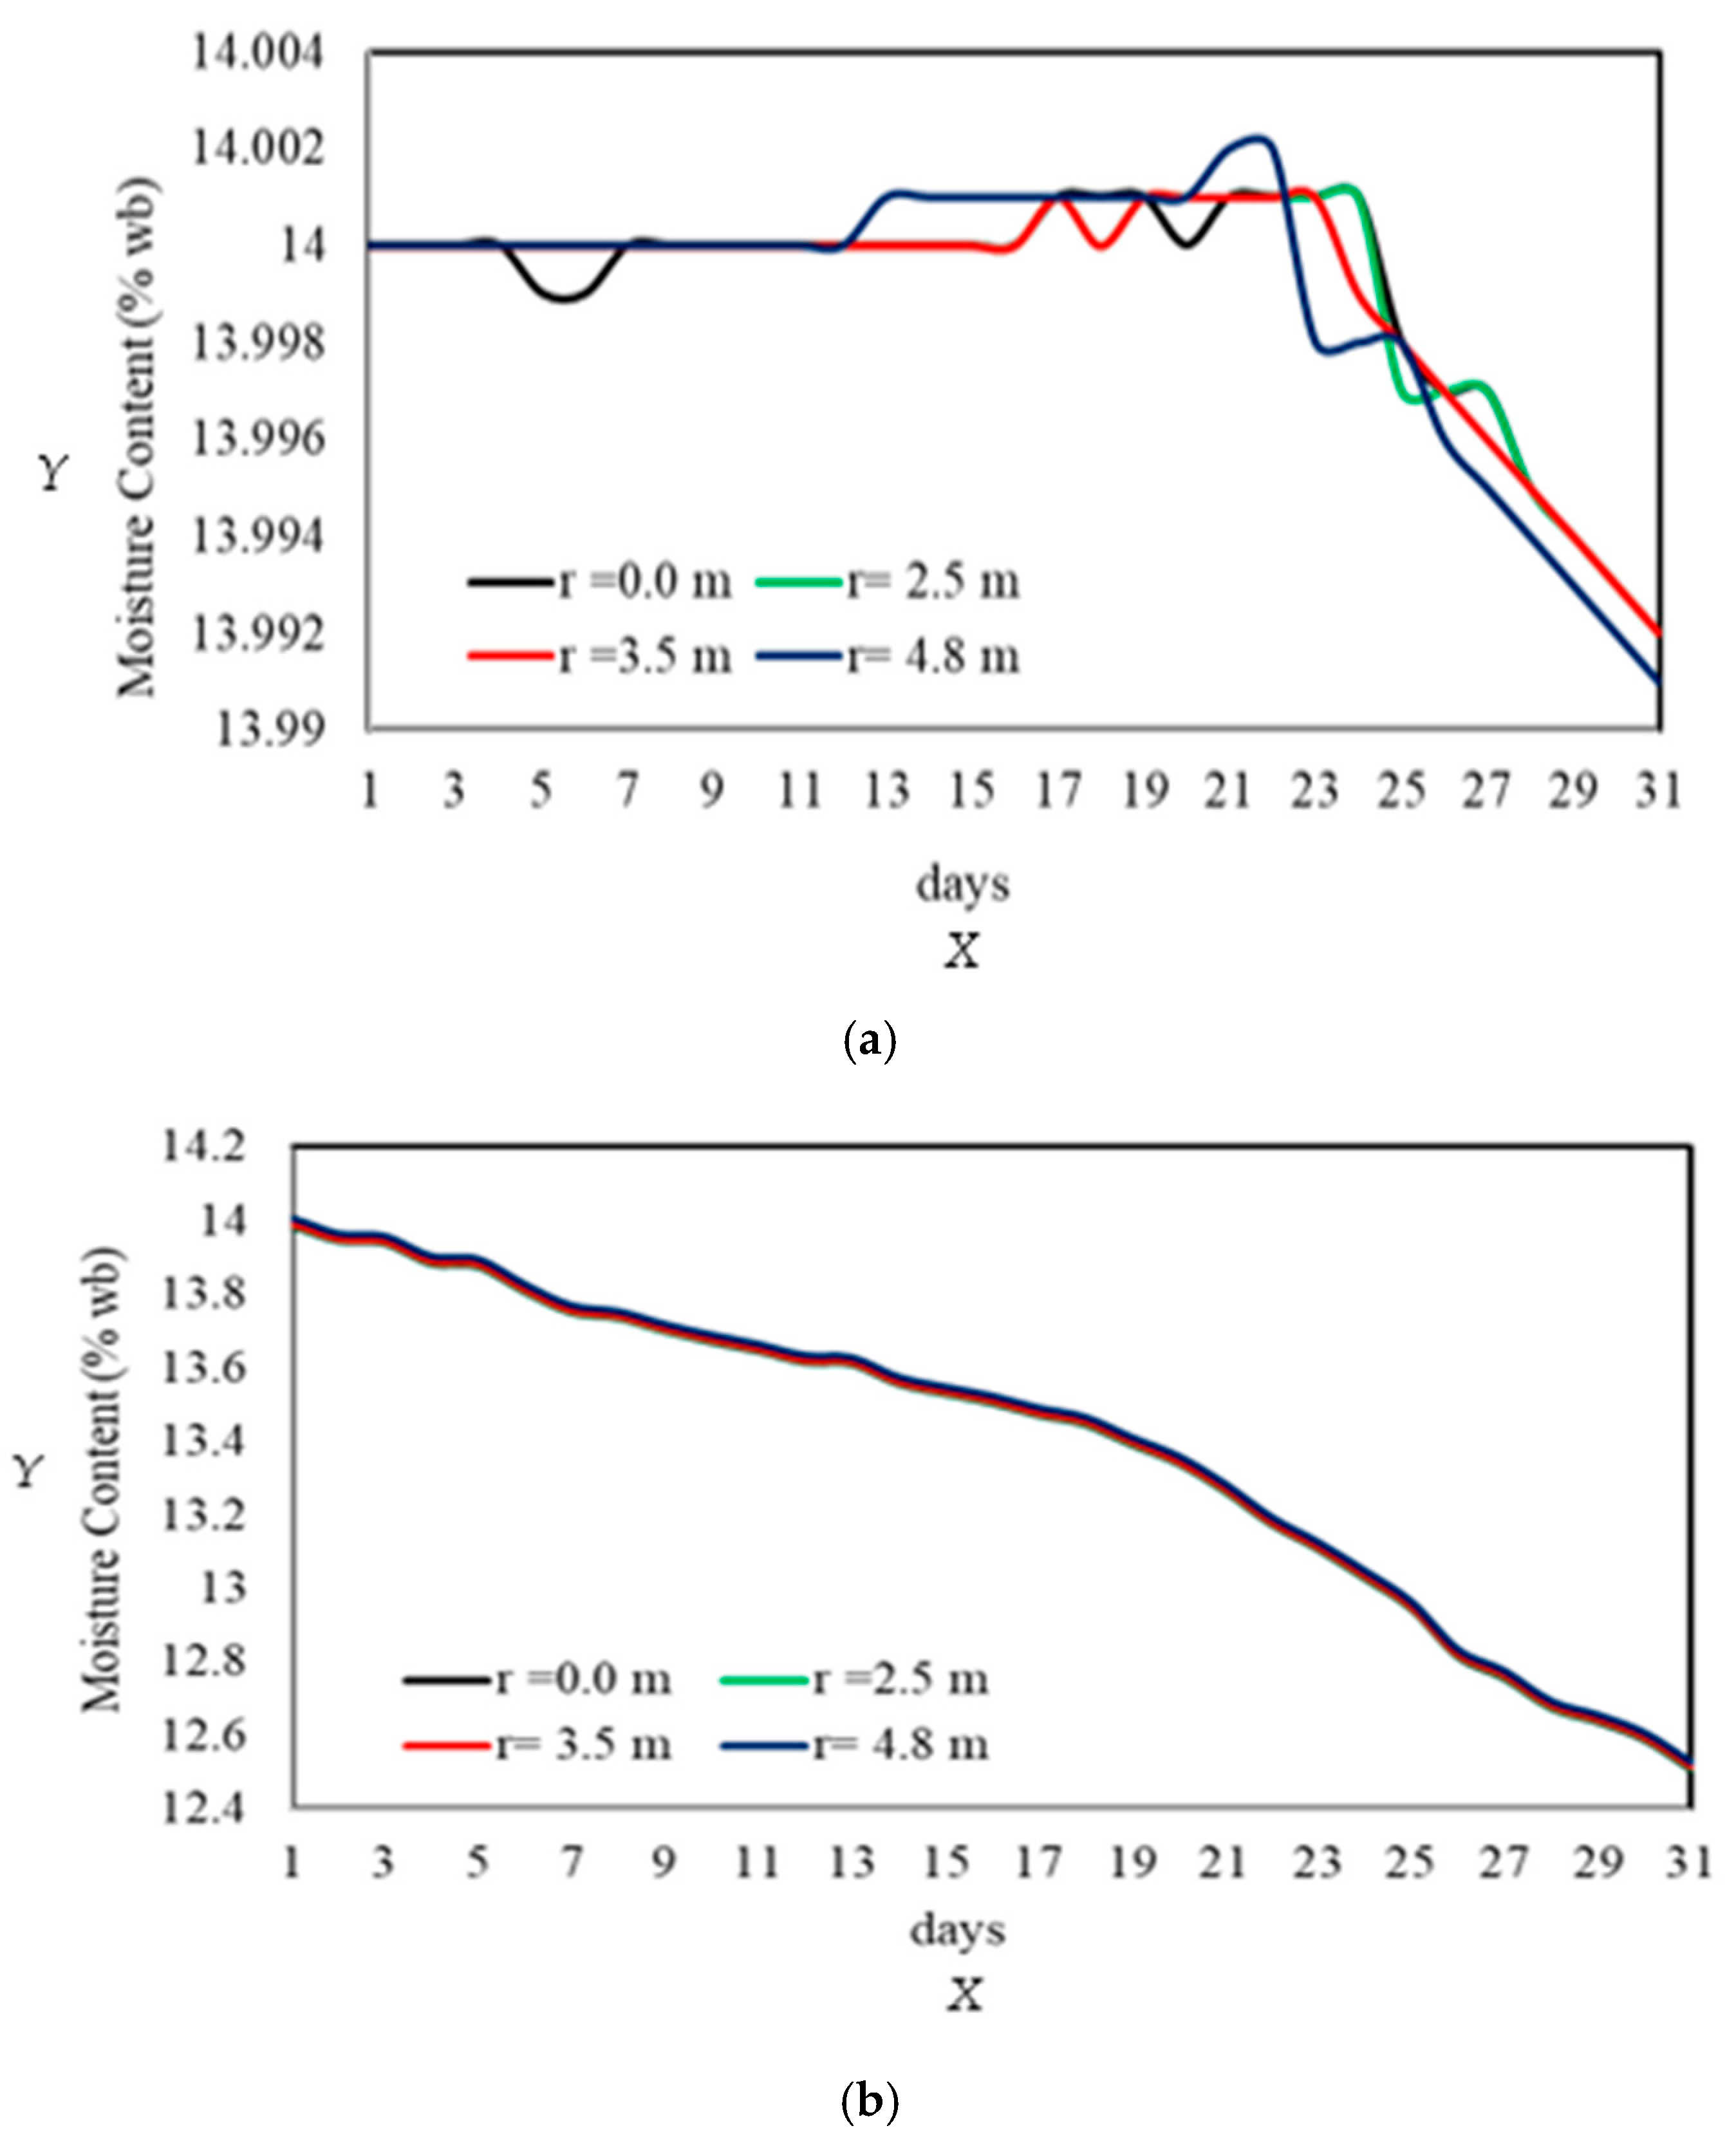
Figure 16 shows the variation in the moisture content of the stored grain during May, considering periods with and without aeration for different radial positions within the silo. In the graphs, it can be observed that the moisture content varies depending on the presence or absence of aeration. Without aeration, the moisture content shows fluctuations over time and position. At the center of the silo, the moisture decreases slightly from the fifth day of storage, recovering its initial value of 14%wb, until the twenty-first day. At this point, it decreases again, reaching approximately 13.99% towards the end of the month. At 2.5 m from the center, the moisture remains stable until the seventeenth day, followed by an increase that lasts until the twenty-third day, before beginning a progressive decrease. A similar behavior is observed at 3.5 m from the center, where the moisture remains constant until the twenty-third day and then decreases. In contrast, in the zones near the silo walls, the moisture remains constant only during the first twelve days, followed by a slight increase until the twentieth day, with a moisture peak on the twenty-second day, before beginning a decrease towards the end of the month. These variations in moisture in the periphery of the silo are due to the fluctuations in ambient temperature and the incident solar radiation on the silo walls, which are more intense compared to January.
On the other hand, when aeration is implemented, a different behavior in the moisture variation of the grain is observed. Aeration creates a more uniform effect within the silo, as the trends at various radial positions are very similar. From the first days of storage, the grain moisture decreases steadily and continues throughout the month, reaching a reduction of up to 1.5% from the initial moisture content. This phenomenon occurs because, during May, the air introduced into the aeration system has low moisture content, favoring moisture transfer from the grain to the air, thus creating a gradual drying effect [26]. Although aeration helps maintain homogeneous conditions within the silo, it is crucial to monitor and manage this moisture loss. An excessive reduction in the grain moisture content can affect its quality, making it more fragile and susceptible to damage during handling and processing. Therefore, adjusting the aeration strategies according to the specific environmental conditions of each period is essential to avoid over-drying and ensure the optimal preservation of the grain for storage and subsequent commercialization.

4. Conclusions

A mathematical model was developed to simulate temperature variations inside a grain storage silo, considering periods with and without aeration. This model was used to simulate the temperature and moisture content inside an industrial-scale silo filled with corn. The model was solved using the finite element method (FEM) and used to analyze the storage of corn with an initial temperature of 20 °C and an initial moisture content of 0.14 wb, during January and May, which present contrasting environmental conditions. The simulation results show that, during January, the low ambient temperatures and lower solar radiation intensity contribute to maintaining the maximum storage temperature at the initial temperature of 20 °C. However, by the end of January, the grain respiration generates heat accumulation in the central zone and at the bottom of the silo, where natural cooling is limited. These zones reach critical storage temperatures (≥20 °C). Implementing aeration periods during the coldest hours of the month, between 01:00 and 05:00 am, is recommended to redistribute and lower the temperature to safe storage values (≤17 °C). In contrast, during May, the high temperatures and greater intensity of solar radiation increase storage temperatures, especially in the central region and the bottom of the silo. This progressive accumulation creates a hot core that reaches 34 °C, favoring grain metabolic activity and the proliferation of fungi and insects, showing that the warmer conditions of May reduce the effectiveness of natural cooling compared to the colder months, making it necessary to implement aeration periods to dissipate the accumulated heat. However, the results show that even with 120 h of accumulated aeration during May, the maximum temperatures range from 20 °C to 22 °C, indicating that aeration improves the temperature distribution, but does not guarantee the elimination of hot spots, highlighting the need to adjust aeration strategies in hot climates by increasing airflow to improve the dissipation of accumulated heat. Concerning the moisture content of the stored grain, both the environmental conditions and the aeration strategy significantly influence its behavior. In the absence of aeration, the moisture content in the grain exhibits fluctuations based on both time and spatial coordinates within the silo. In contrast, the implementation of aeration periods significantly modifies this behavior, creating a more uniform effect in the distribution of the moisture content of the grain within the silo. However, it is observed that aeration during May results in a progressive decrease in the moisture content of the grain, reaching a reduction of up to 1.5% from its initial value. This is due to the introduction of air with low relative humidity, which facilitates the moisture transfer from the grain to the interstitial air. While this moisture reduction helps stabilize the moisture conditions within the silo and minimizes the risks of fungal development, it is essential to regulate the aeration strategy to prevent excessive drying, which could compromise the grain quality, making it more fragile and susceptible to mechanical damage during handling and subsequent processing. Therefore, CFD use is highly recommended to adjust the aeration periods and airflow according to the specific climatic conditions of each region.

Author Contributions

Conceptualization, F.I.M.-H., and H.J.-I.; methodology, N.E.M.-S., and M.A.S.-H.; software, H.J.-I., N.L.F.-M., and N.E.M.-S.; validation, F.I.M.-H., N.E.M.-S., and H.J.-I.; formal analysis, H.J.-I., and M.A.S.-H.; investigation, F.I.M.-H.; resources, C.D.C., L.J.E., and F.J.M.R.; writing—original draft preparation, F.I.M.-H., F.J.M.R., and N.E.M.-S.; writing—review and editing, H.J.-I., F.I.M.-H., and C.D.C.; supervision, L.J.E., N.L.F.-M., and H.J.-I.; project administration, N.L.F.-M. All authors have read and agreed to the published version of the manuscript.

Funding

The APC was funded by Universidad Politécnica de Guanajuato.

Data Availability Statement

The data that support the findings of this study are available upon reasonable request from the authors.

Acknowledgments

The authors acknowledge SECIHTI’s financial support via the Postdoctoral Fellowships for the Training and Consolidation of Researchers in Mexico and TecNM for research funding. We also thank AgroArreguin for its support and facilities in obtaining experimental data.

Conflicts of Interest

The authors declare no conflicts of interest.

Nomenclature

List of Symbols
a absorptivity of galvanized steel
a v grain-air interfacial, m2/m3
a w water activity, dimensionless
c concentration of grain moisture, kg/m3
c 1 moisture concentration of the air
c A concentration of water vapor, kg/m3
c p specific heat, J/kg °C
D scalar diffusivity, m2/s
f function of the coordinates
G solar radiation incident on the silo surface, W/m2
g acceleration of gravity, m/s2
h c heat transfer coefficient, W/ m2 °C
h w convective heat transfer coefficient
M A molecular mass of water
M B molecular mass of air
M ¯ average molecular mass
k e f f Effective thermal conductivity, W/m °C
k w thermal conductivity of the silo, W/m °C
k y mass transfer coefficient, m/s
L height of the cavity, m
n normal direction
P air pressure, mmHg
P 0 volumetric generation of water by respiration, kg/m3 s
P V 0 vapor pressure, mmHg
Q 0 volumetric heat of respiration of cereal grain, J/m3 s
R radius of the cavity, m
r, θ, zcylindrical coordinates, m
t time, hours
T fluid temperature, °C
T 0 initial temperature of the grain, °C
T a m b ambient temperature, °C
T s k y sky temperature, °C
u ¯ average air velocity
X moisture of the grain on a dry basis, kg H2O/kg dry grain
x moisture of the grain on a wet basis, kg H2O/kg wet grain
x a m b ambient moisture content
x, y, zCartesian coordinates
X0Initial moisture content, kg H2O/kg dry grain
Y Absolute humidity of the air, kg H2O/kg dry air
Y0Initial absolute moisture, kgH2O/kg dry air
YiAbsolute humidity of air in the grain-air interface, kg H2O/kg dry air
Greek Symbols
β volumetric coefficient of thermal expansion, K−1
β c volumetric coefficient of mass expansion, m3/kg
γcontinuous phase
εporosity
κ permeability, m2
boundary of the calculation domain
ξ sky emissivity
ξ c steel emissivity
λ v latent heat of vaporization of water, J/kg
μ fluid viscosity, kg/m s
ρ a density of dry air, kg/m3
ρ β density of the continuous phase, kg/m3
σStefan-Boltzmann constant, W/m2 K4
ωdiscontinuous phase
Abbreviations
CFDcomputational fluid dynamics
FEMfinite element method
FEVfinite volume method
NEBnumber of boundary elements
PDEspartial differential equations
RH%relative humidity %
wbwet basis (moisture content)

Appendix A. Model Validation

To validate this model, the study by Khankari et al. [32] was used as a reference, in which a generalized mathematical model previously developed by Khankari et al. [45] is employed to analyze moisture migration in grains stored in silos. This model predicts the temperature, moisture, and airflow distribution due to natural convection in the grain under different climatic conditions. Specifically, under the conditions of St. Paul, Minnesota, various parameters related to the moisture migration of stored corn in a 5 m radius cylindrical silo with a height of 10 m were evaluated. In this analysis, it was assumed that the corn was stored starting from 1 October, with a uniform moisture content of 14% (wb), and remained in the silo for one year. In addition, Khankari et al. [32] performed simulations of the aeration process under different initial temperature conditions of the corn, considering values of 15 °C and 5 °C, representative of autumn in St. Paul, Minnesota. Their results demonstrated that grain cooling during this season is an effective strategy to stabilize storage conditions and prevent moisture accumulation, even without the need for aeration in the spring.
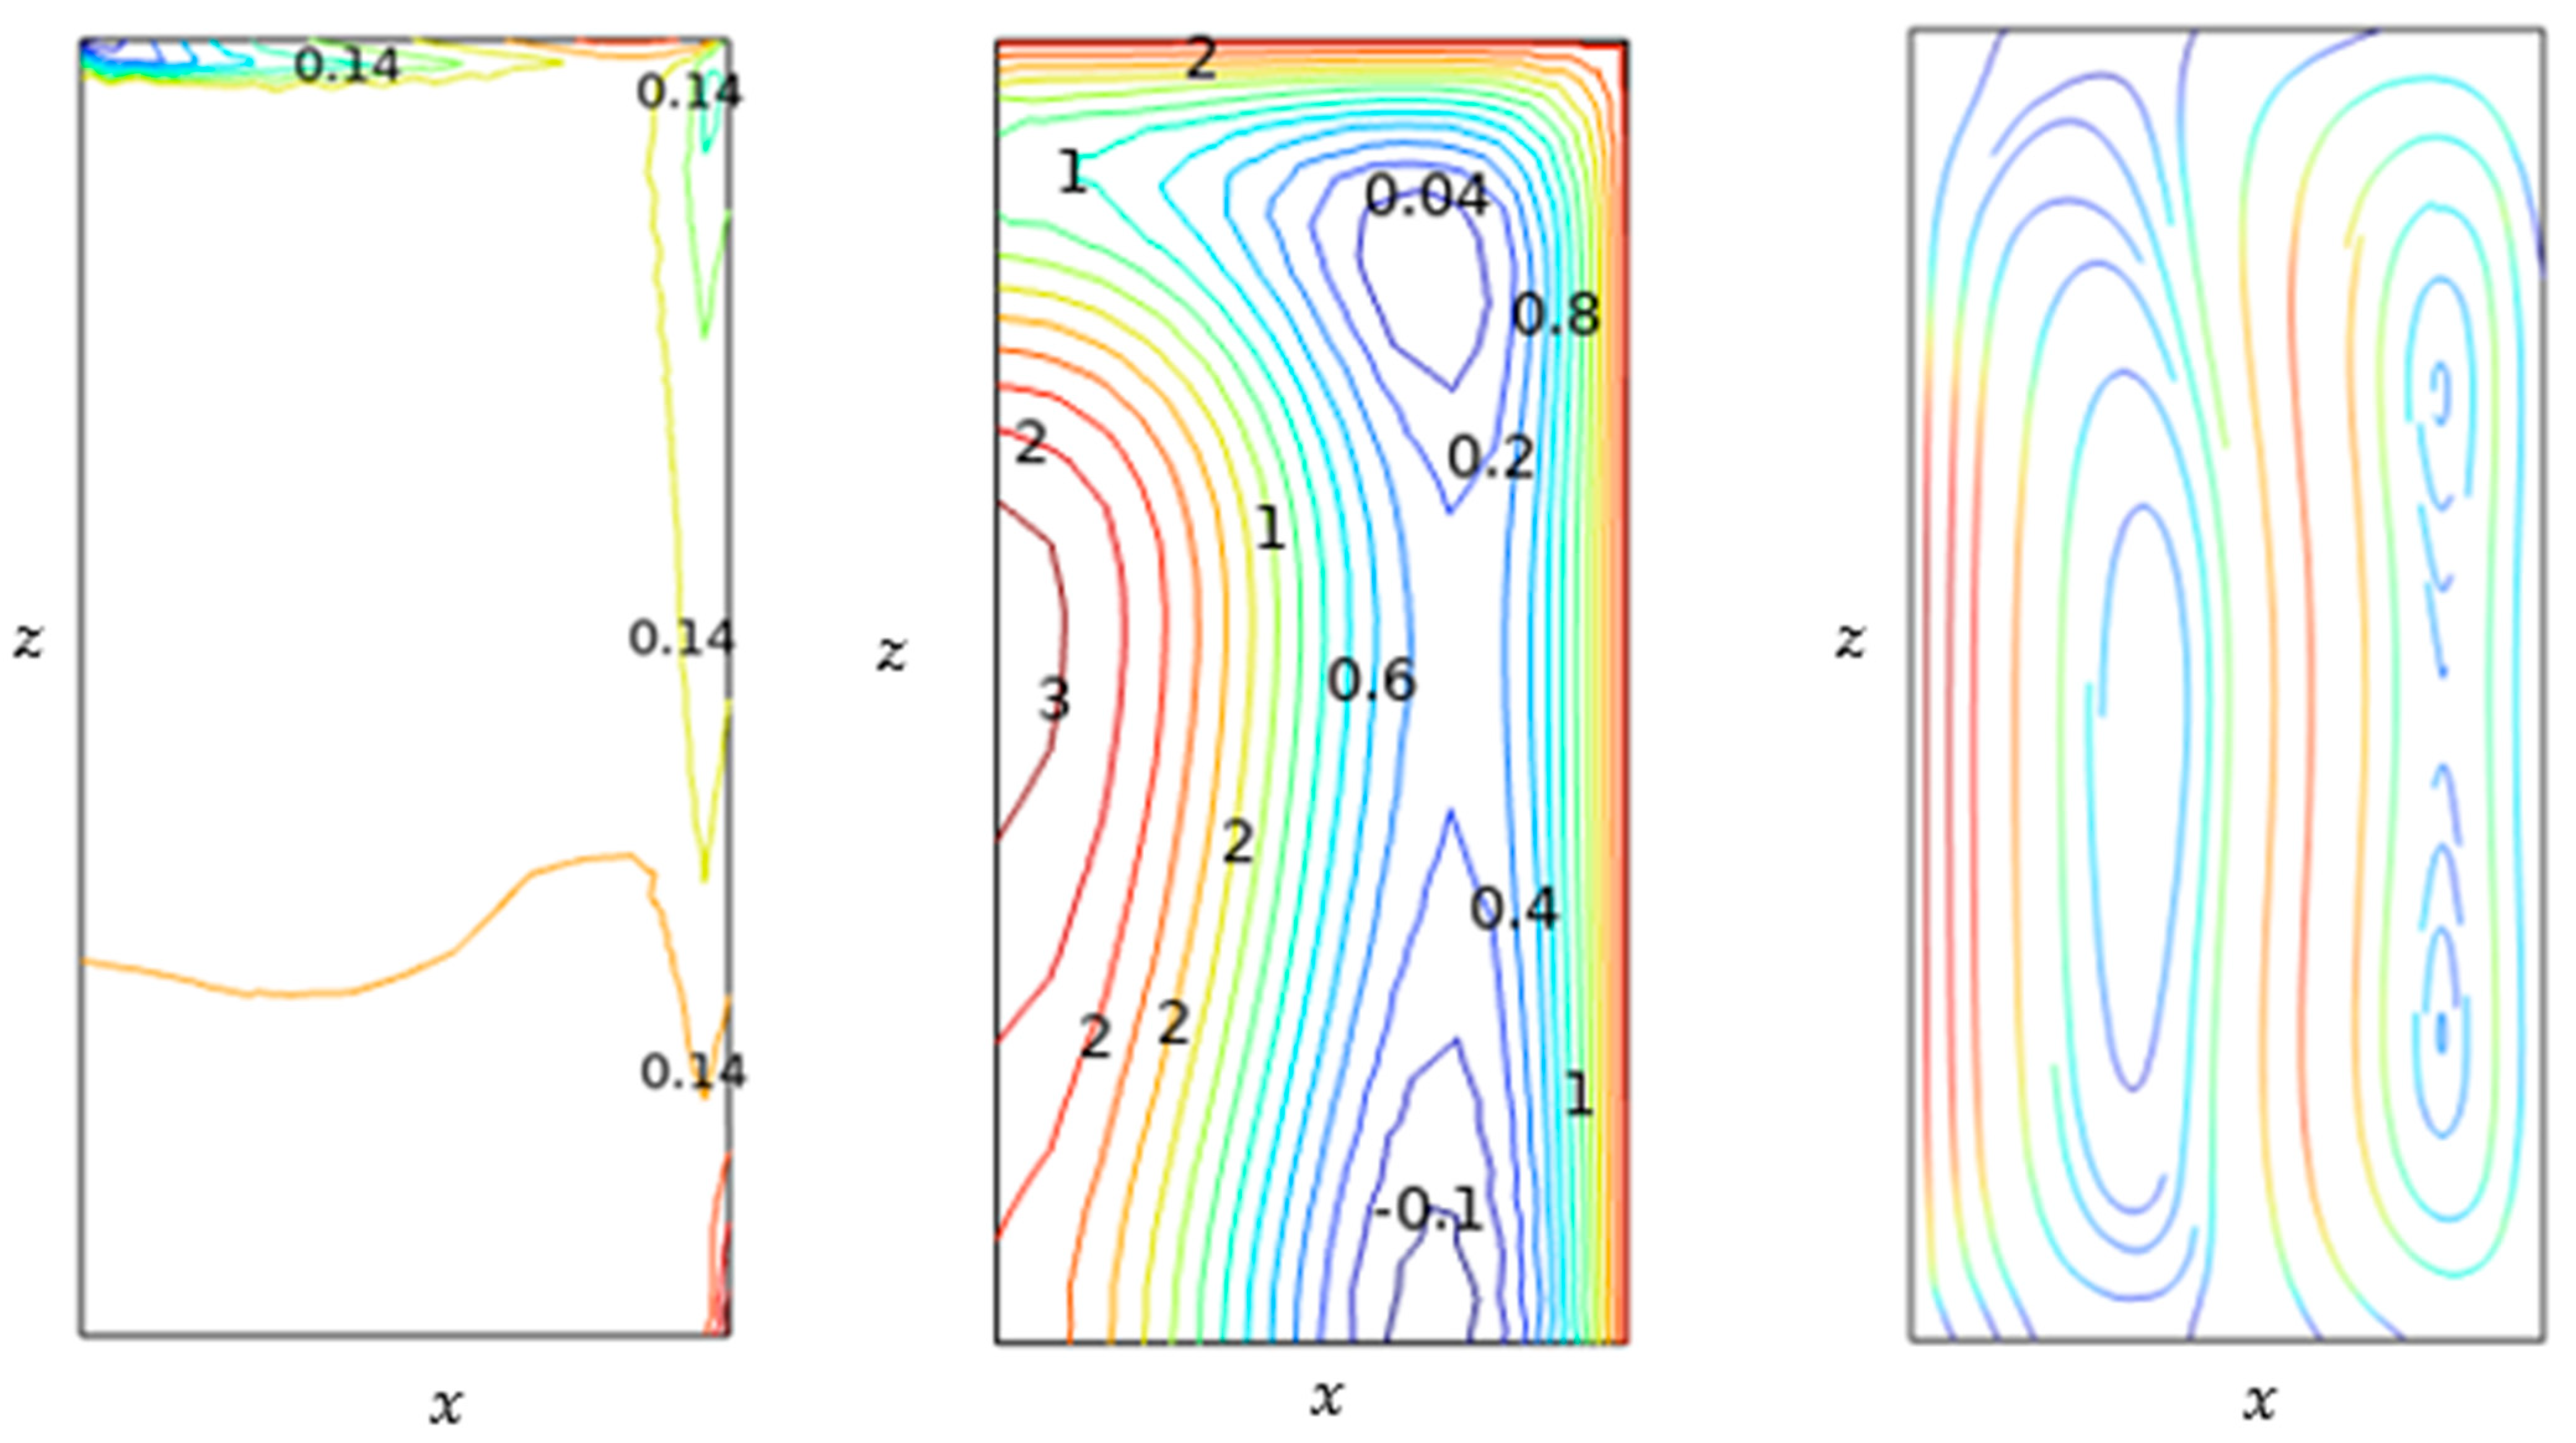
Following the same validation methodology, this work compared the results obtained with the proposed model against those reported by Khankari et al. [32]. Figure A1 and Figure A2 present the contours of the moisture content in the grain (%wb), temperature (°C), and flow function (m3/day), to analyze the effect of aeration on the grain during autumn, considering initial temperatures of 15 °C and 5 °C in corn storage. The results from both models indicate that, for an initial temperature of 15 °C, the grain temperatures remain at safe levels until spring. Figure A1 shows that the stored grain retains its initial moisture content without detecting high moisture zones at the top. Similarly, an initial temperature of 15 °C favors natural grain cooling until spring. It is also important to highlight that the low initial temperatures, along with environmental fluctuations, generate natural convection currents within the silo, allowing for a uniform distribution of heat and contributing to maintaining low temperatures throughout the entire storage volume.
Similarly, Figure A2 shows that, when the initial temperature is 5 °C, the corn’s moisture content remains stable without forming high moisture zones. Additionally, the natural convection currents inside the silo favor the cooling of the grain down to 0 °C, ensuring optimal storage conditions throughout the year without the need for implementing additional aeration periods. A notable concordance in the predictions is observed when comparing the predicted results from the mathematical model presented in this work with those reported by Khankari et al. [32]. This comparison validates the accuracy of the model. It demonstrates its ability to predict moisture migration, temperature distribution, and airflow in grains stored in silos, consolidating its applicability in similar storage conditions.
On the other hand, the validation of the daily average temperatures used in this work was presented in a study by Molina-Herrera et al. [29], in which the temperatures reported by Khankari et al. [32] for St. Paul, Minnesota, were compared with those recorded in the Bajío region of Guanajuato. Both temperatures were obtained from the preloaded data in COMSOL Multiphysics®. The reproduction of the daily average temperatures reported by Khankari et al. [32] supports the validity of using this data in the software, ensuring the reliability and accuracy of the results obtained in the simulations.
Figure A1. Distribution of moisture content (%wb), temperature profiles (°C), and flow function (m3/day), for the spring season simulation with an initial temperature of 15 °C.
Chemengineering 09 00089 g0a1
Figure A2. Distribution of moisture content (%wb), temperature profiles (°C), and flow function (m3/day), for the spring season simulation with an initial temperature of 5 °C.
Chemengineering 09 00089 g0a2

References

  1. Navarro, S.; Noyes, R.; Armitage, D.; Maier, D.E. Objectives of Aeration. In The Mechanics and Physics of Modern Grain Aeration Management; CRC Press: Boca Raton, FL, USA, 2001; pp. 25–58. [Google Scholar] [CrossRef]
  2. Casada, N.M.E.; Arthur, N.F.H.; Akdogan, N.H. Temperature Monitoring and Aeration Strategies for Stored Wheat in the Central Plains. In Proceedings of the 2002 ASAE Annual Meeting, Chicago, IL, USA, 28–31 July 2002. [Google Scholar] [CrossRef]
  3. Babangida, L.Y.; Yong, H. Design, Development and Techniques for Controlling Grains Post-Harvest Losses with Metal Silo for Small and Medium Scale Farmers. Afr. J. Biotechnol. 2011, 10, 14552–14561. [Google Scholar] [CrossRef]
  4. Rosentrater, K.A. Storage of Cereal Grains and Their Products, 5th ed.; Woodhead Publishing: London, UK, 2022. [Google Scholar] [CrossRef]
  5. Thorpe, G. Modelling Ecosystems in Ventilated Conical Bottomed Farm Grain Silos. Ecol. Model. 1997, 94, 255–286. [Google Scholar] [CrossRef]
  6. Lawrence, N.J.; Maier, N.D.E.; Stroshine, N.R.L. Three-Dimensional Transient Heat, Mass, Momentum, and Species Transfer in the Stored Grain Ecosystem: Part II. Model Validation. Trans. ASABE 2013, 56, 189–201. [Google Scholar] [CrossRef]
  7. Wu, Y.; Wu, W.; Chen, K.; Zhang, J.; Liu, Z.; Zhang, Y. Progress and Prospective in the Development of Stored Grain Ecosystems in China: From Composition, Structure, and Smart Construction to Wisdom Methodology. Agriculture 2023, 13, 1724. [Google Scholar] [CrossRef]
  8. Frisvad, J.C. Mycotoxins in Grain, Compounds Other than Aflatoxin. Trends Food Sci. Technol. 1994, 5, 235–236. [Google Scholar] [CrossRef]
  9. Madhukar, P.; Pandey, L.M.; Dixit, U.S. Post-harvest Grain Storage: Methods, Factors, and Eco-friendly Solutions. Food Control. 2025, 174, 111236. [Google Scholar] [CrossRef]
  10. Sutton, A.O.; Strickland, D.; Norris, D.R. Food Storage in a Changing World: Implications of Climate Change for Food-Caching Species. Clim. Change Responses 2016, 3, 12. [Google Scholar] [CrossRef]
  11. Lawrence, N.J.; Maier, N.D.E.; Stroshine, N.R.L. Three-Dimensional Transient Heat, Mass, Momentum, and Species Transfer in the Stored Grain Ecosystem: Part I. Model Development and Evaluation. Trans. ASABE 2013, 56, 179–188. [Google Scholar] [CrossRef]
  12. Chang, N.C.S.; Converse, N.H.H.; Steele, N.J.L. Modeling of Temperature of Grain During Storage with Aeration. Trans. ASAE 1993, 36, 509–519. [Google Scholar] [CrossRef]
  13. Balzi, U.; Gastón, A.; Abalone, R. Efecto de la Convección Natural en la Distribución de Temperatura y Migración de Humedad en Granos Almacenados en Silos. Asoc. Argent. Mec. Comput. 2009, XXVII, 10–13. [Google Scholar]
  14. Novoa-Muñoz, F. Simulation of the Temperature of Barley During its Storage in Cylindrical Silos. Math. Comput. Simul. 2018, 157, 1–14. [Google Scholar] [CrossRef]
  15. Wang, D.; Liu, K.; Zhang, X. Modeling of a Three-Dimensional Dynamic Thermal Field Under Grid-Based Sensor Networks in Grain Storage. IISE Trans. 2018, 51, 531–546. [Google Scholar] [CrossRef]
  16. Andrade, N.E.T.; Couto, N.S.M.; Queiroz, N.D.M.; Faroni, N.L.R.A.; De Sousa Damasceno, N.G. Three-Dimensional Simulation of the Temperature Variation in Corn Stored in Metallic Bin. In Proceedings of the 2002 ASAE Annual Meeting, Chicago, IL, USA, 28–31 July 2002. [Google Scholar] [CrossRef]
  17. Lawrence, J.; Maier, D.E. Three-Dimensional Airflow Distribution in a Maize Silo with Peaked, Levelled, and Cored Grain Mass Configurations. Biosyst. Eng. 2011, 110, 321–329. [Google Scholar] [CrossRef]
  18. Panigrahi, S.S.; Singh, C.B.; Fielke, J. CFD Modelling of Physical Velocity and Anisotropic Resistance Components in a Peaked Stored Grain with Aeration Ducting Systems. Comput. Electron. Agric. 2020, 179, 105820. [Google Scholar] [CrossRef]
  19. Montross, N.M.D.; Maier, N.D.E.; Haghighi, N.K. Validation of a Finite Element Stored Grain Ecosystem Model. Trans. ASAE 2002, 45, 1465. [Google Scholar] [CrossRef]
  20. Lawrence, N.J.; Maier, N.D.E. Aeration Strategy Simulations for Wheat Storage in the Sub-Tropical Region of North India. Trans. ASABE 2011, 54, 1395–1405. [Google Scholar] [CrossRef]
  21. Barreto, A.A.; Abalone, R.; Gastón, A. Mathematical Modelling of Momentum, Heat, and Mass Transfer in Grains Stored in Silos: Part II: Model Application. Lat. Am. Appl. Res. 2013, 43, 385–391. [Google Scholar]
  22. Zheng, D.; Li, L.; Chen, G.; Zhou, Y.; Liu, K. Numerical Study of Low-Temperature Ventilation Drying in a Wheat Grain Silo Considering Non-Uniform Porosity Distribution. Appl. Sci. 2023, 14, 96. [Google Scholar] [CrossRef]
  23. Araujo, M.E.V.; Barbosa, E.G.; Martins, M.A.; Corrêa, P.C.; Barbosa, E.G.; Araújo, R.S.L.; Gomes, F.A. CFD Analysis of Different Aeration Ducts on Temperature and Airflow in Stored Maize. J. Agric. Sci. 2019, 11, 301. [Google Scholar] [CrossRef]
  24. Iguaz, A.; Arroqui, C.; Esnoz, A.; VíRseda, P. Modelling and Simulation of Heat Transfer in Stored Rough Rice with Aeration. Biosyst. Eng. 2004, 89, 69–77. [Google Scholar] [CrossRef]
  25. De Carvalho Lopes, D.; Martins, J.H.; Filho, A.F.L.; De Castro Melo, E.; De Barros Monteiro, P.M.; De Queiroz, D.M. Aeration Strategy for Controlling Grain Storage Based on Simulation and on Real Data Acquisition. Comput. Electron. Agric. 2008, 63, 140–146. [Google Scholar] [CrossRef]
  26. Jian, F.; Jayas, D.S.; White, N.D. Temperature Fluctuations and Moisture Migration in Wheat Stored for 15 Months in a Metal Silo in Canada. J. Stored Prod. Res. 2008, 45, 82–90. [Google Scholar] [CrossRef]
  27. Khatchatourian, O.; De Oliveira, F. Mathematical Modelling of Airflow and Thermal State in Large Aerated Grain Storage. Biosyst. Eng. 2006, 95, 159–169. [Google Scholar] [CrossRef]
  28. Jiménez-Islas, H.; Navarrete-Bolaños, J.L.; Botello-Álvarez, E. Numerical Study of the Natural Convection of Heat and 2-D Mass of Grain Stored in Cylindrical Silos. Agrociencia 2004, 38, 325–342. [Google Scholar]
  29. Molina-Herrera, F.I.; Quemada-Villagómez, L.I.; Calderón-Ramírez, M.; Martínez-González, G.M.; Jiménez-Islas, H. Modeling Temperature and Moisture Dynamics in Corn Storage Silos: A Comparative 2D and 3D Approach. Modelling 2025, 6, 7. [Google Scholar] [CrossRef]
  30. Valle, F.J.M.; Gastón, A.; Abalone, R.M.; De la Torre, D.A.; Castellari, C.C.; Bartosik, R.E. Study and Modelling the Respiration of Corn Seeds (Zea mays L.) During Hermetic Storage. Biosyst. Eng. 2021, 208, 45–57. [Google Scholar] [CrossRef]
  31. Quemada-Villagómez, L.I.; Molina-Herrera, F.I.; Carrera-Rodríguez, M.; Calderón-Ramírez, M.; Martínez-González, G.M.; Navarrete-Bolaños, J.L.; Jiménez-Islas, H. Numerical Study to Predict Temperature and Moisture Profiles in Unventilated Grain Silos at Prolonged Time Periods. Int. J. Thermophys. 2020, 41, 52. [Google Scholar] [CrossRef]
  32. Khankari, N.K.K.; Morey, N.R.V.; Patankar, N.S.V. Application of a Numerical Model for Prediction of Moisture Migration in Stored Grain. Trans. ASAE 1995, 38, 1789–1804. [Google Scholar] [CrossRef]
  33. Jiang, N.S.; Jofriet, N.J.C. Finite Element Prediction of Silage Temperatures in Tower Silos. Trans. ASAE 1987, 30, 1744–1750. [Google Scholar] [CrossRef]
  34. Jofriet, J.C.; Jiang, S.; Tang, S.W. Finite Element Prediction of Temperature Gradients in Walls of Cylindrical Concrete Storage Structures. Can. J. Civ. Eng. 1991, 18, 12–19. [Google Scholar] [CrossRef]
  35. Abalone, R.; Gastón, A.; Cassinera, R.; Lara, M. Modelización de la Distribución de la Temperatura y Humedad en Granos Almacenados en Silos. Mecánica Comput. Asoc. Argent. 2006, XXV, 233–247. [Google Scholar]
  36. Dick, E. Introduction to Finite Volume Methods in Computational Fluid Dynamics. In Computational Fluid Dynamics; Springer: Berlin/Heidelberg, Germany, 2008; pp. 275–301. [Google Scholar] [CrossRef]
  37. Moukalled, F.; Mangani, L.; Darwish, M. The Finite Volume Method in Computational Fluid Dynamics; Fluid Mechanics and Its Applications; Springer: Cham, Switzerland, 2015. [Google Scholar] [CrossRef]
  38. Carrera-Rodríguez, M.; Martínez-González, G.M.; Navarrete-Bolaños, J.L.; Botello-Álvarez, J.E.; Rico-Martínez, R.; Jiménez-Islas, H. Transient Numerical Study of the Effect of Ambient Temperature on 2-D Cereal Grain Storage in Cylindrical Silos. J. Stored Prod. Res. 2011, 47, 106–122. [Google Scholar] [CrossRef]
  39. Markowski, M.; Bialobrzewski, I.; Bowszys, J.; Suchecki, S. Simulation of Temperature Distribution in Stored Wheat Without Aeration. Dry. Technol. 2007, 25, 1527–1536. [Google Scholar] [CrossRef]
  40. Alagusundaram, N.K.; Jayas, N.D.S.; White, N.N.D.G.; Muir, N.W.E. Three-Dimensional, Finite Element, Heat Transfer Model of Temperature Distribution in Grain Storage Bins. Trans. ASAE 1990, 33, 577–584. [Google Scholar] [CrossRef]
  41. Trombete, F.M.; De Ávila Moraes, D.; Porto, Y.D.; Santos, T.B.; Direito, G.M.; Fraga, M.E.; Saldanha, T. Determination of Aflatoxins in Wheat and Wheat By-Products Intended for Human Consumption, Marketed in Rio de Janeiro, Brazil. J. Food Nutr. Res. 2014, 2, 671–674. [Google Scholar] [CrossRef]
  42. Arlindo, M.A.; Ivano, A.D.; Antonio, C.B.N.; Beethoven, G.X.A.; Guiliano, R.A.; Mateus, M.S. Development of an Automated System of Aeration for Grain Storage. Afr. J. Agric. Res. 2016, 11, 4293–4303. [Google Scholar] [CrossRef]
  43. Lopes, D.d.C.; Neto, A.J.S.; Júnior, R.V. Comparison of Equilibrium Models for Grain Aeration. J. Stored Prod. Res. 2014, 60, 11–18. [Google Scholar] [CrossRef]
  44. Mirko, B.; Ljiljana, B.; Milivoj, R.; Ivan, P.; Zoran, S. Air Velocity Distribution During the Grain Aeration in Silo. DOAJ 2015, 19, 123–126. Available online: https://doaj.org/article/88d812723fc347d0a57f366620506fa4 (accessed on 5 November 2024).
  45. Khankari, N.K.K.; Morey, N.R.V.; Patankar, N.S.V. Mathematical Model for Moisture Diffusion in Stored Grain Due to Temperature Gradients. Trans. ASAE 1994, 37, 1591–1604. [Google Scholar] [CrossRef]
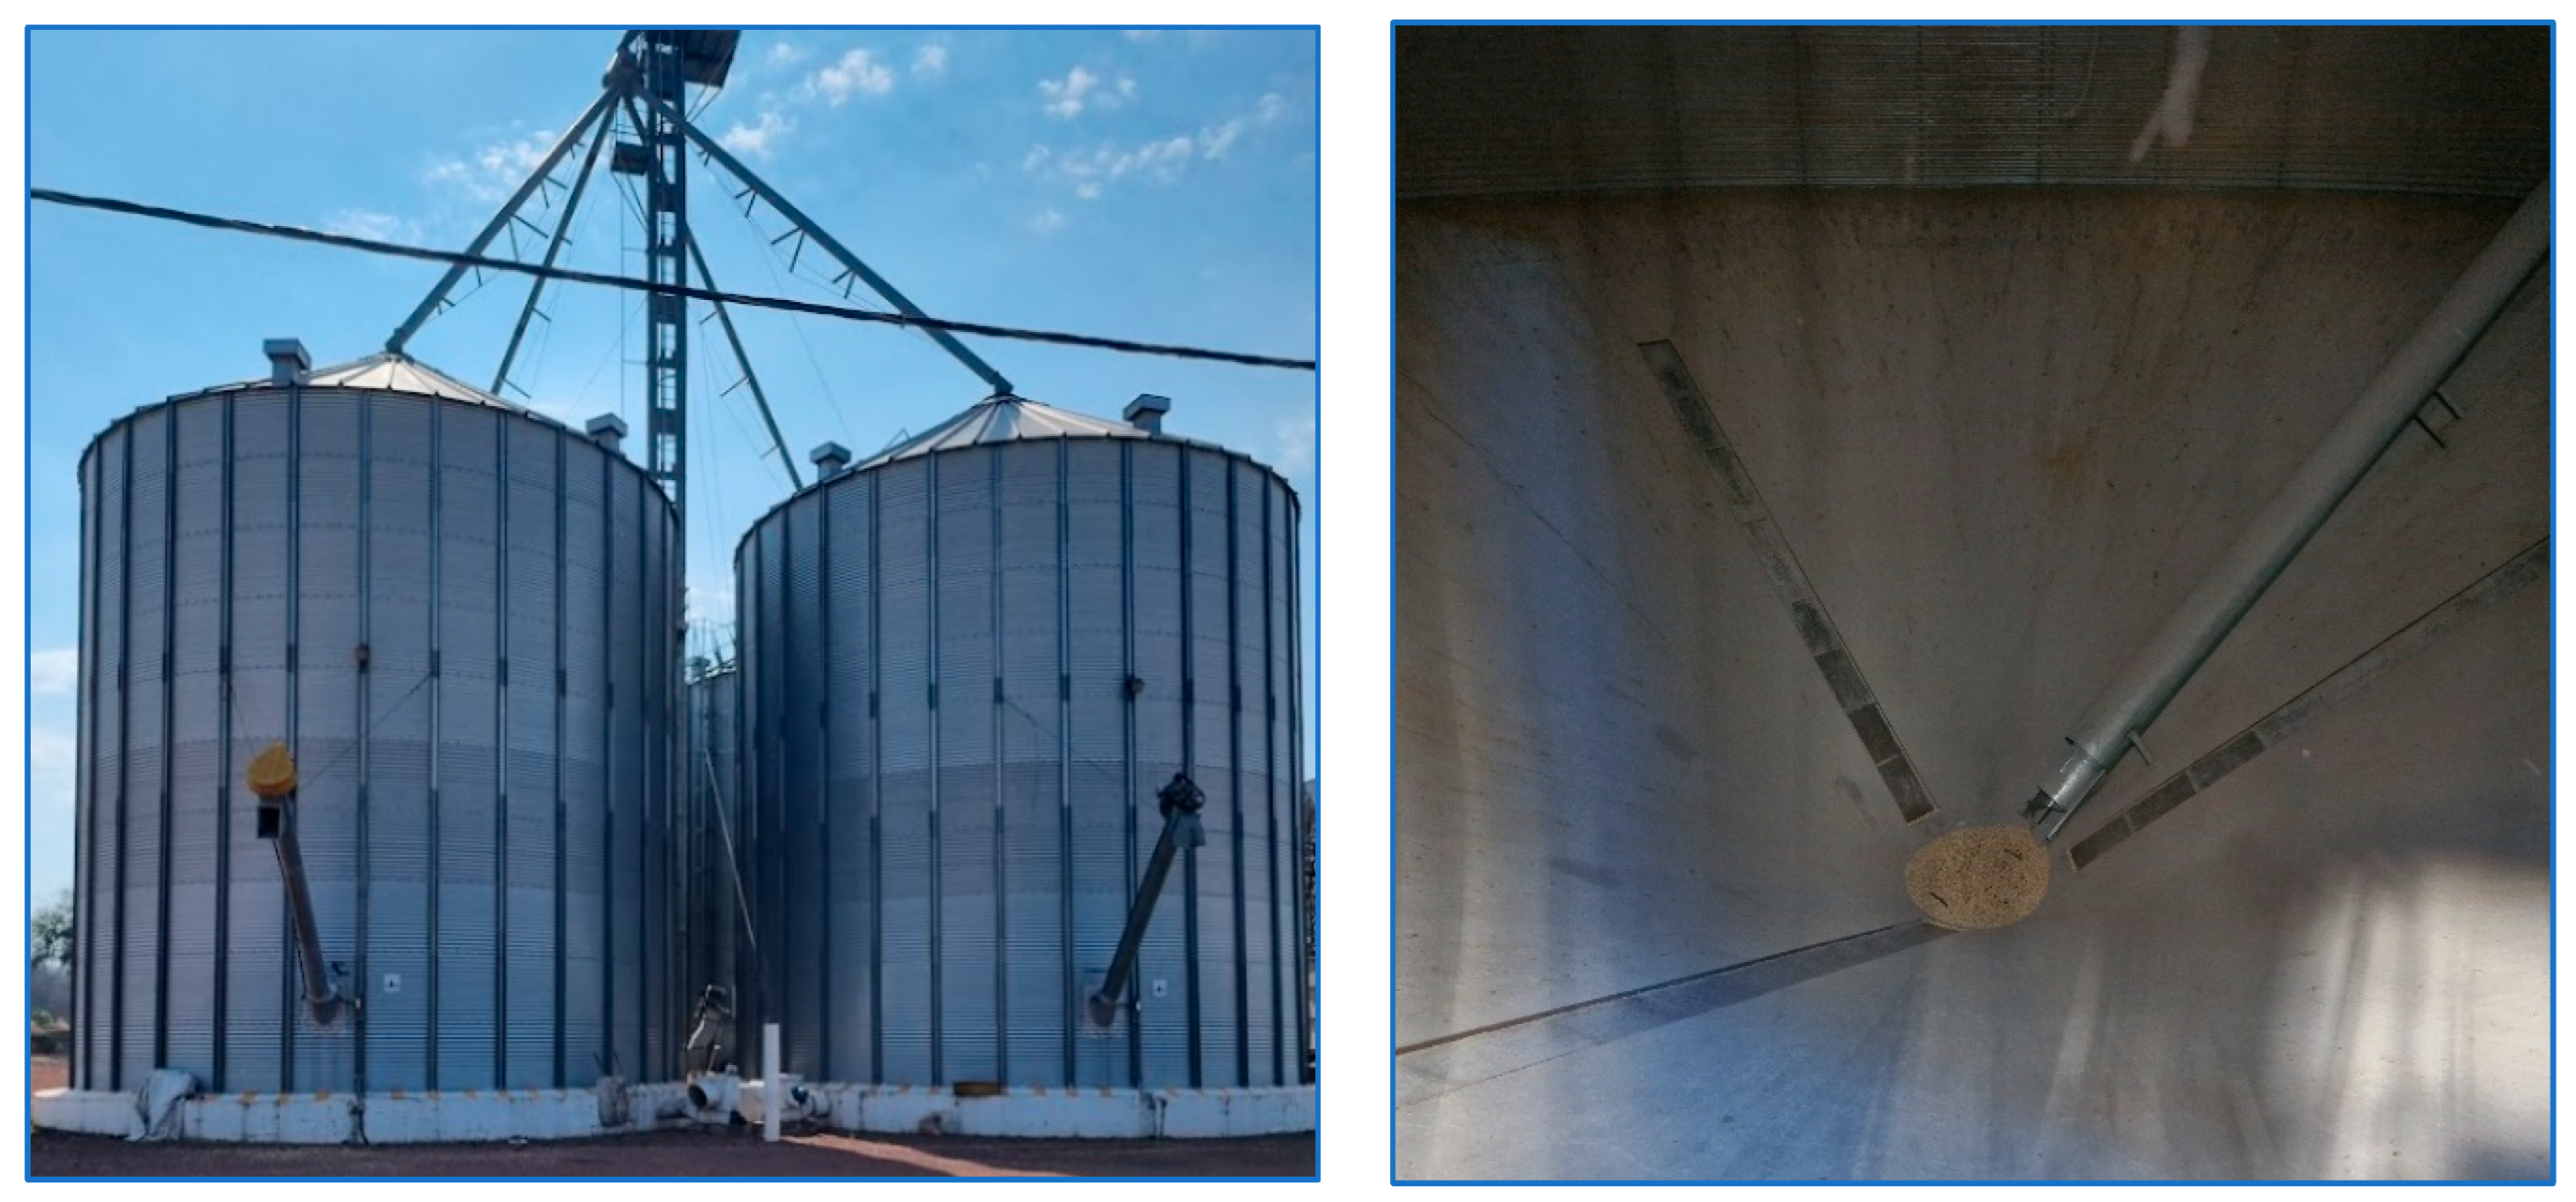
Figure 2. Geometric system and computational domain.
Chemengineering 09 00089 g002
Figure 3. Recorded climatological data for the state of Guanajuato during the months of the year.
Chemengineering 09 00089 g003
Figure 4. Effect of mesh size on the prediction of temperature profiles at the center of the silo without aeration.
Chemengineering 09 00089 g004
Figure 5. Temperature contours (in °C) during storage in January without aeration.
Chemengineering 09 00089 g005
Figure 6. Temperature contours (in °C) during storage in May without aeration.
Chemengineering 09 00089 g006
Figure 7. Optimal humidity and temperature conditions for developing fungi and insects during corn storage.
Chemengineering 09 00089 g007
Figure 8. Temperature profiles for different aeration airflows at the center of the silo.
Chemengineering 09 00089 g008
Figure 9. Temperature contours (in °C) during accumulated aeration hours in January.
Chemengineering 09 00089 g009
Figure 10. Temperature contours (in °C) during accumulated aeration hours for May.
Chemengineering 09 00089 g010
Figure 11. Effect of increased airflow (m/s) entering the silo during accumulated aeration hours in May on the temperature (in °C).
Chemengineering 09 00089 g011
Figure 12. Temperature profiles at different radial positions during one day of storage, considering periods with and without aeration for January and May.
Chemengineering 09 00089 g012
Figure 13. Temperature profiles at different axial positions during a day of storage, considering periods with and without aeration for January and May.
Chemengineering 09 00089 g013
Figure 14. Effect of natural and forced convection on the temperature (in °C) distribution at the end of January and May.
Chemengineering 09 00089 g014
Figure 15. Thermal response of the grain versus accumulated aeration hours during January and May.
Chemengineering 09 00089 g015
Figure 16. Distribution of the moisture content of corn grain at different radial positions considering periods (a) without aeration (b) with aeration, during May.
Chemengineering 09 00089 g016
Table 1. Description of variables and symbols used in the mathematical model.
VariableSymbol
Specific heat c p
Fluid density ρ γ
Grain density ρ ω
Air velocity u γ
Temperature T
Moisture content in the air c γ
Moisture content in the grain c ω
Diffusivity of water in air D 1
Diffusivity of water in the grain D 2
Effective thermal conductivity k e f f
Grain-air interface a v
Absolute humidity grain-air interface Y i
Mass transfer coefficient k y
Fluid viscosity μ
Permeability κ
Table 2. Physical and thermal properties used in the model.
Boussinesq approximation ρ γ = ρ 0 1 β T T 0 β c C C 0
β c = R T M A M B M ¯
Respiration heat Q 0 = 1.24793 × 10 4 A / 1 + e x p B t / 86400 A / 2
A = 8.92 × 10 6 e x p ( 13.4983161 + 0.21853298 T 0.0039572 T 2 ) e x p ( 72.06 ( x / ( x + 1 ) ) ) + 20.96 t a n h ( 62.4425 ( x / ( x + 1 ) ) )
B = 4.76 × 10 7 e x p ( 0.80207394 + 0.00898836 T 0.0049439 T 2 ) e x p ( 53.9681888 ( x / ( x + 1 ) ) ) + 7.737674909 t a n h ( 0.048168 ( x / ( x + 1 ) ) )
4.4 < T < 37.8   ° C
0.12 < x < 0.21
Water generation P 0 = 2.74181 × 10 8 Q 0
Sorption isotherm a w = 1 e x p 0.0031 T + 21.57609 100 x 1.6 1.3   ° C < T < 48.9   ° C  
0.2 < a w < 0.8
Water vapor pressure P V 0 = e x p 18.304 3816.44 T 277.02 10   ° C < T < 150   ° C
Equilibrium moisture at the interface Y i = 18 P V 0 a w 29 P P V 0 a w
Jiménez-Islas et al. [28].
Table 3. Description of the physical and thermal variables used in the mathematical model.
VariableSymbol
Reference concentration C 0
Water activity a w
Molecular mass of water M A
Molecular mass of air M B
Average molecular mass M ¯
Volumetric generation of water by respiration P 0
Vapor Pressure P V 0
Universal gas constantR
Volumetric heat of respiration of cereal grain Q 0
Reference temperature T 0
volumetric coefficient of thermal expansion, β
volumetric coefficient of mass expansion β c
Table 4. Thermodynamic properties of corn and air used for the simulations.
ParametersValue
Corn parameters aInitial moisture content of corn
Initial temperature
Density
Specific heat
Thermal conductivity
Effective thermal conductivity
Permeability
Porosity
14.5%
20 °C
760 kg/m3
1780 kJ/kg K
0.13 W/m K
0.089W/m K
3.5 × 10⁻⁹ m2
0.38
Air parameters aReference temperature
Specific heat
Thermal conductivity
Viscosity
Heat transfer coefficient
Mass transfer coefficient
Interfacial area
Relative humidity (%)
25 °C
972.92 kJ/kg K
0.023697 W/m K
1.7810−5 Pa s
15 W/m2 K
1.00 × 10⁻⁴ m/s
760 m2/m3
50
a Khankari et al. [32].
Table 5. Heat and mass transfer model parameters.
Parameters for the Thermal Model
Convective heat transfer coefficient
Sky temperature #
Sky emissivity #
Steel emissivity #
Steel absorptivity #
Stefan-Boltzmann constant
h w = 15
σ T C 4 = ξ c σ T a m b 4
ξ = 0.82
ξ c = 0.28
a = 0.89
σ = 5.670374419 × 10⁻⁸ W m−2 K−4
Parameters for the mass transfer model
Water diffusivity in air *
Water diffusivity in corn
Mass transfer coefficient *
Particle diameter
Interfacial area *
2.437 × 10⁻⁵ m2/s
2.8766 × 10⁻¹¹ m2/s
1.00 × 10⁻⁴ m/s
0.005 m
744 m2/m3
* Jiménez-Islas et al. [28]; # Abalone et al. [35].
Table 6. Effect of mesh size on the prediction of maximum and minimum temperatures at the center of the silo with and without aeration periods, and computation times for both cases.
Without AerationWith AerationWithout AerationWith Aeration
Mesh SizeNEBTmax
°C
Tmin
°C
Tmax
°C
Tmin
°C
Computation Time (min)Computation Time (min)
Normal
Fine
Finer
Extra Fine
1813
3031
5938
14,729
29.457
32.915
34.014
34.347
17.953
17.948
17.966
17.960
18.984
18.983
19.064
19.072
15.654
16.046
16.236
16.248
14.58
18.37
45.26
68.58
11.29
14.54
33.30
57.40
Table 7. Temperature and relative humidity conditions for developing the most significant insect species during corn storage.
InsectOptimal Temperature (°C)Optimal Relative Humidity (%)
Maize weevil
Indian meal moth
Grain beetle
Saw-toothed grain beetle
Lesser grain borer
Larger grain borer
Dust mite
25–30
30–35
20–25
20–25
18–28
20–35
25–30
85–99
80–95
78–85
75–90
70–85
80–90
85–95
Trombete et al. [41].
Table 8. Temperature and relative humidity conditions for developing the most significant fungal species during corn storage.
FungusOptimal Temperature (°C)Optimal Relative Humidity (%)
Aspergillus flavus
Aspergillus niger
Penicillium spp.
Fusarium spp.
Cladosporium spp.
Rhizopus spp.
Mucor spp.
25–30
30–35
20–25
20–25
18–28
20–30
25–30
85–99
80–95
78–85
78–90
70–85
80–90
85–95
Trombete et al. [41].
Disclaimer/Publisher’s Note: The statements, opinions and data contained in all publications are solely those of the individual author(s) and contributor(s) and not of MDPI and/or the editor(s). MDPI and/or the editor(s) disclaim responsibility for any injury to people or property resulting from any ideas, methods, instructions or products referred to in the content.