Abstract
Crude distillation units operate as the most energy-intensive refinery operations and generate substantial carbon dioxide emissions. This research models the crude distillation system through its three main components: the atmospheric distillation unit, the naphtha stabilisation unit, and the vacuum distillation unit. The simulation platform Aspen HYSYS version 14.1 enabled optimisation of the preflash drum under product quality constraints, and the analysis included pinch analysis techniques and techno-economic evaluation. The optimisation results demonstrated an 8.95% reduction in atmospheric furnace duty, a 7.38% decrease in total hot utility consumption with the crude distillation system, and an increase in heat recovery capability from 35.57% to 42.71%. Although the preflash process alone decreases profitability because of increased steam demand, combining preflash operation with heat recovery measures maintains both energy conservation and favourable economic performance. The study shows that refinery optimisation requires treating the crude distillation system as a fully integrated process. This approach offers effective strategies to improve energy performance and reduce carbon dioxide emissions while sustaining economic viability. The work differs from previous studies by evaluating the entire distillation system as an integrated sequence and demonstrating how preflash optimisation affects overall energy demand, heat-recovery potential, and economic outcomes while maintaining product quality.
1. Introduction
Petroleum fuels continue to play a central role in meeting global energy demand [1]. Their production, however, remains energy-intensive and contributes significantly to operating costs and carbon dioxide (CO2) emissions [2,3]. Among refinery units, the crude distillation unit (CDU) is particularly important: it is the first major processing stage and also one of the largest single consumers of energy [4]. Recent assessments suggest that CDUs may account for roughly one-fifth of a refinery’s total energy use [5], underscoring the value of exploring both operational and structural improvements that reduce energy demand.
Several approaches for improving CDU efficiency have been proposed. Work by Abo-Mousa [6] has highlighted the benefits of enhanced heat-recovery arrangements, while Prestigiacomo et al. [7] demonstrated that solar-assisted heat integration can support decarbonisation in crude distillation. Broader refinery-level strategies, including the organic-Rankine-Cycle (ORC)-based waste–heat utilisation [8,9,10] and emission-reduction frameworks for process integration [11,12], further illustrate the increasing emphasis on sustainability within refining operations.
Process simulation tools have encouraged more detailed studies of distillation performance. Aspen HYSYS is widely used to examine process behaviour and support optimisation [13,14,15]. In parallel, data-driven methods—such as grey-box modelling [16] and machine-learning techniques for predicting cut-points and volumetric flows [17,18]—have expanded the range of available optimisation strategies. Improvements in heat-exchanger networks, often based on pinch analysis tools including Aspen Energy Analyzer, have also shown promising results when retrofitted to existing refineries [19]. Advanced modelling studies have also been applied to characterise complex multiphase flow behaviour in petroleum systems, as shown by Hong et al. [20], underscoring the continuing importance of accurate simulation frameworks in refinery optimisation.
Within the CDU, the atmospheric distillation unit (ADU) remains the core section. It is supported by the crude preheat train, desalter, atmospheric furnace, and atmospheric distillation column (ADC) [4]. Depending on refinery configuration, a naphtha stabilisation unit (NSU) and vacuum distillation unit (VDU) may also form part of the CDU. One option for reducing ADU furnace duty is the installation of a preflash drum or column. In a preflash system, volatile components are partially vaporised—typically near 200 °C and close to atmospheric pressure—so that only a reduced-flow liquid enters the atmospheric furnace [1,4,21]. This arrangement helps lower furnace energy use, enables smaller furnace designs, and can reduce CO2 emissions associated with the separation task.
The effectiveness of a preflash unit is governed by operating temperature and by the tray location at which the vapour enters the ADC. These variables influence the column’s hydraulic behaviour, internal energy balance, and downstream heating requirements [1,4]. Earlier optimisation studies—such as those conducted by Ledezma-Martínez et al. [1,21] and Durrani et al. [22]—focused mainly on the ADU and did not explore how preflash conditions affect product quality or performance across the entire CDU. Other contributions have examined heat integration or economic performance independently [23,24], yet without explicitly evaluating how preflash optimisation influences all CDU units simultaneously. The economic consequences of preflash operation, including its effect on profitability, have also received limited treatment in earlier work.
Heat integration is commonly used to improve refinery energy performance [23,24]. In CDUs, much of the potential lies in the crude preheat train, where heat from hot product, pump-around (PA), and column-overhead streams can be recovered [4]. Pinch analysis provides a framework for identifying the maximum heat that can be internally recovered and the minimum utility requirements achievable at a given temperature approach [3,23]. For crude systems, ΔT_min values of about 20 °C are typically selected to balance utility savings with exchanger capital cost [25,26]. Economic assessment then determines the feasibility of alternative operating or retrofit scenarios [27].
Although CDUs have been widely studied, no previous work has evaluated preflash operation at the scale of a fully integrated CDU—comprising the ADU, NSU, and VDU—while simultaneously considering energy performance, heat-recovery potential, product-quality preservation, and economic outcomes. Most existing studies evaluate the ADU in isolation, meaning it remains unclear whether an optimisation intended to reduce ADU furnace duty necessarily produces a benefit when the entire CDU system is considered.
The present work addresses this gap by modelling the CDU as an integrated system and by examining how an optimised preflash drum influences (i) total hot utility demand, (ii) the maximum recoverable heat through heat integration, and (iii) the economic viability of the CDU, while ensuring that product-quality specifications remain within expected limits. A CDU without preflash is simulated first to establish a reference case, followed by the introduction of an optimised preflash drum. The combined evaluation of energy, heat-integration potential, and economic impact provides a more complete understanding of preflash optimisation across the entire CDU system.
2. Research Methodology
2.1. Materials
The software Aspen HYSYS serves as a tool for modelling and optimisation of oil and gas and petrochemical operations [28,29]. The researchers employed Aspen HYSYS v14.1 to create a simulation model of the CDU. The crude oils were characterised using assay-based true boiling point (TBP) data published by Equinor for the Ekofisk [30] and Johan Sverdrup blends [31] (Tables S1 and S2). Aspen HYSYS Oil Manager automatically generated pseudo-components from these TBP curves, and all simulations in this study were performed using these pseudo-components rather than simplified generic hydrocarbon cuts.
A CDU capacity of 244,000 BPD was assumed, obtained by blending 119,560 BPD of Ekofisk (49%) and 124,440 BPD of Johan Sverdrup (51%). The blended crude contains less than 0.5 wt% sulphur according to the assay data. The Aspen HYSYS Oil Manager software produced hydrocarbon fractions from C1 to C20+ through true boiling point (TBP) curve analysis to achieve accurate property predictions and cut-point behaviour (Table 1 and Table 2). The Peng–Robinson equation of state was chosen because it provides reliable and efficient thermodynamic property modelling for complex hydrocarbon blends [32,33].

Table 1.
Expected yields of ADC products, obtained using Aspen HYSYS Oil Manager.
Table 2.
Expected yields of VDU products obtained using Aspen HYSYS Oil Manager.
2.2. Modelling a Standard CDU in Steady State (Reference Case, No Preflash)
The crude oil received preheating treatment before entering the ADU while water (7 vol%) was added to decrease viscosity and dissolve salts for desalting purposes [4,34]. The blended crude entered the desalter at 400 kPa and 27 °C before the desalter produced dummy vapour and desalted crude and brine at 120 °C (Table S1). The design basis for heat exchanger pressure drop was established at 50 kPa according to Sinnott and Towler [25]. The desalted crude received preheating treatment before entering the atmospheric furnace to reach 380 °C and 251 kPa for ADU feed. The ADU feed temperature operated at 300 °C in this study to represent lighter blends although industrial units typically run at 340–360 °C [4]. The simulation results from Aspen HYSYS Aspen matched the TBP-based assay data which led to the selection of 300 °C as the feed temperature for this study (Tables S1 and S2 and Table 1 and Table 2). The CDU process flow diagram without preflash appears in Figure S1 (Supplementary Material).
The Aspen HYSYS simulation of the ADU used 50 stages to model the unit. The ADU used side strippers at trays 10, 20, and 30 to extract kerosene, diesel, and AGO while PAs operated for kerosene, diesel, AGO, LVGO, and HVGO, and stripping steam was applied to the ADU and VDU bottoms [1,4,21]. The modelling parameters for the simulation appear in Table S3 while Table S4 contains information about tray positions and steam flow rates and PA energy consumption. The ADU generated six output streams which included off-gas and naphtha from the condenser and kerosene/diesel/AGO from the side strippers and atmospheric residue from the bottom [4,14]. The product rate specifications maintained the desired production levels for naphtha and kerosene and diesel and AGO (Table 1 and Table 2).
The naphtha stabilisation column (NSC) operated at 1825 kPa and ~121 °C with 30–40 stages to stabilise light naphtha while producing liquified petroleum gas (LPG) and stabilised naphtha [4,14,34,35]. The NSC design used in the simulation model contains the information presented in Table 3. The VDU received atmospheric residue which underwent steam dilution and heating to 404 °C at 24 kPa to prevent thermal cracking [4,34,35]. The VDU generated vacuum gas and LVGO and HVGO and vacuum residue as its primary output streams according to Table 4. The system maintained LVGO and HVGO production rates at their target levels for reproducibility purposes.
Table 3.
Data used to model NSU, adopted from standard CDU modelling practise [4,14,34,35].
Table 4.
Data used to model vacuum distillation column (VDC) adopted from standard CDU/VDC modelling practice [4,34,35].
The system tracked product quality throughout the optimisation process. The simulated properties of naphtha (IBP 15–200 °C) and kerosene (200–250 °C) and diesel (250–350 °C) and AGO (350–370 °C) boiling ranges remained unchanged after optimisation, thus preserving their original quality [1,14,21].
2.3. Modelling a CDU with a Preflash Drum and Optimisation Strategy
The CDU system with preflash drum operates according to the configuration shown in Figure 1. The process flow diagram was developed by the authors through simulation in Aspen HYSYS and was not adapted from any previously published case study. The preflash operated as a three-phase separator at 220 °C and 301 kPa. The preflash liquid stream received heat treatment in the furnace to achieve 251 kPa and 380 °C before entering the main ADU as feed. The Aspen HYSYS “Spreadsheet” and “Case Studies” tools performed hot utility demand evaluations by component for each scenario based on the breakdown presented in Table S4.
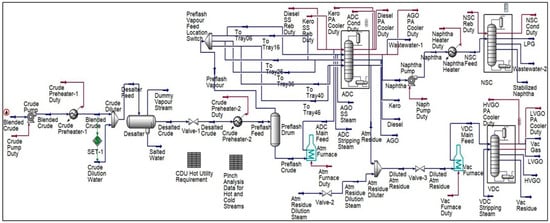
Figure 1.
Modelling simulation for crude oil distillation column with preflash drum.
The study performed a grid search analysis of six preflash vapor feed positions which included the middle trays of each ADU section and five temperature settings from 120 to 220 °C. The feed locations appear in Table 5. The optimisation process focused on two main goals which included minimising hot utility consumption in the ADU and reducing hot utility requirements throughout the CDU system that includes ADU and NSC and VDU. The analysis through Microsoft Excel determined the most effective preflash design for each objective by calculating hot utility reductions in ADU and CDU compared to the no-preflash reference. The study selected the preflash design which produced the lowest CDU hot utility demand as the optimal solution. The hot utility breakdown for the optimal preflash design appears in Table S4 while composition charts serve as reporting tools. The Aspen HYSYS sensitivity analysis tool enabled researchers to study how preflash temperature and feed position affect utility consumption. The study employs HYSYS sensitivity tools for optimisation purposes according to standard refinery practice although response surface methodology (RSM) could analyse statistical interactions [1,21,24]. The upcoming research will use RSM to determine specific interaction effects between variables.
Table 5.
Optimisation of preflash temperature and preflash vapour feed tray.
2.4. Modelling Assumptions, Simulation Uncertainty, and Model Validation
The simulation was carried out under steady-state conditions, and a number of simplifying assumptions were applied to ensure reproducibility and to focus the analysis on the effect of preflash operation. The crude assays were assumed to represent stable feed characteristics with no seasonal or operational variability. All heat-exchanger duties were calculated using a fixed pressure drop of 50 kPa, consistent with standard refinery design practice, and no fouling or deterioration of heat-transfer coefficients was considered. Column stages were assumed to achieve equilibrium behaviour, and ideal stage efficiencies were applied uniformly across all columns. Steam flows to the ADU and VDU were kept constant for each case to isolate the impact of preflash temperature and feed-tray location. Equipment was assumed to operate without mechanical constraints, and no hydraulic limitations (e.g., flooding or weeping) were imposed during optimisation. These assumptions ensured that differences observed between cases arose directly from the preflash configuration rather than unrelated operational disturbances. The simulations carried out in this work provide a consistent basis for comparing the different CDU configurations, but they are not free from uncertainty. Some of this uncertainty comes from the thermodynamic model used. The Peng–Robinson equation of state handles light and medium hydrocarbons well, but heavier fractions may show small deviations in phase–equilibrium predictions. In addition, the tray efficiencies applied in the distillation columns were treated as constant values, even though in practice they can vary with load, fouling, or hydraulic behaviour. The binary interaction parameters associated with the Peng–Robinson property package were taken directly from the Aspen HYSYS component database. No manual adjustment or regression of interaction parameters was performed, as the default values are widely used for refinery-grade hydrocarbon mixtures and provide stable phase–behaviour predictions for TBP-based assays.
To check that these assumptions did not distort the main findings, the predicted product cut-points and boiling-range behaviour were compared with the published crude assays from Equinor. The overall mass balance and separation trends also agreed with observations reported in earlier CDU optimisation studies [3,14]. These comparisons indicate that the model behaves realistically for the purpose of evaluating the relative impact of adding a preflash drum. Nevertheless, a more detailed uncertainty assessment would require plant operating data, which was not available for this study. Future work will focus on comparing simulated and measured column temperatures, duties, and yields to refine the confidence range of the model.
All process simulations were performed using Aspen HYSYS v14.1 with the Peng–Robinson thermodynamic package. The default sequential-modular solver was applied, using temperature and component-balance tolerances of ±0.01 °C and ±0.001 mole fraction, respectively. The process flow diagram shown in Figure 1 was generated within the Aspen HYSYS simulation environment and reflects the configuration used in this study.
For the system boundary, this study evaluates the ADU, NSU, and VDU sections of the CDU together with their associated heat-exchange duties. Other refinery units, equipment ageing effects, and dynamic operating disturbances were not included in the modelling scope. It is important to note that this optimisation study does not incorporate certain operational constraints that typically govern CDU performance. Industrial units impose limits on the allowable vapour fraction at the overhead line to ensure stable condensation and prevent excessive load on the reflux system. Similarly, maximum furnace film temperatures must be respected to avoid tube coking, and early vaporisation of acidic fractions can accelerate corrosion in the upper part of the atmospheric column. Fouling tendencies in the preheat train and flash zone were also not modelled. These constraints vary between refineries and were therefore excluded from the present analysis so that the influence of preflash conditions could be isolated. Their integration would require plant-specific datasets and will be examined in future work.
The optimisation in this study was performed under steady-state conditions, which do not capture the dynamic behaviour of CDU preflash systems. In industrial operation, preflash performance is affected by crude variability, transient column stabilisation, furnace responses, and startup dynamics. These operational effects were beyond the scope of this modelling study but represent an important area for future investigation using dynamic simulation tools.
2.5. Heat-Integration Potential with and Without the Optimised Preflash Drum
The no-preflash case and optimised-preflash case identified relevant hot and cold process streams for heat recovery through the analysis of Table 6 and Table 7. The Aspen HYSYS software provided pinch analysis information which included supply/target temperatures and heat duty and heat-capacity flow rates for each simulation scenario. The analysis used a minimum approach temperature of 20 °C for both scenarios because this value matches crude-unit operational standards [26,36]. The Microsoft Excel calculations of composite curves and heat-recovery targets received verification through the Aspen Energy Analyzer “HI Project” environment.
Table 6.
Pinch analysis data for a CDU without preflash, obtained using Aspen HYSYS.
Table 7.
Pinch analysis data for a CDU with optimised preflash, obtained using Aspen HYSYS.
The validation process relied on property data from crude oil assays reported by Equinor [30,31]. The simulation results match the findings from previous studies about CDU heat integration optimisation reported by Alhajri et al. [3] and Sotelo et al. [14].
2.6. Economic Comparison of a CDU Without Preflash and a CDU with an Optimised Preflash Drum
The cost estimation process followed the methods described by Sinnott and Towler [25]. The total fixed capital investment included inside battery limits (ISBL) and outside battery limits (OSBL) costs together with engineering expenses and contingency charges. Standard design correlations and literature benchmarks provided the basis for equipment cost and capital requirement calculations while industrial utility price publications [37,38,39,40,41,42,43] delivered operating cost data. The economic analysis of the CDU in a theoretical UK refinery depends on the parameters presented in Table S5. The economic analysis of the CDU in a theoretical UK refinery is based on the parameters which were obtained from published literature, official statistics, and market data sources [25,37,38,39,40,41,42,43,44,45,46,47,48,49].
The straight-line method with no salvage value determined the annual depreciation amount. The calculation of profitability indicators included the simple payback method for determining payback period and Microsoft Excel’s IRR function for internal rate of return (IRR) calculation. All financial data is presented in 2023 USD.
3. Results and Discussions
3.1. Comparing Total CDU Hot Utility Requirement with Optimisation of Preflash Drum for Minimum ADU Hot Utility Requirement
Studies on minimising the hot utility requirement of CDUs seem to focus attention on minimising the hot utility requirement of the ADU as opposed to considering the CDU as a composite of an ADU, an NSU, and a VDU (e.g., Ledezma-Martínez et al. [1]; Alhajri et al. [3]). As a result, from the literature, it did not appear clear whether optimising a preflash for minimum ADU hot utility requirement would translate to minimum CDU hot utility requirement if the CDU were considered as a composite of all three units. This research work sought to address this gap by considering a CDU as a composite of an ADU, an NSU, and a VDU and evaluating the impacts of introducing preflash into a CDU on the CDU hot utility requirement. Aspen HYSYS was used to model the CDU in both steady states: without preflash and with preflash. A side-by-side comparison of the two operating modes is presented in Figure 2, which summarises how each heating component contributes to total hot utility usage. The results for the standard process showed that the atmospheric furnace was the largest consumer of hot utility, requiring 8,313,000 kJ/hr, which accounts for 46.02% of the total hot utility requirement for the CDU, totalling 18,060,000 kJ/hr (Figure 2a). This confirms that the atmospheric furnace dominates the CDU’s energy demand, which is consistent with findings by Kaiser et al. [4]. When a preflash drum was integrated into the process, the hot utility requirement was reduced to 6,064,000 kJ/hr, representing 36.25% of the total utility (Figure 2b). The reduced furnace load demonstrates the effectiveness of the preflash drum in lowering overall energy consumption through partial vaporization before heating. This indicates that the ADU, with the optimisation of the preflash drum, requires 8.95% less energy compared to the standard process. This corresponds to an estimated reduction of approximately 360 tonnes of CO2 per year, based on refinery fuel gas emission factors [4].
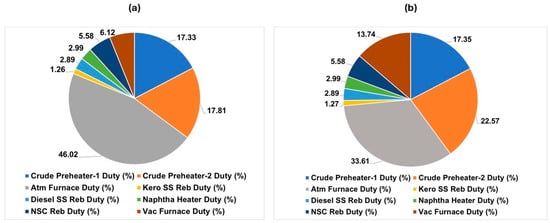
Figure 2.
Comparison of CDU hot utility requirements for (a) the base case without a preflash drum and (b) the CDU configuration with an optimised preflash drum.
Figure 2a shows that the atmospheric furnace contributes the largest share of the total CDU heat demand. This confirms that furnace duty is the dominant energy consumer in conventional operation and is therefore the primary target for optimisation.
The preflash drum integration in Figure 2b shows how hot utility needs decrease when light fractions undergo partial vaporization before entering the furnace which enhances thermal performance.
The product cut points and yields before and after preflash optimisation were compared to ensure quality was preserved. The boiling ranges of naphtha (IBP 15–EP 200 °C), kerosene (200–250 °C), diesel (250–350 °C), and AGO (350–370 °C) were maintained, with no significant deviations in simulated distillate properties. This confirms that optimisation did not compromise product quality.
For the CDU design, preflash temperature range and preflash vapour feed trays considered, the results obtained suggested that optimising preflash for minimum ADU hot utility requirement will favour higher preflash temperatures irrespective of the location to which the preflash vapour is fed in the ADC (Figure 3). The results in Figure 3 show that increasing the preflash temperature steadily lowers the ADU hot utility demand. This indicates that higher preflash temperatures improve furnace efficiency by reducing the amount of heat required for vaporisation before the atmospheric column. The largest reduction (9.06%) in ADU hot utility requirement occurred for a combination of the highest preflash temperature option (220 °C) and the lowest preflash feed tray option (tray 46) (Figure 3). However, the corresponding reduction in CDU hot utility requirement (0.12%) obtained for this combination of preflash temperature (220 °C) and preflash vapour feed tray (tray 46) was not the largest reduction obtained for CDU hot utility requirement. Feeding preflash vapour to the low tray 46, even at the highest preflash temperature option of 220 °C, resulted in a very significant increase (124.51%) in vacuum furnace duty (Figure 4), which sabotaged the reduction in CDU hot utility requirement. This significant increase in vacuum furnace duty occurred because:
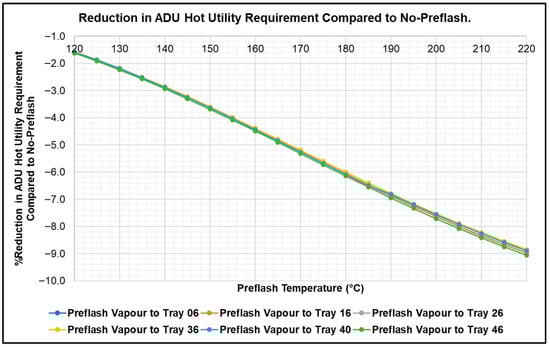
Figure 3.
Reduction in ADU hot utility requirement compared to the no-preflash scenario. Note: Overlap of curves occurs due to the proximity of operating conditions; however, this does not affect the scientific interpretation of the results.
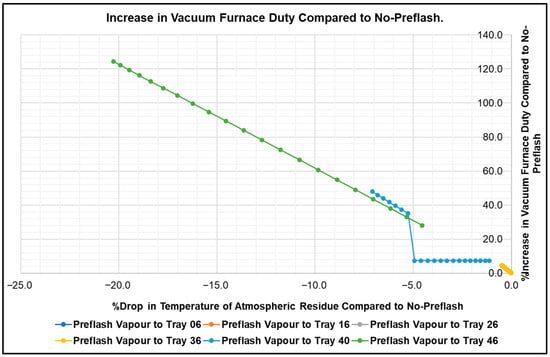
Figure 4.
Increase in VDU hot utility requirement compared to no-preflash. Note: Overlap of curves occurs due to the proximity of operating conditions; however, this does not affect the scientific interpretation of the results.
- The mass flow of preflash vapour fed to the ADC increased with increase in temperature (Figure 5), as such feeding preflash at 220 °C to tray 46 meant that an increased flow of relatively low-temperature preflash vapour (220 °C was low relative to the temperature of tray 46 (Figure 6)) was being fed to tray 46, which resulted in a drop in atmospheric residue temperature (Figure 7).
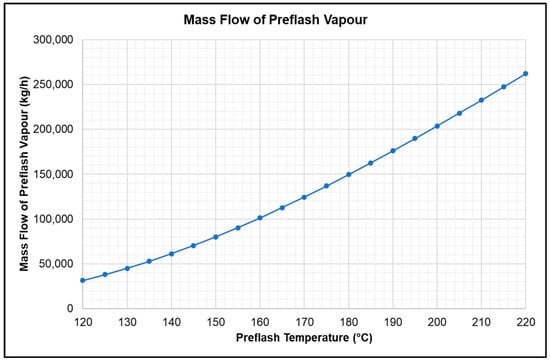 Figure 5. Variation of mass flow of preflash vapour with preflash temperature.
 Figure 6. Difference between the temperature of preflash vapour and the temperature of the preflash vapour feed stage.
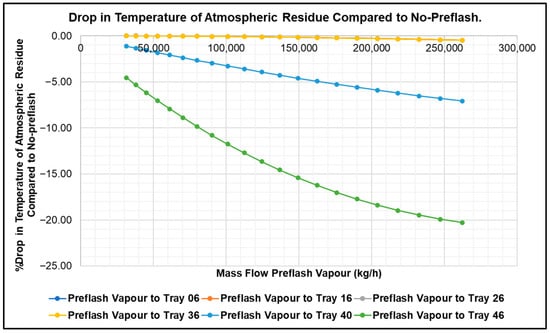 Figure 7. Drops in temperature of atmospheric residue compared to no-preflash. Note: Overlap of curves occurs due to the proximity of operating conditions; however, this does not affect the scientific interpretation of the results.
 - The drop in atmospheric residue temperature required a higher vacuum furnace duty to heat the temperature required for the vacuum furnace feed (Figure 4).
In Figure 4 the vacuum furnace duty is seen to rise as the preflash temperature increases. More energy is required to reheat the cooler feed entering the vacuum unit. This outcome confirms that both the preflash and vacuum sections must be optimised together to avoid shifting the energy burden from one unit to another.
As shown in Figure 5 the mass flow of vapour leaving the preflash drum rises steadily with temperature. This behaviour is expected, since higher temperatures promote more evaporation of light components from the crude. The change in vapour flow directly affects the load on the atmospheric furnace and the separation pattern in the main column. The corresponding temperature interaction between the preflash vapour and the receiving column stage is presented in Figure 6.
Figure 6 illustrates the temperature difference between the preflash vapour and the stage of the atmospheric column where it enters. This gap increases at higher preflash temperatures because a hotter vapour stream encounters a column section operating at a comparatively lower internal temperature. When this occurs, the entering vapour temporarily disrupts the local thermal balance of the column. The colder liquid on the tray absorbs heat from the hotter vapour, which reduces the local liquid temperature and alters the vapour–liquid equilibrium. This mechanism explains why excessively high preflash temperatures can shift the internal heat profile of the ADU and reduce overall thermal efficiency.
Figure 7 shows that the temperature of the atmospheric residue falls when preflash vapour is introduced. The additional vapour slightly cools the liquid phase, which then requires more heat input in the vacuum furnace to reach its target temperature. This effect partly cancels out some of the energy savings gained at the atmospheric section.
The situation was remedied when the CDU was considered as a composite of all the ADU, the NSU, and the VDU; Figure 8 indicates that the largest reduction (7.38%) in CDU hot utility requirement occurred for the combination of the highest preflash temperature option (220 °C) and the second highest preflash vapour feed tray option (tray 16). However, it was noted that the corresponding reduction in ADU hot utility requirement (8.98%) obtained for this combination of preflash temperature (220 °C) and preflash vapour feed tray (tray 16) was not the largest reduction obtained for ADU hot utility requirement. The results obtained suggest that, when optimising the hot utility requirement of CDUs that are composites of an ADU and a VDU, it is important to consider the CDU as a composite of its units rather than optimising preflash based on the ADU alone, as was seen in the literature on preflash in CDUs (e.g., Ledezma-Martínez et al. [1]; Alhajri et al. [3]; Jabbar et al. [24]; Durrani et al. [22]). These findings are consistent with Ledezma-Martínez et al. [1], who demonstrated energy conservation at the ADU level, but the authors expanded their research by showing how whole-CDU optimisation produces different economic and product quality outcomes.
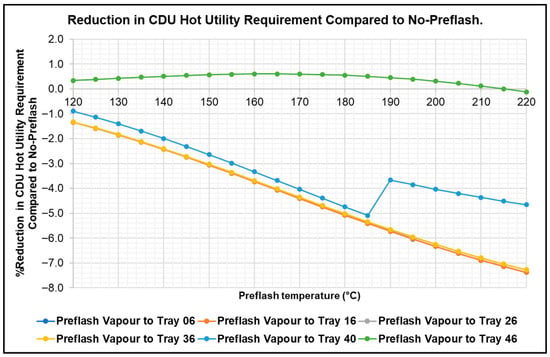
Figure 8.
Reduction in CDU hot utility requirement compared to no-preflash. Note: Overlap of curves occurs due to the proximity of operating conditions; however, this does not affect the scientific interpretation of the results.
As shown in Figure 8, the most efficient configuration was obtained when preflash vapour was fed to tray 16 at 220 °C. This combination delivered the greatest overall energy savings for the complete CDU system, demonstrating that full-system optimisation achieves better results than focusing on the ADU alone.
Figure 9 gives a comparison of energy savings for the CDU under different settings. It can be seen that using a preflash drum cuts down the total hot utility use, but the extent of improvement clearly depends on where the vapour is fed and the chosen preflash temperature. This means the operating conditions of the whole system need to be adjusted together rather than in isolation.
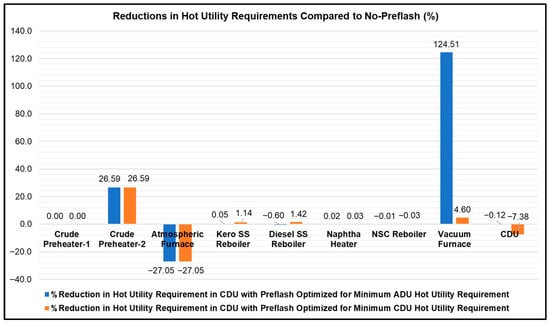
Figure 9.
Comparison of reduction in CDU hot utility requirement compared to no-preflash.
3.2. Evaluating the Impact of an Optimised Preflash Drum on the Maximum Proportion of Heat Recoverable by Heat Integration in the CDU
The results obtained suggested that the hot pinch temperature and cold pinch temperature for heat integration are not changed by the introduction of an optimised preflash drum into the CDU (Figure 10 and Figure 11); the hot pinch temperature remains at 128.18 °C and the cold pinch temperature remains at 118.18 °C. However, the maximum proportion of heat recoverable by heat integration increased slightly (from 35.57% to 42.71%) by introducing an optimised preflash drum into the CDU. In other words, the minimum CDU hot utility requirement achievable by heat integration was reduced by introducing an optimised preflash drum into the CDU.
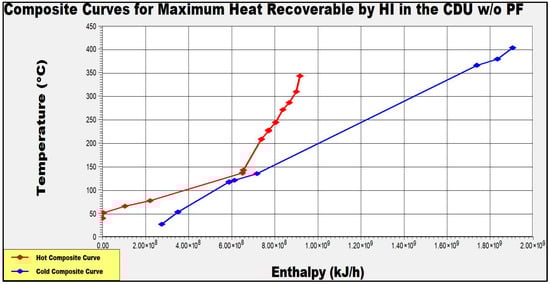
Figure 10.
Composite curves for maximum heat recoverable by heat integration in the CDU without preflash, obtained using Aspen Energy Analyser.
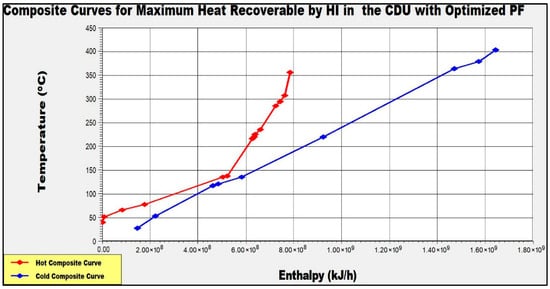
Figure 11.
Composite curves for maximum heat recoverable by heat integration in the CDU with an optimised preflash drum, obtained using Aspen Energy Analyser.
The preheat train configuration plays a significant role in overall energy recovery. In this study, the inclusion of preheater-1 and preheater-2 was simplified in the model; however, industrial preheat trains typically consist of 8–12 exchangers arranged in series-parallel networks. The calculated results therefore represent a conservative estimate of heat recovery potential, and more detailed exchanger network design improvements could further reduce utility consumption.
Similar conclusions were reported by Ding et al. [9] who showed that advanced heat integration strategies, including ORC-based recovery, can significantly enhance energy savings in refinery systems. Thus, integrating preflash with heat recovery not only improves energy efficiency but also directly supports refinery decarbonisation targets.
Figure 10 presents the composite curves for the base CDU configuration without a preflash drum. It can be seen that the hot and cold curves remain well separated, which limits the opportunity for internal heat recovery. In practical terms, this means a greater share of the heating duty must still come from external utilities. The result highlights why the reference case has a relatively high energy demand and indicates clear potential for further improvement through heat-integration measures.
In Figure 11, we can clearly see that the hot and cold composite curves move closer together once the optimised preflash drum is introduced. The greater overlap between the curves shows that more process heat is being reused within the system. Although the minimum temperature approach (ΔTₘᵢₙ) remains unchanged, the overall area of overlap increases, confirming improved thermal coupling between streams. This observation supports the calculated rise in heat-recovery efficiency from 35.57% to 42.71%, demonstrating a measurable enhancement in the unit’s energy performance.
3.3. Results of the Economic Comparison of CDU Without Preflash and CDU with an Optimised Preflash Drum
The results from Table 8 and Figure 12 showed that preflash implementation would boost steam utility consumption, which would result in major financial losses for the operation. The findings validate Ledezma-Martínez et al. [21], who stated that preflash operations create substantial financial impacts on crude distillation process profitability.
Table 8.
A comparison between the CDU system operating without preflash and the CDU system with an optimised preflash drum. Fixed capital investment includes all costs related to ISBL and OSBL, as well as engineering and contingency expenses. Operating expenses cover utilities, raw materials, and fixed production costs. Depreciation was calculated using the straight-line method with zero salvage value. All financial information is reported in 2023 USD.
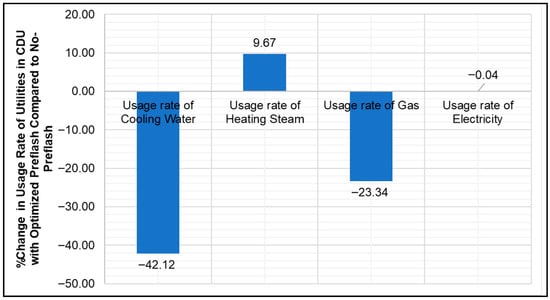
Figure 12.
Change in usage rate of utilities in CDU with optimised preflash compared to no-preflash.
The preflash operation as a standalone system raised both steam utility expenses and decreased operational profitability. The combination of preflash with heat integration enables both financial advantages and environmental benefits, which makes integrated optimisation the most sustainable choice for CDU retrofits. The research findings match current refinery optimisation studies [7] which demonstrate that combined energy–economic methods provide the best solution for profitable crude distillation unit operations while reducing carbon emissions.
Figure 12 summarises how the use of key utilities changes after installing the optimised preflash drum. While the demand for fired heat falls noticeably, the higher steam consumption partly offsets the energy savings. As a result, the overall profitability of the process declines slightly. It is worth noting that this trade-off emphasises the need to combine preflash optimisation with broader heat-integration or utility-management strategies if both energy and economic gains are to be achieved simultaneously.
4. Conclusions
This study analysed a CDU system which included an ADU and NSU and VDU units. The novelty of this work lies in treating the CDU as a fully integrated system—comprising the ADU, NSU, and VDU—when assessing the effect of preflash optimisation on energy consumption, heat-recovery potential, and economic outcomes. Earlier studies focused mainly on the ADU, leaving the wider CDU behaviour unexplored. It evaluated how an optimised preflash drum affects CDU hot utility requirements and heat recovery capabilities while preserving product quality standards, which previous studies have neglected. By examining all major distillation sections together, the work provides a clearer picture of how energy savings gained in one unit influence the performance of downstream units such as the VDU.
The optimised preflash drum system decreased atmospheric furnace power consumption by 8.95% while it decreased the total hot utility consumption of the CDU by 7.38%. The heat recovery system achieved better performance through its increased efficiency, which rose from 35.57% to 42.71%. The economic evaluation demonstrated that preflash operation as a standalone system would decrease annual cash flow by 73.7% on average. The implementation of preflash as a standalone system does not seem to generate profitable outcomes according to the results. The combination of preflash with heat recovery methods leads to better energy conservation and reduced CO2 emissions. This suggests that preflash should be viewed as a supporting measure that works best when paired with a broader heat-integration strategy rather than as an isolated modification.
The study demonstrates that CDU optimisation requires a complete system approach instead of focusing solely on the ADU. The research needs verification through plant operating data collection and RSM analysis to understand process variable interactions. The combination of preflash with heat recovery systems and advanced optimisation tools shows potential to boost both refinery operational efficiency and environmental sustainability. Future work may also explore operational flexibility, environmental indicators beyond CO2, and real-time optimisation tools that can support decision-making under varying crude slates and refinery operating conditions.
5. Future Research Directions
The findings of this study are based on steady-state modelling, which does not capture operational variability such as crude-switching behaviour, transient column stability, or seasonal changes in the crude blend. Future work should therefore incorporate dynamic simulation to evaluate the performance of preflash optimisation under realistic operating disturbances. It would also be valuable to include plant-specific constraints—such as limits on overhead vapour fraction, furnace film temperatures, corrosion thresholds, and fouling tendencies—to provide a more complete industrial assessment. Experimental validation using operating data and the application of multi-variable optimisation tools such as RSM would further strengthen the reliability and practical relevance of the results.
Supplementary Materials
The following supporting information can be downloaded at: https://www.mdpi.com/article/10.3390/chemengineering10010007/s1. Table S1. Data from 2015 crude assay for Ekofisk crude [30]; Table S2. Data from 2021 crude assay for Johan Sverdrup crude [31]; Table S3. Data used to model ADC [22,35]; Table S4. Make-up of the CDU hot utility requirement; Table S5. Parameters used for economic analysis of the CDU; Figure S1. Modelling simulation for crude oil distillation column without preflash drum.
Author Contributions
Conceptualization, S.H.Z.; Methodology, S.H.Z.; Software, C.A.A.; Validation, S.H.Z., K.J.J., U.A. and A.A.J.; Formal analysis, S.H.Z. and C.A.A.; Investigation, C.A.A.; Data curation, C.A.A.; Writing–original draft, C.A.A.; Writing–review and editing, S.H.Z., C.A.A., K.J.J., U.A. and A.A.J.; Visualization, S.H.Z. and C.A.A.; Supervision, S.H.Z.; Project administration, S.H.Z. All authors have read and agreed to the published version of the manuscript.
Funding
This research did not receive any specific grant from funding agencies.
Data Availability Statement
The original contributions presented in this study are included in the article/Supplementary Material. Further inquiries can be directed to the corresponding author.
Conflicts of Interest
The authors declare no conflict of interests.
References
- Ledezma-Martínez, M.; Jobson, M.; Smith, R. A new optimisation-based design methodology for energy-efficient crude oil distillation systems with preflash units. Chem. Eng. Trans. 2018, 69, 385–390. [Google Scholar]
- Tokmurzin, D.; Otarov, R.; Aiymbetov, B.; Bulatov, I.; Smith, R. Case study of power generation and CO2 emissions reduction potential from introduction of Organic Rankine Cycle on Atyrau Oil Refinery Plant Vacuum Distillation Unit. Mater. Today Proc. 2018, 5, 22859–22870. [Google Scholar] [CrossRef]
- Alhajri, I.H.; Gadalla, M.A.; Abdelaziz, O.Y.; Ashour, F.H. Retrofit of heat exchanger networks by graphical Pinch Analysis—A case study of a crude oil refinery in Kuwait. Case Stud. Therm. Eng. 2021, 26, 101030. [Google Scholar] [CrossRef]
- Kaiser, M.J.; de Klerk, A.; Gary, J.H.; Handwerk, G.E. Petroleum Refining: Technology, Economics, and Markets; CRC Press: Boca Raton, FL, USA, 2019. [Google Scholar]
- Rafeek, M.; Elwardany, M.; Nassib, A.M.; Ahmed, M.S.; Mohamed, H.A.; Abdelaal, M.R. Sustainable refining: Integrating renewable energy and advanced technologies. J. Therm. Anal. Calorim. 2025, 150, 17051–17071. [Google Scholar] [CrossRef]
- Abo-mousa, A.G.; Kamel, D.A.; Elazab, H.A.; Gadalla, M.A.; Fouad, M.K. Graphical analysis and revamping of crude distillation units under variable operational scenarios. Case Stud. Chem. Environ. Eng. 2023, 8, 100490. [Google Scholar] [CrossRef]
- Prestigiacomo, C.; Giaconia, A.; Proietto, F.; Caputo, G.; Balog, I.; Ollà, E.; Terranova, C.F.; Scialdone, O.; Galia, A. Concentrated solar heat for the decarbonization of industrial chemical processes: A case study on crude oil distillation. Energy 2024, 293, 130718. [Google Scholar] [CrossRef]
- Yu, H.; Eason, J.; Biegler, L.T.; Feng, X. Simultaneous heat integration and techno-economic optimization of Organic Rankine Cycle (ORC) for multiple waste heat stream recovery. Energy 2017, 119, 322–333. [Google Scholar] [CrossRef]
- Ding, Y.; Liu, Y.; Wang, M.; Du, W.; Qian, F. Heat integration, simultaneous structure and parameter optimisation, and techno-economic evaluation of waste heat recovery systems for petrochemical industry. Energy 2024, 296, 131083. [Google Scholar] [CrossRef]
- Tahir, N.M.; Zhang, J.; Armstrong, M. Control of heat-integrated distillation systems: Review, trends, and challenges for future research. Processes 2024, 13, 17. [Google Scholar] [CrossRef]
- Duan, W.; Yang, M.; Feng, X. Comprehensive analysis and targeting of distillation integrated into overall process considering operating pressure change. Processes 2022, 10, 1861. [Google Scholar] [CrossRef]
- Seijo-Bestilleiro, E.; Arias-Fernández, I.; Carro-López, D.; Naveiro, M. Opportunities for emission reduction in the transformation of petroleum refining. Fuels 2025, 6, 66. [Google Scholar] [CrossRef]
- Liu, Z.; Karimi, I.A. Simulating combined cycle gas turbine power plants in Aspen HYSYS. Energy Convers. Manag. 2018, 171, 1213–1225. [Google Scholar] [CrossRef]
- Sotelo, D.; Favela-Contreras, A.; Lozoya, C.; Beltran-Carbajal, F.; Dieck-Assad, G.; Sotelo, C. Dynamic simulation of a crude oil distillation plant using Aspen-Hysys®. Int. J. Simul. Model. 2019, 18, 229–241. [Google Scholar] [CrossRef]
- Saud, I.; Abdullah, A.; Al-Asadi, A.; Janabi, B. Study and optimisation of the factors affecting the crude oil distillation process using Aspen HYSYS. Eureka Phys. Eng. 2024, 6, 31–41. [Google Scholar] [CrossRef]
- Shahzad, J.; Ahmad, I.; Ahsan, M.; Ahmad, F.; Saghir, H.; Kano, M.; Caliskan, H.; Hong, H. Grey-box modelling for estimation of optimum cut point temperature of crude distillation column. CAAI Trans. Intell. Technol. 2024, 10, 160–174. [Google Scholar] [CrossRef]
- Chuquín-Vasco, D.; Osorio-Getial, J.; Chuquín-Vasco, N.; Chuquín-Vasco, J.; Aguirre-Ruiz, D.; Mejía-Peñafiel, F. Computational modelling and machine learning for predicting the volumetric flows in crude distillation units: A detailed simulation and validation approach. Eurasian Chem.-Technol. J. 2025, 27, 111–125. [Google Scholar] [CrossRef]
- Basir, N.; Othman, N.; Ahmad, Z. Prediction of crude distillation unit product cut points: A comparative study of feedforward and recurrent neural networks with diverse input sets and pre-processing techniques. IOP Conf. Ser. Earth Environ. Sci. 2025, 1516, 012029. [Google Scholar] [CrossRef]
- Uthman, M.; Bulama, I.; Mohammed, M. Optimising crude distillation through heat integration: Insights from KRPC, Nigeria. Int. J. Energy Power Sustain. Resour. 2025, 8. [Google Scholar] [CrossRef]
- Hong, J.; Wang, Z.; Wang, C.; Zhang, J.; Liu, W.; Ling, K. Modeling of Multiphase Flow with the Wellbore in Gas-Condensate Reservoirs Under High Gas/Liquid Ratio Conditions and Field Application. SPE J. 2025, 30, 1301–1314. [Google Scholar] [CrossRef]
- Ledezma-Martínez, M.; Jobson, M.; Smith, R. Simulation-Optimization-Based Design of Crude Oil Distillation Systems with Preflash Units. Ind. Eng. Chem. Res. 2018, 57, 9821–9830. [Google Scholar] [CrossRef]
- Durrani, M.A.; Avila, A.; Rafael, J.; Ahmad, I. An integrated mechanism of genetic algorithm and Taguchi method for cut-point temperatures optimization of crude distillation unit. In Proceedings of the 2018 International Conference on Computing, Mathematics, and Engineering Technologies: Invent, Innovate and Integrate for Socioeconomic Development, iCoMET 2018—Proceedings, Sukkur, Pakistan, 3–4 March 2018. [Google Scholar]
- Ulyev, L.; Vasiliev, M.; Boldyryev, S. Process integration of crude oil distillation with technological and economic restrictions. J. Environ. Manag. 2018, 222, 454–464. [Google Scholar] [CrossRef] [PubMed]
- Jabbar, K.J.; Zein, S.H.; Hasan, A.H.; Ahmed, U.; Jalil, A.A. Process design Optimisation, heat integration, and techno-economic analysis of oil refinery: A case study. Energy Sources Part A Recovery Util. Environ. Eff. 2023, 45, 4931–4947. [Google Scholar] [CrossRef]
- Sinnott, R.; Towler, G. Chemical Engineering Design: SI Edition; Butterworth-Heinemann: Oxford, UK, 2019. [Google Scholar]
- Kemp, I.C.; Lim, J.S. Pinch Analysis for Energy and Carbon Footprint Reduction: User Guide to Process Integration for the Efficient Use of Energy; Butterworth-Heinemann: Oxford, UK, 2020. [Google Scholar]
- Waudby, H.; Zein, S.H. A circular economy approach for industrial scale biodiesel production from palm oil mill effluent using microwave heating: Design, simulation, techno-economic analysis and location comparison. Process Saf. Environ. Prot. 2021, 148, 1006–1018. [Google Scholar] [CrossRef]
- Mrayed, S.; Shams, M.B.; Al-Khayyat, M.; Alnoaimi, N. Application of pinch analysis to improve the heat integration efficiency in a crude distillation unit. Clean. Eng. Technol. 2021, 4, 100168. [Google Scholar] [CrossRef]
- Sadek, M.; El-Maghraby, R.M.; Fathy, M. Retrofitting of Inefficient Heat Exchanger Network Using Aspen Energy Analyzer. AIP Conf. Proc. 2023, 2779, 020007. [Google Scholar] [CrossRef]
- Equinor. Crude Oil Assays—Ekofisk-2015. 2023. Available online: https://cdn.equinor.com/files/h61q9gi9/global/b35949a85f43e83bcc3df3ead7e3bf4a297f759d.xlsx (accessed on 15 June 2023).
- Equinor. Crude Oil Assays—Johan Sverdrup-2021. 2023. Available online: https://cdn.equinor.com/files/h61q9gi9/global/660317b966448375dd3bc42db32f4f19af7b2561.xlsx (accessed on 23 December 2025).
- Nalinakshan, S.; Sivasubramanian, V.; Ravi, V.; Vasudevan, A.; Sankar, M.S.R.; Arunachalam, K. Progressive crude oil distillation: An energy-efficient alternative to conventional distillation process. Fuel 2019, 239, 1331–1337. [Google Scholar] [CrossRef]
- Naji, F.A.; Ateeq, A.A.; Al-Mayyah, M.A. Optimization of blending operation for the Iraqi oils. J. Phys. Conf. Ser. 2021, 1773, 012037. [Google Scholar] [CrossRef]
- Fahim, M.A.; Al-Sahhaf, T.A.; Elkilani, A. Fundamentals of Petroleum Refining; Elsevier: Amsterdam, The Netherlands, 2009. [Google Scholar]
- Ibrahim, D.; Jobson, M.; Guillén-Gosálbez, G. Optimization-based design of crude oil distillation units using rigorous simulation models. Ind. Eng. Chem. Res. 2017, 56, 6728–6740. [Google Scholar] [CrossRef]
- Linnhoff, B.; Townsend, D.W.; Boland, D.; Thomas, B.; Guy, A.R.; Marsland, R.H. A User Guide on Process Integration for the Efficient Use of Energy; IChemE: Rugby, UK, 1994. [Google Scholar]
- Business-Electricity-Prices. Compare Business Electricity Rates. 2023. Available online: https://www.businesselectricityprices.org.uk/ (accessed on 2 September 2023).
- Business-Electricity-Prices. Don’t Overpay on Your Business Gas Prices. 2023. Available online: https://www.businesselectricityprices.org.uk/business-gas/ (accessed on 2 September 2023).
- Business-Electricity-Prices. Take Control of Your Business Water Rates and Find the Best Deal. 2023. Available online: https://www.businesselectricityprices.org.uk/water-prices/ (accessed on 2 September 2023).
- GlobalPetrolPrices.com. Diesel Prices, Litre, 28 August 2023. 2023. Available online: https://www.globalpetrolprices.com/diesel_prices/ (accessed on 2 September 2023).
- GlobalPetrolPrices.com. Gasoline Prices, Litre, 28 August 2023. 2023. Available online: https://www.globalpetrolprices.com/gasoline_prices/#:~:text=Gasoline%20prices%2C%20Octane%2D95%2C,1.35%20U.S.%20Dollar%20per%20litre. (accessed on 2 September 2023).
- GlobalPetrolPrices.com. Kerosene Prices, Litre, 28 August 2023. 2023. Available online: https://www.globalpetrolprices.com/kerosene_prices/#:~:text=Kerosene%20prices%2C%2028%2DAug%2D,1.05%20U.S.%20Dollar%20per%20litre. (accessed on 2 September 2023).
- GlobalPetrolPrices.com. LPG Prices, Litre, 28-Aug-2023. 2023. Available online: https://www.globalpetrolprices.com/lpg_prices/ (accessed on 2 September 2023).
- Federal-Reserve-Bank-of-St-Louis. Inflation, Consumer Prices for the United States. 2023. Available online: https://fred.stlouisfed.org/series/FPCPITOTLZGUSA (accessed on 10 May 2023).
- Bank-of-England. Daily Spot Exchange Rates Against Sterling. 2023. Available online: https://www.bankofengland.co.uk/boeapps/database/Rates.asp?TD=30&TM=Dec&TY=2022&into=GBP&rateview=D (accessed on 10 May 2023).
- Bank-of-England. Inflation Calculator. 2023. Available online: https://www.bankofengland.co.uk/monetary-policy/inflation/inflation-calculator (accessed on 10 May 2023).
- Gov.uk. Large Business (LB) Oil and Gas Market Values for Category 1 Crudes 2023. 2023. Available online: https://www.gov.uk/government/publications/large-business-service-oil-and-gas-market-values-for-category-1-crudes-2014/large-business-lb-oil-and-gas-market-values-for-category-1-crudes-2023 (accessed on 3 September 2023).
- S&P-Global. Equinor Starts Phase 2 of Norway’s Giant Johan Sverdrup Oil Field. 2022. Available online: https://www.spglobal.com/commodityinsights/en/market-insights/latest-news/energy-transition/121522-equinor-starts-phase-2-of-norways-giant-johan-sverdrup-oil-field (accessed on 3 September 2022).
- TLV. Calculator: Steam Unit Cost. 2023. Available online: https://www.tlv.com/global/UK/calculator/steam-unit-cost.html?advanced=on (accessed on 2 September 2023).
Disclaimer/Publisher’s Note: The statements, opinions and data contained in all publications are solely those of the individual author(s) and contributor(s) and not of MDPI and/or the editor(s). MDPI and/or the editor(s) disclaim responsibility for any injury to people or property resulting from any ideas, methods, instructions or products referred to in the content. |
© 2026 by the authors. Licensee MDPI, Basel, Switzerland. This article is an open access article distributed under the terms and conditions of the Creative Commons Attribution (CC BY) license.