Abstract
Background: Port congestion contributes significantly to operational inefficiency and environmental impact in maritime logistics. With tightening EU regulations such as the Emissions Trading System (EU ETS) and FuelEU Maritime, understanding and mitigating the economic and environmental effects of vessel delays is increasingly critical. This study focuses on a single bulk cargo pier at Constanta Port (Romania), which has experienced substantial traffic fluctuations since 2021, and examines operational and environmental performance through a queuing-theoretic lens. Methods: The authors have applied an M/G/1/∞/FIFO/∞ queuing model to vessel traffic and service time data from 2021–2023, supplemented by Monte Carlo simulations to capture variability in maneuvering and service durations. Environmental impact was quantified in CO2 emissions using standard fuel-based emission factors, and a Cold Ironing scenario was modeled to assess potential mitigation benefits. Economic implications were estimated through operational cost modeling and conversion of CO2 emissions into equivalent EU ETS carbon costs. Results: The analysis revealed high berth utilization rates across all years, with substantial variability in waiting times and queue lengths. Congestion was associated with considerable CO2 emissions, which, when expressed in monetary terms under prevailing EU ETS prices, represent a significant financial burden. The Cold Ironing scenario demonstrated a substantial reduction in at-berth emissions and corresponding cost savings, underscoring its potential as a viable mitigation strategy. Conclusions: Results confirm that operational congestion at the studied berth imposes substantial environmental and financial burdens. The analysis supports targeted interventions such as Just-In-Time arrivals, optimized berth scheduling, and Cold Ironing adoption. Recommendations are most applicable to single-berth bulk cargo operations; future research should extend the approach to multi-berth configurations and incorporate additional operational constraints for broader generalizability.
1. Introduction
Maritime transport represents a cornerstone of international commerce, responsible for facilitating over 90% of global trade by volume [] (United Nations, 2024). Its critical role in sustaining global supply chains underscores the importance of ensuring efficient and sustainable port operations. However, as the industry faces growing scrutiny over its environmental footprint, concerns about greenhouse gas (GHG) emissions, port congestion, and regulatory compliance have come to the forefront [].
Port operations, particularly vessel idle time at anchor and berths, play a significant role in operational efficiency and environmental impact. Ships consume substantial fuel quantities while waiting to dock, which not only increases direct fuel and port-related expenses (e.g., pilotage, towage, berthing, and cargo handling fees) but also raises compliance costs under emerging regulatory schemes such as the EU Emissions Trading System (EU ETS) and FuelEU Maritime. These frameworks impose escalating financial penalties for emissions, incentivizing ports to optimize turnaround times and reduce environmental impact [,].
One prominent method of mitigating emissions during port stays is the implementation of shore power technologies, commonly referred to as “Cold Ironing”. This technique allows vessels to shut down auxiliary engines while berthed, drawing electricity from shore-based infrastructure. Cold Ironing may offer dual benefits: lowering local pollution and reducing compliance costs [,].
In addition to technological interventions, operational strategies such as just-in-time (JIT) arrivals are increasingly recognized for their role in enhancing port performance. JIT coordination ensures that vessels arrive precisely when berthing space is available, minimizing time spent idling with engines running, enhancing fuel efficiency, reducing harbor congestion, and lowering emissions [,].
Given these dynamics, evaluating pier-specific performance through systematic modeling provides actionable insights for port authorities. This study applies the M/G/1/∞/FIFO/∞ queuing model to a designated pier in Constanta Port, Romania, positioned in Western Black Sea region. The analysis considers operational data from 2021 to 2023 to assess queuing delays, cost implications, and environmental impacts, with the findings being contextualized within the broader scope of EU maritime sustainability initiatives and port digitalization efforts.
To explore the operational and environmental consequences of pier-level congestion, this study employs a two-stage analytical framework. First, a queuing model of type M/G/1/∞/FIFO/∞ is applied to assess vessel traffic intensity, waiting times, and queue lengths based on empirical data from 2021 to 2023. Second, cost and emissions calculations are integrated into the queuing outputs to estimate total operational expenditures and carbon dioxide (CO2) emissions, accounting for EU ETS and FuelEU Maritime regulatory obligations. Sensitivity testing using Monte Carlo simulations evaluates the stability of the system under stochastic variation in maneuvering and safety intervals. The study also includes a counterfactual Cold Ironing scenario to assess the emissions-reduction potential of shore power electrification.
The structure of the paper is as follows: Section 2 reviews the relevant literature on queuing models, port congestion, and emissions regulation; Section 3 details the research methodology; Section 4 presents and discusses the results, including economic and environmental findings; and Section 5 offers concluding insights and strategic recommendations for port authorities and policymakers.
2. Literature Review
The analysis of port waiting times has garnered increasing scholarly attention due to its critical implications for maritime logistics, environmental sustainability, and operational cost efficiency. Reducing vessel waiting times is essential for improving port throughput, optimizing berth utilization, and enhancing the coordination between shipping companies, cargo owners, and terminal operators.
One methodological approach to analyzing idle times is the use of Markov Chain Analysis (MCA), as explored by Pruyn et al. (2020), which enables predictions of system congestion by evaluating historical vessel traffic data []. Complementarily, studies by Feng et al. (2020) and Peng et al. (2023) employed Automatic Identification System (AIS) data to assess ship movement patterns and port efficiency in real time [,]. These analyses enable dynamic performance monitoring and evidence-based optimization of berth scheduling.
The Berth Allocation Problem (BAP) remains a cornerstone of port congestion mitigation. A wide array of optimization techniques has been proposed, including chemical reaction optimization [], particle swarm algorithms, and block-based genetic methods []. These algorithms aim to minimize vessel idle time and maximize berth throughput under diverse operational constraints.
Another important strand of research focuses on the intersection of port efficiency and environmental performance. Xia et al. (2021) presented a joint scheduling and speed reduction model that balances navigational efficiency and carbon emission reduction []. Similarly, Jiang et al. (2022) developed a multi-objective algorithm for channel-restricted ports, integrating emissions, cost, and berth usage to support more holistic decision-making [].
Queuing theory has been extensively applied to port analysis due to its ability to model stochastic arrival and service processes. According to recent authors, models such as M/G/1 provide key indicators like system utilization, average waiting times, and queue lengths, which are vital for performance benchmarking [,]. These models require minimal input data, primarily arrival rates and service time distributions, making them especially applicable for capacity planning [,].
The just-in-time (JIT) arrival concept has emerged as a viable operational strategy to align vessel arrival times with terminal availability. Yu and Voß (2023) integrated JIT with quay crane allocation and speed optimization to reduce fuel use and port delays []. On the other hand, Mubder (2023) investigated the institutional mechanisms required for successful JIT implementation [], while Guo et al. (2023) applied cooperative game theory to propose port alliances that mitigate excessive waiting times at congested terminals [].
In parallel, technological interventions such as Cold Ironing offer practical solutions for emissions abatement. Rauca and Carp (2024) demonstrated that shore power significantly lowers both emissions and EU ETS liabilities, with the effectiveness depending on vessel type and berthing duration []. However, system compatibility between ship and port remains a significant barrier, as noted by former authors [,]. A comprehensive evaluation by Canepa et al. (2023) affirmed the long-term socio-economic viability of shore power adoption in Mediterranean ports [].
Moreover, recent studies have begun integrating queuing theory with environmental performance frameworks to optimize port operations under sustainability constraints. Zhen et al. (2022) combined berth allocation models with stochastic queuing systems to account for emissions reduction strategies under uncertainty []. Similarly, Yuan et al. (2023) and Wen et al. (2024) applied queuing theory within a carbon pricing context to align vessel scheduling with environmental cost minimization [,]. Pravalika et al. (2024) applied M/G/k models to simulate the emissions-reduction potential of Cold Ironing adoption scenarios [], while Ayaz et al. (2024) linked congestion metrics with EU ETS compliance costs []. These works demonstrate the growing relevance of combining queuing analysis with environmental policy considerations, reinforcing the integrated approach adopted in this study.
Collectively, the literature underlines the importance of integrating queuing models, digitalization strategies, and environmental policies to enhance port performance while addressing regulatory and ecological constraints.
While previous studies have advanced the understanding of port congestion through Markov Chain models [], berth allocation algorithms [,], and AIS-based performance tracking [,], a critical gap persists in integrating queuing analysis with cost and emissions modeling under the evolving EU maritime regulatory framework. Most existing queuing-based studies focus narrowly on operational efficiency without accounting for the environmental and economic penalties imposed by the EU Emissions Trading System (EU ETS) or FuelEU Maritime regulations. Similarly, while Cold Ironing and Just-in-Time (JIT) arrivals have been explored as decarbonization strategies, these are often treated in isolation from system-level queuing dynamics [,].
This gap underlines the need for an integrated, pier-specific modeling approach that connects vessel flow management with emissions compliance and cost exposure. The Port of Constanta, facing heightened operational pressures due to regional geopolitical shifts, offers a pertinent case for such analysis. Consequently, this study aims to bridge the methodological divide by combining M/G/1 queuing theory with emissions and expense modeling, supplemented by Monte Carlo simulation and Cold Ironing scenario testing. This comprehensive framework responds to both operational inefficiency and environmental accountability, providing evidence-based insights for infrastructure planning and regulatory adaptation in EU ports.
3. Research Methodology
3.1. Research Framework
This study employs a multi-layered analytical framework to assess the operational performance and environmental impact of a specific bulk cargo pier within the Port of Constanta, Romania. The primary objective is to quantify how vessel traffic intensity, queuing dynamics, and service durations contribute to port congestion, operating costs, and carbon dioxide (CO2) emissions under the constraints imposed by the EU Emissions Trading System (EU ETS) and FuelEU Maritime regulation.
The core of the analytical approach is the application of the M/G/1/∞/FIFO/∞ queuing model. This single-server queuing system allows for the stochastic analysis of vessel arrivals and service times while capturing average waiting times, queue lengths, and system utilization (ρ). Key performance indicators such as the average queue length (Lq), average waiting time (tq), and total time in the system (t) form the basis for estimating idle durations and associated cost and emission impacts.
To deepen the realism of the model and account for operational uncertainties, the queuing framework is extended with Monte Carlo simulation. This technique introduces probabilistic variability into key parameters such as maneuvering time and berth safety intervals. Through 1000 randomized simulation runs, the model assesses the system’s sensitivity and robustness, offering a probabilistic distribution of potential outcomes including extreme congestion scenarios and emissions surges.
Furthermore, the study incorporates a scenario-based emissions analysis to evaluate the potential impact of Cold Ironing technology, where shore-side power provisioning allows vessels to shut down auxiliary engines during cargo operations. This counterfactual scenario is compared with the baseline (fuel-only) emissions model to estimate potential reductions in CO2 emissions and regulatory penalties.
The research framework thus integrates three methodological layers as shown in Figure 1:
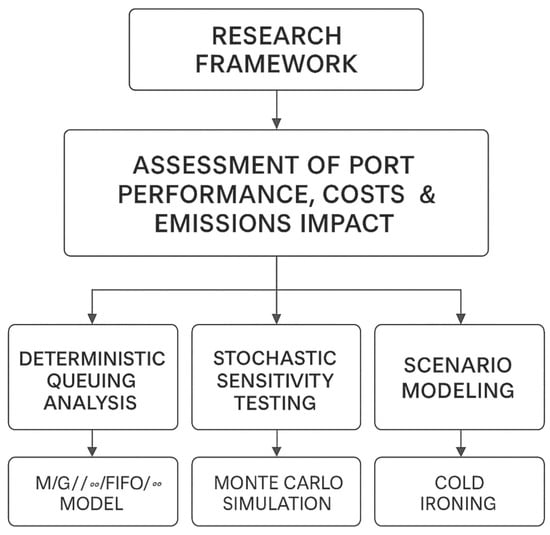
Figure 1.
Research framework for port performance, cost, and emissions analysis.
- Deterministic queuing analysis—based on real vessel traffic data;
- Stochastic sensitivity—testing using Monte Carlo simulation to evaluate volatility in system performance;
- Scenario modeling—to assess the decarbonization potential of Cold Ironing infrastructure.
This composite framework not only enhances analytical precision but also enables evidence-based recommendations for both operational optimization and environmental compliance in the context of EU maritime regulations.
3.2. Application of the M/G/1/∞/FIFO/∞ Queuing Model
The calculation methodology is separated into the following parts:
- (a)
- Queuing management M/G/1/∞/FIFO/∞;
- (b)
- Total expenses and CO2 emissions quantities.
3.2.1. Queuing Management M/G/1/∞/FIFO/∞
As per the Kendall–Lee classification, the queuing management characteristics depend on the entering traffic movements (ships), the service time distribution, the number of serving stations, system capacity, service discipline, and arrival population []. For the queuing management used in this research, M represents the probability density function of the inter-arrivals (vessel arrival) as per the Poisson distribution; G represents the probability density function of the serving times (vessel operational times), with a general distribution (serving times depend on the vessel type and volume of commodity); 1 represents the number of piers used for loading/unloading cargo; ∞ is the infinite number of vessels that can wait in the queue; FIFO represents the First-In-First-Out service discipline—vessels are serviced in the order of arrival; and ∞ is the infinite number of potential vessels arrivals [].
The model uses the following notations:
- -
- λ—arrival rate of vessels;
- -
- µ—average intensity of serving;
- -
- ρ—system utilization;
- -
- Lq—average queue length;
- -
- L—average number of vessels at queue and at the pier (in the system);
- -
- tq—average time spent in the queue;
- -
- t—average time spent by a vessel from arrival until departure;
- -
- υs—service time variation coefficient;
- -
- P0—probability that there is no vessel in the system (the system is empty).
The following equations are used to evaluate the pier performance, (1) to (6) []:
The system utilization ρ shows the traffic intensity (Formula (1)), meaning how busy the serving station or pier is in a one-year interval. If ρ < 1, the system (pier) has the capacity to serve all incoming vessels; therefore, the system is stable. In case ρ ≥ 1, the server or the pier is unstable or overloaded, and finally the queue or the waiting times grow infinitely []. For the second case, to avoid system overload, a limit on the number of incoming vessels should be set by the harbour authorities, and the incoming vessels can be rejected if the system reaches the capacity imposed.
Formulas (2) and (3) calculate the average vessels at anchor (in the queue) and the average number of vessels in the system, respectively. Formulas (4) and (5) show the average time spent in queue and the average time spent in the system (at anchor and at the pier), respectively. Formula (6) determines the probability that there is no vessel in the system.
3.2.2. Total Expenses and CO2 Emissions Quantities
The total expenses include fuel expenses, port fees (pilotage, tugs, berth fees), and fees for EUETS and FuelEU Maritime. The CO2 emissions are calculated based on the emission factor for the type of fuel used. According to (European Union, 2005), vessels use fuel with a 0.1% content of sulphur in EU waters []. The emission factor for Marine Gas Oil is 3.206 tCO2/tfuel []. The formulas for calculating expenses and emissions are as follows, (7) to (13) [,,]:
where Ex is the total expenses for vessel x [EUR]; E1x, E2x, E3x are the expenses per unit of time (hour) throughout anchorage, maneuvering, and cargo operation for vessel x [EUR/h]; τ1, τ2, τ3 are the time intervals for anchorage, maneuver, and cargo operation [h]; EEUETSx and EFuelEUx are the EUETS and FuelEU Maritime fees for vessel x [EUR]; Ef is the cost of fuel per ton [EUR]; f1x, f2x, f3x are the fuel consumed while at anchorage, maneuvering, and cargo operation for vessel x [t/h]; Epx and Eopsx are the port fee expenses and cargo operation expenses for vessel x [EUR]; EFCO2 is the emission factor for CO2 for fuel [tCO2/tfuel]; Ar is the percentage applicable for the emissions, 70% for 2025 and 100% starting with 2026 (Annual rate); Tr is the Trading region, where 100%of the fee is applicable in the EU waters and 50% in case the vessel’s next port is outside the EU; EUA is the allowance fee [EUR]; GHGT and GHGA are the GHG Target and Actual [tgCO2 eq/MJ]; LCV is the Lower Calorific Value [MJ/t]; Eli is electricity (Cold Ironing) used for station i [MJ]; 41,000 represents 1 t energy for Very Low-Sulfur Fuel Oil; and EmCO2 is the CO2 emission quantities.
Expenses and emissions will be calculated based on the times determined. If τ2, τ3—time intervals for maneuver and cargo operation—are known, τ1 must be determined. The calculation will be done using Formulas (14) and (15). τ1 for vessel x must be calculated against another vessel, vessel y that is presently at the same pier. For an easier determination of time, τx and τy are introduced, and they refer to the relative time from τ0 = 0, that is, the first vessel that arrived or the start time. ESI is the entry safety interval between two consecutive vessels while docking, to avoid any close-quarters situation between the vessels.
If , vessel x will go straight to pier, and . and are already known.
If , vessel x will stay at the anchorage zone, and
and are already known.
3.3. Sensitivity Testing Using Monte Carlo Simulation
To assess the robustness of the queuing model, a Monte Carlo-based sensitivity analysis was performed on two core assumptions: maneuver time (τ2) and the entry safety interval (ESI). While both were fixed in the base model (2 h and 1 h, respectively), operational variability in busy or weather-sensitive ports may affect these durations.
The Monte Carlo simulation randomly sampled τ2 and ESI within realistic bounds:
- -
- Manoeuvre time (τ2): 1.5 to 3.5 h;
- -
- Entry Safety Interval (ESI): 0.5 to 2 h.
A total of 1000 simulation runs were executed using Python’s numpy and scipy libraries. For each run, queuing metrics (ρ, Lq, tq, and CO2 emissions) were recalculated based on perturbed input values. This approach allowed us to observe the distribution of queue outcomes under real-world variability, quantify the sensitivity of system performance, and validate whether the pier remains operationally stable across a range of conditions.
3.4. Methodological Assumptions, Constraints and Exclusions
As briefed above, the methodological framework of this study is grounded in a set of carefully defined assumptions and structural constraints, which aim to balance analytical rigor with real-world applicability. The analysis focuses on a single bulk cargo pier within the Port of Constanta and employs the M/G/1/∞/FIFO/∞ queuing model to estimate vessel waiting times, service durations, incurred costs, and associated carbon emissions.
3.4.1. Assumptions Underpinning the Queuing Model
This research assumes a deterministic vessel scheduling protocol, whereby all arriving ships are processed on a First-In-First-Out (FIFO) basis. Priority-based scheduling (whether pre-emptive or non-pre-emptive) is not applied. The pier under examination operates as a single-server system, exclusively servicing bulk carriers—namely Handysize, Supramax, and Panamax vessels—without interchanging them with other berths.
Each vessel is presumed to undergo an uninterrupted cargo operation once berthed. No splitting of cargo operations, reallocation to adjacent piers, or partial berthing conditions are modeled. In addition, it is assumed that vessels are strictly assigned to this pier, with no redirection to alternative berths considered during periods of high congestion.
The queue capacity is considered unbounded; there is no limit on the number of ships that can wait at anchorage. Furthermore, the model assumes that sufficient anchorage space exists in the port’s roadstead to accommodate all waiting vessels without physical or navigational conflict.
Regarding berth access and navigational safety, it is assumed that each vessel requires a fixed maneuvering time of two hours from anchorage to pier, and that a safety interval of one hour is enforced between consecutive berthing. These parameters align with typical local operating procedures and serve to avoid any navigational conflicts or close-quarter situations during approach and docking.
The model is informed by a set of known operational parameters for each vessel, including the arrival date and time, commodity type and volume, duration of cargo operation, and fuel consumption rates during anchorage, maneuvering, and berthing activities.
3.4.2. Methodological Constraints
By design, the queuing system is limited to a single pier configuration and does not incorporate multi-berth dynamics, shared resource scheduling, or interdependent service constraints. Consequently, the model does not reflect broader port-wide influences such as pilot availability, tugboat scheduling, or shared handling equipment, which may further affect vessel turnaround.
The temporal scope of the analysis is constrained to a three-year period (2021–2023). Each year is treated as a discrete analytical unit, and seasonal variation in vessel traffic, meteorological conditions, or regulatory enforcement is not explicitly accounted for. The applied M/G/1 queuing framework uses empirically derived service time distributions for each year but assumes homogeneity within each annual time block.
Moreover, while the M/G/1/∞/FIFO/∞ framework applied in this study offers precise modeling of the selected bulk cargo pier, it represents a single-server configuration. This design inherently excludes the complex interactions between multiple berths and shared port resources such as tugboats, pilots, and handling equipment. Consequently, the results, while valid for the isolated pier examined, have limited direct generalizability to multi-berth terminals or port-wide systems where vessel assignments and resource allocations are interdependent.
The choice of a single-berth model was intentional, reflecting the operational reality of the studied pier, which services vessels independently from other berths. Furthermore, reliable, berth-level operational data for parallel service points were not available for the study period.
Nevertheless, the methodology can be extended to M/G/k or network-based queuing systems to account for simultaneous service channels and shared resource constraints. Such extensions would enable a more comprehensive representation of congestion dynamics in complex terminal environments and could be integrated with optimization algorithms for berth allocation, tug scheduling, and quay crane assignment to further enhance model generalizability.
3.4.3. Deliberate Exclusions
To maintain focus on port-side operational factors, several elements are explicitly excluded from the analysis. First, hydrometeorological conditions, such as wind, visibility, current strength, and wave height, are not incorporated. These factors, while impactful in real-time operations, introduce stochastic complexity that is outside the scope of this deterministic queuing framework.
Although the environmental and economic implications of Cold Ironing (shore power) are discussed in the literature review section, this technology is not implemented in the modeled scenario. The study assumes that all vessels remain reliant on onboard auxiliary engines during cargo operations, in line with current infrastructure limitations at the pier.
In addition, dual berthing and tandem cargo operations are excluded. Each vessel is assumed to utilize the pier exclusively and sequentially, without sharing service resources or conducting concurrent loading/unloading. Similarly, cargo operations while at anchor—a practice occasionally used in extreme congestion scenarios—are not modelled.
Finally, the calculation of fuel consumption and emissions adheres to a uniform fuel profile, assuming the use of Marine Gas Oil (MGO) with a standardized emission factor of 3.206 tCO2 per tonne of fuel, as defined by the IMO. The model does not account for variations in fuel types, engine efficiencies, or emission abatement technologies.
While the exclusions outlined above are necessary to maintain the tractability of the analytical model, each has the potential to influence the results in measurable ways:
- -
- Weather conditions (e.g., wind, visibility, current, and wave height) can increase maneuvering times, delay berthing, and reduce operational efficiency, thereby inflating waiting times and queue lengths. Ignoring these factors may lead to an underestimation of congestion risk during adverse seasonal patterns.
- -
- Fuel variability—in terms of both type (MGO, VLSFO) and engine efficiency—directly affects the cost and emission calculations. The uniform fuel profile assumed here simplifies the analysis but may mask variations in EU ETS penalties and FuelEU Maritime compliance costs for fleets with mixed propulsion technologies.
- -
- Auxiliary resource availability (pilots, tugboats, cranes) can be a binding constraint in real operations. Even with berth availability, delays in resource mobilization can extend actual service times beyond the model’s assumptions, leading to higher-than-predicted queuing delays and emissions.
These simplifications were adopted due to data limitations and to maintain focus on pier-specific congestion dynamics. However, future research could integrate stochastic weather models, differentiated fuel profiles, and auxiliary resource scheduling constraints into the queuing framework. This would produce a more comprehensive representation of operational variability and improve the robustness of cost and emissions forecasts.
4. Results and Discussions
4.1. Vessel Traffic and Operational Characteristics
The vessel traffic and operational data for the targeted pier in Constanta Port from 2021 to 2023 are summarized in Table 1. The traffic analysis shows a notable increase in vessel calls during the period, particularly in 2022 and 2023, which can be attributed in part to the geopolitical consequences of the Ukraine conflict. This led to the diversion of traffic from Ukrainian ports to Romanian alternatives, increasing the operational burden on Constanta Port.

Table 1.
Annual vessel traffic and commodity characteristics (2021–2023) (summary of vessel types, average stay durations, and cargo handled omitted here for brevity but kept in final document).
These trends suggest escalating demands on pier infrastructure and an associated risk of increased queuing delays, with the key observations including:
- -
- A 30% increase in total vessel arrivals in 2022 compared to 2021, with an additional 10% growth in 2023;
- -
- A shift in average cargo volumes, with Panamax vessels increasingly dominating the load profiles;
- -
- Longer average berthing times, notably among Handysize and Supramax types, indicating more complex or delayed cargo handling processes.
Moreover, the chart from Figure 2 shows a consistent increase in vessel arrivals from 29 in 2021 to 45 in 2023. The average operational time per vessel also fluctuated: rising from 158.4 h in 2021 to 182.4 h in 2022, then slightly dropping to 175.2 h in 2023. The increase in vessel traffic reflects geopolitical events (e.g., the Ukraine conflict), which redirected cargo traffic toward Constanta Port. The operational time suggests more complex or lengthier unloading/loading operations, possibly due to higher cargo volumes or less efficient berth use. This sets the stage for congestion pressure at the pier, directly influencing queuing and emissions.
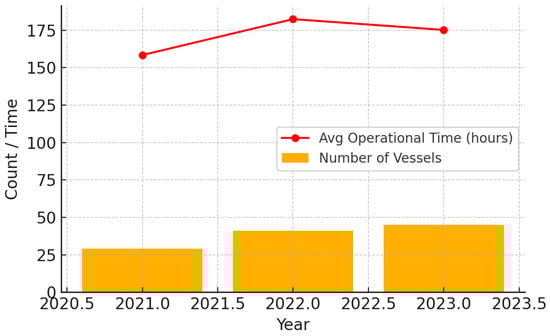
Figure 2.
Vessel traffic and operational time (2021–2023). Bars represent the total number of vessel calls per year; the line shows the average duration of port stay (hours) for all vessel types. (Source: authors’ calculations).
4.2. Queuing Model Analysis
The queuing model M/G/1/∞/FIFO/∞ was applied to assess the system’s performance under varying traffic intensities and the results are shown in Table 2.
Table 2.
Queuing management M/G/1/∞/FIFO/∞ results for 2021–2023. Key performance indicators include system utilization (ρ), average queue length (Lq, vessels), total vessels in system (L, vessels), average waiting time (tq, hours), and average time in system (t, hours).
The system utilization rate (ρ) remained below 1 across all years, indicating theoretical system stability. However, a significant upward trend was evident:
- -
- In 2021, the system was moderately utilized (ρ = 0.524), with an average queue length (Lq) of 0.335 and a wait time (tq) of approximately 87 h.
- -
- By 2023, ρ had increased to 0.900, suggesting a near-saturation state. Queue lengths quadrupled (Lq = 4.212), and average waiting times surged to over 788 h.
The probability of the system being empty (P0) dropped sharply, from 47.6% in 2021 to just 10% in 2023. This highlights the increasing operational pressure placed on the pier.
The chart from Figure 3 displays the rising system utilization (ρ), queue lengths (Lq), and average waiting time (tq) that mainly counts the anchor-queue time:
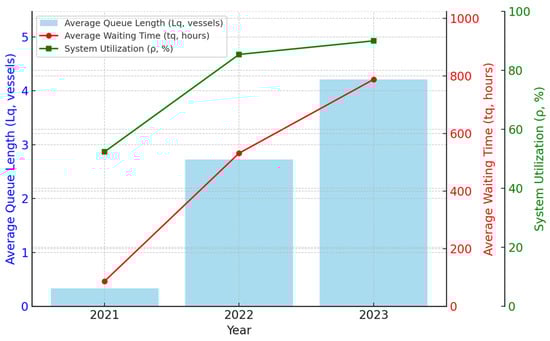
Figure 3.
Operational performance metrics for the bulk cargo pier, 2021–2023. The bar chart represents the average queue length (Lq, vessels) on the left axis. The red line shows the average waiting time in queue (tq, hours) on the central right axis, while the green line depicts system utilization (ρ, %) on the outer right axis. Data are based on the M/G/1 queuing model calibrated to recorded vessel arrivals and service times. (Source: authors calculations).
- -
- System utilization (ρ) increased from 0.524 in 2021 to 0.900 in 2023, indicating the pier is operating near capacity.
- -
- Queue length (Lq) surged more than twelvefold—from 0.335 in 2021 to 4.212 in 2023.
Average waiting time (tq) escalated dramatically from 87 h to 788 h over the same period. Although ρ remained below 1, indicating theoretical system stability, operational efficiency still deteriorated. Longer cargo operations, combined with higher traffic volumes, caused queuing delays to grow exponentially. This confirmed the non-linear impact of increased port activity.
It is important to clarify that the reported waiting time (tq) refers exclusively to the period spent at anchorage prior to berthing, and does not include maneuvering or cargo operation time. The average 2023 value of approximately 788 h corresponds to about 33 calendar days of anchorage waiting. This should be interpreted as an aggregated average across all vessel calls: while some ships experienced only short delays, peak congestion events—particularly during the redirection of cargo flows from Ukrainian ports—caused extended queues that significantly raised the mean. In operational terms, this indicates that under stress conditions, a vessel could be delayed for several days to multiple weeks before gaining access to the berth, a scenario that is consistent with port authority reports and highlights the practical vulnerability of single-berth configurations under sudden traffic surges.
4.3. Economic and Environmental Impacts
Next, the total expenses and CO2 emissions quantities were determined. The calculation was based on Formulas (13) and (14) to determine the times. If and are known for vessel x, has to be calculated on the basis of the vessel that is already berthed on the pier, with the results being presented in Table 3. The manoeuvre time is considered two hours and the entry safety interval ESI is one hour.
Table 3.
* Annual total expenses and CO2 emissions for vessels served at the bulk cargo pier (2021–2023). Expenses are expressed in thousand EUR (k€), including fuel, port fees, and EU ETS/FuelEU Maritime costs. CO2 emissions are reported in metric tonnes (tCO2). Values reflect time spent at anchorage (waiting), maneuvering, and cargo operations combined.
As shown in Table 3, annual operational expenses at the pier increased sharply over the study period. Expressed in thousand EUR (k€), total costs rose from €2213 k in 2021 to €10,660 k in 2023, reflecting a nearly fivefold increase. This escalation was driven by longer idle times at anchorage, higher cargo volumes, and extended berthing durations, all of which amplified fuel use and regulatory penalties. In parallel, CO2 emissions rose from approximately 2968 tonnes in 2021 to 27,339 tonnes in 2023. These results underscore the dual burden of congestion: higher direct operating costs and mounting exposure to EU ETS and FuelEU Maritime compliance obligations.
The chart from Figure 4 illustrates the direct financial and environmental consequences of queuing inefficiencies:
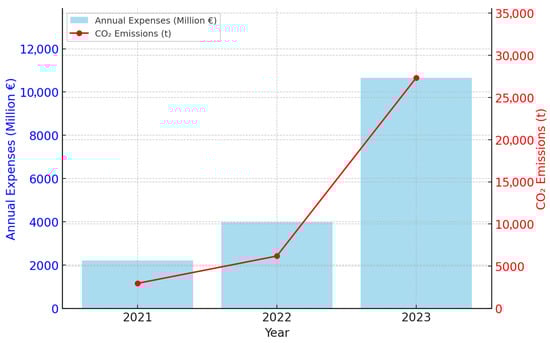
Figure 4.
Economic and environmental impacts of queuing delays at the bulk cargo pier, 2021–2023. Annual congestion-related expenses are expressed in thousand EUR (k€) and CO2 emissions are reported in tonnes (tCO2). The red line shows CO2 emissions (×1000 t) on the right axis. Data are derived from the queuing model outputs combined with fuel-based emission factors and cost estimations using prevailing EU ETS carbon prices (Source: authors calculations).
- -
- Expenses grew from €2.21 million in 2021 to €10.66 million in 2023;
- -
- CO2 emissions spiked from 2968 tons to 27,339 tons—an 820% increase.
These values reflect a combination of factors: cumulative idle time, increased fuel use at anchor, and operational delays. Rising penalties under EU ETS and FuelEU Maritime frameworks further amplified the costs. Delays at the pier are not just logistical issues—they translate into significant financial penalties and carbon emissions, tightly coupling port efficiency with sustainability compliance.
As shown in Table 1, the vessel characteristics breakdown for the pier studied for the years 2021–2023. The number of vessels in 2022 and 2023 is 30% and 35% higher than in 2021, mostly due to the conflict in Ukraine. Many vessels scheduled to visit Ukrainian ports were redirected to Constanta Port. There is an observed increase in the average volume of cargo loaded/unloaded in 2022 and 2023, compared with 2021, for the same reason. As a consequence of the increase in the number of vessels and volume of commodity, the operational time at the pier grew. This fact led to an increase in the average waiting time and average number of vessels waiting at the anchorage zone (see Table 2), although the pier can operate all the incoming vessels (ρ < 1). Other consequences are an increase in expenses (due to extended time at anchor and operational time) and in CO2 emissions quantities.
The results clearly demonstrate that even within a theoretically stable queuing system, performance deterioration is possible when average service times (cargo operations) remain high and vessel arrivals increase beyond infrastructure adaptability. The pier remained technically capable of serving all incoming vessels, but growing delays at anchor led to cascading impacts on cost and emissions. Given the fixed berth allocation and the absence of alternative service points, any increase in arrival frequency without improvements in service time efficiency (e.g., faster cargo handling or parallel operations) leads to exponential queue growth. These results validate previous studies emphasizing the compounding effects of port congestion on cost and emissions [,,]. The current analysis demonstrates that system efficiency hinges not only on vessel traffic management but also on berth service optimization.
To better understand the scale and causes of operational inefficiencies observed at Constanta’s bulk pier, a comparative analysis was conducted using data from the Port of Varna, Bulgaria. Located on the same western Black Sea coast and governed by similar EU maritime regulations, Varna presents a relevant control case due to its comparable cargo profile, vessel mix, and regional climatic conditions. However, Varna remained largely unaffected by the geopolitical redirection of maritime flows from Ukraine during the 2022–2023 period, making it an ideal benchmark.
According to Pulido-Rojano et al. (2022), who developed a discrete-event simulation model for similar medium-traffic ports, the average system utilization rate (ρ) for ports like Varna remains below 0.65 under normal operating conditions []. Queuing lengths rarely exceed 1.2 vessels, and average waiting times tend to stay below 200 h, even during moderate surges in activity. This contrasts sharply with the findings at Constanta, where the system utilization rate climbed to 0.900 in 2023, average waiting time (tq) exceeded 788 h, and the average queue length (Lq) reached 4.212 vessels.
These disparities are significant. Despite operating under structurally similar infrastructure and regulations, Varna did not experience the same systemic stress, which supports the hypothesis that Constanta’s congestion stemmed from exceptional external shocks, namely the diversion of cargo and vessel traffic from Ukraine. By controlling for port type and service profile, this comparison highlights that the rise in emissions and costs at Constanta was not a structural failure of port design, but a consequence of limited adaptability to demand shocks. For clarity, a simple numeric contrast illustrates this “shock effect”. In 2023, Constanța’s bulk pier operated with a utilization rate of ρ = 0.90, an average waiting time of about 788 h, and an average queue length of 4.2 vessels, generating congestion-related emissions on the order of 27,000 tCO2. By comparison, Varna’s bulk terminals typically report ρ values below 0.65, waiting times under 200 h, queue lengths no greater than 1.2 vessels, and emissions proxies closer to 6000 tCO2 []. This contrast underscores that Constanța’s surge in congestion and emissions was not structural, but rather a direct consequence of redirected traffic flows after 2022.
The implication is clear, as the infrastructure capacity alone does not guarantee resilience. As vessel traffic intensifies due to geopolitical or economic shifts, the absence of real-time traffic coordination, flexible scheduling, and berth optimization can cause exponential degradation of performance, even when the system remains “theoretically stable” (i.e., ρ < 1). This supports prior findings by Jiang et al. (2022) and Yu & Voß (2023), who emphasized the need for predictive scheduling and digital traffic control in EU-regulated ports [,].
4.4. Data Processing and Model Output Visualization
To ensure analytical transparency and methodological reproducibility, this section outlines the data transformation processes behind Figure 2, Figure 3 and Figure 4. These visualizations synthesize empirical vessel data with queuing model outputs and emission-cost estimations derived from both deterministic formulas and probabilistic simulations.
Figure 2 displays two key trends: the annual number of vessels serviced at the bulk cargo pier (extracted from port traffic logs for 2021–2023) and the corresponding average operational time per vessel. The operational time reflects the duration between the start and end of cargo handling operations, and is computed as the arithmetic mean of individual service intervals recorded for each vessel per year. This provides a contextual benchmark for assessing congestion pressure over time.
Figure 3 presents core queuing metrics generated via the M/G/1/∞/FIFO/∞ model, which is tailored to the pier’s single-server operational setup. The model utilizes the following parameters:
- -
- λ (arrival rate): calculated as the number of vessels per year divided by 8760 (the number of hours in a year);
- -
- μ (service rate): the reciprocal of the average service time per vessel, derived from real operational durations;
- -
- ρ (system utilization): computed as λ/μ, expressing how intensively the pier is used over time;
- -
- Lq (average number of vessels in queue) and tq (average waiting time) are derived using standard queuing theory (Equations (1)–(6)), incorporating the coefficient of service time variation (Cs), which was estimated based on the observed spread of vessel service durations.
Each variable in Figure 3 was derived by applying these formulas to real traffic data. Calculations were performed with Python v.3.13 scripts using the numpy and scipy libraries.
Moreover, Figure 4 extends the queuing model by integrating the computed waiting times (tq) into a cost-emission framework. Total CO2 emissions and financial expenditures are estimated using Equations (7) through (14), which factor in:
- -
- Time spent at anchor (τ1) derived from the queue output;
- -
- Per-hour fuel consumption rates by ship type;
- -
- Emissions factors per ton of fuel burned (based on IMO standards);
- -
- Applicable EU ETS and FuelEU Maritime rates depending on voyage routes and vessel tonnage.
These outputs are aggregated annually and visualized in Figure 4 to illustrate the exponential relationship between queuing inefficiency and environmental/economic penalties.
This three-stage data architecture—(1) empirical extraction, (2) model-driven processing, and (3) scenario-based economic-emission transformation—ensures that the visualizations are grounded in real-world operations but analytically framed for policy-relevant inference. To further enhance reproducibility, a sample Python code has been used for the Monte Carlo simulation and annual cost-emission calculations.
4.5. Sensitivity Analysis Using Monte Carlo Simulation
To assess the robustness of the queuing model under uncertain real-world conditions, a sensitivity analysis was conducted using a Monte Carlo simulation. This technique allows for the evaluation of how minor variations in critical operational assumptions—specifically maneuver time (τ2) and the entry safety interval (ESI)—can affect system performance metrics such as queue length, average waiting time, system utilization, and associated CO2 emissions.
Before presenting the results, it is important to note that the simulation is designed to capture tail risk: the extreme upper-quantile values (e.g., waiting times exceeding 100,000 h or CO2 emissions above 350,000 t) represent theoretical worst-case scenarios generated under compounding stochastic conditions, rather than realistic operational outcomes.
4.5.1. Objective and Justification
In the baseline model, manoeuvre time was assumed to be 2 h and the ESI (the interval between successive berthing) was set to 1 h. While these are reasonable under ideal conditions, real port operations are affected by uncertainties such as vessel size variability, tugboat availability, or weather constraints. As noted by Law (2014) and Rubinstein & Kroese (2017), even small fluctuations in these parameters can lead to significant operational variability, especially in high-utilization systems [,]. Thus, introducing probabilistic testing via simulation provides a more resilient evaluation of pier performance.
The simulation used 1000 Monte Carlo iterations to model stochastic variation in:
- Maneuver time (τ2): uniformly sampled from 1.5 to 3.5 h;
- Entry Safety Interval (ESI): uniformly sampled from 0.5 to 2.0 h;
- Service time: drawn from a normal distribution (mean = 175.2 h, std dev = 20 h).
For each iteration, the queuing model calculated:
- Utilization (ρ);
- Queue length (Lq);
- Average waiting time in queue (tq);
- Total CO2 emissions (based on idle time × 3.5 t/h).
The choice of 1000 iterations in the Monte Carlo simulation reflects a balance between computational efficiency and statistical reliability. In stochastic modeling, the goal is to approximate the distribution of possible outcomes, such as queue length, waiting time, or emissions, with sufficient precision. Running 1000 simulations ensures the following:
- Convergence of results: after around 500–1000 runs, the mean and confidence intervals of key metrics (e.g., average waiting time) tend to stabilize, yielding reproducible and statistically meaningful insights [];
- Capturing tail events: high-quantile outcomes, such as extreme congestion or emissions spikes, are rare but critical—a larger number of iterations increases the chance of observing and quantifying such outliers;
- Computational feasibility: while more iterations (e.g., 10,000) can offer marginally better precision, the additional computational cost is often unjustified for exploratory or planning-level studies.
Thus, 1000 iterations are commonly accepted in applied operational research and simulation studies for achieving a robust yet computationally manageable output.
The queuing system assumes M/G/1 characteristics and moderate service time variability (coefficient of variation, Cs = 0.2). The service rate (μ) was recalculated dynamically for each sample based on the perturbed service time.
4.5.2. Python Code Implementation
The simulation was written in Python using numpy, matplotlib, and pandas. A simplified version of the code is included below for reproducibility, as shown in Table 4.
Table 4.
Python code for Monte Carlo simulation.
The simulation results are summarized in Table 5 below. The 95% confidence intervals highlight the variability introduced by minor operational changes.
Table 5.
Summary statistics from Monte Carlo simulation (n = 1000 runs) for 2023 operational conditions. Metrics include mean, 2.5th percentile, median, and 97.5th percentile values for system utilization (ρ), average queue length (Lq, vessels), average waiting time in queue (tq, hours), and total CO2 emissions (tCO2).
The Monte Carlo outcomes highlight that the system remains theoretically stable, but performance is highly sensitive to variation in maneuvering time and berth access intervals. To provide a balanced picture, we emphasize the median and 95% confidence interval ranges rather than the raw extremes. In 2023 conditions, the median waiting time (tq) was approximately 859 h, with 95% of outcomes falling between 155 and 101,024 h. Similarly, CO2 emissions had a median of ~3000 t, with a 95% range of 544–353,586 t. These distributions confirm the skewed nature of congestion risk: while most outcomes cluster in the low-to-moderate range, the long right-hand tail illustrates how rare combinations of delays can escalate into severe congestion. The extreme values should therefore be interpreted as stress-test boundaries, rather than expected averages, providing insight into system resilience under compounding disruptions.
Notably, while the mean utilization (ρ) remains below 1.0, the waiting time (tq) and emissions show extreme variability. In the upper 2.5% of scenarios, queue length exceeded 500 vessels. In the same tail cases, waiting times rose above 100,000 h and CO2 emissions approached 350,000 tons. This non-linear behavior highlights the system’s vulnerability to minor scheduling disruptions, especially under high-traffic conditions where ρ > 0.85. Figure 5 below illustrates the distribution of waiting times across simulation runs.
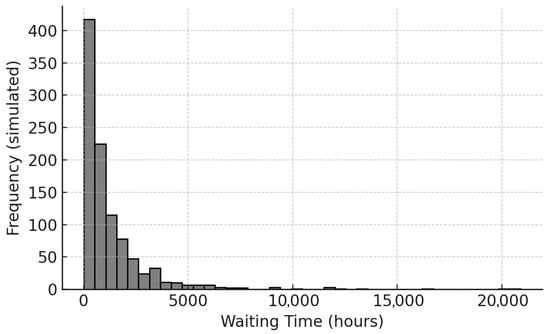
Figure 5.
Distribution of simulated waiting times (tq) from Monte Carlo analysis. Histogram shows frequency distribution of waiting times (hours) based on 1000 simulation runs for 2023 operational conditions (Source: authors’ simulation).
The long right-hand tail reflects rare but severe congestion spikes, reinforcing the importance of adopting real-time scheduling tools and dynamic vessel arrival coordination.
The Monte Carlo analysis confirms that the queuing system, although technically stable (ρ < 1), can produce extreme congestion and emissions outcomes under slight changes to maneuvering and safety intervals. This underscores the need for:
- -
- Real-time decision support tools;
- -
- Just-in-time arrival coordination;
- -
- Dynamic berth allocation and digital traffic control.
These findings are consistent with prior research emphasizing the fragile nature of maritime queuing systems under stochastic variation [].
It is important to underscore that the extreme values reported in the upper quantiles of the simulation—such as queue lengths exceeding 500 vessels, waiting times surpassing 100,000 h, and CO2 emissions above 350,000 tons—do not reflect plausible real-world outcomes. These values represent theoretical worst-case scenarios generated under compounding stochastic conditions within the Monte Carlo framework. Specifically, they emerge from rare combinations of maximal maneuver time, prolonged service duration, and minimum berth access intervals occurring simultaneously across the simulation horizon.
As Law (2014) and Rubinstein & Kroese (2017) emphasize, such outliers in probabilistic models serve a diagnostic role by flagging zones of operational vulnerability rather than forecasting likely events [,]. In this context, the extreme outputs should be interpreted as stress-test boundaries rather than probable congestion or emission scenarios. Their inclusion enhances the model’s capacity to evaluate resilience under edge-case conditions and supports contingency planning for high-impact, low-probability events.
To enhance the interpretation of simulation outcomes, Figure 6 presents two complementary visualizations: a histogram of total CO2 emissions across 1000 simulation runs, and a scatter plot illustrating the relationship between system utilization (ρ) and emissions levels. The histogram reveals a highly skewed distribution, with most emission values concentrated below 25,000 tons, yet with a long right tail extending beyond 100,000 tons. These extreme outcomes correspond to rare but operationally critical scenarios in which berth access delays trigger prolonged vessel idling. The scatter plot further underscores this trend, showing that as utilization approaches saturation (ρ > 0.9), emissions increase exponentially. This non-linear escalation reflects the system’s sensitivity to small fluctuations in traffic intensity, particularly under high-load conditions. Together, these visuals validate the need for dynamic berth scheduling, predictive queuing management, and emissions mitigation strategies such as Cold Ironing or Just-In-Time (JIT) arrivals to prevent runaway congestion and regulatory exposure [].
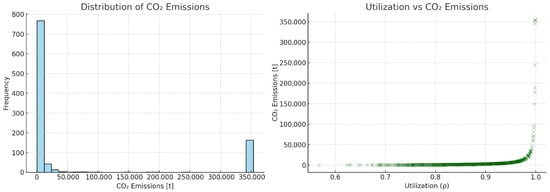
Figure 6.
Distribution and utilization-linked variability in CO2 emissions (Monte Carlo Simulation). Left diagram: Histogram of CO2 emissions across 1000 stochastic simulation runs. Right diagram: Scatter plot showing the positive, non-linear relationship between system utilization (ρ) and total emissions. Both charts illustrate the vulnerability of port operations to traffic variability and queue congestion under near-saturation conditions (Source: authors’ simulation).
While the queuing system remains theoretically stable (ρ < 1), the simulation reveals that under certain high-stress configurations—particularly where ρ exceeds 0.95—the system approaches functional saturation. Outlier cases in which average vessel waiting time (tq) surpasses 100,000 h correspond to extreme congestion states where the cumulative queuing effect becomes unsustainable. These do not reflect realistic operational durations per vessel, but rather a mathematical signal of system overload. Such results are not anomalies but early-warning indicators of latent instability, underscoring the nonlinear vulnerability of port performance []. As highlighted by Xu, Chen, and Quan (2012), queuing models under high-variability inputs can produce extreme outputs that represent risk zones for real-world system failure, justifying the use of proactive scheduling, real-time traffic coordination, and resilience planning [].
4.6. Scenario Analysis: Cold Ironing Impact on Pier-Level Emissions
To quantify the emissions-reduction potential of Cold Ironing, a scenario analysis was performed. Using the vessel-specific CO2 emissions model, a second simulation was conducted assuming vessels fully switch to shore power during cargo operations, eliminating emissions from onboard fuel combustion at berth. Table 6 clears up which part of the operational profile is affected by Cold Ironing and under what assumptions emissions are reduced.
Table 6.
Assumptions and parameters for Cold Ironing scenario analysis.
Building on the assumptions outlined above, Table 7 presents the comparative results of total CO2 emissions under two distinct scenarios: the baseline case, in which all energy used during cargo operations is generated by the vessel’s auxiliary engines burning Marine Gas Oil (MGO), and the Cold Ironing scenario, in which vessels utilize shore-side electrical power while at berth. The emissions savings are computed across the 2021–2023 period using vessel-type-specific operational data. The resulting estimates highlight the significant environmental benefit of Cold Ironing adoption, particularly in high-traffic years. It is important to note that the emissions presented earlier in Table 3 reflect only the incremental impact of congestion, as calculated from queuing-related idle times. By contrast, the baseline values in Table 7 include the full pier-level emissions across anchorage, maneuvering, and cargo operations. This broader scope ensures a consistent reference point for evaluating the Cold Ironing scenario, which directly affects the cargo operation phase. The apparent difference between Table 3 and Table 7 therefore arises from their differing scopes of calculation: congestion-related emissions versus total operational emissions.
Table 7.
* Annual CO2 emissions with and without Cold Ironing adoption at the bulk cargo pier (2021–2023). The Baseline scenario assumes all energy supplied from onboard engines (MGO) during anchorage, maneuvering, and cargo operations. The Cold Ironing scenario assumes shore power during cargo operations only. Emission reductions are expressed as a percentage relative to baseline.
The analysis reveals that Cold Ironing could reduce total pier emissions by approximately 37% annually, aligning with estimates from previous authors’ results [,]. As cargo operations are typically the longest energy-consuming phase while in port, electrifying this stage yields the highest potential savings.
It should be noted that the Cold Ironing scenario assumes zero local (pier-level) emissions during cargo operations; life-cycle emissions from electricity generation are not included. Given Romania’s grid mix in 2023 (approximately 70% low-carbon sources), incorporating upstream electricity emissions would not alter the main conclusion that Cold Ironing yields a substantial net reduction in CO2 compared with onboard MGO combustion.
These findings support strategic investments in Cold Ironing infrastructure at Constanta Port. From a regulatory perspective, emission reductions during cargo operations directly lower shipowner exposure to EU ETS liabilities and FuelEU Maritime penalties. Cold Ironing thus emerges not only as a technical solution but as a cost-avoidance mechanism in tightening EU maritime regulations.
4.7. Result Interpretations
This study analyzed the operational performance of a specific bulk cargo pier in the Port of Constanta between 2021 and 2023, using the M/G/1/∞/FIFO/∞ queuing model to estimate system utilization, queuing times, and their associated economic and environmental impacts. Results showed a sharp increase in vessel traffic due to regional geopolitical disruptions, particularly the redirection of cargo from Ukrainian ports. Despite maintaining theoretical stability (ρ < 1), the pier experienced significant performance degradation, with average waiting times increasing from 87 h in 2021 to over 788 h in 2023, and annual CO2 emissions escalating by over 800%.
To further validate these results, a control comparison was introduced using the Port of Varna as a regional benchmark. Unlike Constanta, Varna did not experience redirected traffic at the same scale and demonstrated lower queue lengths, shorter average waiting times, and emissions more aligned with historical norms. This comparative framing confirms that Constanta’s rising congestion and emissions are not structural, but driven by external demand shocks and a lack of operational adaptability.
A refined CO2 emissions model was developed to replace uniform fuel assumptions with vessel-specific fuel consumption rates based on ship type (Handysize, Supramax, Panamax) and operational phase (anchorage, maneuvering, cargo ops). This enhanced model revealed that Panamax vessels, though smaller in number, contributed a disproportionately high share of emissions due to longer operational times and higher fuel consumption rates, highlighting the importance of using granular vessel data for regulatory planning and port sustainability assessments.
To provide a more policy-relevant interpretation of the CO2 emissions results, the annual values shown in Figure 4 were also converted into their equivalent cost under the EU Emissions Trading System (EU ETS). Using the 2023 average allowance price of €87 per tonne of CO2, the modeled emissions from queuing delays correspond to estimated congestion-related carbon costs of about €0.26 million in 2021, €0.54 million in 2022, and €2.38 million in 2023. These figures highlight the direct financial burden of congestion-related emissions under current carbon pricing mechanisms and reinforce the economic case for operational efficiency measures such as berth scheduling optimization and Just-In-Time arrivals.
The Cold Ironing scenario analysis demonstrated the substantial environmental and regulatory benefits of electrifying cargo operations. Results showed that pier-level CO2 emissions could have been reduced by approximately 37% annually had vessels used shore power while berthed. This reduction corresponds to tens of thousands of avoided tonnes of CO2 and associated EU ETS liabilities, positioning Cold Ironing as both a climate strategy and a cost-avoidance mechanism. These findings support strategic investments in shore-side electrical infrastructure and align with EU decarbonization policies under the European Green Deal.
While the environmental benefits of Cold Ironing adoption at the studied pier are clear in terms of CO2 emission reductions, a complete assessment requires consideration of capital and operational costs relative to potential savings. Industry estimates suggest that installing shore power infrastructure for a single bulk cargo berth can cost between €3–6 million, depending on local electrical grid capacity, substation requirements, and retrofitting needs for both shore and ship-side systems []. Annual operating costs, including electricity supply and maintenance, may range from €100,000–250,000.
Finally, the Monte Carlo sensitivity analysis revealed that the system is highly sensitive to moderate fluctuations in maneuvering time and berth access intervals. Despite stable average utilization, waiting times and emissions increased exponentially under certain high-load scenarios, demonstrating the system’s fragility under stochastic conditions. This confirms that static queuing models must be complemented by probabilistic simulations in infrastructure and policy planning, especially for ports operating near capacity.
It should also be noted that the modeled results reflect an idealized operational environment and exclude several real-world variables that can affect port performance. Weather disruptions, variations in fuel type and efficiency, and the availability of auxiliary resources (e.g., pilots, tugboats, cranes) were not incorporated into the queuing framework. Each of these factors can cause deviations from the model’s predictions—for example, weather-related restrictions may lengthen maneuvering times, variable fuel profiles could alter total emissions and compliance costs, and limited auxiliary resources could extend actual service durations even when berth capacity is available. As such, the observed values for waiting times, congestion, and emissions should be interpreted as baseline estimates, with the understanding that actual conditions in port operations may lead to higher variability.
Overall, this research underscores the urgent need for real-time traffic management, digital scheduling systems, and decarbonization infrastructure in port environments subject to regulatory and geopolitical pressures. The methodological framework presented here offers a replicable approach for assessing port resilience, emissions exposure, and capacity constraints using queuing theory and emissions modeling. Future research should explore multi-berth queuing networks, dynamic fuel pricing, stochastic weather disruptions, and digital twin models for more comprehensive maritime systems optimization.
4.8. Limitations of the M/G/1 Model and Prospects for M/G/k Integration
While the M/G/1/∞/FIFO/∞ queuing model provides a foundational framework for evaluating port congestion under stochastic vessel arrivals and general service time distributions, it inherently assumes a single-server structure. This configuration reflects the presence of a single operational berth and thus simplifies the system dynamics by excluding interactions between multiple service points. As a result, the model is most appropriate for piers or terminals with strictly segregated vessel assignments, as is the case in this study.
However, many real-world port environments feature multiple berths operating in parallel, with vessel assignments dynamically optimized across resources. In such scenarios, the M/G/k model—where k denotes the number of servers (berths)—provides a more comprehensive approximation of system behavior [,]. The M/G/k framework accounts for parallel processing capabilities and queuing interactions across multiple service channels, offering a better estimation of waiting times, berth occupancy, and overall capacity utilization.
The primary constraint in adopting an M/G/k model within this study is the lack of interoperable berths at the selected pier; vessels are rigidly assigned to a single quay, precluding cross-allocation. Nonetheless, for future studies or for ports with shared berth systems, implementing an M/G/k or M/M/c approach may provide richer insights into network-wide congestion patterns, service-level trade-offs, and optimal berth scheduling strategies [,,].
Thus, while the M/G/1 model remains valid for the isolated pier analyzed here, expanding to M/G/k formulations will enhance model realism and policy applicability in multi-berth terminal contexts.
5. Conclusions
The study analysed a particular pier in Constanta Port, from the point of view of the number of vessels that visited the pier in the years 2021, 2022, and 2023. The queuing management M/G/1/∞/FIFO/∞ has been applied to the pier to provide an indication of the pier performance. High queues lead to additional operational costs; therefore, the parameters must be evaluated and further decisions on reducing the queuing times and lengths should be analysed by the harbour authorities. The number of vessels and the operational time—cargo operation duration—show that the pier can satisfy the vessel demand, meaning that all vessels arrived for the pier were served. Because the vessels have various sizes and volumes of cargo operated, the operational time varies significantly from 42 h to 256 h. The variable that gives the indication of the pier total utilization is ρ, with the value of ρ being sub-unitary each year, which means that the system is stable. However, due to high average operational times, the waiting times and the length of queue increase significantly in 2023 compared with 2021.
The queuing model outputs demonstrated a significant escalation in traffic intensity. While the system remained below the critical threshold of instability (ρ < 1), the rising values of ρ—from 0.524 in 2021 to 0.900 in 2023—indicated an approach toward saturation. This near-capacity state resulted in exponential increases in queue length and average waiting times, from 87 h in 2021 to nearly 800 h in 2023.
These waiting times translated into severe economic and environmental burdens. Total vessel-related expenses rose nearly fivefold, reaching €10.66 million in 2023, while associated CO2 emissions surged from 2968 tons in 2021 to over 27,000 tons. The correlation between idle time and penalties under the EU ETS and FuelEU Maritime frameworks revealed that environmental inefficiencies are now inseparable from financial performance.
The findings validate the operational vulnerability of ports under increased traffic pressure and regulatory obligations. The pier was theoretically adequate to serve all vessels, but operational limitations in service time and berth scheduling led to tangible inefficiencies. High queuing times lead to high expenses. While at anchor, the vessels consume fuel oil (quantity consumed depends on the size of the vessel), expenses that are added to port fees, pilotage fees, cargo operational fees, and fuel consumed while at the pier. The extra fuel consumed at anchor does not result in extra expenses for fuel. It results in additional expenses for EUETS and FuelEU Maritime penalties and higher emissions, with damaging consequences on the environment.
To mitigate congestion and reduce associated costs and emissions, several operational measures can be considered. In the single-berth configuration examined, the most effective levers are Just-in-Time (JIT) arrivals and optimized berth scheduling, which directly reduce system utilization (ρ) and queue length (Lq) by aligning vessel arrivals with berth availability and shortening idle periods. Additional measures such as limiting the number of vessels waiting at anchorage or improving cargo operation efficiency could also bring immediate relief within a single-berth context. By contrast, broader strategies—such as coordinated berth allocation across terminals, priority handling schemes, or network-level traffic management—require multi-berth or M/G/k models to be fully evaluated, as they involve interactions across multiple resources. Finally, the introduction of Cold Ironing infrastructure represents a complementary measure that primarily addresses emissions at berth rather than congestion, but its adoption would substantially reduce the environmental and financial penalties associated with extended port stays.
The harbour’s goal is to digitize operations by real-time traffic management platform implementation, by optimizing just-in-time arrivals, and by the integration of transport and hydro-meteorological data to improve operational decision-making. Queuing theory is used to highlight existing disruptions within an operating system and to provide guidance for increasing operational efficiency by suggesting the values that certain system parameters must reach in order to achieve appropriate levels of performance.
This study provides novel empirical evidence on how pier-level performance affects both environmental and economic outcomes under the scope of EU maritime regulatory frameworks. The integration of queuing theory with EU emissions penalty structures is a unique contribution to the literature, enhancing the analytical toolkit available to port managers and policy designers. The research findings can inform:
- -
- Port authorities seeking to optimize berth scheduling and reduce emissions;
- -
- Shipping companies aiming to align just-in-time arrivals with cost minimization;
- -
- Policy makers evaluating infrastructure investments under the European Green Deal.
Moreover, the research presents a reproducible model that can be scaled or adapted to other ports under similar traffic and environmental constraints.
Building upon the current findings, future research should explore:
- -
- Multi-berth or multi-pier queuing models (e.g., M/G/k systems) to capture network-wide congestion and resource-sharing;
- -
- Integration of stochastic weather impacts on service times and arrival rates to better approximate real-world conditions;
- -
- Simulation-based sensitivity analysis on fuel prices, emission allowances, and operational changes to assess risk and adaptability;
- -
- Comparative port studies across EU and non-EU regions to evaluate the differentiated impact of emissions policies;
- -
- Digital twin models for port operations, combining real-time data from AIS, meteorology, and berth sensors for predictive optimization.
By pursuing these directions, researchers can provide deeper insight into the resilience and sustainability of maritime logistics systems amid climate regulation and geopolitical uncertainty.
Not in the least, building upon the present findings, a valuable direction for future research involves extending the current single-server M/G/1 queuing model into a multi-berth simulation using the M/G/k framework. This would address a key limitation of the present study—its focus on a single berth operating independently—and improve the model’s generalizability to more complex port environments. An M/G/k or network-based approach would capture interactions among multiple berths and shared resources such as tugboats, pilots, and handling equipment, enabling a system-wide representation of congestion dynamics. Such an extension could also be combined with optimization algorithms for berth allocation and resource scheduling to provide more robust decision-support tools for port authorities. This would enable a more granular assessment of congestion dynamics in ports with shared resource constraints, parallel berthing operations, and variable berth availability. The M/G/k approach can capture system-wide interactions among piers and offer deeper insights into optimal berth allocation strategies, especially under irregular vessel arrival patterns.
Moreover, the integration of real-time Automatic Identification System (AIS) data represents a critical enhancement to model fidelity. By leveraging historical and live AIS signals—tracking vessel position, speed, and status—researchers can construct dynamic arrival distributions and service time profiles reflective of actual operational behavior. This would allow for real-time queuing prediction, congestion forecasting, and potentially adaptive berth scheduling under Just-In-Time (JIT) arrival protocols. Combined, the M/G/k simulation and AIS-based inputs would lay the foundation for developing digital twin models of port operations, an emerging paradigm in maritime logistics that aligns operational resilience with environmental and economic performance.
The recommendations presented in this study should be interpreted within the scope of the specific operational and methodological parameters applied. The results are derived from a single-berth M/G/1 queuing model calibrated to the bulk cargo pier in Constanta Port, using empirical traffic and service time data from 2021–2023. As such, the findings and suggested measures—such as implementing Cold Ironing, adopting Just-In-Time vessel arrivals, and optimizing berth scheduling—are most directly applicable to similar single-berth bulk cargo operations with comparable traffic patterns and resource structures.
These recommendations should be applied with caution in multi-berth or highly integrated port environments, where berth interactions, shared resource constraints, and variable operating conditions (e.g., weather, fuel type variability) may alter congestion dynamics and the associated environmental and economic impacts. Future extensions of this work, such as applying M/G/k or network-based queuing models and integrating stochastic environmental factors, could broaden the generalizability of the recommendations while preserving their operational relevance.
In conclusion, this research underscores the critical interplay between port operational efficiency, environmental sustainability, and economic viability in the context of evolving maritime regulations. By bridging queuing theory with emissions and cost modeling, the study offers a practical decision-support tool for port authorities, operators, and policy makers alike. As maritime trade continues to expand and climate policies tighten, ports must embrace data-driven strategies to ensure resilience, reduce carbon footprints, and maintain competitiveness. The results presented here serve as both a diagnostic and a prescriptive framework for enhancing port performance under real-world constraints, laying the foundation for further academic inquiry and applied innovation in sustainable maritime logistics.
Author Contributions
Conceptualization, L.R., C.P., D.A. and A.T.N.; Methodology, L.R., C.P., D.A. and A.T.N.; Software, L.R., C.P., D.A. and A.T.N.; Validation, L.R. C.P., D.A. and A.T.N.; Formal analysis, L.R., C.P., D.A. and A.T.N.; Investigation, L.R., C.P., D.A. and A.T.N.; Resources, L.R., C.P., D.A. and A.T.N.; Data curation, L.R., C.P., D.A. and A.T.N.; Writing—original draft, L.R., C.P., D.A. and A.T.N.; Writing—review & editing, L.R., C.P., D.A. and A.T.N.; Visualization, L.R., C.P., D.A. and A.T.N.; Supervision, L.R. and C.P.; Project administration, L.R. and C.P.; Funding acquisition, L.R., C.P., D.A. and A.T.N. All authors have read and agreed to the published version of the manuscript.
Funding
This research received no external funding.
Data Availability Statement
The original contributions presented in this study are included in the article. Further inquiries can be directed to the corresponding authors.
Conflicts of Interest
The authors declare no conflicts of interest.
Abbreviations
| AIS | Automatic Identification System |
| CI | Cold Ironing |
| CO2 | Carbon Dioxide |
| ESI | Entry Safety Interval |
| EU | European Union |
| EU ETS | European Union Emission Trading System |
| EUA | European Union Allowances |
| FIFO | First-In First-Out |
| GHG | Greenhouse Gases |
| GT | Gross Tonnage |
| IMO | International Maritime Organization |
| LSFO | Low-Sulphur Fuel Oil |
| MGO | Marine Gas Oil |
| VLSFO | Very Low-Sulphur Fuel Oil |
References
- United Nations (UCTAD). Review of Maritime Transport; UN Trade and Development: Geneva, Switzerland, 2024. [Google Scholar] [CrossRef]
- European Union. DIRECTIVE 2005/33/EC. In Directive 2005/33/EC of the European Parliament and of the Council of 6 July 2005 Amending Directive 1999/32/EC; European Union: Brussels, Belgium, 2005. [Google Scholar]
- Rauca, L.; Carp, D. Overview of the vessel’s costs under EU emission regulations. Sci. Bull. Nav. Acad. 2024, XXVII, 225–233. [Google Scholar] [CrossRef]
- Canepa, M.; Ballini, F.; Dalaklis, D.; Frugone, G.; Sciutto, D. Cold ironing: Socio-economic analysis in the port of genoa. Logistics 2023, 7, 28. [Google Scholar] [CrossRef]
- Toufexis, P. The Impact of Cold Ironing in Modern Ports: The Case of Piraeus. Master’s Thesis, University of Piraues, Piraeus, Greece, 2024. Available online: https://dione.lib.unipi.gr/xmlui/handle/unipi/17324 (accessed on 1 April 2025).
- Yu, J.; Voß, S. Towards just-in-time arrival for container ships by the integration of prediction models. In Proceedings of the 56th Hawaii International Conference on System Sciences, Waikoloa Village, HI, USA, 3–6 January 2023; Available online: https://hdl.handle.net/10125/102778 (accessed on 1 April 2025).
- Mubder, A. Just-in-Time Arrival in Port Calls: Potential and Implementation. Doctoral Dissertation, Linköping University Electronic Press, Linköping, Sweden, 2023. Available online: https://liu.diva-portal.org/smash/get/diva2:1805088/FULLTEXT01.pdf (accessed on 1 April 2025).
- Pruyn, J.F.J.; Kana, A.A.; Groeneveld, W.M. Analysis of port waiting time due to congestion by applying Markov chain analysis. In Maritime Supply Chains; Elsevier: Amsterdam, The Netherlands, 2020; pp. 69–94. [Google Scholar]
- Feng, M.; Shaw, S.L.; Peng, G.; Fang, Z. Time efficiency assessment of ship movements in maritime ports: A case study of two ports based on AIS data. J. Transp. Geogr. 2020, 86, 102741. [Google Scholar] [CrossRef]
- Peng, W.; Bai, X.; Yang, D.; Yuen, K.F.; Wu, J. A deep learning approach for port congestion estimation and prediction. Marit. Policy Manag. 2023, 50, 835–860. [Google Scholar] [CrossRef]
- De, A.; Pratap, S.; Kumar, A.; Tiwari, M.K. A hybrid dynamic berth allocation planning problem with fuel costs considerations for container terminal port using chemical reaction optimization approach. Ann. Oper. Res. 2020, 290, 783–811. [Google Scholar] [CrossRef]
- Yildirim, M.S.; Aydın, M.M.; Gökkuş, Ü. Simulation optimization of the berth allocation in a container terminal with flexible vessel priority management. Marit. Policy Manag. 2020, 47, 833–848. [Google Scholar] [CrossRef]
- Xia, Z.; Guo, Z.; Wang, W.; Jiang, Y. Joint optimization of ship scheduling and speed reduction: A new strategy considering high transport efficiency and low carbon of ships in port. Ocean. Eng. 2021, 233, 109224. [Google Scholar] [CrossRef]
- Jiang, X.; Zhong, M.; Shi, J.; Li, W.; Sui, Y.; Dou, Y. Overall scheduling model for vessels scheduling and berth allocation for ports with restricted channels that considers carbon emissions. J. Mar. Sci. Eng. 2022, 10, 1757. [Google Scholar] [CrossRef]
- Grzelakowski, A.S.; Karaś, A. Queueing theory as an instrument of optimization operational and economic sphere of port terminals-case study. LogForum 2020, 18, 345–355. [Google Scholar] [CrossRef]
- Popa, M.; Rosca, E.; Rusca, F.; Costescu, D.; Dragu, V. Transit time through the border-crossing points: The case study of the EU’s road BCP with Moldavia. Transp. Probl. 2016, 11, 79–89. [Google Scholar] [CrossRef][Green Version]
- Costea, A. Modelarea Matematică a Traficului Informațional și Activității Portului Maritim. Ph.D. Disertation; Academia de Științe a Moldovei, Institutul de Matematică și Informatică: Chișinău, Moldova, 2016. Available online: http://www.cnaa.md/files/theses/2016/50778/costea_alina_thesis.pdf (accessed on 1 April 2025).
- Nwachukwu, T.C.; Akpudo, C.U.; Enyinda, C.A.; Stephens, M.S. Queue Modeling Simulation for Vessel Traffic in Nigeria Sea Ports. Int. J. Sci. Res. Math. Stat. Sci. 2023, 10, 27–32. [Google Scholar][Green Version]
- Guo, L.; Zheng, J.; Liang, J.; Wang, S. Column generation for the multi-port berth allocation problem with port cooperation stability. Transp. Res. Part B Methodol. 2023, 171, 3–28. [Google Scholar] [CrossRef]
- Zhen, L.; Zhuge, D.; Wang, S.; Wang, K. Integrated berth and yard space allocation under uncertainty. Transp. Res. Part B Methodol. 2022, 162, 1–27. [Google Scholar] [CrossRef]
- Yuan, K.; Wang, X. Promoting Cleaner Production in Ports: Analysis of Joint Governance by Central and Local Governments. Transp. Res. Rec. 2023, 2678, 693–722. [Google Scholar] [CrossRef]
- Wen, X.; Chen, Q.; Yin, Y.-Q.; Lau, Y.; Dulebenets, M.A. Multi-Objective Optimization for Ship Scheduling with Port Congestion and Environmental Considerations. J. Mar. Sci. Eng. 2024, 12, 114. [Google Scholar] [CrossRef]
- Pravalika, D.; Sarla, P.; Reddy, R.A. Comparative analysis of M/G/K queueing model with artificial neural networks for service system dynamics. Discov. Appl. Sci. 2025, 7, 483. [Google Scholar] [CrossRef]
- Ayaz, I.Z.; Bucak, U.; Esmer, S. How to integrate ports into the EU ETS: The CAS approach perspective. Int. J. Logist. Manag. 2024, 35, 719–735. [Google Scholar] [CrossRef]
- Hess, M.; Kos, S.; Hess, S. Queuing system in optimization function of the port’s bulk unloading terminal. Promet-Traffic Transp. 2007, 19, 61–70. [Google Scholar]
- International Maritime Organization (IMO). Fourth IMO GHG Study, Full Report; International Maritime Organization: London, UK, 2020; Available online: https://www.imo.org/en/ourwork/environment/pages/fourth-imo-greenhouse-gas-study-2020.aspx (accessed on 1 April 2025).
- Aslam, S.; Michaelides, M.P.; Herodotou, H. Berth allocation Considering Multiple Quays: A Practical approach using Cuckoo search Optimization. J. Mar. Sci. Eng. 2023, 11, 1280. [Google Scholar] [CrossRef]
- Pulido-Rojano, A.; Verdeza-Villalobos, A.; Martínez-Jiménez, B.; Pérez-De-Ávila, K.; Castellanos-Benítez, D.; Sarmientopérez-Polo, J.; Pulido-Rojano, P. A discrete-event simulation model for the analysis of a waiting line system in port services: A case study. INGENIARE-Rev. Chil. Ing. 2022, 30, 145–156. [Google Scholar] [CrossRef]
- Law, A.M. Simulation Modeling and Analysis, 5th ed.; McGraw-Hill Education: Columbus, OH, USA, 2014. [Google Scholar]
- Rubinstein, R.Y.; Kroese, D.P. Simulation and the Monte Carlo Method, 3rd ed.; Wiley: Hoboken, NJ, USA, 2017. [Google Scholar]
- Xu, Y.; Chen, Q.; Quan, X. Robust berth scheduling with uncertain vessel delay and handling time. Ann. Oper. Res. 2012, 192, 123–140. [Google Scholar] [CrossRef]
- Pruyn, J.; Willeijns, J. Cold ironing: Modelling the interdependence of terminals and vessels in their choice of suitable systems. J. Shipp. Trade 2022, 7, 17. [Google Scholar] [CrossRef]
- Qu, H.; Wang, X.; Meng, L.; Han, C. Liner Schedule Design under Port Congestion: A Container Handling Efficiency Selection Mechanism. J. Mar. Sci. Eng. 2024, 12, 951. [Google Scholar] [CrossRef]
Disclaimer/Publisher’s Note: The statements, opinions and data contained in all publications are solely those of the individual author(s) and contributor(s) and not of MDPI and/or the editor(s). MDPI and/or the editor(s) disclaim responsibility for any injury to people or property resulting from any ideas, methods, instructions or products referred to in the content. |
© 2025 by the authors. Licensee MDPI, Basel, Switzerland. This article is an open access article distributed under the terms and conditions of the Creative Commons Attribution (CC BY) license (https://creativecommons.org/licenses/by/4.0/).