Article

Estimation of Dietary Exposure to Contaminants Transferred from the Packaging in Fatty Dry Foods Based on Cereals

by
Antía Lestido-Cardama
1,*,
Ana Rodríguez Bernaldo de Quirós
1,
Juana Bustos
2,
M. Luisa Lomo
2,
Perfecto Paseiro Losada
1 and
Raquel Sendón
1
1
Department of Analytical Chemistry, Nutrition and Food Science, Faculty of Pharmacy, University of Santiago de Compostela, 15782 Santiago de Compostela, Spain
2
National Food Center, Spanish Agency of Food Safety and Nutrition, E-28220 Majadahonda, Spain
*
Author to whom correspondence should be addressed.
Foods 2020, 9(8), 1038; https://doi.org/10.3390/foods9081038
Submission received: 3 July 2020 / Revised: 16 July 2020 / Accepted: 30 July 2020 / Published: 1 August 2020

Abstract

:
Food packaging has received special attention from the food safety standpoint since it could be a potential source of contamination through the migration of chemical substances from the packaging material into food. The assessment of the exposure through the diet to these contaminants from food packaging is necessary. In this work, an estimation of dietary exposure of the young Spanish population (1–17 years) to target chemicals from packaging for fatty dried foods based on cereals was assessed. For this purpose, a gas chromatography coupled to mass spectrometry (GC–MS) method was developed for screening of volatile and semivolatile compounds, potential migrants from the packaging. Then, this technique was used to quantify 8 target analytes, which were previously identified in the packaging (including phthalates, acetyl tributyl citrate (ATBC), butylated hydroxytoluene (BHT) and octocrylene), in composite food samples of fatty cereals prepared according to the consumption data for different age groups. Among the phthalates, exposure to diethyl phthalate (DEP) was the highest for the three groups considered (0.0761–0.545 µg/kg body weight/day), followed by bis(2-ethylhxyl)phathalate (DEHP), while the lowest mean intake was found for di-n-octyl phathalate (DNOP; 0.00463–0.0209 µg/kg body weight/day). The estimated dietary exposures did not exceed for any of the analytes the corresponding established tolerable daily intakes.

Graphical Abstract

1. Introduction

Food packaging has become an indispensable tool in food manufacturing since it protects the food from contamination (chemical, biological and physical) retaining its nutritional properties and sensory characteristics, which extends the shelf-life of the product [1,2]. Polymeric films are commonly used as food packaging due to their versatility; they are easily processed and can acquire different shapes and sizes. In some cases, the functionality and properties of this material are further enhanced by combining different polymer layers to form a multilayer structure where each layer develops a specific function [2].
Despite the advantages that packaging provides to the consumer, there are many debates concerning environmental and health topics since food packaging could represent a potential source of contamination. Food packaging materials are not only composed of intentionally added substances (IAS; e.g., monomers, additives as antioxidants, lubricants, plasticizers, etc.), they could also contain the popularly known as non-intentionally added substances (NIAS) like decomposition products, reaction intermediates, impurities, etc., which could migrate from the packaging into food, particularly into fatty foods [1,3]. This fact is undesirable, but a certain transfer is inevitable because currently the majority of foodstuffs are commercially packaged. The problem arises when the quantities of these migrating compounds that are transferred into foodstuffs may endanger health of the consumer or cause unacceptable changes in the composition or organoleptic characteristics of the food [4].
Due to the growing consumer awareness in terms of health issues, the migration process of chemical compounds from food contact materials (FCM) to food attracted the attention of the legislative communities. The EU and the Food and Drug Administration (FDA) began a global control to ensure consumer safety with the creation of positive lists of substances authorized to be used in the manufacturing of packaging material with their specifications, while restricting chemical substances with toxic potential [1]. Regulation (EU) No 10/2011 sets restrictions and specifications on the use of certain substances to determine the compliance of plastic materials and articles intended to come into contact with food [5]. However, other materials such as paper, glass, metals or components used in combination with plastic materials like printing inks, adhesives and so on are not regulated yet. For all these substances it is necessary a risk assessment with the final objective of ensuring that they do not represent a risk for human health [4].
An important part of risk assessment is the estimation of the dietary exposure to chemical contaminants from the FCM. One of the methods used to investigate population exposure to chemical contaminants through the diet is the so-called total diet study (TDS), which turns out to be a convenient and economical approach. The main characteristics in this type of study are that it should include a selection of foods representative of the total diet, the food is analyzed as consumed and grouped into pools resulting in more realistic exposure estimation [6]. Nevertheless, TDS is not able to show what type of food product is the principal contributor to contaminant exposure [7].
Our study is based on a TDS-like investigation because it does not cover the total diet, but focuses on specific food groups, concretely fatty dry foods based on cereals [8]. Our group has previously published exposure data on cereal-based foods, but of a “non-fatty” nature [9]. It is known that the fat content of food products is a factor that affects the migration process. For many chemicals, for example plasticizers, the amount that migrates is greater in fatty foods compared to low-fat content foods. This increase commonly is due to the higher solubility of the organic migrants in fat [10,11].
A total of seven samples including snacks and biscuits packaged with plastic materials were selected to be analyzed. In a first step of this work, a screening approach was applied to simply and rapidly determine the identity of potential chemical migrants in the packaging through the solvent extraction technique, followed by gas chromatography coupled to mass spectrometry (GC–MS). This is the most widely applied technique for identification of unknown compounds due to its reproducibility, robustness and the availability of standardized commercial libraries [12]. The type of packaging material was identified by IR with attenuated total reflection (ATR).
The aim of the second part of the study was to develop a method for the quantification of potential contaminants, previously identified in the packaging materials, in the real packaged foods. This migration assessment is necessary but at the same time challenging due to the complexity of the food matrix. For that purpose, samples were grouped into different pools according to the consumption data [13] of different age group (1–2 years, 3–9 years and 10–17 years) and homogenized to be extracted. The analysis of the extracts was performed using the GC–MS technique and data were acquired in the selected ion monitoring (SIM) mode.
The final objective of this work was estimating the dietary exposure to certain chemicals transferred from FCM by combining, data on the obtained concentration of the selected chemical contaminants in the pool samples, with national data on their consumption. Child and adolescence population (1–17 years) was selected because they may be considered as a potentially vulnerable subgroup to the toxic effects of chemical contaminants in food due to their organs are still under development during this age. Furthermore, child and adolescence population consume a greater amount of drinks and food compared to adult population (expressed per kg of body weight), which leads to reasonably higher exposures to chemicals with possible harmful effects [14].

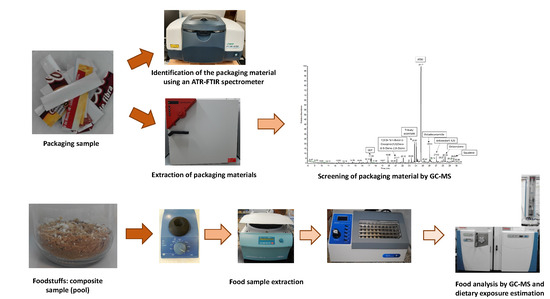
2. Materials and Methods

2.1. Reagents and Standards

Acetonitrile for liquid chromatography (ACN), ethanol absolute for analysis (EtOH), methanol for gas chromatography (MeOH) and n-hexane for gas chromatography ECD and FID (HEX) were provided from Merck (Darmstadt, Germany).
Analytical standards with high purity were used in the study. Butylated hydroxytoluene (BHT) 99%, di-n-octyl phthalate (DNOP) 99.5%, bis(2-ethylhexyl)phthalate (DEHP) 99%, acetyl tributyl citrate (ATBC) 99% and as an internal standard diethyl phthalate-3,4,5,6-d4 (DEP-d) 99.3% were purchased from Fluka (Steinheim, Germany). While diethyl phthalate (DEP) 99.5%, dibutyl phthalate (DBP) 99%, diisobutyl phthalate (DIBP) 99% and octocrylene (OCTO) 97% were provided by Sigma-Aldrich (Schnelldorf, Germany). The chemical structures and the physicochemical characteristics of the analytes studied are given in Table 1.
Other analytical standards were used for identification: 4,4′-diphenylmethane diisocyanate and toluene-2,4-diisocyanate were obtained from Merck (Darmstadt, Germany). Triacetin ≥ 99% was purchased from Fluka (Steinheim, Germany). Toluene-2,6-diisocyanate 97%, 2,6-di-tert-butyl-1,4-benzoquinone 98%, methyl palmitate 97%, glyceryl trioctanoate ≥ 99%, benzophenone 99%, antioxidant 425, 1,3-docosenamide > 85%, 2,4-di-tert-butylphenol 99%, caprolactam > 99%, squalene ≥ 98% and saturated alkane standard mixture (C7-C30) were purchased from Sigma-Aldrich (Schnelldorf, Germany). Hexadecanamide 95% were provided by Combi-Blocks (San Diego, CA, USA).
For quantification purposes standard solutions at a concentration of 1000 mg/L were individually prepared in methanol for DNOP, OCTO, DEHP, DBP, DIBP and DEP and in ethanol for ATBC and BHT. An intermediate mix solution with a concentration of 10 mg/L was prepared in methanol. Calibration solutions in methanol were prepared by serial dilution from this intermediate solution and all of them contained the internal standard DEP-d prepared in ACN at a concentration of 0.5 mg/L. These solutions were stored at 4 °C in brown glass bottles and brought to room temperature before each analysis.
Several preventive measures were taken to reduce the contamination related with the ubiquity of phthalates (overestimations or false-positive results). Nitrile plastic gloves were used during all analytical work, sample manipulation was done avoiding the use of plastic materials, and the laboratory glassware was washed with an organic solvent and kept in the muffle oven at 400 °C (EML, Carbolite Furnances, England) during 4 h and then was covered with aluminum foil until its use.

2.2. Samples

A total of seven food-packaging samples of dried-fatty foods comprising snacks and biscuits based on cereals, all packed in plastic material and with different brand names, were purchased from a supermarket of Spain and taken to the laboratory for screening analyses. Detailed information was recorded from the labeling of each food, including data like carbohydrate/sugar, protein content and fat/saturated fat. The samples included in this study were selected since they are consumed widely by the young Spanish population in accordance to the national dietary survey ENALIA [13]. Each packaged food was sampled in duplicate and was stored frozen at −30 °C until analysis.
Samples were divided into three groups: snacks (AS; n = 4), popcorn (PL; n = 1) and biscuits (GA; n = 2). Information of the samples selected is shown in Table 2. The fat content of the samples ranged from 10% to 50%.
An Electronic Digital Outside Micrometer (Mitutoyo, Japan)) was used for thickness measurements of the packaging materials. The reported value was an average of three measurements.

2.3. Samples Preparation—Packaging Materials (Screening)

Two different extraction conditions were evaluated. An extract of the packaging, with a certain surface area of 0.8 dm2, was obtained by immersion of ten pieces of approximately 1 cm × 8 cm in 25 mL of ACN solvent and stored at 70 °C in an oven during 24 h. While another extract was obtained by immersion in 25 mL of hexane at 60 °C for 4 h.
For the GC–MS analysis, 10 mL of the obtained extracts were evaporated using a stream of nitrogen operated at 40 °C (RapidVap Vertex Evaporator, Labconco, Kansas City, MO, USA) up to one milliliter and the extract was filtered using a PTFE membrane filter of 0.45 µm (Membrane Solutions, Auburn, WA, USA) and injected into the chromatograph.

2.4. Sample Preparation—Foodstuffs

Some of the chemicals that were identified in the food packaging were chosen for later analysis in real foodstuffs with the objective to determine the exposure to them.
Individual samples were homogenized with a grinder, weighted and composite samples (pools) were elaborated taking into account the national consumption data corresponding to three groups of age (1–2, 3–9 and 10–17 years), and stored at 4 °C pending analysis. Each pool sample was prepared in duplicate (n = 2). For extraction, aliquots of one gram of the pooled sample were weighted and standard solutions in methanol were added at different concentration levels, 0.05, 0.1, 0.25 and 0.5 µg/g for the standard addition method (stand for 15 min to infuse into the foodstuff). The sample was extracted with 10 mL of ACN and stirred for 2 min with vortex agitation (VELP scientifica vortex). Then, the mixture was centrifuged at 1357× g for 10 min at −5 °C and the supernatant was collected and evaporated until dryness using a stream of nitrogen at 40 °C (RapidVap Vertex Evaporator, Labconco). The residue was reconstituted in one milliliter of methanol containing the internal standard DEP-d at a concentration of 0.5 mg/L. The extract was further filtered through a 0.45 µm PTFE membrane filter (Membrane Solution, China) and injected into the GC–MS. Each pool sample not spiked was analyzed in duplicate. Additionally, in each batch of samples a procedural blank was included to control the background contamination. Quantification of the analytes in the pooled samples was performed using the calibration curve obtained by the standard addition method, by plotting the peak area/internal standard ratio versus the added amount of each standard. In this way, the matrix effect was prevented in the quantitation.

2.5. Exposure Estimation

Dietary exposure was estimated taking into account the measured concentration of the selected analytes in each pool sample and the national consumption data for this type of food (ENALIA, 2014). According to GEMS/Food-EURO recommendations, for analytical results between limit of detection (LOD) and limit of quantification (LOQ; non-quantifiable), values were set to LOQ/2 to estimate dietary exposure [15].
ENALIA is a dietary survey conducted in Spain, between November 2012 and July 2014, in order to collect food consumption data. The methodology in this survey followed the European Food Safety Authority (EFSA) EU Menu guidance recommendations. This study included 1780 individuals with ages ranging from 6 months to 17 years. However, the age range between six and eleven months was ruled out due to the low consumption of the foods included in this study.
A risk assessment associated with dietary exposure was evaluated comparing the obtained chemical intake values with the available tolerable daily intake (TDI) values set by authorities such as EFSA and the World Health Organization (WHO).

2.6. ATR-FTIR

To identify the type of packaging material, an ATR (attenuated total reflectance)-FTIR (Fourier transform infrared) spectrometer (ATR-PRO ONE, FTIR 4700, Jasco, Tokyo, Japan) fitted with a diamond optical crystal and controlled by the Spectra ManagerTM v.2 software was used. Before the analysis, the samples were cut, cleaned with an organic solvent and dried. Infrared spectra were acquired on internal and external material surface and in the region from 4000 to 650 cm−1. The spectra identification was carried out using the KnowItAll 17.4.135.B software by comparing the sample spectra with the available infrared spectral libraries of polymers and related compounds from Bio-Rad Laboratories, Inc. (Philadelphia, PA, USA ). Results are shown in Table 2.

2.7. GC–MS Method

GC–MS instrument was a Thermo Scientific Trace 1300 Series GC with a simple quadrupole Trace ISQ LT mass detector under electron impact ionization mode (EI) and an automatic injector AI 1310 (Thermo Fisher Scientific, San José, CA, USA). The ZB-5MS 5% phenyl and 95% dimethylpolysiloxane column (30 m × 0.25 mm × 0.25 µm) purchased by Phenomenex (Torrance, CA, USA) was used.
For screening purposes, 1.0 µL of the extract was injected in the splitless mode and the injector temperature was set at 300 °C. The column was set at a constant flow rate of 1 mL/min using helium (3X quality, from Nippon Gases) as carrier gas. The initial temperature of the oven was maintained at 40 °C for 2 min, then increased at a rate of 9 °C/min until reaching 300 °C, with a holding time of 3 or 10 min depending on whether the extract was acetonitrile or hexane, respectively. Electron impact ionization (EI) was set at a voltage of 70 eV. The temperature of the transfer line and detector was set to 300 °C. Data acquisition was operated in full scan mode with an m/z range of 30–500. Calibration of the mass spectrometer was performed by the autotuning mode in ISQ Dashboard software using the masses 69 and 219 of perfluorotributylamine (PFTBA). Xcalibur 3.0.63.3 software (Thermo Fisher Scientific Inc., San José, CA, USA) was used for data acquisition and processing. The tentative identification of compounds was performed using the libraries Wiley Registry 8th edition with 399.383 mass spectra and the NIST/EPA/NIH 11 v.2.0 containing 30.898 mass spectra.
For quantification purposes, injections were made in the split mode (ratio 1:5), the oven gradient used was initially at 60 °C for 2 min, then increased until 300 °C at 10 °C/min, with a holding time of 2 min, and data were acquired in the SIM mode using the quantification and qualifier ions presented in Section 3.2.
To minimize the potential source of phthalates contamination, several cycles of washing the syringe with organic solvents before and after injection were performed, and the washing solvents were changed every day.

3. Results and Discussion

3.1. Screening of Chemical Migrants in Packaging Materials

In this study, a GC–MS screening analysis was used to identify potential chemical migrants that could be present in the studied plastic packaging materials. All detected peaks with the best matches found during the library search were considered in the study. The followed approach allowed one to tentatively identify or confirm more than 60 compounds of different nature in the packaging materials (Table 3). Figure 1 shows the GC–MS chromatogram for the acetonitrile extraction in the sample GA_02.
Some compounds could be confirmed with the injection, under the same conditions, of the available standard comparing the retention time and the corresponding spectral data; thus, close to half (28 compounds) could be positively confirmed. The remaining detected peaks were tentatively identified as it has been detailed in Section 2.7. Only compounds with the best matches (≥800) were considered in the study.
The Cramer decision tree allows one to estimate the toxicological hazard of a compound according to its molecular structure. For this purpose, the Toxtree v3.1.0 (Ideaconsult Ltd., Sofia, Bulgaria) software was used. The model classifies the molecules into three classes: class I (low toxicity), class II (intermediate toxicity) or class III (high toxicity) [16]. The threshold for Cramer Classes I–III are 1800, 540 and 90 µg/person/day, respectively [6].
Several substances related with the manufacture of plastic packaging materials like phthalates and other additives such as plasticizers, antioxidants, slip agents, ultraviolet (UV) filters or photoinitiators among others were identified.
Phthalates esters (PAE) are synthetic organic chemicals introduced in the 1920s [17]. This is a wide group of chemicals used in the manufacture of packaging materials, because they are used as plasticizers to impart flexibility and durability of polymeric matrices. However, numerous studies identified them as endocrine-disrupting chemicals and an important source for human exposure to phthalates seems to be the packed food, especially fatty-food are the most affected [5,17,18].
Detected low molecular weight PAE, such as DEP and DBP, are most frequently used in lacquers, adhesives, printing inks, varnishes and coatings. DIBP is a plasticizer for nitrocellulose, cellulose ether and polyacrylate and polyacetate dispersions [6]. Whereas, identified longer/branching alkyl chain phthalates, like DEHP and DNOP, due to their economic convenience, are commonly used as plasticizers in the polymer and polyvinyl chloride (PVC) industry to improve workability, flexibility and handling properties [18]. DEHP is the predominantly used plasticizer in several applications with the approximately 51% of the global production [6].
All these phthalates were found in all samples and in both solvents, except DNOP, which was only found in one sample (AS_01). DEP, DIBP and DNOP are not included in the Regulation 10/2011, while DBP and DEHP are authorized with restrictions as additives in plastic food contact material with a specific migration limit (SML) of 0.3 mg/kg and 1.5 mg/kg, respectively [5]. DIBP, DBP and DEHP are listed between the ten phthalates diesters that have been classified as carcinogenic, mutagenic or toxic for reproduction substances, with the mention “Reprotoxic 1B” by the European Chemical Agency (ECHA) [19].
Adverse effects such as asthma and allergic symptoms have been associated to the exposure to environmental phthalate esters [18]. Phthalate metabolites have also been detected in breast milk, serum and urine [20].
The growing concerns about the toxicity of phthalates have led to search other plasticizers. Some alternatives of PAE were detected in the packaging materials studied such as esters of bioderived citric acid (triethyl citrate, acetyl triethyl citrate, tributyl citrate and ATBC), which are mainly used as plasticizers in polymers such as PVC and cellulose acetate; phosphate esters (tributyl phosphate), which are used as a flame retardant and as a plasticizer in the manufacture of nitrocellulose, plastics, and vinyl resins intended to be in contact with food; sebacates (dibutyl sebacate), which exhibit good compatibility with PVC matrix and are principally used as plasticizers in film coatings [6,21]; and aconitate esters (tributyl aconitate), which protect PVC against negative effects of light and heat [21,22].
Isopropyl myristate is another plasticizer used for cellulosic, pigment dispersant and binder, which was detected in one sample (AS_01) [21]. Triacetin, also known as glycerol triacetate, was identified in three samples of snacks (AS_01, AS_02 and AS_04). This compound, besides its use as a food additive, is a plasticizer used in cellulose and adhesives since it is able to provide flexibility and/or elongation allowing their deformation [23,24]. Diethylene glycol dibenzoate, which was found in the extract of ACN of two samples (AS_02 and GA_02), is a plasticizer for polyvinyl chloride acetate and component used in adhesives [25,26].
Benzophenone (BP), a substance commonly used as photoinitiator in UV cured inks, adhesives, coatings, varnishes and other materials, and also as a UV blocker to prevent photodegradation of the packaging polymers or its contents, was detected in 4 samples (AS_02, AS_03, PL_01 and GA_02). This compound is included in the positive lists of the Regulation 10/2011with a SML of 0.6 mg/kg [4,5,6,27].
UV filter compounds like 2-ethylhexyl salicylate, octyl methoxy cinnamate and octocrylene, whose main function is absorbing the ultraviolet light to protect the product, were identified in several samples [21,27,28,29].
The synthetic phenolic compound, butylated hydroxytoluene (BHT), has been detected in two samples (AS_02 and AS_04). BHT is used as a food additive and as a common antioxidant compound and stabilizer in polymeric materials. This small molecule with a tendency to migrate rapidly presents a SML of 3 mg/kg [21,23].
2,2’-Methylenebis(6-t-butyl-4-ethylphenol) also so-called Antioxidant 425 is another phenolic antioxidant with medium molecular weight commonly used in polyolefins packages detected in five samples (AS_02, AS_03, AS_04, PL_01 and GA_02) [30,31].
Among the substances identified in the packaging samples, there are some degradant products of antioxidants and they could be considered like non-intentionally added substances (NIAS). This is the case of degradation products of antioxidants such as Irgafos 168 and Irganox 1010, 3,5-di-tert-butyl-4-hydroxybenzaldehyde was also found in some samples, this compound has been described in the literature as a possible product of the metabolism of BHT), and 2,6-di-tert-butyl-4-nitrophenol, which is formed when 2,6-di-tert-butylphenol is nitrated [6,21,32,33,34,35].
Squalene, which was detected in all packaging material samples, is an ethylenic-unsaturated hydrocarbon used as an oxygen-scavenging agent in the material to extend the shelf life of compounds that are sensitive to oxygen [36,37].
Diisocyanate compounds were detected in several of the samples analyzed. Among other uses, they are especially employed as an intermediate in the production of polyurethane products and all of them are classified as class III according to Cramer rules [21].
As the extraction was carried out taking into account both sides of the packaging, some substances identified may come from the solvents, dyestuffs and pigments employees for the external printing ink such as 2,6-diisopropylnaphthanlene (DIPN) identified in five samples (AS_02, AS_04, PL_01, GA_01 and GA_02) [23,38], 2-naphthenol found in the ACN extract of the sample GA_02 [39], dehydroabietic acid identified in the ACN extract of four samples (AS_01, PL_01, GA_01 and GA_02) [27], caprolactam detected in one sample (GA_02) or isophorone identified in the ACN extract of two samples of snacks (AS_01 and AS_02) [4]. Other substances identified could come to the adhesives employees such as the dehydroabietic acid, methyl ester, found in three samples of snacks (AS_01, AS_02 and AS_04), which is a product of the thermal degradation/dehydrogenation of abietic acid, a tackifier used in adhesives [24,40]; or cis-11-eicosenamide, identified in two samples (AS_01 and GA_01), which is used as an adhesive and a component of coatings [21].
Several slip agents based on fatty acid amides currently used were identified. 13-docosenamide was present in all the samples analyzed, while octadecanamide and hexadecanamide were only identified in three samples (AS_02, AS_04 and GA_02). They are able to reduce friction resistance and all of them belong to Class III according to Cramer rules [21,36,41,42].
This study shows that there are a lot of compounds that are not included in the positive list of the Commission Regulation (EU) No. 10/2011, only 20 compounds of the total of 65 listed in the Table 3 are included in this regulation [5].

3.2. Method Validation

Among all the identified compounds in the packaging materials analyzed, eight target analytes were selected for its later determination in food samples and thus making it possible to carry out the exposure assessment, including five phthalates (DEP, DIBP, DBP, DEHP and DNOP), the plasticizer ATBC, the antioxidant BHT and the UV filter octocrylene. The selection of these compounds was based on the increasing concern to human health and/or their abundance in the packaging samples.
The analytical performance of the developed GC–MS method for the selected analytes, such as linearity, sensitivity and precision were evaluated, and the data is shown in Table 4.
Linearity was examined using standard solutions of a known concentration (mixtures of all analytes) prepared in methanol. The calibration range consisted of at least seven points spread from 0.0025 to 0.025 µg/mL depending on the substance, to 2 µg/mL, the highest concentration tested. An internal standard (DEP-d) was added in order to compensate instrumental variability. Each calibration point was injected by triplicate. The relationship between known concentrations and measured area for each quantification ion relative to the area of the internal standard ratio (ion 153) was assessed by linear regression. The coefficients of determination obtained in the study indicated very good linearity with values equal or greater than 0.9930, so the method proved to be appropriate for quantification of these compounds in this concentration range.
The sensitivity was evaluated based on limits of detection (LODs) and quantification (LOQs). The quantification and detection limits were estimated as the lowest concentration, which provided a signal-to-noise higher than ten (the ratio between the peak area of quantification ion for each target analyte and peak area of noise) or three (the ratio between the peak area of qualification ion for each target analyte and peak area of noise), respectively. The method shows good sensitivity with LODs equal or lower than 0.01 µg/mL, corresponding to 0.01 µg/g of sample while LOQ obtained was equal or lower than 0.025 µg/g of sample. The precision, expressed as relative standard deviations (RSDs %), was determined in terms of repeatability analysis. Independent solutions in methanol at the level of 0.1 µg/mL were evaluated at different times on the same day (n = 8). The values obtained for repeatability (RSDr < 10%) were satisfactory.
The extraction method developed was examined in terms of recovery percentage. A way to study the recovery using the standard addition method is comparing the slopes of the standard addition line with the external calibration line in methanol. Each pool sample was spiked at four different concentrations (0.05, 0.1, 0.25 and 0.5 µg/g) the recoveries were in the range of 72–118%, as shown in Table 5.

3.3. Food Concentration of Selected Packaging Chemicals

Based on previous studies carried out in our laboratory, ACN was selected as an extraction solvent. This extraction solvent was also used for this type of chemical in cereal samples by other studies [3,9,43]. The second extraction step was considered unnecessary because the concentration determined resulted to be below 10% of the concentration determined for the first extraction.
Despite the efforts to reduce the background levels of contamination with phthalates, some of them were still found in the blanks, so an approach of subtracting the blank value from the concentrations measured in food samples was applied [7].
The quantification of the target analytes in the pooled samples was performed using the calibration curve obtained by the standard addition method. The concentration of selected migrants obtained in composite food samples (mean of two replicates) is shown in Table 5.
All of the analytes analyzed were found in the food samples, except DNOP, which was present at concentrations below LOQ in all composite food samples analyzed. This phthalate neither was detected in the food group of grains/cereals analyzed by Schecter et al. (2013) and Bradley et al. (2013) [7,44]. Regarding the other phthalates and octocrylene, the pool representing the 10–17 years age group consumption was the one with the highest values; except for the DEP for which the highest value, 0.329 µg/g was found in the pool of the 1–2 years group. Regarding ATBC and BHT, the highest values were found for the 3–9 years age group, 0.0554 µg/g and 0.0476 µg/g, respectively.
Overall, among the analyzed substances, the greatest concentration was obtained for the phthalate DEHP in the pool representing the 10–17 years consumers group (0.524 µg/g). This is in line with published observations that DEHP would be the predominant compound, in terms of concentration and frequency, in food, and this is related to its affinity for the fatty fraction [43,45,46].
Comparing these results with the previous study published by our group [9] focused on low-fat cereal based, it can be seen that the concentration of phthalates and octocrylene is higher in samples with a higher fat content, while the concentration of ATBC is lower, so there is not a clear trend between the concentration of ATBC and the fat content of the foods. Cao et al. (2013) developed a sensitive and selective GC–MS method for the determination of DEHA and several phthalates in food samples from the 2013 Canadian TDS, generating recent data for dietary exposure assessment [3]. DEHA and some phthalates, including DIBP, DBP and DEHP, were detected in cereal product samples, but at low levels in general. Reported levels of DIBP were in the range of 2.89–15 ng/g, for DBP 7.09–36.5 ng/g and for DEHP 18.8–153 ng/g. Our estimations are in the range of the reported DEHP and DBP values, except in the pool of the 10–17 years group, where we found higher concentration values (0.524 µg/g and 0.0426 µg/g, respectively). In the case of DIBP, our study found higher concentration values in the three tested pools (0.0344–0.102 µg/g). However, if we take into account the sample of popcorn included within the miscellaneous group in the study of Cao et al. (2013) [3], the range of values reported is extended to 0.284 ng/g for DEHP, 0.0398 ng/g for DIBP and 0.208 ng/g for DBP.
In another study Cariou et al. (2016) [43] developed a GC–MS/MS method to monitor the phthalates DIBP, DBP, BBP and DEHP in typical foodstuffs of the French diet. Among the cereal’s samples included in the study, it is worth highlighting the high concentrations found in the popped corn with bacon flavor samples: 40.3 ng/g for DIBP, 54.2 ng/g for DBP and 114 ng/g for DEHP. These values were higher than those obtained in the present study, except for DEHP in the pool of 10–17 years group and for DIBP in the pools of 1–2 years and 10–17 years.
More recently, Yang et al. (2018) [47] assessed the dietary exposure to 16 phthalate esters (PAEs) in the Chinese population by a TDS. Among the PAEs analyzed, three phthalates, including DNOP were not detected in any of the food samples just like in our study. Reported levels of DIBP, DBP and DEHP within the cereal food group were higher than our estimations, except for DEHP in the pool of 10–17 years. For DEP, our results showed higher concentration values in the three pools (0.205–0.3299 µg/g). The same occurs for these phthalates when we compare our results with the reported concentration values obtained for the group of snacks (salty biscuits, popcorn, etc.) found by Van Holderbeke et al. (2014) [46] and the group of miscellaneous cereal products in the study of Bradley et al. (2013) [44]. Except that DNOP is detected in the study of Van Holderbeke et al. (2014) [46] and that our reported level of DIBP in the pool of 10–17 years (0.102 µg/g) exceeds the higher level detected (0.083 µg/g) in the study of Bradley et al. (2013) [44].
Sakhi et al. (2014) [48] determined the concentration of several phthalates in Norwegian food and beverages. If we compare our results with those obtained in the food category of snacks (all of them packed in plastic material), the concentration of phthalates found in this work were higher.

3.4. Estimation of the Exposure to Selected Migrants and Risk Assessment

Dietary exposure of consumers to chemicals is a crucial element in risk assessment. Estimated dietary exposure values (mean and 95th percentile) to the selected migrants in the different age groups of the Spanish child and adolescent population are presented in Table 5.
Among the phthalates, exposure to DEP was the highest for the three groups considered, followed by DEHP, while the lowest mean intakes were found for DNOP. This result coincides with the reported fact that the food group that contributes most to the total dietary exposure to DEP is grains and grain-based products [45]. On the other hand, Sui et al. (2014) [49] showed that for children and adult groups, cereals resulted to be the food category that represents the top contributor to the dietary intake of DEHP.
In agreement with the estimation of dietary exposure to phthalates carried out by Fierens et al. (2014) in the Belgian population, where predicted dietary exposure rates for DEP and DBP decreased with the population age [45], the same observation can be inferred from the results in our study. The average dietary exposure to DEP ranged from 0.0761 µg/kg body weight per day in the pool of 10-17 years to 0.545 µg/kg body weight per day in the pool of 1–2 years. The 95th percentile exposure to DEP ranged from 0.397 µg/kg body weight per day in the pool of 10–17 years to 2.80 µg/kg body weight per day in the pool of 1–2 years. Regarding DBP, the mean exposure ranged from 0.0159 µg/kg body weight per day in the pool of 10–17 years to 0.0618 µg/kg body weight per day in the pool of 1–2 years, while the 95th percentile varied from 0.0831 µg/kg body weight per day in the pool of 10–17 years to 0.315 µg/kg body weight per day in the pool of 1–2 years. It is interesting to highlight that although the mean concentration of these analytes in the pool of 1–2 years group was not particularly high relative to the pools for other age groups, it became the higher contributor to the dietary exposure due possibly to the fact that this population group has the highest consumption of this type of products on a body weight bases [49]. Average daily consumption of Spanish population for selected products (snacks and biscuits) is 1.671 g/day (P95 8.508 g/day) for the 1–2 years group, 0.9806 g/day (P95 4.265) for 3–9 years and 0.3705 g/day (P95 1.932 g/day) for the 10–17 years group.
In contrast to the results for the above-mentioned phthalates, estimated dietary exposure levels to DEHP were higher in the adolescent group (10–17 years) than in the others. The mean exposure varied from 0.0995 µg/kg body weight per day (pool 3–9 years) to 0.194 µg/kg body weight per day (pool 10–17 years), while the 95th percentile varied from 0.433 µg/kg body weight per day (pool 3–9 years) to 1.01 µg/kg body weight per day (pool 10–17 years). However, the opposite happens in the estimation of dietary exposure to DEHP in the Chinese population carried by Sui et al. (2014) [49] where the mean dietary exposure decreases with age varying from 2.03 µg/kg body weight per day in the adult group (more than 18 years) to 4.51 µg/kg body weight per day in the children group (2–6 years). These estimated dietary exposure values to DEHP were greatest than those found in our work.
Schecter et al. (2013) [7] estimated the dietary phthalate intake for children and adults in U. S. foods obtaining a mean of 0.028 µg/kg body weight per day for DEP, 0.008 µg/kg body weight per day for DIBP, 0.035 µg/kg body weight per day for DBP, 0.136 µg/kg body weight per day for DEHP and 0.001 µg/kg body weight per day for DNOP in the group of grain where cereals and cookies were included. These findings are comparable with our values in the case of DEHP and DBP, except in the pool of 1–2 years group where we estimated a value two times higher for DBP (0.0618 µg/kg body weight per day). However, the estimated values in our study for DEP, DIBP and DNOP turned out to be higher than those reported in the work of Schecter et al. (2013) [7].
The comparison of our estimated dietary exposure with other studies previously reported in the literature should be interpreted with caution. Large variations may be due to several factors such as the type of foods included (our study was limited to fatty dried foods including snacks based on cereals and biscuits), the analytical method used to analyze the samples, the group of population selected (our study was limited to 1–17 years), the type of container for the food (our study was limited to plastic packaging), the different sources of exposition (our study was limited to food), variability in the consumption of foods according to the country, special dietary habits (vegetarians, vegan, etc.), etc. Even the occurrences of different compounds can also change over time, for example, the restricted phthalates like DEHP are gradually being replaced by others like DINP and DIDP [48].
For certain analytes, authorities and other organizations such as EFSA and WHO, have established TDI in order to protect the human health. This TDI is an estimation of the maximum daily exposure to a certain agent that the population may be exposed to without any large risk. In relation to our analytes, the TDI specified for DEP is 0.5 mg/kg body weight per day, 0.01 mg/kg body weight per day for DBP and 0.05 mg/kg body weight per day for DEHP [50,51,52]. No reference doses (RfDs) or TDIs have been set for the other analytes. Looking at our data, and taking into account these individual TDI, in all cases, the predicted dietary intake rates were far below the TDI values established. Even our highest mean dietary exposure value of 0.545 µg/kg body weight per day for the DEP in the pool 1–2 years turned out to be 1000 times less than its corresponding TDI.
Other substances identified in packaging materials, specifically BHT, ATBC and octocrylene were also considered in this study. For ATBC the mean dietary exposure varied from 0.0196 (pool 10–17 years) to 0.0652 µg/kg body weight per day (pool 1–2 years). Regarding BHT, the mean exposure varied from 0.00282 (pool 10–17 years) to 0.0471 µg/kg body weight per day (pool 3–9 years). The estimated dietary exposure to octocrylene ranged from 0.0119 (pool 10–17 years) to 0.0435 µg/kg body weight per day (pool 1–2 years). Ibarra et al. (2019) [9] estimated the dietary exposure to ATBC using low fatty cereals obtaining a mean of 1.01 µg/kg body weight per day in the pool 1–2 years, 2.01 µg/kg body weight per day in the pool 3–9 years and 1.27 µg/kg body weight per day in the pool 10–17 years. These results are higher values compared to those obtained in this work. In the case of ATBC, a comparation was made with the results obtained in the FACET exposure tool (Facet 3.0.2, 2008–2012 Creme Software Ltd., Dublin, Ireland) developed within the European Commission 7th Framework project. This software allows one to evaluate the exposure to some flavors, additives and chemicals from FCM through a probabilistic approach. In this case, consumption data from the UK survey were used and higher mean exposure values were found being 0.24 µg/kg body weight per day in the pool 1–2 years, 0.16 µg/kg body weight per day in the pool 3–9 years and 0.78 µg/kg body weight per day in the pool 10–17 years. It is important to highlight that there is little information in the literature related to the exposure to these analytes (octocrylene and BHT) from packaging material.
Briefly, the packed based cereal foods are an important dietary source of exposure to these chemicals, for example in the case of 1–2 years age group low and high fat content foods contributes similarly to the exposure of DEP and DIBP while for DEHP a major contribution is observed in low fat content foods for all age groups [9].
In general, considering the eight analyzed substances in this study, focused in fatty cereal based foods, low exposure data were obtained (0.00282–0.545 µg/kg body weight per day). However, it is important to consider that several contaminants were identified in the same pool sample (seven of the eight chemicals analyzed); consequently, the consumer are simultaneous exposed to multiple chemicals (cumulative exposure) through the diet from several sources (aggregate exposure) [53]. The known “cocktail effect” must be considered because the combination of a wide variety of chemicals could produce harmful effects in humans, even at low levels. In fact, in a draft update, the EFSA Panel on Food Contact Materials, Enzymes and Processing Aids (CEP Panel), based on a plausive common mode of action underlying the reproductive effects, propose a group-TDI for DEHP, DBP, DiNP and BBP and establish a value of 50 µg/kg body weight per day, expressed as DEHP equivalents [54].

4. Conclusions

An approach to estimate dietary exposure to certain chemicals transferred from plastic packaging materials into fatty cereal based foods is presented. Firstly, a GC–MS method was developed as a screening tool to identify migrants in the plastic packaging materials. More than 60 compounds of a different nature, such as plasticizers, antioxidants, slip agents, UV filters or photoinitiators were detected. Only 20 of 65 identified compounds were included in the positive list of European Regulation 10/2011. Secondly, selected migrants, namely, five phthalates (DEP, DIBP, DBP, DEHP and DNOP), the plasticizer ATBC, the antioxidant BHT and the UV filter octocrylene were determined in pooled food samples. The analytical method showed good linearity (R2 ≥ 0.9930) and an excellent sensitivity (LODs ≤ 0.01 µg/mL). Finally, the exposure assessment was performed; the mean dietary exposures ranged from 0.00282 to 0.545 µg/kg body weight per day depending on the analyte, being the highest exposure found for DEP in the group corresponding to 1–2 years. However, estimated exposures in all cases were found to be lower than the established tolerable daily intakes, when available.

Author Contributions

Conceptualization, J.B., P.P.L., A.R.B.d.Q., and R.S.; methodology, J.B., P.P.L., A.R.B.d.Q., and R.S.; investigation, A.L.-C.; writing—original draft preparation, A.L.-C.; writing—review and editing, J.B., P.P.L., M.L.L., A.R.B.d.Q., and R.S.; supervision, P.P.L, A.R.B.d.Q., and R.S.; project administration, A.R.B.d.Q., and R.S.; funding acquisition, A.R.B.d.Q. All authors have read and agreed to the published version of the manuscript.

Funding

This research was funded by the Ministerio de Economía y Competitividad, by Fondo Europeo de Desarrollo Regional (FEDER), and by Agencia Estatal de Investigación Ref.No. AGL2015-69609-P “MIGRAEXPO” (MINECO/FEDER, UE).

Acknowledgments

A.L.-C. is grateful for her grant “Programa de axudas á etapa predoutoral” da Xunta de Galicia (Consellería de Cultura, Educación e Ordenación Universitaria).

Conflicts of Interest

The authors declare no conflict of interest.

References

  1. Arvanitoyannis, I.S.; Bosnea, L. Migration of substances from food packaging materials to foods. Crit. Rev. Food Sci. Nutr. 2004, 44, 63–76. [Google Scholar] [CrossRef] [PubMed]
  2. Subha Ganguly. Recent technological advancements in food packaging: A review. World J. Biol. Med. Sci. 2014, 1, 21–23. [Google Scholar]
  3. Cao, X.L.; Zhao, W.; Dabeka, R. Di-(2-ethylhexyl) adipate and 20 phthalates in composite food samples from the 2013 Canadian Total Diet Study. Food Addit. Contam. Part A 2015, 32, 1893–1901. [Google Scholar] [CrossRef] [PubMed]
  4. Skjevrak, I.; Brede, C.; Steffensen, I.L.; Mikalsen, A.; Alexander, J.; Fjedal, P.; Herikstad, H. Non-targeted multi-component analytical surveillance of plastic food contact materials: Identification of substances not included in EU positive lists and their risk assessment. Food Addit. Contam. 2005, 22, 1012–1022. [Google Scholar] [CrossRef] [PubMed]
  5. European Commission. Commission Regulation (EU) No. 10/2011, on plastic materials and articles intended to come into contact with food. Off. J. Eur. Union 2011, 12, 1–89. Available online: http://data.europa.eu/eli/reg/2011/10/oj (accessed on 4 June 2019).
  6. Rodríguez Bernaldo de Quirós, A.; Lestido Cardama, A.; Sendón, R.; García Ibarra, V. Food Contamination by Packaging: Migration of Chemicals from Food Contact Materials; Walter de Gruyter: Berlin, Germany, 2019; ISBN 9783110644876. [Google Scholar]
  7. Schecter, A.; Lorber, M.; Guo, Y.; Wu, Q.; Yun, S.H.; Kannan, K.; Hommel, M.; Imran, N.; Hynan, L.S.; Cheng, D.; et al. Phthalate concentrations and dietary exposure from food purchased in New York State. Environ. Health Perspect. 2013, 121, 473–479. [Google Scholar] [CrossRef] [Green Version]
  8. European Food Safety Authority. Joint Guidance of EFSA, FAO and WHO—Towards a harmonized Total Diet Study approach: A guidance document. EFSA J. 2011, 9, 2450–2516. [Google Scholar] [CrossRef]
  9. García Ibarra, V.; Sendón, R.; Bustos, J.; Paseiro Losada, P.; Rodríguez Bernaldo de Quirós, A. Estimates of dietary exposure of Spanish population to packaging contaminants from cereal based foods contained in plastic materials. Food Chem. Toxicol. 2019, 128, 180–192. [Google Scholar] [CrossRef]
  10. Baner, A.; Bieber, W.; Figge, K.; Franz, R.; Piringer, O. Alternative fatty food simulants for migration testing of polymeric food contact materials. Food Addit. Contam. 1992, 9, 137–148. [Google Scholar] [CrossRef]
  11. Vaclavikova, M.; Paseiro-Cerrato, R.; Vaclavik, L.; Noonan, G.O.; DeVries, J.; Begley, T.H. Target and non-target analysis of migrants from PVC-coated cans using UHPLC-Q-Orbitrap MS: Evaluation of long-term migration testing. Food Addit. Contam. Part A 2016, 33, 352–363. [Google Scholar] [CrossRef] [PubMed]
  12. Gómez-Ramos, M.M.; Ucles, S.; Ferrer, C.; Fernández-Alba, A.R.; Hernando, M.D. Exploration of environmental contaminants in honeybees using GC-TOF-MS and GC-Orbitrap-MS. Sci. Total Environ. 2019, 647, 232–244. [Google Scholar] [CrossRef] [PubMed]
  13. ENALIA. Spanish National Dietary Survey on Children and Adolescents. Agencia Española de Consumo, Seguridad Alimentaria y Nutrición. Available online: http://www.aecosan.msssi.gob.es/AECOSAN/web/seguridad_alimentaria/subdetalle/enalia.htm#1 (accessed on 4 June 2019).
  14. Sioen, I.; Fierens, T.; Van Holderbeke, M.; Geerts, L.; Bellemans, M.; De Maeyer, M.; Servaes, K.; Vanermen, G.; Boon, P.E.; De Henauw, S. Phthalates dietary exposure and food sources for Belgian preschool children and adults. Environ. Int. 2012, 48, 102–108. [Google Scholar] [CrossRef] [PubMed]
  15. GEMS-Food Euro. Report on a workshop in the frame of GEMS-Food Euro, EUR/HFA target 22. In Proceedings of the Second Workshop on Reliable Evaluation of Low-Level Contamination of Food, Kulmbach, Germany, 26–27 May 1995; pp. 26–27. [Google Scholar]
  16. Toxtree v3.1.0. Available online: http://toxtree.sourceforge.net/cramer.html (accessed on 20 June 2019).
  17. Fasano, E.; Bono-Blay, F.; Cirillo, T.; Montuori, P.; Lacorte, S. Migration of phthalates, alkylphenols, bisphenol A and di (2-ethylhexyl) adipate from food packaging. Food Control. 2012, 27, 132–138. [Google Scholar] [CrossRef] [Green Version]
  18. He, M.; Yang, C.; Geng, R.; Zhao, X.; Hong, L.; Piao, X.; Chen, T.; Quinto, M.; Li, D. Monitoring of phthalates in foodstuffs using gas purge microsyringe extraction coupled with GC-MS. Anal. Chim. Acta 2015, 879, 63–68. [Google Scholar] [CrossRef] [PubMed]
  19. ECA. Regulation (EC) No. 1907/2006 of the European Parliament and of the Council of 18 December 2006 concerning the Registration, Evaluation, Authorisation and Restriction of Chemicals (REACH). Available online: https://eur-lex.europa.eu/legal-content/EN/TXT/?uri=CELEX%3A02006R1907-20140410 (accessed on 20 June 2019).
  20. Bradley, E.L.; Burden, R.A.; Bentayeb, K.; Driffield, M.; Harmer, N.; Mortimer, D.N.; Speck, D.R.; Ticha, J.; Castle, L. Exposure to phthalic acid, phthalate diesters and phthalate monoesters from foodstuffs: UK total diet study results. Food Addit. Contam. Part A 2013, 30, 735–742. [Google Scholar] [CrossRef]
  21. Ibarra, V.G.; de Quirós, A.R.B.; Losada, P.P.; Sendón, R. Identification of intentionally and non-intentionally added substances in plastic packaging materials and their migration into food products. Anal. Bioanal. Chem. 2018, 410, 3789–3803. [Google Scholar] [CrossRef]
  22. Gil, N.; Saska, M.; Negulescu, I. Evaluation of the effects of biobased plasticizers on the thermal and mechanical properties of poly (vinyl chloride). J. Appl. Polym. Sci. 2006, 102, 1366–1373. [Google Scholar] [CrossRef]
  23. García, R.S.; Silva, A.S.; Cooper, I.; Franz, R.; Losada, P.P. Revision of analytical strategies to evaluate different migrants from food packaging materials. Trends Food Sci. Technol. 2006, 17, 354–366. [Google Scholar] [CrossRef]
  24. Aznar, M.; Vera, P.; Canellas, E.; Nerín, C.; Mercea, P.; Störmer, A. Composition of the adhesives used in food packaging multilayer materials and migration studies from packaging to food. J. Mater. Chem. 2011, 21, 4358–4370. [Google Scholar] [CrossRef]
  25. Vápenka, L.; Vavrouš, A.; Votavova, L.; Kejlova, K.; Dobiáš, J.; Sosnovcova, J. Contaminants in the paper-based food packaging materials used in the Czech Republic. J. Food Nutr. Res. 2016, 55, 361–373. [Google Scholar]
  26. Geueke, B. Dossier-Non-intentionally added substances (NIAS). Food Packag. Forum 2013, 10, 1–10. [Google Scholar]
  27. Rani, M.; Shim, W.J.; Han, G.M.; Jang, M.; Al-Odaini, N.A.; Song, Y.K.; Hong, S.H. Qualitative analysis of additives in plastic marine debris and its new products. Arch. Environ. Contam. Toxicol. 2015, 69, 325–366. [Google Scholar] [CrossRef] [PubMed]
  28. Díaz-Cruz, M.S.; Llorca, M.; Barceló, D. Organic UV filters and their photodegradates, metabolites and disinfection by-products in the aquatic environment. TrAC Trends Anal. Chem. 2008, 27, 873–887. [Google Scholar] [CrossRef]
  29. Meinerling, M.; Daniels, M. A validated method for the determination of traces of UV filters in fish using LC-MS/MS. Anal. Bioanal. Chem. 2006, 386, 1465–1473. [Google Scholar] [CrossRef] [PubMed]
  30. Dopico-García, M.S.; Lopez-Vilarino, J.M.; González-Rodríguez, M.V. Antioxidant content and migration from commercial polyethylene, polypropylene, and polyvinyl chloride packages. J. Agric. Food Chem. 2007, 55, 3225–3231. [Google Scholar] [CrossRef]
  31. Cecchi, T.; Passamonti, P.; Cecchi, P. Is it advisable to store olive oil in PET bottles? Food Rev. Int. 2009, 25, 271–283. [Google Scholar] [CrossRef]
  32. Kirchnawy, C.; Mertl, J.; Osorio, V.; Hausensteiner, H.; Washüttl, M.; Bergmair, J.; Pyerin, M.; Tacker, M. Detection and identification of oestrogen-active substances in plastic food packaging migrates. Packag. Technol. Sci. 2014, 27, 467–478. [Google Scholar] [CrossRef]
  33. Rodil, R.; Quintana, J.B.; Basaglia, G.; Pietrogrande, M.C.; Cela, R. Determination of synthetic phenolic antioxidants and their metabolites in water samples by downscaled solid-phase extraction, silylation and gas chromatography-mass spectrometry. J. Chromatogr. A 2010, 1217, 6428–6435. [Google Scholar] [CrossRef]
  34. Alexander, W.K.; Briggs, G.B.; Still, K.R.; Jederberg, W.W.; MacMahon, K.; Baker, W.H.; Mackerer, C. Toxicity of 2,6-di-tert-butyl-4-nitrophenol (DBNP). Appl. Occup. Environ. Hyg. 2001, 16, 487–495. [Google Scholar] [CrossRef]
  35. Félix, J.S.; Isella, F.; Bosetti, O.; Nerín, C. Analytical tools for identification of non-intentionally added substances (NIAS) coming from polyurethane adhesives in multilayer packaging materials and their migration into food simulants. Anal. Bioanal. Chem. 2012, 403, 2869–2882. [Google Scholar] [CrossRef] [PubMed]
  36. Galmán Graíño, S.; Sendón, R.; López Hernández, J.; Rodríguez-Bernaldo de Quirós, A. GC-MS screening analysis for the identification of potential migrants in plastic and paper-based candy wrappers. Polymers 2018, 10, 802. [Google Scholar] [CrossRef] [PubMed] [Green Version]
  37. Galdi, M.R.; Incarnato, L. Influence of composition on structure and barrier properties of active PET films for food packaging applications. Packag. Technol. Sci. 2011, 24, 89–102. [Google Scholar] [CrossRef]
  38. Simoneau, C.; Van den Eede, L.; Valzacchi, S. Identification and quantification of the migration of chemicals from plastic baby bottles used as substitutes for polycarbonate. Food Addit. Contam. Part A 2012, 29, 469–480. [Google Scholar] [CrossRef] [PubMed] [Green Version]
  39. Mikkelsen, S.H.; Havelund, S.; Mogensen, A.S.; Stuer-Lauridsen, F. Survey and assessment of chemical substances in glass and porcelain colours. Surv. Chem. Subst. Consum. Prod. 2005, 59, 1–80. [Google Scholar]
  40. Vera, P.; Aznar, M.; Mercea, P.; Nerín, C. Study of hotmelt adhesives used in food packaging multilayer laminates. Evaluation of the main factors affecting migration to food. J. Mater. Chem. 2011, 21, 420–431. [Google Scholar] [CrossRef]
  41. Vera, P.; Canellas, E.; Nerín, C. Identification of non-volatile compounds and their migration from hot melt adhesives used in food packaging materials characterized by ultra-performance liquid chromatography coupled to quadrupole time-of-flight mass spectrometry. Anal. Bioanal. Chem. 2013, 405, 4747–4754. [Google Scholar] [CrossRef]
  42. Coelho, F.; Vieira, L.F.; Benavides, R.; da Silva Paula, M.M.; Bernardin, A.M.; Magnago, R.F.; da Silva, L. Synthesis and evaluation of amides as slip additives in polypropylene. Int. Polym. Process. 2015, 30, 574–584. [Google Scholar] [CrossRef]
  43. Cariou, R.; Larvor, F.; Monteau, F.; Marchand, P.; Bichon, E.; Dervilly-Pinel, G.; Antignac, J.P.; Le Bizec, B. Measurement of phthalates diesters in food using gas chromatography–tandem mass spectrometry. Food Chem. 2016, 196, 211–219. [Google Scholar] [CrossRef]
  44. Bradley, E.L.; Burden, R.A.; Leon, I.; Mortimer, D.N.; Speck, D.R.; Castle, L. Determination of phthalate diesters in foods. Food Addit. Contam. Part A 2013, 30, 722–734. [Google Scholar] [CrossRef]
  45. Fierens, T.; Standaert, A.; Cornelis, C.; Sioen, I.; De Henauw, S.; Willems, H.; Bellemans, M.; De Maeyer, M.; Van Holderbeke, M. A semi-probabilistic modelling approach for the estimation of dietary exposure to phthalates in the Belgian adult population. Environ. Int. 2014, 73, 117–127. [Google Scholar] [CrossRef] [PubMed]
  46. Van Holderbeke, M.; Geerts, L.; Vanermen, G.; Servaes, K.; Sioen, I.; De Henauw, S.; Fierens, T. Determination of contamination pathways of phthalates in food products sold on the Belgian market. Environ. Res. 2014, 134, 345–352. [Google Scholar] [CrossRef] [PubMed]
  47. Yang, X.; Chen, D.; Lv, B.; Miao, H.; Wu, Y.; Zhao, Y. Dietary exposure of the Chinese population to phthalate esters by a Total Diet Study. Food Control. 2018, 89, 314–321. [Google Scholar] [CrossRef]
  48. Sakhi, A.K.; Lillegaard, I.T.L.; Voorspoels, S.; Carlsen, M.H.; Løken, E.B.; Brantsæter, A.L.; Haugen, M.; Meltzer, H.M.; Thomsen, C. Concentrations of phthalates and bisphenol A in Norwegian foods and beverages and estimated dietary exposure in adults. Environ. Int. 2014, 73, 259–269. [Google Scholar] [CrossRef] [PubMed]
  49. Sui, H.X.; Zhang, L.; Wu, P.G.; Song, Y.; Yong, L.; Yang, D.J.; Jiang, D.G.; Liu, Z.P. Concentration of di (2-ethylhexyl) phthalate (DEHP) in foods and its dietary exposure in China. Int. J. Hyg. Environ. Health 2014, 217, 695–701. [Google Scholar] [CrossRef]
  50. European Food Safety Authority. Opinion of the scientific panel on food additives, flavourings, processing aids and material in contact with food (AFC) related to di-butylphthalate (DBP) for use in food contact materials. Question No EFSA-Q-2003-192. EFSA J. 2005, 242, 1–17. [Google Scholar] [CrossRef]
  51. European Food Safety Authority. Opinion of the scientific panel on food additives, flavourings, processing aids and materials in contact with food (AFC) related to bis(2-ethylhexyl)phthalate (DEHP) for use in food contact materials. Question No EFSA-Q-2003-191. EFSA J. 2005, 243, 1–20. [Google Scholar] [CrossRef]
  52. World Health Organization. Diethyl Phthalate (Concise International Chemical Assessment Document 52); WHO: Geneva, Switzerland, 2003. [Google Scholar]
  53. EFSA. Scientific report of EFSA. International frameworks dealing with human risk assessment of combined exposure to multiple chemicals. EFSA J. 2013, 11, 3313–3382. [Google Scholar]
  54. EFSA. Draft scientific opinion. Draft update of the risk assessment of di-butylphthalate (DBP), butyl-benzyl-phthalate (BBP), bis(2-2 ethylhexyl)phthalate (DEHP), di-isononylphthalate (DINP) and di-isodecylphthalate (DIDP) for use in food contact materials. EFSA J. 2019, 17, e05838. [Google Scholar]
Figure 1. GC–MS chromatogram of the acetonitrile extraction in the sample GA_02.
Foods 09 01038 g001
Table 1. Chemical structures and physicochemical characteristics of the target compounds.
Chemical StructureCompoundCAS NumberMolecular FormulaMolecular WeightMelting Point (°C)Boiling Point (°C)Density (g/cm3)Vapor Pressure (Torr)Log P (o/w)SML (mg/kg)
Foods 09 01038 i001BHT128-37-0C15H24O220.3570 a265 a1.048 a (20 °C)6.24E-3 b5.168 b3
Foods 09 01038 i002DEP84-66-2C12H14O4222.24−40.5 a298 a1.120 a (25 °C)1.67E-3 b2.714 bNI
Foods 09 01038 i003DBP84-74-2C16H22O4278.34−35 a340 a1.0465 a (20 °C)1.08E-4 b4.752 b0.3 60 *
Foods 09 01038 i004DIBP84-69-5C16H22O4278.34−64 a296.5 a1.039 a (20 °C)1.54E-3 b4.440 bNI
Foods 09 01038 i005DEHP117-81-7C24H38O4390.56−55 a230 a0.9861 a (20 °C)3.95E-6 b8.516 b1.5 60 *
Foods 09 01038 i006ATBC77-90-7C20H34O8402.48−80 a172–174 a1.046 a (25 °C)3.35E-7 b5.227 b60 *
Foods 09 01038 i007DNOP117-84-0C24H38O4390.56−25 a220 a0.978 a (20 °C)3.84E-7 b8.828 bNI
Foods 09 01038 i008OCTO6197-30-4C24H27NO2361.48NA478.5 b1.055 b (20 °C)2.56E-9 b6.893 b0.05
a Experimental information obtained from SciFinder ® version web; b Predicted information obtained from SciFinder ® version web; * Log P (octanol/water partition); Specific Migration Limit (SML) (T) (group restriction); NI: not included in the Regulation (EU) No 10/2011; NA: not available.
Table 2. Information of food packaging materials.
CodingSample DescriptionType of MaterialThickness (µm)Fat Content
Internal SideExternal Side
AS_01Snacks based in cerealPPPET6232.6 g/100 g (Saturated 9.1 g)
AS_02Fried pork rindsPPPP5550 g/100 g (Saturated 16 g)
AS_03Salty cookiesPPPP4822 g/100 g (Saturated 19 g)
AS_04Butter-flavored baked appetizer productPPPP5118.6 g/100 g (Saturated 2.4 g)
PL_01Butter-flavored popcornPPPP4726.3 g/100 g (Saturated 2.4 g)
GA_01Toasted biscuitPPPP2610 g/100 g (Saturated 5 g)
GA_02Milk chocolate covered wheat biscuitPVDCNC3824 g/100 g (Saturated 13 g)
NC: Nitrocellulose; PET: Polyethylene terephthalate; PP: Polypropylene; PVDC: Polyvinylidene chloride.
Table 3. Compounds identified in the studied plastic packaging materials.
CompoundIUPAC NameFormulaCAS NumberRT (min)Possible UsesSIRSITCSML (mg/kg)Samples
AS-01AS-02AS-03AS-04PL-01GA-01GA-02
ACNHEXACNHEXACNHEXACNHEXACNHEXACNHEXACNHEX
NonanalNonanalC9H18O124-19-69.97Aldehyde875896INI
Isophorone3,5,5-trimethylcyclohex-2-en-1-oneC9H14O78-59-110.34Component of solvents for finishes and stoving lacquer812846IINI
* CaprolactamAzepan-2-oneC6H11NO105-60-212.50Monomer818823III15
Nonanoic acidNonanoic acidC9H18O2112-05-012.66Lacquers, plastics and as plasticizer796831INI
* Triacetin2,3-diacetyloxypropyl acetateC9H14O6102-76-113.85Plasticizer913913INI
* 2,6-Toluene diisocyanate1,3-diisocyanato-2-methylbenzeneC9H6N2O291-08-713.98Polyurethane resin873898IIIND
* 2,4-Toluene diisocyanate2,4-diisocyanato-1-methylbenzeneC9H6N2O2584-84-914.05Polyurethane resin838845IIIND
Diphenyl etherPhenoxybenzeneC12H10O101-84-814.82Manufacturing plastics and rubber, solvent864871IIINI
* 2,6-Di-tert-butyl-1,4-benzoquinone2,6-di-tert-butylcyclohexa-2,5-diene-1,4-dioneC14H20O2719-22-215.64Degradation product of antioxidants865867IINI
* Butylated Hydroxytoluene2,6-ditert-butyl-4-methylphenolC15H24O128-37-016.20Antioxidant; stabilizer in hot-melt adhesives and coatings866882II3
* 2,4-di-tert-butylphenol2,4-ditert-butylphenol)- C14H22O96-76-4 16.23Degradation product of antioxidants871896INI
2-NaphtholNaphthalen-2-olC10H8O135-19-316.55Dyestuffs and pigments806852IIINI
1,5,9-Trimethyl-1,5,9-cyclododecatriene(1Z,5Z,9Z)-1,5,9-trimethylcyclododeca-1,5,9-trieneC15H2421064-19-716.90 828831INI
* Diethyl PhthalateDiethylbenzene-1,2-dicarboxylateC12H14O484-66-217.33Plasticizer868915INI
Isophorone diisocyanate5-isocyanato-1-(isocyanatomethyl)-1,3,3-trimethylcyclohexaneC12H18N2O24098-71-917.36Polyurethane resin904920IIIND
* HexadecaneHexadecaneC16H34544-76-317.47Alkane877884INI
* BenzophenoneDiphenylmethanoneC13H10O119-61-917.97Photoinitiator for UV-curing of inks724828III0.6
Tributyl phosphateTributyl phosphateC12H27O4P126-73-818.01Plasticizer855893IIINI
2,6-Diisopropylnaphthalene2,6-di(propan-2-yl) naphthaleneC16H2024157-81-118.41Solvent823846IIINI
Methyl tetradecanoateMethyl tetradecanoateC15H30O2124-10-719.04Slip agent807840INI
Myristic acidTetradecanoic acidC14H28O2544-63-819.45Lubricant860866I+
3,5-Di-tert-butyl-4-hydroxybenzaldehyde3,5-ditert-butyl-4-hydroxybenzaldehydeC15H22O21620-98-019.49Degradation product of antioxidant833857IINI
* OctadecaneOctadecaneC18H38493-45-319.95Alkane844883INI
2-ethylhexyl salicylate2-ethylhexyl 2-hydroxybenzoateC15H22O3118-60-520.04UV filter871878INI
3’,5’-Di-tert-butyl-4’-hydroxyacetophenone1-(3,5-ditert-butyl-4-hydroxyphenyl) ethanoneC16H24O214035-33-720.07Degradation product of antioxidant700771IINI
HexadecanalHexadecanalC16H32O629-80-120.16Aldehyde835850INI
Isopropyl myristatePropan-2-yl tetradecanoateC17H34O2110-27-020.22Plasticizer for cellulosic, pigment dispersant and binder763780I NI
Triethyl citrateTriethyl-2-hydroxypropane-1,2,3-tricarboxylateC12H20O777-93-020.37Plasticizer and solvent for inks, adhesives, coatings870878III60
* Diisobutyl phthalate Bis(2-methylpropyl) benzene-1,2-dicarboxylateC16H22O484-69-520.66Plasticizer857883I NI
2,6-Di-tert-butyl-4-nitrophenol2,6-ditert-butyl-4-nitrophenolC14H21NO3728-40-521.06Antioxidant814834IIINI
Acetyl triethyl citrateTriethyl 2-acetyloxypropane-1,2,3-tricarboxylateC14H22O877-89-421.10Plasticizer836862INI
7,9 Di-Tert-Butyl-1-Oxaspiro (4,5)Deca-6-9-Diene-2,8-Dione7,9-ditert-butyl-1-oxaspiro[4 .5]deca-6,9-diene-2,8-dioneC17H24O382304-66-321.19By-product of antioxidant901940IIINI
* Methyl palmitateMethyl hexadecanoateC17H34O2112-39-021.38Intermediate for detergents, emulsifiers stabilizers, resins, plasticizers775760INI
Benzenepropanoic acid, 3,5-bis(1,1-dimethylethyl)-4-hydroxy-, methyl esterMethyl 3-(3,5-ditert-butyl-4-hydroxyphenyl)propanoateC18H28O36386-38-521.44Degradation product of antioxidant787809IINI
* Dibutyl phthalateDibutylbenzene-1,2-dicarboxylateC16H22O484-74-2 21.74Plasticizer 809879I0.3
Palmitic acidHexadecanoic acidC16H32O257-10-321.79Varnish, slip agent degradant899910I+
TetradecanamideTetradecanamideC14H29NO638-58-421.88Adhesive798814IIINI
* EicosaneEicosaneC20H42112-95-822.20Alkane871903INI
Isopropyl palmitatePropan-2-yl hexadecanoateC19H38O2142-91-622.43Lubricants, waxes829831I NI
OctadecanalOctadecanalC18H36O638-66-422.45Aldehyde851890INI
Tributyl citrateTributyl-2-hydroxypropane-1,2,3-tricarboxylateC18H32O777-94-123.22Plasticizer825848III NI
* HeneicosaneHeneicosaneH21H44629-94-723.25Alkane751877INI
* Methylenediphenyl 4,4’-diisocyanate1-isocyanato-4-[(4-isocyanatophenyl)methyl]benzeneC15H10N2O2101-68-823.34Polyurethane resin861884IIIND
Tributyl aconitateTributyl-(1E)-1-propene-1,2,3-tricarboxylateC18H30O67568-58-323.81Plasticizer 919949I NI
Octadecanoic acidOctadecanoic acidC18H36O257-11-423.89Lubricant815830I+
Dibutyl SebacateDibutyldecanedioateC18H34O4109-43-323.94Plasticizer887913I60
* HexadecanamideHexadecanamideC16H33NO629-54-924.08Slip agent 791818III NI
* Acetyl tributyl citrateTributyl-2-acetyloxypropane-1,2,3-tricarboxylateC20H34O877-90-724.75Plasticizer900943I60
* TricosaneTricosaneC23H48638-67-525.21Alkane862885INI
Octyl methoxy cinnamate2-ethylhexyl-3-(4-methoxyphenyl)acrylateC18H26O35466-77-325.43UV filter agent873893INI
Dehydroabietic acid, methyl esterMethyl-(1R,4aS,10aR)-1,4a-dimethyl-7-propan-2-yl-2,3,4,9,10,10a-hexahydrophenanthrene-1-carboxylateC21H30O21235-74-125.67Component of varnishes, printing inks and adhesives830868IINI
OctadecanamideOctadecanamideC18H37NO124-26-526.04Slip agent 833824III+
* TetracosaneTetracosaneC24H50646-31-126.14Alkane823860INI
Dehydroabietic acid(1R,4aS,10aR)-1,4a-dimethyl-7-propan-2-yl-2,3,4,9,10,10a-hexahydrophenanthrene-1-carboxylic acidC20H28O21740-19-826.60Solvent for printing inks846916IINI
Diethylene glycol dibenzoate2-(2-benzoyloxyethoxy)ethyl benzoateC18H18O5120-55-826.88Plasticizer851915INI
* Antioxidant 4252-tert-butyl-6-[(3-tert-butyl-5-ethyl-2-hydroxyphenyl)methyl]-4-ethylphenolC25H36O288-24-427.05Antioxidant802855III1.5
2,4-Dicumylphenol2,4-bis(2-phenylpropan-2-yl)phenolC24H26O2772-45-427.05Degradation product of antioxidant804834IIINI
* Bis(2-ethylhexyl) phthalateBis(2-ethylhexyl) benzene-1,2-dicarboxylateC24H38O4117-81-727.32Plasticizer 825831I1.5
cis-11-Eicosenamide(Z)-icos-11-enamideC20H39NO10436-08-527.65Adhesive and component of coatings807821III+
* Octocrylene2-ethylhexyl 2-cyano-3,3-diphenylprop-2-enoateC24H27NO26197-30-428.34UV filter 852903III0.05
2-Monostearin1,3-dihydroxypropan-2-yl octadecanoateC21H42O4621-61-428.90Lubricant769810INI
* Di-n-octyl phthalateDioctyl benzene-1,2-dicarboxylateC24H38O4117-84-028.96Plasticizer800860INI
* 13-Docosenamide(Z)-docos-13-enamideC22H43NO112-84-529.40Slip agent 872890III+
* Squalene2,6,10,15,19,23-hexamethyltetracosa-2,6,10,14,18,22-hexaeneC30H50111-02-429.63Plasticizer916921I NI
* Glycerol trioctanoate2,3-di(octanoyloxy)propyl octanoateC27H50O6538-23-830.57Lubricant788857INI
* Confirmed using standard; TC: Cramer Toxicity; ND: not detected; NL: not included in the Regulation (EU) No 10/2011; +: Specific migration limit of 60 mg/kg.
Table 4. Linearity of target compounds and their, limit of detection (LOD) and limit of quantification (LOQ).
CompoundEquationR2LOD (µg/mL)LOQ (µg/mL)Range (µg/mL)Quantification IonQualifier Ion
BHTy = 1.3579x − 0.00110.99990.0010.00250.0025–2205220
DEPy = 1.8091x − 0.02490.99940.0050.010.01–2149177
DIBPy = 2.5364x − 0.01510.99900.00250.0050.005–2149150
DBPy = 2.6487x − 0.02840.99900.0010.00250.0025–2149150
ATBCy = 0.1684x − 0.01080.99300.010.0250.025–2185129
DEHPy = 1.0437x − 0.01580.99600.010.0250.025–2149167
Octocryleney = 0.1509x − 0.00370.99700.0050.010.01–2204232
DNOPy = 1.5027x − 0.06150.99700.010.0250.025–2149279
Table 5. Concentration of target migrants in composite food samples with the recovery data and estimated dietary exposure (mean, P95) in Spanish child and adolescent population.
CompoundConcentration (µg/g)Dietary Exposure (µg/kg Body Weight per Day)TDI (µg/kg Body Weight per Day)
MeanP95
1–2 Years3–9 Years10–17 Years1–2 Years3–9 Years10–17 Years1–2 Years3–9 Years10–17 Years
DEP0.329 (98%)0.279 (96%)0.205 (92%)0.5450.2730.07612.801.190.397500
DIBP0.0516 (90%)0.0344 (102%)0.102 (82%)0.08690.03330.03780.4420.1450.197
DBP0.0370 (100%)0.0250 (103%)0.0426 (98%)0.06180.02450.01590.3150.1070.083110
ATBC0.0393 (118%)0.0554 (114%)0.0527 (113%)0.06520.05390.01960.3320.2350.102
BHT0.0148 (73%)0.0476 (75%)0.00762 (74%)0.02510.04710.002820.1280.2050.0147
Octocrylene0.0257 (83%)0.0164 (80%)0.0319 (79%)0.04350.01570.01190.2210.06820.0618
DEHP0.0949 (72%)0.101 (90%)0.524 (93%)0.1590.09950.1940.8080.4331.0150
DNOP<LOQ (84%)<LOQ (85%)<LOQ (74%)0.02090.01230.004630.1060.05330.0242

