Abstract
Modeling of microbial inactivation by high hydrostatic pressure (HHP) requires a plot of the log microbial count or survival ratio versus time data under a constant pressure and temperature. However, at low pressure and temperature values, very long holding times are needed to obtain measurable inactivation. Since the time has a significant effect on the cost of HHP processing it may be reasonable to fix the time at an appropriate value and quantify the inactivation with respect to pressure. Such a plot is called dose-response curve and it may be more beneficial than the traditional inactivation modeling since short holding times with different pressure values can be selected and used for the modeling of HHP inactivation. For this purpose, 49 dose-response curves (with at least 4 log10 reduction and ≥5 data points including the atmospheric pressure value (P = 0.1 MPa), and with holding time ≤10 min) for HHP inactivation of microorganisms obtained from published studies were fitted with four different models, namely the Discrete model, Shoulder model, Fermi equation, and Weibull model, and the pressure value needed for 5 log10 (P5) inactivation was calculated for all the models above. The Shoulder model and Fermi equation produced exactly the same parameter and P5 values, while the Discrete model produced similar or sometimes the exact same parameter values as the Fermi equation. The Weibull model produced the worst fit (had the lowest adjusted determination coefficient (R2adj) and highest mean square error (MSE) values), while the Fermi equation had the best fit (the highest R2adj and lowest MSE values). Parameters of the models and also P5 values of each model can be useful for the further experimental design of HHP processing and also for the comparison of the pressure resistance of different microorganisms. Further experiments can be done to verify the P5 values at given conditions. The procedure given in this study can also be extended for enzyme inactivation by HHP.
1. Introduction
High hydrostatic pressure (HHP) is considered an alternative to traditional preservation techniques for the pasteurization of food products [1,2] and HHP has become a reality in the food industry especially in the past couple of years [3,4,5]. HHP can inactivate microorganisms in food even at room temperature and can minimize the damage to sensitive food components caused by heat [6].
Primary modeling of microbial inactivation by any lethal treatment (heat, pressure, etc.) is simply defined as the reduction in microbial number with time under particular environmental conditions. In other words, in case of HHP inactivation, log microbial count or survival ratio versus time data under a constant pressure (and also temperature) level is obtained and the resulting survival data are fitted with an appropriate model that may be linear or non-linear. Further, secondary and tertiary modeling could be applied to predict microbial inactivation by HHP. Although this type of modeling is useful to predict the microbial inactivation under different pressure conditions, it requires experiments with very long holding times (>30 min), which is not compatible with commercial applications of HHP processing, especially under lower pressure values (<450 MPa).
Evaluation of survival data by HHP in the literature revealed that a long holding time is needed for apparent inactivation, at least for some pressure and temperature combinations. For example, Guan et al. [7] observed about 3 log10 and 1.8 reductions of Salmonella typhimurium in whole milk after pressurization at 350 MPa, 21 °C for 120 min and at 400 MPa, 21 °C for 30 min, respectively. On the other hand, about 5 log10 reduction was observed after 8 min of pressurization at 600 MPa at 21 °C. It should be admitted that 350 MPa for 120 min or 400 MPa for 30 min would never be used to inactivate any microorganisms in any food product commercially because one of the objectives in non-thermal processing is to obtain short processing times [3]. The short processing time (<5 or 10 min) is desired since it has a significant effect on the economics of HHP processing [8,9]. According to Mújica-Paz et al. [10], a holding time of 3 min is desirable for the commercial viability of HHP applications. This suggests shorter exposure time at higher pressure values to achieve high microbial inactivation.
The microbial inactivation pattern exposed to a lethal treatment can be described by a dose-response curve [11]. For HHP inactivation, the log survival ratio versus pressure level (dose) at a constant temperature and time should be plotted, and a suitable model should be fitted to describe the data. The use of dose-response modeling for HHP inactivation may be more beneficial than the traditional inactivation modeling since short holding times (<5 or 10 min) with different pressure values can be selected and used for modeling purposes. In other words, an experimenter can specify the conditions (time and temperature) under which assessment of the agent’s (pressure) intensity effects is quotable and significant [12]. Therefore, studies on modeling of microbial inactivation by HHP with very long holding time such as ≥60 min can be avoided.
The objective of this study was to demonstrate the usefulness of the dose-response modeling of microbial inactivation by HHP by applying different mathematical models. Furthermore, simulations were performed to show the possible applications of the dose-response modeling for HHP inactivation of microorganisms.
2. The Theory
At a constant temperature and time, there is a minimum pressure below which microbial inactivation by HHP will not take place [13]; in other words, at low pressure a delayed effect could be observed and it is expected that a very high pressure can cause almost instantaneous mortality in the exposed microbial population [12]. In many instances the relationship between survival ratio and pressure can be described by the following equations or models.
2.1. Discrete Model
If P < Pmin S(P) = 1
If P ≥ Pmin S(P) = exp(– k(P − Pmin))
If P ≥ Pmin S(P) = exp(– k(P − Pmin))
In microbial inactivation, the size of the population changes by several orders of magnitude; therefore, expressing survival ratio in log units is appropriate [12]. Moreover, log transformation of microbial population stabilizes the variance [14].
After log transformation, Equation (1) becomes:
2.2. Fermi Equation
According to this equation, when P = 0.1 MPa (atmospheric pressure) or when P Pmin, log10S(P) 0, when P = Pmin, log10S(P) = −0.3. (Note that, if plotted in linear coordinates (if Equation (3) is written without the log transformation), a sigmoidal shape is obtained. In this case, Pmin is the inflection point of S(P) i.e., S(Pmin) = 0.5 [15]) When P Pmin, log10S(P) –k(P − Pmin)/ln10. Thus, if HHP inactivation could be described by the Fermi equation, a flat shoulder will appear in the dose-response curve, after which the continuation will look like an almost perfectly straight line [12].
2.3. Shoulder Model
Since it may be expected that the dose-response curve has a flat shoulder followed by a linear portion, the following equation, which is commonly used to describe this type of curve [16], was also selected for this study.
Equation (5) can be rearranged as:
According to this equation, when P = 0.1 MPa or when P Pmin, log10S(P) 0, when P = Pmin, log10S(P) –0.3., and when P Pmin, log10S(P) −k(P − Pmin)/ln10.
In all three models above, Pmin (in MPa) is the threshold pressure level that produces a measurable inactivation effect on the microbial population, while k (in MPa−1) is the slope of the linear portion. Therefore, it is not surprising that the Discrete model, the Fermi equation, and the Shoulder model would produce similar or sometimes identical fits at least for some data.
2.4. Weibull Model
Another non-linear and useful model to describe the data with preceding shoulder is the Weibull model [12]:
where P1 is the pressure value (in MPa) needed to reduce the initial population, N0 to N0/10 and n is the shape parameter. The shape parameter, in the case of dose-response curves, is expected to be higher than 1 since the shape of the survival curve is downward and concave—see below.
2.5. Calculation of P5
The pressure value needed to 5 log10 (P5) could be calculated for all the models above. This calculation is rather straightforward for the Discrete, Fermi, and Weibull models; it may be troublesome for the Shoulder model. Nevertheless, P5 could be calculated easily with the Solver function of Microsoft Excel® (Microsoft, Washington, DC, USA) for the Shoulder model.
For the Discrete model:
For the Fermi equation:
For the Weibull model:
3. The Methodology
3.1. Data Selection, Fit of the Models, and Statistical Analysis
A review of published papers reporting microbial inactivation data was performed and dose-response curves with at least 4 log10 reduction and 5 data points (including P = 0.1 MPa) were selected. Pressurization with a holding time 10 min was used since long processing times should be avoided for realistic commercial HHP, as discussed above. A total of 49 dose-response curves were obtained depending upon the microbial inactivation data selection criteria mentioned above; data were taken either from the tables presented or digitized from the figures using a software program (WinDIG 2.5; written by Mr. Dominique Lovy, Geneva, Switzerland), which was also used in other studies [17,18,19].
Data fit of the models and plotting of the results were both performed with SigmaPlot 12.0 (Systat Software Inc., Chicago, IL, USA). The goodness-of-fit of the models was assessed using adjusted determination coefficient (R2adj) and mean square error (MSE) values.
4. Results and Discussion
4.1. Goodness-of-Fit of the Models
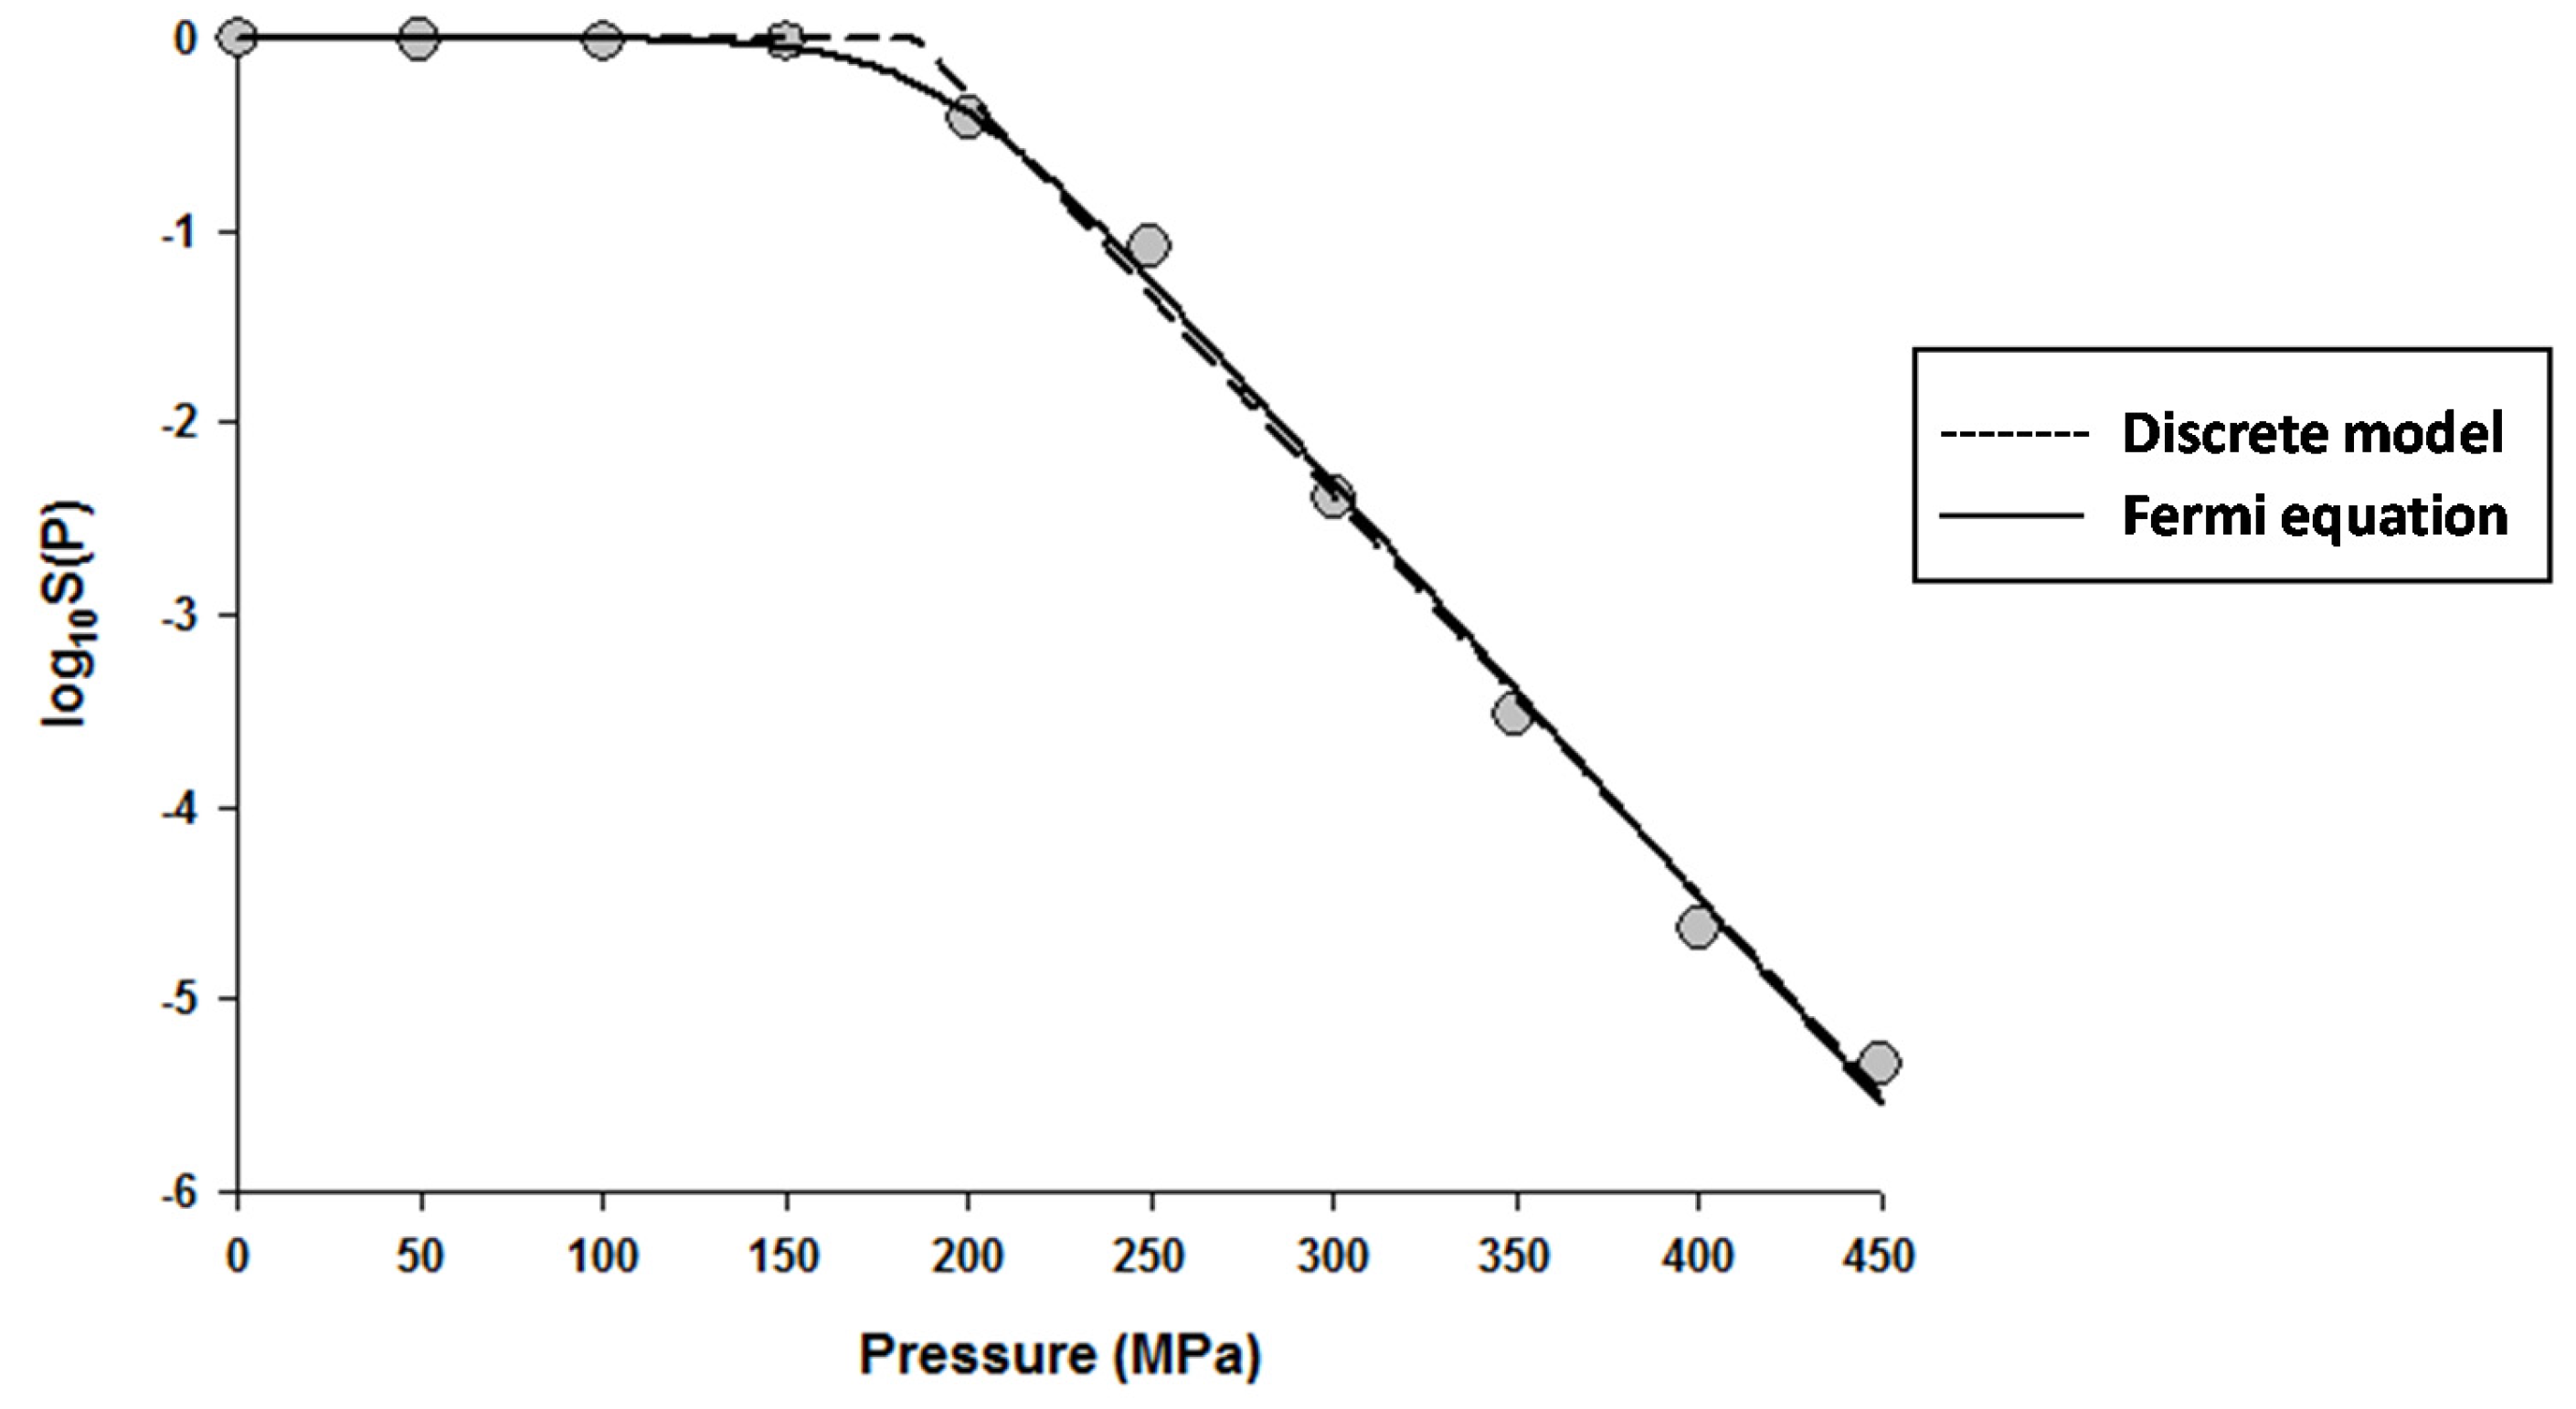
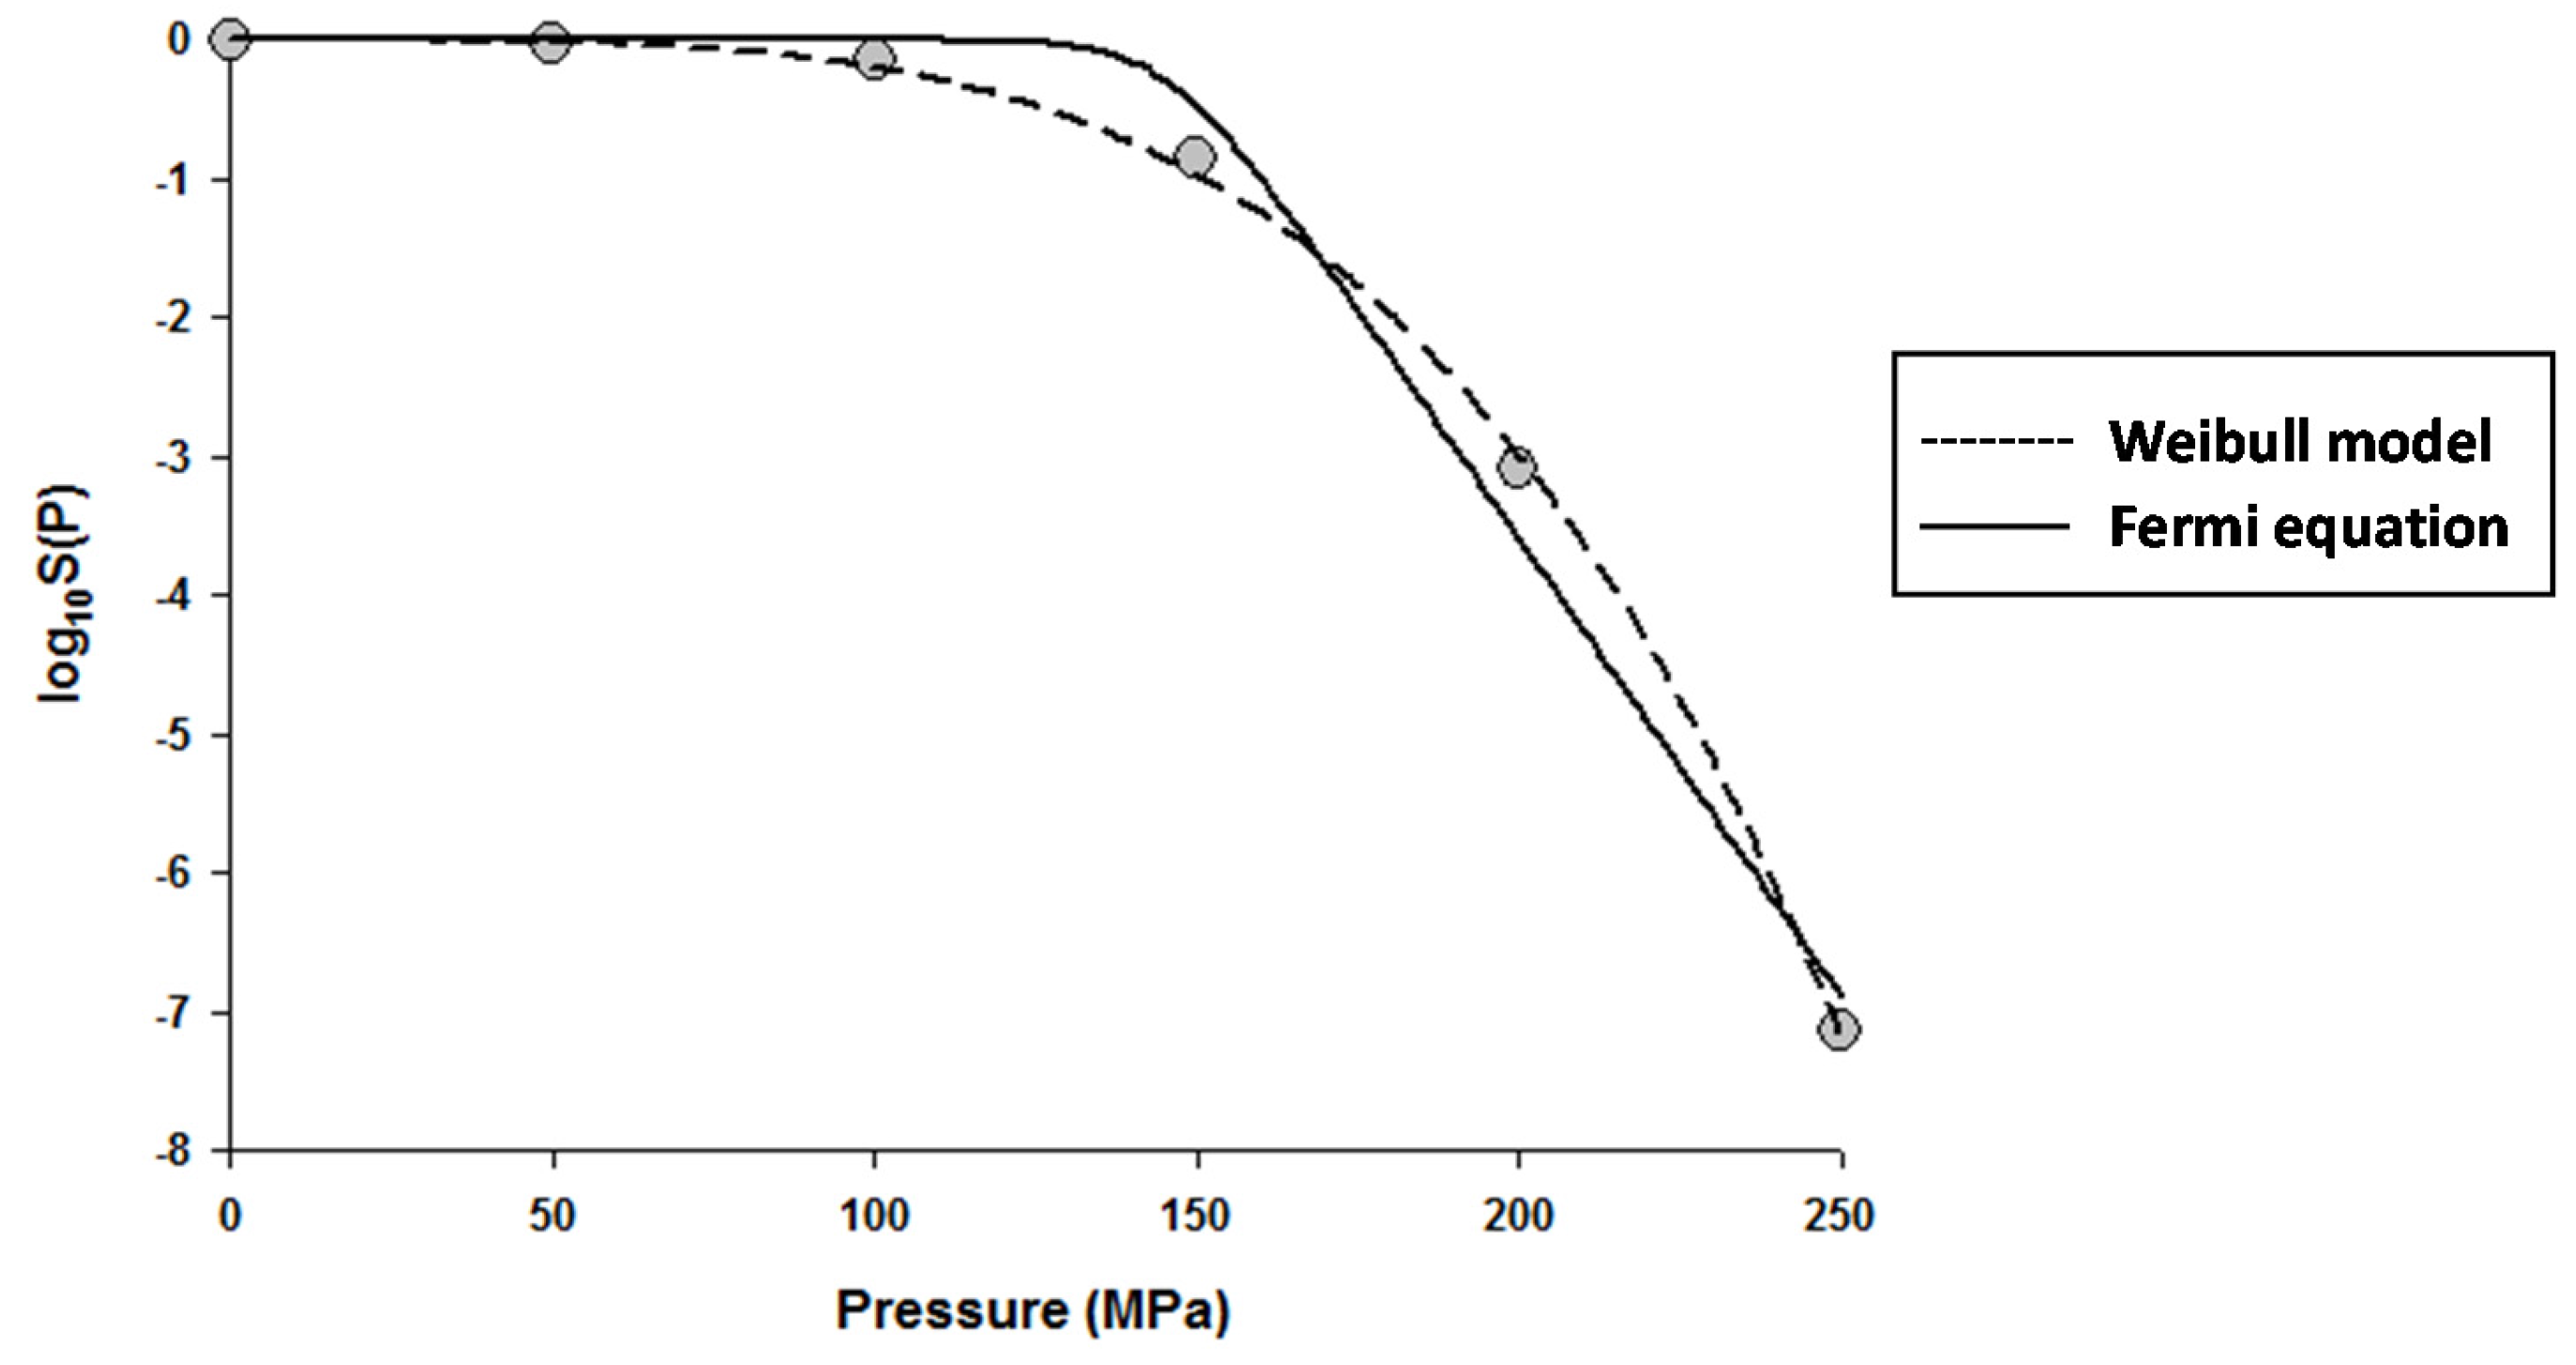
The fitting of the models to the data indicated that the Fermi equation and the Shoulder model produced the exact same fit, parameter estimations, and P5 values (results not shown). Therefore, only the fit and parameter estimations of the Fermi equation are given throughout this study. Figure 1 shows the fits of the Discrete model and Fermi equation for the inactivation data of Escherichia coli in Luria-Bertani (LB) broth. Note that almost identical fits were produced by these two models. Figure 2 shows the fits of the Weibull model and Fermi equation for the inactivation data of Saccharomyces cerevisiae in de Man, Rogosa and Sharpe (MRS) broth. Although both models produced reasonable fits, the Weibull model was superior to the Fermi equation for this case.
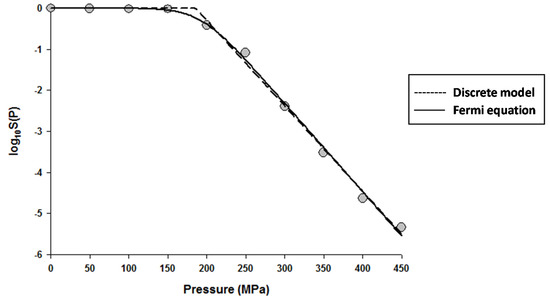
Figure 1.
Dose-response curve of Eschericha coli in Luria-Bertani broth exposed to high hydrostatic pressure (HHP) at 25 °C for 10 min. Data were fitted with the Discrete model (dashed lines) and the Fermi equation (solid lines). Original data were taken from Moussa et al. [20].
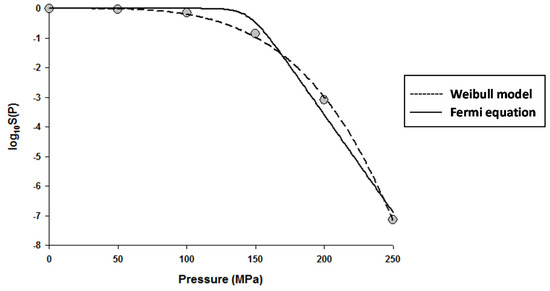
Figure 2.
Dose–response curve of Saccharomyces cerevisiae in de Man, Rogosa and Sharpe (MRS) broth exposed to high hydrostatic pressure (HHP) at 25 °C for 10 min. Data were fitted with the Weibull model (dashed lines) and the Fermi equation (solid lines). Original data were taken from Donsì et al. [20].
In general, the three models (Discrete, Fermi, and Weibull) produced good fits for the data, as indicated by their high R2adj and low MSE values given in Table 1. The Fermi equation produced the best fit, while the Weibull model gave the worst fit to overall data. Nevertheless, 74% of the Weibull model fits had R2adj 0.95 (80% for Discrete model and 84% for Fermi equation), showing that even the worst-fit model was suitable to describe the dose-response curves for HHP inactivation. The Weibull model also gave slightly higher and much more disperse MSE values than the Discrete model and the Fermi equation (Table 1).

Table 1.
Adjusted coefficient determination (R2adj) and mean square error (MSE) values for the Discrete, Fermi, and Weibull models applied to 49 dose-response curves obtained from the literature.
4.2. Parameters of the Models
Estimated parameters of the Discrete, Fermi, and Weibull models together with calculated P5 values are listed in Table 2 for microorganisms in laboratory media and Table 3 for microorganisms in foods. As expected, the Discrete model and the Fermi equation gave similar and sometimes exactly the same parameter estimates. The Weibull model, although it was the worst-fit model among the three models used, gave similar or close P5 values compared to the Discrete and Fermi models. These tabulated models’ parameters and also the P5 values of each model can be useful for the further experimental design of HHP processing and also for a comparison of the pressure resistance of different microorganisms.
Table 2.
Parameters and P5 values of the Discrete, Fermi, and Weibull models applied to microorganisms exposed to high hydrostatic pressure (HHP) in laboratory media.
Table 3.
Parameters and P5 values of the Discrete, Fermi, and Weibull models applied to microorganisms exposed to high hydrostatic pressure (HHP) in foods.
It should also be noted that data selection was done according to at least 4 log10 reduction criteria; however, the pressure value for 5 log10 reduction at a constant temperature and time for each microorganism was calculated for each models (Table 2 and Table 3). Thus, extrapolation was inevitable for some data; however, it is highly recommended that the models presented should be used within the interpolation region.
4.3. Effects of Substrate on Model Parameters and P5 Values
The data presented in Table 2 and Table 3 enable us to investigate the pressure resistance of HHP-treated microorganisms in different substrates/foods. The same strain (ATCC 11775) of E. coli in whole milk and LB broth was exposed to HHP by both Buzrul et al. [39,40] and Wang et al. [24], respectively. Processing conditions (temperature and time) were the same, but compression and decompression were faster in the study of Wang et al. [24]. These studies could be used to differentiate the HHP inactivation of microorganisms in foods and laboratory media. It is known that the bacteria in milk are more pressure-resistant than the bacteria in a buffer system [47]. This was also supported by the data given in Table 2 and Table 3. Based on the Fermi equation, Pmin = 278.6 ± 11.5 MPa for E. coli in LB broth (Table 2) while it was Pmin = 380.1 ± 15.7 MPa in whole milk (Table 3). Therefore, the pressure needed to obtain a measurable HHP inactivation (20–22 °C, 10 min) of E. coli in milk was about 100 MPa higher than in broth. Similarly, the P5 value for milk (582.1 MPa) was higher than for broth (426.2 MPa). Moreover, inactivation increased more as the pressure increased in broth than in milk since the slope, i.e., k value, was higher in broth (0.078 ± 0.008 MPa−1) than in milk (0.057 ± 0.006 MPa−1).
Another example of the effect of substrate is the study of Solomon and Hoover [21], in which Campylobacter jejuni (ATCC 35921) was exposed to HHP in Bolton broth and whole milk. Similar results for the Fermi equation were also obtained in the study by Solomon and Hoover [21]. The same goes for both E. coli and C. jejuni in terms of the P1 of the Weibull model—see Table 2 and Table 3.
4.4. Effect of Holding Time, Temperature, and Compression and Decompression Rates on Model Parameters and P5 Values
Although it was not easy to make definitive conclusions due to the limited data at hand, it may be expected that as the holding time and temperature increase, Pmin decreases and k increases for the Discrete and Fermi models and P1 decreases for the Weibull model. In traditional modeling, where time is a variable, the shape parameter of the Weibull model is independent or only a weak function of temperature [48] and pressure [19]. In the case of dose-response modeling, it was generally observed that as the time/temperature increased the shape parameter decreased—see the data of Doğan and Erkmen [22] and Donsì et al. [32] in Table 2. However, just the opposite was also observed—see the data of Doona et al. [38] in Table 3.
The effect of holding time can be clearly observed in Table 2 for the data of Doğan and Erkmen [22], in which E. coli was exposed to different pressure values at 25 °C for 3, 5, and 10 min. The decrease of Pmin (for the Discrete and Fermi models) and P1 (the Weibull model) could be observed for the increase in time. The same can be said about temperature for Pmin and P1 values (Table 1 and Table 2); however, there were some exceptions for k: decreases in k were observed if the time (or temperature) of HHP treatment increased. Some examples of such a situation are given in the studies of Wang et al. [33] (Table 2) and Carreño et al. [42] (Table 3).
It is known that rates of compression and decompression may have an impact on microbial inactivation [49]; however, the effect of the rates on models’ parameters cannot be shown due to a lack of data. Nevertheless, the rates or times of compression and decompression are given in Table 2 and Table 3.
4.5. Possible Applications of the Fermi Equation
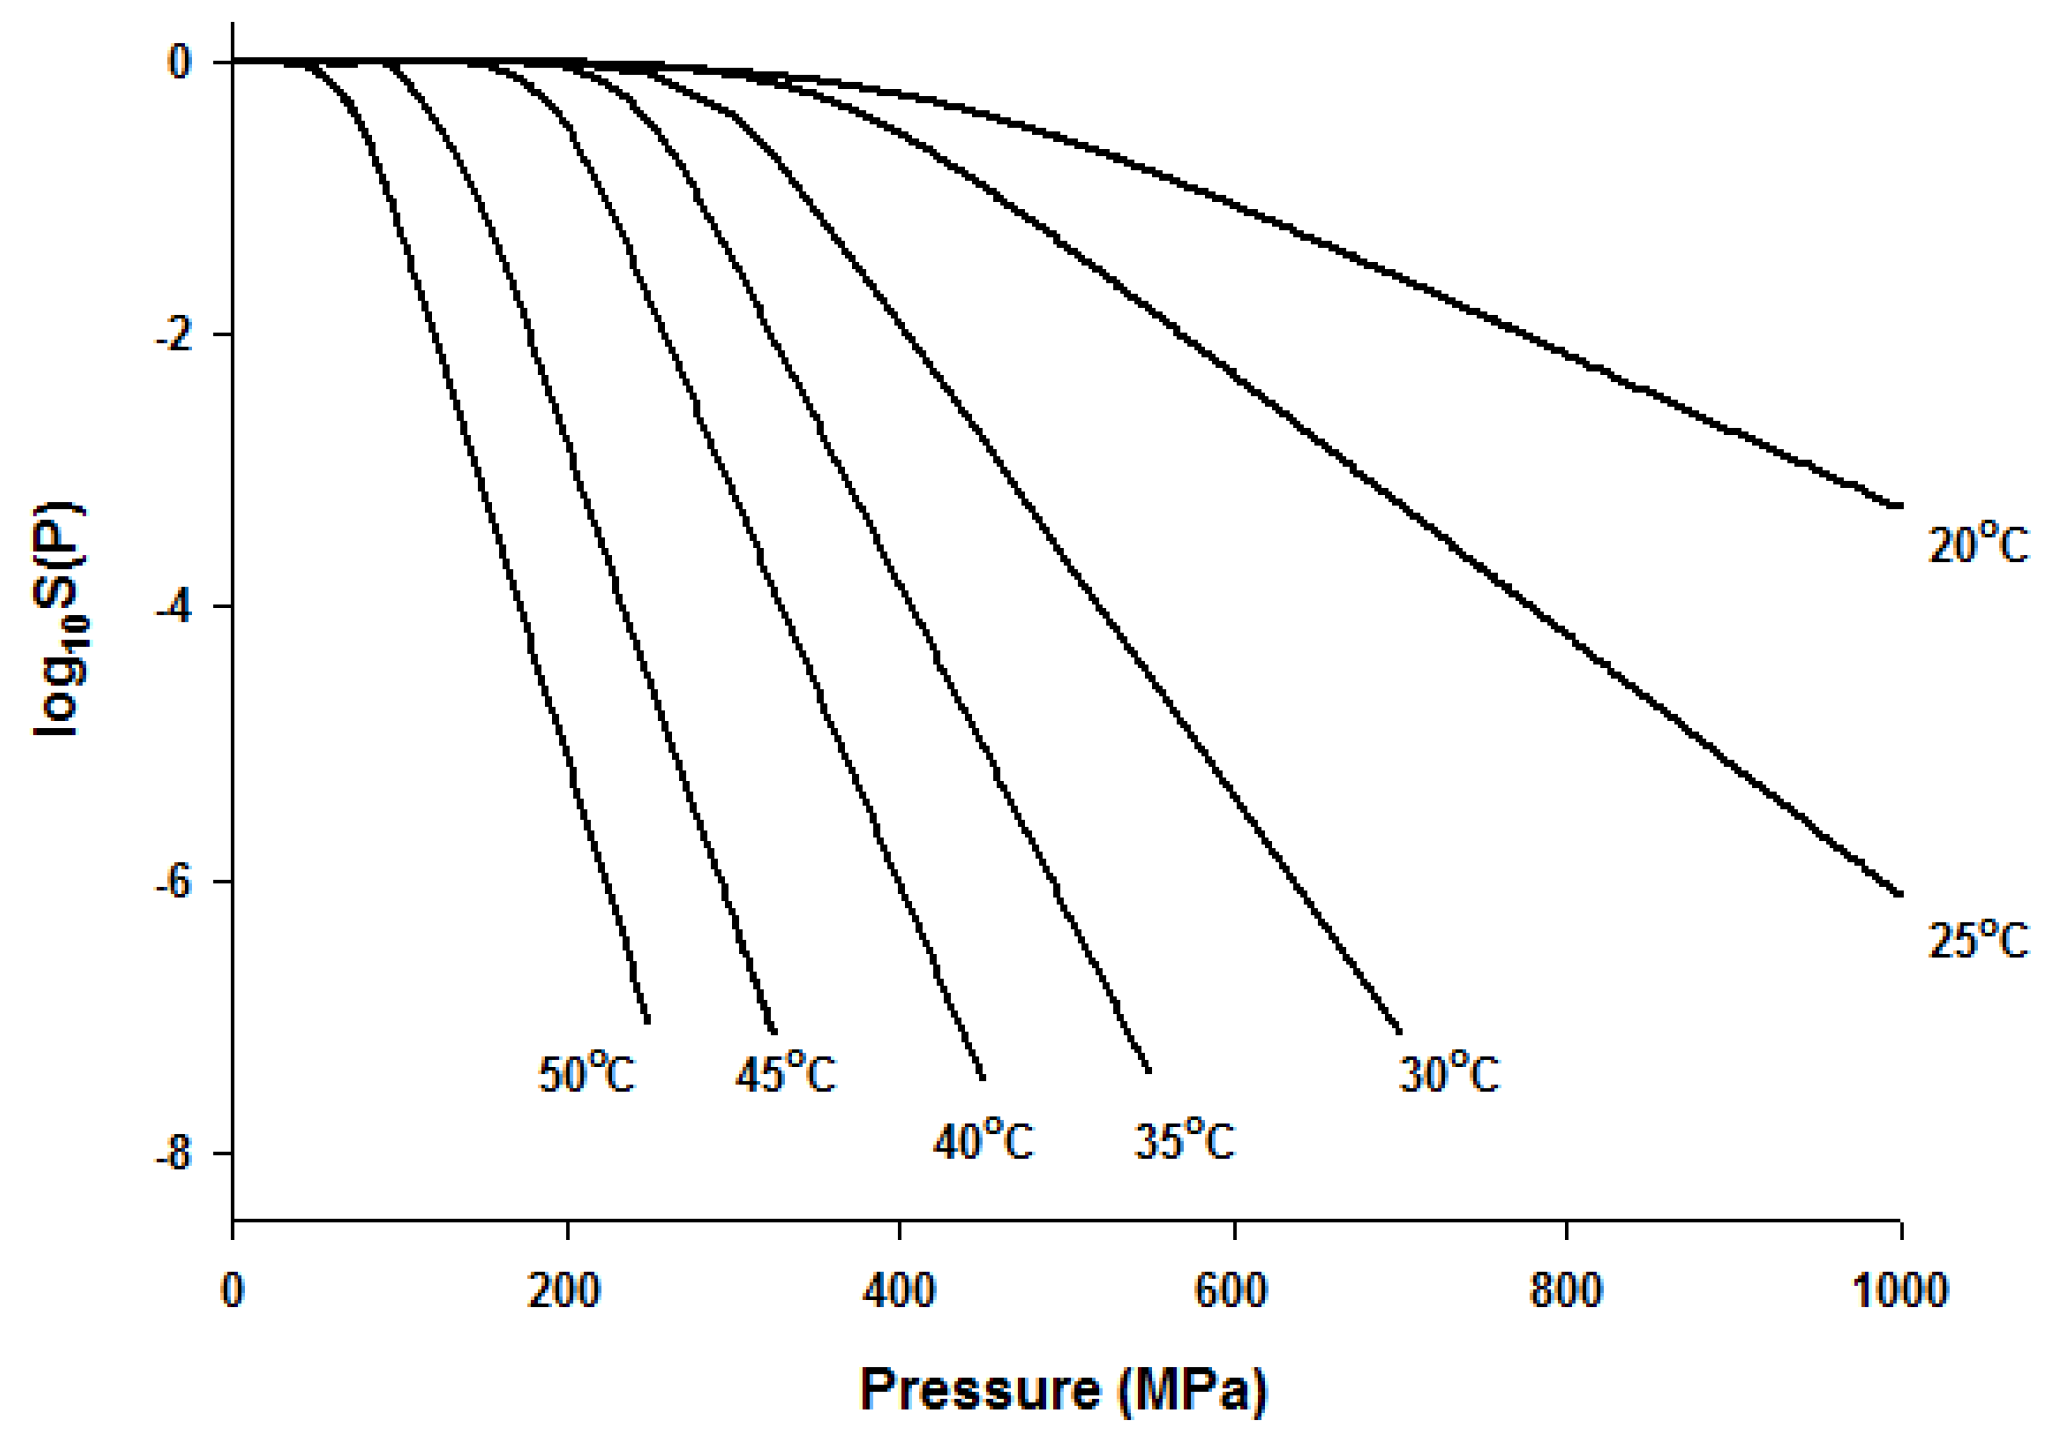
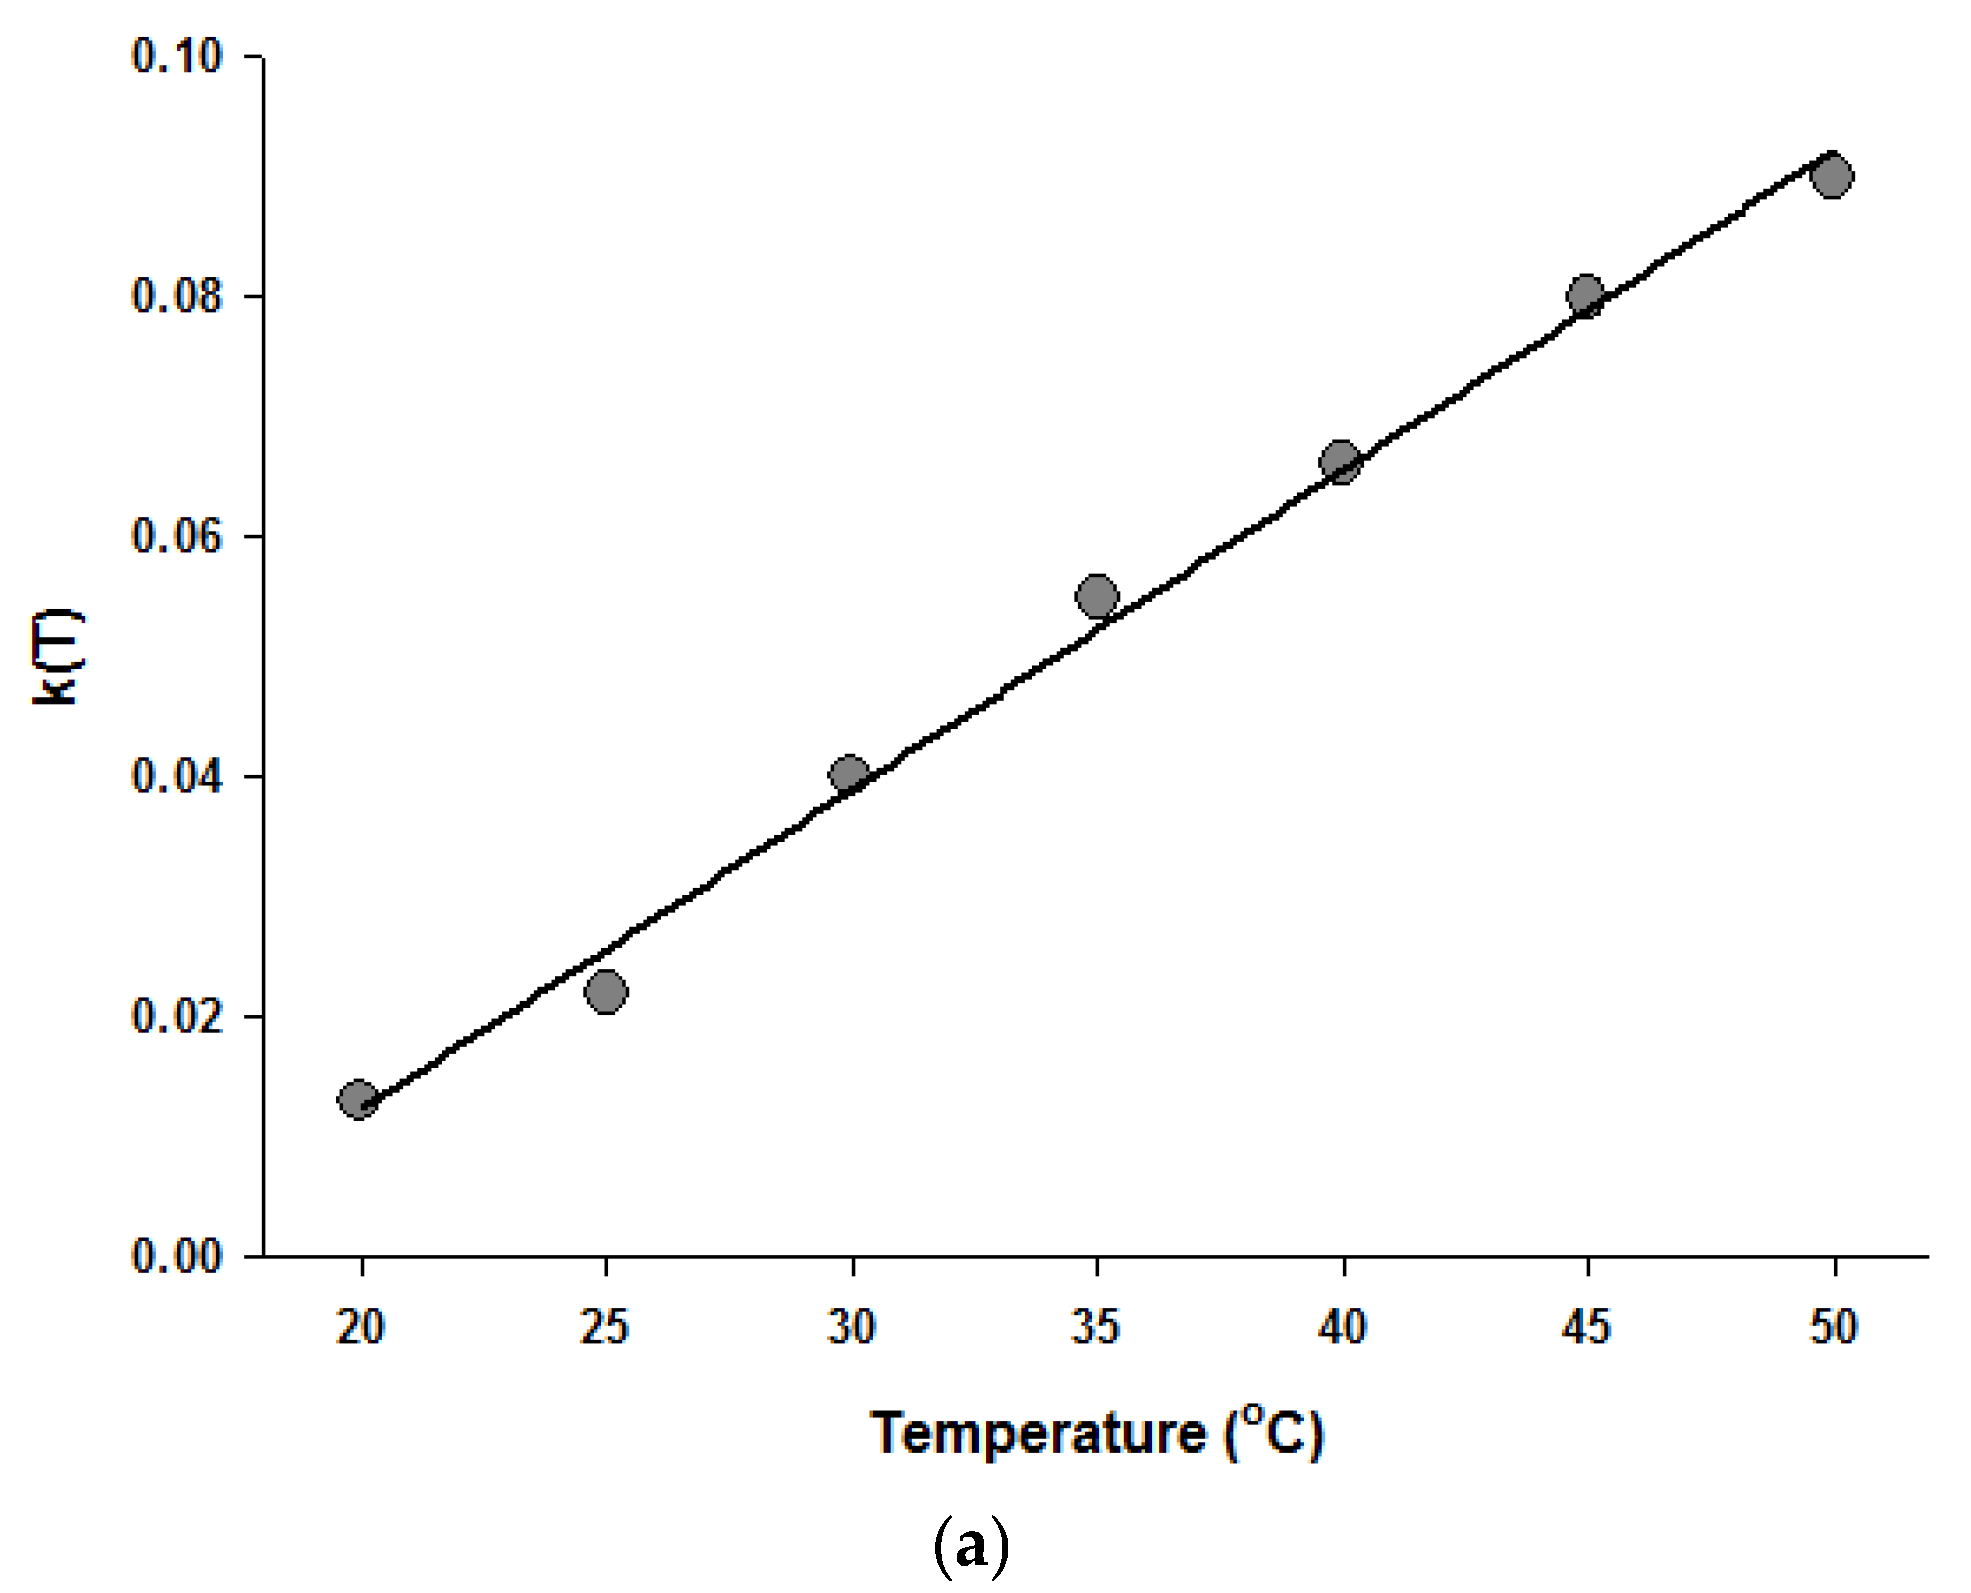
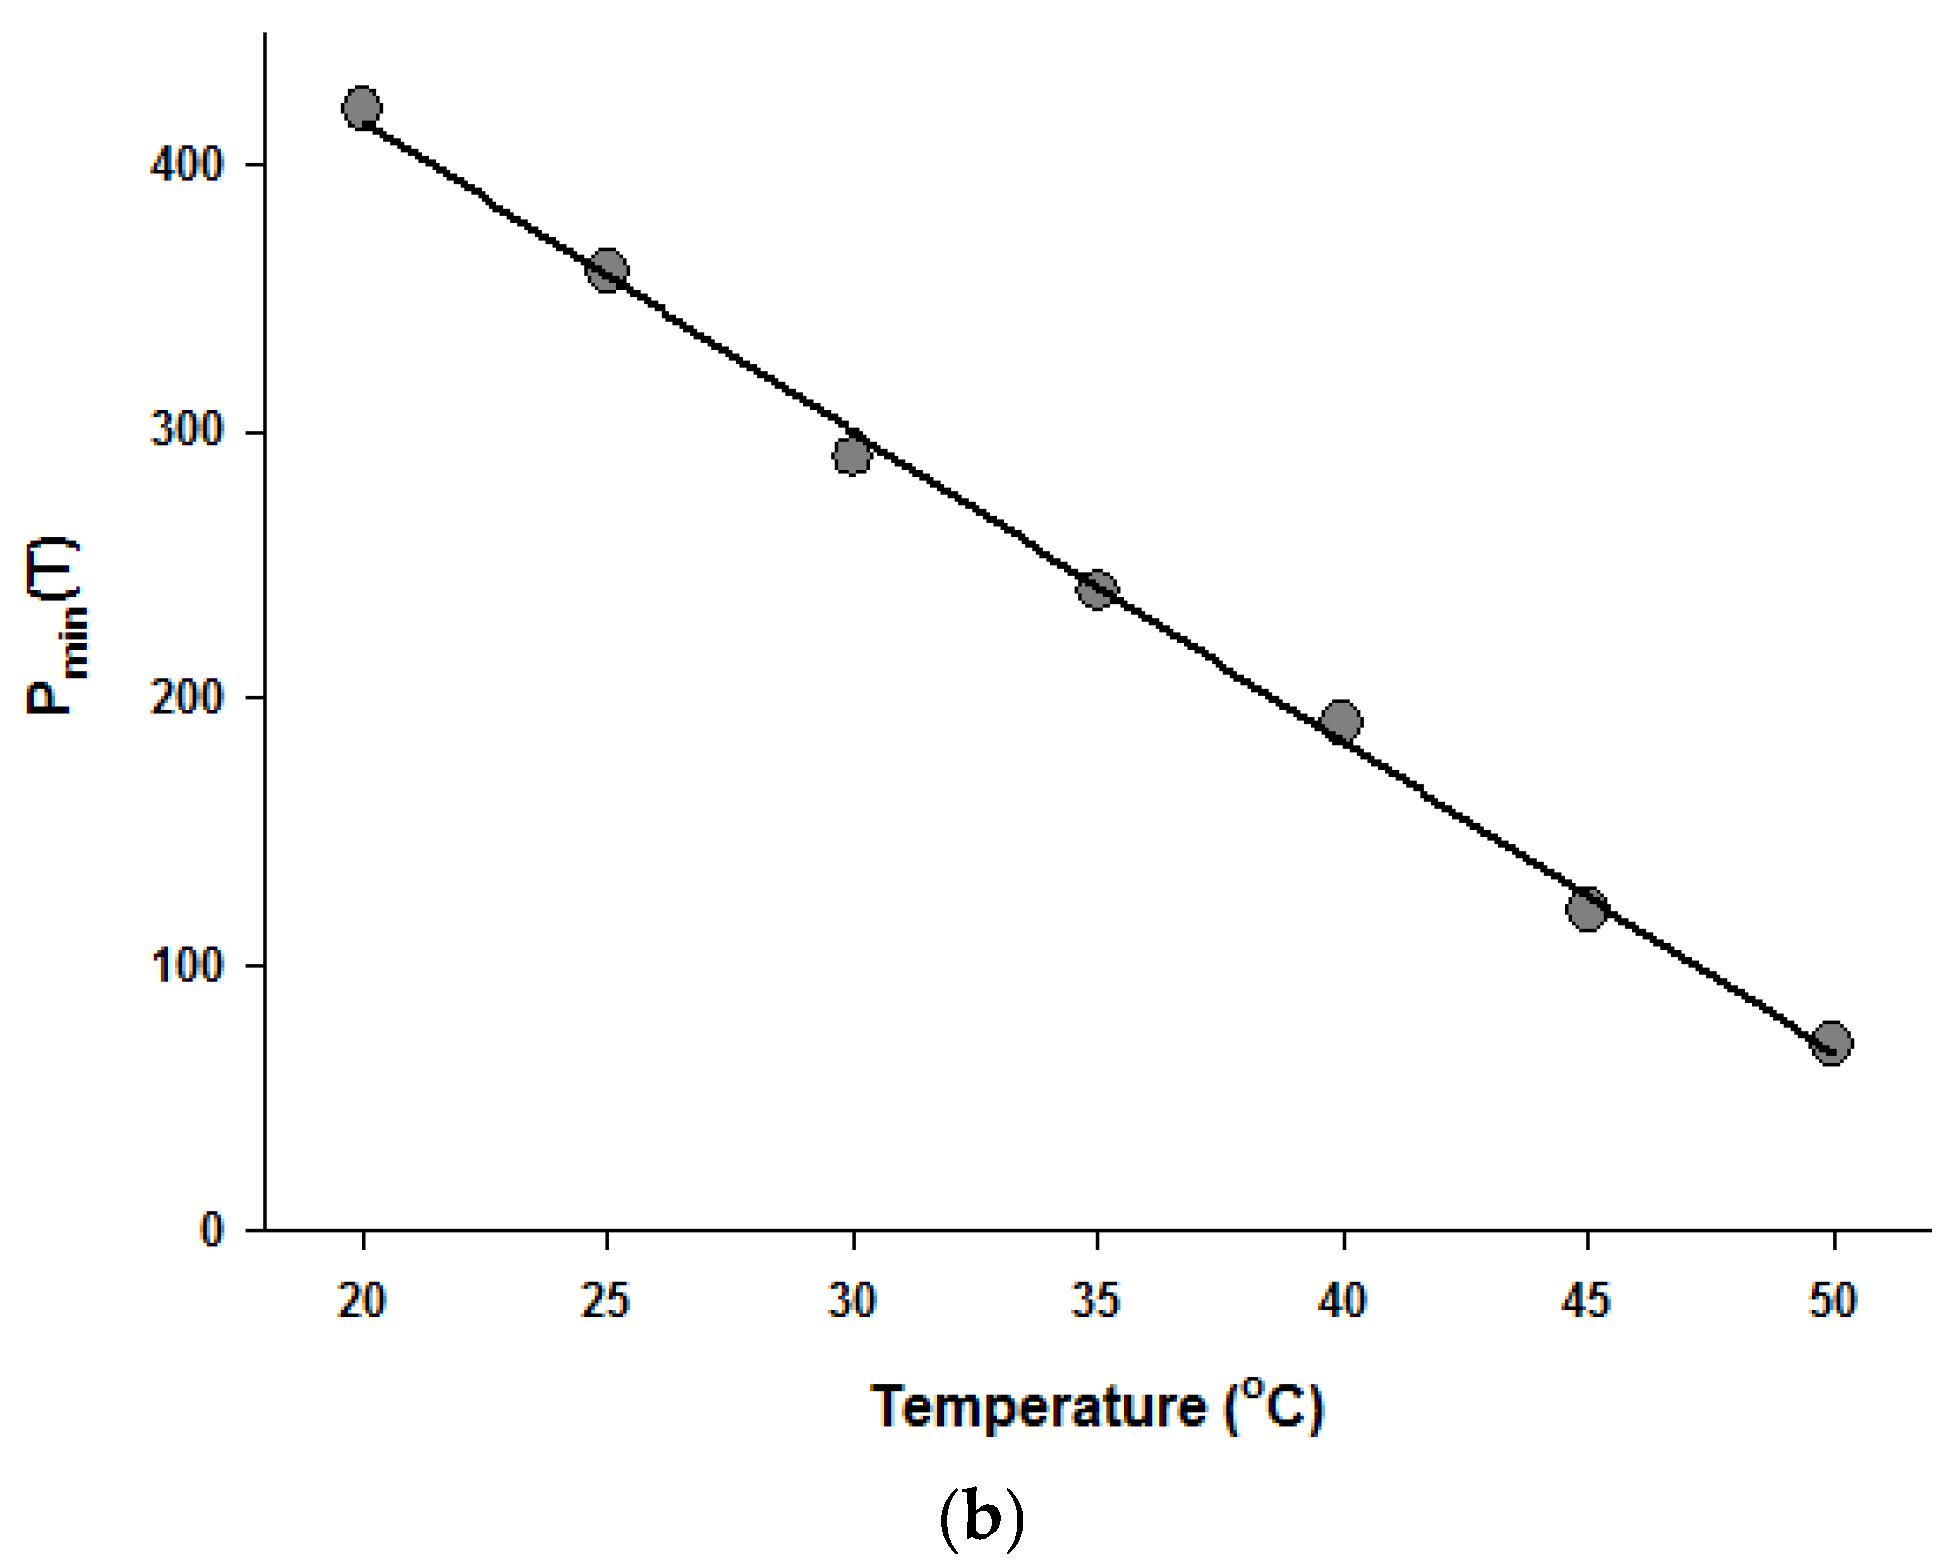
Since the Fermi equation was the best-fit model among the models tested, some possible applications of the Fermi equation were simulated. The usefulness of the Fermi equation was also demonstrated in the modeling of thermal inactivation [50] and pulse electrical field inactivation [51]. Figure 3 shows the simulated dose-response curves with the Fermi equation at different temperatures at a constant holding time. Figure 4 shows the effect of temperature on the parameters of the Fermi equation. Note that any empirical model could be used to describe the temperature dependence of k(T) and Pmin(T). Moreover, this type of modeling can also be used to define the time dependency of k(t) and Pmin(t) or the temperature and time dependency of k(t,T) and Pmin(t,T). As mentioned before, dose–response modeling of microbial inactivation by HHP could be more beneficial than the traditional inactivation modeling, where long holding times are needed for high inactivation values, especially at low pressure values.
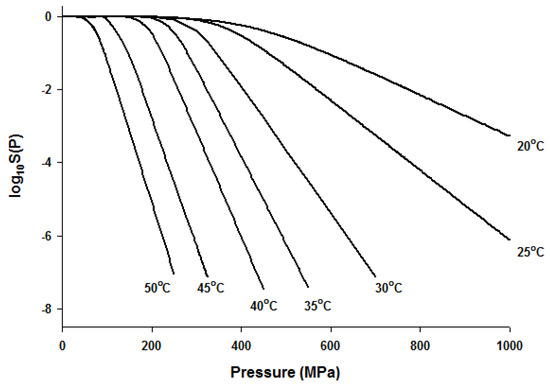
Figure 3.
Simulated dose-response curves with the Fermi equation for microbial inactivation by HHP at different temperatures.
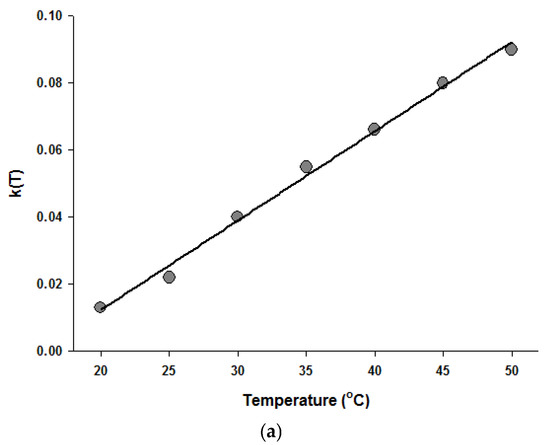
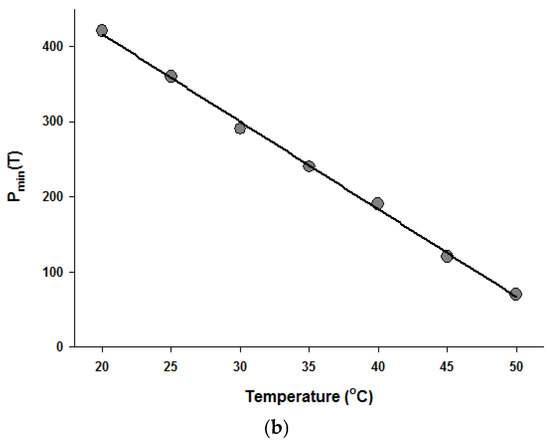
Figure 4.
Temperature dependence of the parameters of the Fermi equation: k (a) and Pmin (b).
Selection of appropriate holding time(s) (3 or 5 min) can be the first step in the experimental design of dose-response modeling of HHP inactivation. Then a trial with a pressure value (200 MPa) at a constant temperature (20 °C) could be made to quantify the inactivation. If no inactivation is observed, it may be assumed that pressure values lower than the selected pressure level (200 MPa) would also have no effect on microbial inactivation. Then, pressure can be increased incrementally (50 MPa) to observe the measurable inactivation and total inactivation (8 log10) if possible. The procedure could be repeated each time with a new temperature value.
5. Conclusions and Future Outlook
The processing costs of HHP treatment are related to the holding times at the target pressure [52]; this is why shorter treatment times would be economically beneficial. Dose-response modeling can allow us to use short treatment times ( 10 min). The models used in this study were all suitable to describe the HHP inactivation; however, the Fermi equation was the best-fit model with two interpretable parameters. The pressure value needed for measurable inactivation (Pmin in MPa), which corresponds to 0.3 log10 inactivation or inactivation of half of the initial population, i.e., N0 to N0/2, and slope (k in MPa−1) of the inactivation could be estimated.
In fact, the procedure given in this study can also be extended for enzyme inactivation by HHP. Moreover, inactivation due to compression and decompression should be quantified and dose-response modeling should be done with inactivation at the constant pressure values. The effect of temperature during HHP treatment and injury of microorganisms should also be taken into account. Further experiments can be done to verify the P5 values at the given conditions.
Conflicts of Interest
The authors declare no conflict of interest.
References
- Buzrul, S.; Alpas, H.; Bozoglu, F. Effects of high hydrostatic pressure on shelf life of lager beer. Eur. Food Res. Technol. 2005, 220, 615–618. [Google Scholar] [CrossRef]
- Erkan, N.; Üretener, G.; Alpas, H.; Selçuk, A.; Özden, Ö.; Buzrul, S. The effect of different high pressure conditions on the quality and shelf life of cold smoked fish. Innov. Food Sci. Emerg. Technol. 2011, 12, 104–110. [Google Scholar] [CrossRef]
- Bermúdez-Aguirre, D.; Barbosa-Cánovas, G.V. An update on high hydrostatic pressure, from the laboratory to industrial applications. Food Eng. Rev. 2011, 3, 44–61. [Google Scholar] [CrossRef]
- Buzrul, S. High hydrostatic pressure treatment of beer and wine: A review. Innov. Food Sci. Emerg. Technol. 2012, 13, 1–12. [Google Scholar] [CrossRef]
- Buzrul, S. Multi-pulsed high hydrostatic pressure inactivation of microorganisms: A review. Innov. Food Sci. Emerg. Technol. 2014, 26, 1–11. [Google Scholar] [CrossRef]
- Huang, H.-W.; Lung, H.-M.; Yang, B.B.; Wang, C.-Y. Responses of microorganisms to high hydrostatic pressure processing. Food Control 2014, 40, 250–259. [Google Scholar] [CrossRef]
- Guan, D.; Chen, H.; Hoover, D.G. Inactivation of Salmonella typhimurium DT 104 in UHT whole milk by high hydrostatic pressure. Int. J. Food Microbiol. 2005, 104, 145–153. [Google Scholar] [CrossRef] [PubMed]
- Balasubramaniam, V.M.; Ting, E.Y.; Stewart, C.M.; Robbins, J.A. Recommended laboratory practices for conducting high pressure microbial inactivation experiments. Innov. Food Sci. Emerg. Technol. 2004, 5, 299–306. [Google Scholar] [CrossRef]
- Nguyen, L.C.; Balasubramaniam, V.M. Fundamentals of Food Processing Using High Pressure. In Nonthermal Processing Technologies for Food; Zhang, H.Q., Barbosa-Cánovas, G.V., Balasubramaniam, V.M., Dunne, C.P., Farkas, D.F., Yuan, J.T.C., Eds.; Blackwell Publishing Ltd.: Hoboken, NJ, USA; Institute of Food Technologists: Chicago, IL, USA, 2011; pp. 3–19. [Google Scholar]
- Mújica-Paz, H.; Valdez-Fragoso, A.; Tonello Samson, C.; Welti-Chanes, J.; Torres, J.A. High-pressure processing technologies for the pasteurization and sterilization of foods. Food Bioprocess Technol. 2011, 4, 969–985. [Google Scholar] [CrossRef]
- Peleg, M.; Normand, M.D.; Damrau, E. Mathematical interpretation of dose-response curves. Bull. Math. Biol. 1997, 59, 747–761. [Google Scholar] [CrossRef]
- Peleg, M. Advanced Quantitative Microbiology for Food and Biosystems: Models for Predicting Growth and Inactivation; CRC Press: Boca Raton, FL, USA, 2006. [Google Scholar]
- Norton, T.; Sun, D.-W. Recent advances in the use of high pressure as an effective processing technique in the food industry. Food Bioprocess Technol. 2008, 1, 2–34. [Google Scholar] [CrossRef]
- Van Boekel, M.A.J.S.; Zwietering, M.H. Experimental design, data processing and model fitting in predictive microbiology. In Modelling Microorganisms in Food; Brul, S., van Gerwen, S., Zwietering, M., Eds.; CRC Press: Boca Raton, FL, USA; Woodhead Publishing: Cambridge, UK, 2007; pp. 22–43. [Google Scholar]
- Peleg, M. Evaluation of the Fermi equation as a model of dose-response curves. Appl. Microbiol. Biotechnol. 1996, 46, 303–306. [Google Scholar] [CrossRef]
- Geeraerd, A.; Valdramidis, V.; Van Impe, J. GInaFiT, a freeware tool to assess non-log-linear microbial survivor curves. Int. J. Food Microbiol. 2005, 102, 95–105. [Google Scholar] [CrossRef] [PubMed]
- Buzrul, S. A suitable model of microbial growth. Afr. J. Microbiol. Res. 2009, 3, 468–474. [Google Scholar]
- Buzrul, S. A predictive model for high-pressure carbon dioxide inactivation of microorganisms. J. Food Saf. 2009, 29, 208–223. [Google Scholar] [CrossRef]
- Buzrul, S. Modeling and predicting inactivation of Escherichia coli under isobaric and dynamic high hydrostatic pressure. Innov. Food Sci. Emerg. Technol. 2009, 10, 391–395. [Google Scholar] [CrossRef]
- Moussa, M.; Perrier-Cornet, J.-M.; Gervais, P. Synergistic and antagonistic effects of combined subzero temperature and high pressure on inactivation of Escherichia coli. Appl. Environ. Microbiol. 2006, 72, 150–156. [Google Scholar] [CrossRef] [PubMed]
- Solomon, E.B.; Hoover, D.G. Inactivation of Campylobacter jejuni by high hydrostatic pressure. Lett. Appl. Microbiol. 2004, 38, 505–509. [Google Scholar] [CrossRef] [PubMed]
- Doğan, C.; Erkmen, O. Ultra high hydrostatic pressure inactivation of Escherichia coli in milk, and orange and peach juices. Food Sci. Technol. Int. 2003, 9, 403–405. [Google Scholar] [CrossRef]
- Yamamoto, K.; Matsubara, M.; Kawasaki, S.; Bari, M.L.; Kawamoto, S. Modeling the pressure inactivation dynamics of Escherichia coli. Braz. J. Med. Biol. Res. 2005, 38, 1253–1257. [Google Scholar] [CrossRef] [PubMed]
- Wang, L.; Pan, J.; Xie, H.; Yang, Y.; Lin, C. Inactivation of Staphylococcus aureus and Escherichia coli by the synergistic action of high hydrostatic pressure and dissolved CO2. Int. J. Food Microbiol. 2010, 144, 118–125. [Google Scholar] [CrossRef] [PubMed]
- Griffin, P.L.; Kish, A.; Steele, A.; Hemley, R.J. Differential high pressure survival in stationary-phase Escherichia coli MG1655. High Press. Res. 2011, 31, 325–333. [Google Scholar] [CrossRef]
- Perrier-Cornet, J.-M.; Tapin, S.; Gaeta, S.; Gervais, P. High-pressure inactivation of Saccharomyces cerevisiae and Lactobacillus plantarum at subzero temperatures. J. Biotechnol. 2005, 115, 405–412. [Google Scholar] [CrossRef] [PubMed]
- Park, S.W.; Sohn, K.H.; Shin, J.H.; Lee, H.J. High hydrostatic pressure inactivation of Lactobacillus viridescens and its effects on ultrastructure of cells. Int. J. Food Sci. Technol. 2001, 36, 775–781. [Google Scholar] [CrossRef]
- Simpson, R.K.; Gilmour, A. The effect of high hydrostatic pressure on Listeria monocytogenes in phosphate-buffered saline and model food systems. J. Appl. Microbiol. 1997, 83, 181–188. [Google Scholar] [CrossRef] [PubMed]
- Tholozan, J.L.; Ritz, M.; Jugiau, F.; Federighi, M.; Tissier, J.P. Physiological effects of high hydrostatic pressure treatments on Listeria monocytogenes and Salmonella typhimurium. J. Appl. Microbiol. 2000, 88, 202–212. [Google Scholar] [CrossRef] [PubMed]
- Erkmen, O.; Dogan, C. Effects of ultra high hydrostatic pressure on Listeria monocytogenes and natural flora in broth, milk and fruit juices. Int. J. Food Sci. Technol. 2004, 39, 91–97. [Google Scholar] [CrossRef]
- Koseki, Y.; Yamamoto, K. pH and solute concentration of suspension media affect the outcome of high hydrostatic pressure treatment of Listeria monocytogenes. Int. J. Food Microbiol. 2006, 111, 175–179. [Google Scholar] [CrossRef] [PubMed]
- Donsì, G.; Ferrari, G.; Maresca, P. On the modelling of the inactivation kinetics of Saccharomyces cerevisiae by means of combined temperature and high pressure treatments. Innov. Food Sci. Emerg. Technol. 2003, 4, 35–44. [Google Scholar] [CrossRef]
- Wang, C.-Y.; Hsu, C.-P.; Huang, H.-W.; Yang, B.B. The relationship between inactivation and morphological damage of Salmonella enterica treated by high hydrostatic pressure. Food Res. Int. 2013, 54, 1482–1487. [Google Scholar] [CrossRef]
- Lee, J.; Kaletunç, G. Inactivation of Salmonella Enteritidis strains by combination of high hydrostatic pressure and nisin. Int. J. Food Microbiol. 2010, 140, 49–56. [Google Scholar] [CrossRef] [PubMed]
- Erkmen, O. Effects of high hydrostatic pressure on Salmonella typhimurium and aerobic bacteria in milk and fruit juices. Roman. Biotechnol. Lett. 2011, 16, 6540–6547. [Google Scholar]
- Wang, C.-Y.; Huang, H.-W.; Hsu, C.-P.; Shyu, Y.-T.; Yang, B.B. Inactivation and morphological damage of Vibrio parahaemolyticus treated with high hydrostatic pressure. Food Control 2013, 32, 348–353. [Google Scholar] [CrossRef]
- Ponce, E.; Pla, R.; Capellas, M.; Guamis, B.; Mor-Mur, M. Inactivation of Escherichia coli inoculated in liquid whole egg by high hydrostatic pressure. Food Microbiol. 1998, 15, 265–272. [Google Scholar] [CrossRef]
- Doona, C.J.; Feeherry, F.E.; Ross, E.W. A quasi-chemical model for the growth and death of microorganisms in foods by non-thermal and high-pressure processing. Int. J. Food Microbiol. 2005, 100, 21–32. [Google Scholar] [CrossRef] [PubMed]
- Buzrul, S.; Largeteau, A.; Alpas, H.; Demazeau, G. Pulsed pressure treatment for inactivation of Escherichia coli and Listeria innocua in whole milk. J. Phy. Conf. Ser. 2008, 121, 142001. [Google Scholar] [CrossRef]
- Buzrul, S.; Alpas, H.; Largeteau, A.; Demazeau, G. Modeling high pressure inactivation of Escherichia coli and Listeria innocua in whole milk. Eur. Food Res. Technol. 2008, 227, 443–448. [Google Scholar] [CrossRef]
- Huang, Y.; Ye, M.; Chen, H. Inactivation of Escherichia coli O157:H7 and Salmonella spp. in strawberry puree by high hydrostatic pressure with/without subsequent frozen storage. Int. J. Food Microbiol. 2013, 60, 337–343. [Google Scholar] [CrossRef] [PubMed]
- Carreño, J.M.; Gurrea, M.C.; Sampedro, F.; Carbonell, J.V. Effect of high hydrostatic pressure and high-pressure homogenisation on Lactobacillus plantarum inactivation kinetics and quality parameters of mandarin juice. Eur. Food Res. Technol. 2011, 232, 265–274. [Google Scholar] [CrossRef]
- Huang, H.-W.; Lung, H.-M.; Chang, Y.-H.; Yang, B.B.; Wang, C.-Y. Inactivation of pathogenic Listeria monocytogenes in raw milk by high hydrostatic pressure. Foodborne Pathog. Dis. 2015, 12, 139–144. [Google Scholar] [CrossRef] [PubMed]
- Toledo, J.; Pulido, R.P.; Abriouel, H.; Grande, M.J.; Gálvez, A. Inactivation of Salmonella enterica cells in Spanish potato omelette by high hydrostatic pressure treatments. Innov. Food Sci. Emerg. Technol. 2012, 14, 25–30. [Google Scholar] [CrossRef]
- Pulido, R.P.; del Árbol, J.T.; Burgos, J.G.; Gálvez, A. Bactericidal effects of high hydrostatic pressure treatment singly or in combination with natural antimicrobials on Staphylococcus aureus in rice pudding. Food Control 2012, 28, 19–24. [Google Scholar] [CrossRef]
- Liu, F.; Wang, Y.; Bi, X.; Gou, X.; Fu, S.; Liao, X. Comparison of microbial inactivation and rheological characteristics of mango pulp after high hydrostatic pressure treatment and high temperature short time treatment. Food Bioprocess Technol. 2013, 6, 2675–2684. [Google Scholar] [CrossRef]
- Black, E.P.; Huppertz, T.; Fitzgerald, G.F.; Kelly, A.L. Baroprotection of vegetative bacteria by milk constituents: A study on Listeria innocua. Int. Dairy J. 2007, 17, 104–110. [Google Scholar] [CrossRef]
- Peleg, M.; Normand, M.D.; Corradini, M.G. Generating microbial survival curves during thermal processing in real time. J. Appl. Microbiol. 2005, 98, 406–417. [Google Scholar] [CrossRef] [PubMed]
- Chapleau, N.; Ritz, M.; Delépine, S.; Jugiau, F.; Federighi, M.; de Lamballerie, M. Influence of kinetic parameters of high pressure processing on bacterial inactivation in a buffer system. Int. J. Food Microbiol. 2006, 106, 324–330. [Google Scholar] [CrossRef] [PubMed]
- Peleg, M. A model of temperature effects on microbial populations from growth to lethality. J. Sci. Food Agric. 1995, 68, 83–89. [Google Scholar] [CrossRef]
- Peleg, M. A model of microbial survival after exposure to pulsed electric fields. J. Sci. Food Agric. 1995, 67, 93–99. [Google Scholar] [CrossRef]
- Tassou, C.C.; Panagou, E.Z.; Samaras, F.J.; Galiatsatou, P.; Mallidis, C.G. Temperature-assisted high hydrostatic pressure inactivation of Staphylococcus aureus in a ham model system: Evaluation in selective and nonselective medium. J. Appl. Microbiol. 2008, 104, 1764–1773. [Google Scholar] [CrossRef] [PubMed]
© 2017 by the author. Licensee MDPI, Basel, Switzerland. This article is an open access article distributed under the terms and conditions of the Creative Commons Attribution (CC BY) license (http://creativecommons.org/licenses/by/4.0/).