Abstract
Teinturier grapes are an important germplasm resource for addressing the insufficient accumulation of anthocyanins in grapes under adverse climatic conditions. To enrich the variety diversity, eight newly bred teinturier grape varieties were used for comparison with the traditional teinturier grape variety “Yan 73”. The results showed that A1 wine exhibits high levels of citric and tartaric acids, while the B2 wine showed elevated levels of malic and succinic acids. The C1, B2, and G1 wines showed higher total phenol, anthocyanin, flavonoid, flavan-3-ol, and tannin content. In the free volatile components of C1 wine, α-phellandrene, methyl salicylate, α-Terpineol, β-Myrcene, isoamylol and ethyl acetate were the primary aroma compounds. Meanwhile, the glycosidically bound aroma components of B2 wine were predominantly dominated by nonanal, benzaldehyde, α-terpineol, hexanal, α-phellandrene, and D-limonene. Compared with Y73, B2 and A1 wines have better phenols, while B2, C1 and B5 wines have better flavors, which provides support for the promotion of new varieties.
1. Introduction
Grapes (Vitis vinifera L.), as one of the temperate fruit trees with a relatively long history of human domestication, have garnered significant attention for their rich nutritional value and unique flavor profile. Among various grape varieties, teinturier grapes stand out with their dark-colored flesh and exceptional nutritional content, becoming a crucial ingredient in making specialty wines. These varieties are rich in anthocyanins and other phenolic compounds, boasting higher anthocyanin content than most non-teinturier grape varieties [1,2]. During winemaking, these grapes require minimal maceration time to achieve deep, vibrant colors, enhancing both the wine’s depth and richness.
Anthocyanins, a class of phenolic compounds widely found in plants, exhibit antioxidant, free-radical scavenging, antibacterial, anti-inflammatory, and antiviral properties while contributing to their coloration [1]. The biosynthesis pathway of plant anthocyanins comprises two major components: the phenylpropanoid pathway and the flavonoid pathway. Structural genes directly affect the synthesis of anthocyanins by encoding related enzymes involved in the process, including chalcone synthase (CHS), chalcone isomerase (CHI), flavanone 3-hydroxylase (F3H), dihydroflavonoid reductase (DFR), anthocyanidin synthase (ANS), anthocyanidin 3-O-glucosyltransferase (UFGT), etc. Notably, UFGT acts as the final enzyme in anthocyanin biosynthesis, catalyzing the glycosylation of anthocyanidins into anthocyanins. Regulatory genes regulate the expression of structural genes at the transcriptional level, with MYBs, bHLHs (basic helix loop helix), and WD40s transcription factors regulating anthocyanin synthesis by forming the MYB-bHLH-WD40 (MBW) complex. MBW complexes have been identified in various plants such as strawberries [3] and sweet cherries [4]. After endoplasmic reticulum synthesis, anthocyanidins undergo post-translational modifications, including glycosylation, methylation, or acylation, before being transported to vacuoles for storage and accumulation [5,6].
In many grape regions around the world, the synthesis of anthocyanins is influenced by natural conditions. In the Barossa Valley of Australia, under the Mediterranean climate, the summer is hot and dry. The continuous high temperature and intensified drought stress has led to a decrease in the total anthocyanin concentration of grapes, resulting in a pale wine color and reduced stability [7]. In some sub-regions of Napa Valley in the United States, the accumulation of anthocyanins in grapes has stagnated or degraded in the later stage of ripening, which may be related to changes in local climatic conditions, such as high temperatures and the duration of sunlight [8]. The Yantai production area is located in the eastern part of Shandong Province, China. It is significantly influenced by the ocean, with mild weather but high precipitation, resulting in poor grape skin coloring [9]. The northwestern region includes Xinjiang, Gansu, Ningxia, and western Inner Mongolia, which experiences dry conditions, large temperature differences between day and night, higher temperatures during the growing season [10], and susceptibility to the degradation of grape anthocyanins. In addition, the high-temperature stress caused by global warming has become a key factor restricting the accumulation of anthocyanins in grape fruits.
In production, the anthocyanin content of grapes can be increased through the improvement of cultivation measures. The optimal temperature range for the activity of anthocyanin synthesis-related enzymes is between 17 and 26 °C, and high temperatures exceeding 35 °C can inhibit the accumulation of anthocyanins [11]. A high nitrogen supply in soil can regulate genes involved in anthocyanin synthesis [12], thereby reducing the biosynthesis of anthocyanins in grapes. Appropriate water deficiency facilitates the accumulation of anthocyanins in grapes [13]. Under water stress conditions, changes in endogenous hormone levels within grapes promote anthocyanin synthesis [14,15]. Base leaf removal increases light exposure and air circulation, positively influencing the accumulation of anthocyanins in fruits [16]. Exogenous plant hormones exert distinct regulatory effects on anthocyanin biosynthesis. Auxin inhibits the synthesis of anthocyanins [17]. Cytokinins [18], ABA treatment [19], and methyl jasmonic acid (MeJA) treatment [17] promote the synthesis of anthocyanins. However, these cultivation practices often require substantial labor input and technical expertise from growers, leading to increased production costs.
The development of new grape varieties could enhance the color profile of wine through genetic improvement. Variety improvement serves as an effective solution to insufficient anthocyanin accumulation in grapes across different production regions. Teinturier grape varieties, which contain higher levels of phenolic compounds, can help address this issue. The introduction of teinturier grape varieties dates back to the 19th century [2], when powdery mildew, root aphids, and mold were introduced to Europe. Disease-resistant grape varieties capable of producing high-quality wine became breeding priorities, gradually making teinturier grape varieties a focal point for researchers. Recent studies have revealed that multiple 408 bp repeats (Grapevine Color Enhancer, GCE) on the VvMYBA1 promoter may be associated with the characteristic red flesh and leaves of teinturier grape varieties [20]. Through T2T genome analysis, Zhang et al. [21] discovered that the VvMYBA1 promoter in the teinturier grape variety “Yan73” contains two additional 408 bp repeat sequences compared to the other two non-teinturier grape varieties. More coloring mechanisms in teinturier grape varieties are being uncovered. Despite strong market demand for red-fleshed grapes, the variety selection remains limited. This study systematically evaluates the fruit quality and winemaking characteristics of multiple red-fleshed grape germplasms identified earlier by our team, aiming to reveal their unique brewing value and potential applications, thereby supporting the development and promotion of new red-fleshed grape varieties in the industry.
2. Materials and Methods
2.1. Grape and Winemaking
This trial was conducted in 2024. Nine teinturier grape varieties Y73, A1, A2, B2, B4, B5, C1, G1, and G2 were collected from the experimental base at Shandong Agricultural University’s South Campus in Taishan District, Tai’an City, Shandong Province (117.6° E, 36.17° N). The basic information is shown in Table A1. The vineyards received standard water and fertilizer management and loam soil, were located in the warm temperate semi-humid monsoon climate with distinct four seasons and concurrent rainfall and heat, with all cultivars being grown under identical viticultural conditions. No plant growth regulators were applied during the growing season until fruit maturity.
Grapes were manually sorted, destemmed, and crushed before being transferred to 5 L glass jars for fermentation. A 24 h maceration at 20–25 °C was conducted with 50 mg/L SO2 and 30 mg/L pectinase (Lallzyme Ex, Lallemand, France). After juice separation, commercial yeast (Angel Yeast, Henan, China) at 200 mg/L was added for alcoholic fermentation. Daily monitoring of specific gravity and temperature was performed. When the specific gravity dropped below 0.996, 60 mg/L SO2 was added to terminate fermentation. The wine was then aged for one month at 4 °C before sampling for quality analysis.
2.2. DNA Extraction and Analysis
Grape leaves were ground into powder in liquid nitrogen, the CTAB method was used to extract grape leaf genomic DNA, and the primer pair (F: 5′-ATCAGTGAGGGTAACAAAGTCA-3′, R: 5′-CTGAAGACAACCACGTGCAAC-3′) was designed (Sangon, Shanghai, China). The polymerase chain reactions (PCRs) were carried out, with 1.0 μL of DNA template, 1.0 μL of each forward and reverse primer, 12.5 μL of 2 × Phanta Flash Master Mix (Vazyme, Nanjing, China) and 9.5 μL of ddH2O, and the agarose gel method was used for testing.
2.3. Appearance Quality of Grapes
The transverse and longitudinal diameters of grapes were measured with a digital vernier caliper. The fruit shape index was calculated. Each treatment tested 30 grapes.
The color index of grape fruits was measured using a colorimeter (Konica Minolta) by determining the L*, a*, and b* values at different positions on the equatorial plane of each grape. Calculate the color index of red grapes (CIRG), H and c*. Each treatment tested 30 grapes.
Fruit shape index = longitudinal diameter of fruit/transverse diameter of fruit
CIRG = (180° − H)/(L* + c*)
H = arctan b/a*
c* = [(a*)2 + (b*)2]0.5
2.4. Determination of Berry Physicochemical Parameters
After centrifugation of grape juice and wine (4 °C, 8000 rpm, 10 min), the basic physical and chemical indexes were determined by FTIR wine analyzer (Anton Paar, Shanghai, China).
After centrifugation (4 °C, 8000 rpm, 10 min), the CIELab parameters of wine were tested by W100 wine color analyzer (Hanon, Jinan, China) to obtain L* (brightness), a* (green/red), b* (blue/yellow), c* (saturation) and h* (tone angle).
2.5. HPLC Analysis of Monomer Acid Content in Wines
The organic acids in grapes were determined by high-performance liquid chromatography (Agilent, Santa Clara, CA, USA). The wine was diluted twice and filtered through a 0.22 µm organic membrane for later use. The mobile phase consisted of 0.005 mol/L sulfuric acid. The concentrations of various organic acids in the samples were calculated based on the chromatogram, with units expressed as g/L. The detailed quantitation of the calibration curves is listed in Table A2.
2.6. HPLC Analysis of Monomeric Anthocyanins Compounds in Wine
The monomeric anthocyanins compounds in wine were analyzed using HPLC. Wines were filtered through a 0.22 µm organic filter membrane before analysis. The mobile phase A for anthocyanins consisted of water, acetonitrile, and formic acid in a 32:4:1 ratio, while mobile phase B contained water, acetonitrile, and formic acid in a 16:20:1 ratio. All results were expressed as the content of Malavidin 3-O-glucoside (Table A2 and Table A3).
2.7. Photometric Determination of Total Phenol, Flavonoid, Anthocyanin, Flavan-3-ol and Tannin in Wines and Antioxidant Capacity
Referring to the determination method of Ju et al. [22], the total phenol content was measured using the Folin-Schonka method, with results expressed as gallic acid; the total tannins were determined by the methylcellulose precipitation method, with results expressed as catechins; the total anthocyanins were measured using the pH differential method, with results expressed as equivalent values of Malavidin 3-O-glucoside; the total flavonoids were analyzed using the aluminum chloride colorimetric method, with results expressed as rutin; and the total flavan-3-ols were determined using the p-DMAC method, with results expressed as (+)-catechins.
The antioxidant activity of the wines was assessed using DPPH radical scavenging assays, following the modified methods of Ding et al. [23]. Results were expressed as micromolar Trolox equivalents per liter (mM TE/L).
2.8. GC-MS Analyses of Free Volatile and Glycosidically Bound Aroma Compounds in Wines
Following the method by Yue et al. [24], 1.00 g NaCl and 5 mL wine were accurately weighed into a headspace vial, into which 10 µL of internal standard 4-methyl-2-pentanol (4M2P, 405.00 mg/L) was added. After equilibrating the sample for 5 min using a shaker (260 rpm, 40 °C), extraction fibers were inserted into the vial. The extraction was conducted for 30 min, followed by connection to a gas chromatography system (Thermofisher, Wilmington, DE, USA). The sample was analyzed at 250 °C for 8 min to detect free volatile components.
For analyzing glycosidically bound aroma compounds, the solid-phase extraction column was activated with 10 mL methanol and 10 mL water. Subsequently, 2 mL wine was added, followed by 5 mL distilled water and 5 mL dichloromethane. Finally, 20 mL chromatographic-grade methanol was used to elute glycosidically bound aroma compounds, with the collected eluate transferred to 50 mL centrifuge tubes. The entire extraction process maintained a flow rate of 2 mL/min. The methanol eluent was vacuum-dried under reduced pressure at 30 °C. Residual substances were thoroughly dissolved in 10 mL citric phosphoric acid buffer (0.2 M, pH = 5), and enzymatic hydrolysis was performed for 16 h at 40 °C using an AR 2000 glucosidase solution. Subsequent steps followed the same procedures as those for detecting free volatile components. This instrument is used to analyze the 52 main aroma substances in wine. The standard curve is shown in Table A4 and Table A5.
2.9. Sensory Evaluation of Wines
The tasting panel consisted of 10 experts from masters at the College of Enology, Northwest A&F University (6 males, 4 females, aged 20–28 years old); all of the experts have undergone sensory tasting training and can score the wines professionally and objectively. The rating system consisted of four parts: appearance, aroma, taste and balance, and the total score was 100. Approximately 30 mL of wine was prepared in an International Standards Organization (ISO) wine tasting glass. Sensory evaluation was conducted in a clean, odor-free, and well-lit sensory laboratory.
2.10. Statistical Analysis
Excel was used for statistical analysis of experimental data. One-way ANOVA and Tukey’s HSD were performed using SPSS 27.0.1, and different letters indicate significant differences between treatments (p < 0.05). When significant differences were found among different varieties, if homogeneity of variance held, Fisher’s least significant difference (LSD) was used for multiple comparison analysis; if homogeneity of variance did not hold, then the Tamheini T2 method was used. Heat mapping was performed using the Metware Cloud (https://cloud.metware.cn); a PCA map and a radar map were drawn using Origin 2024.
3. Results
3.1. Identification and Analysis of DNA Related to Teinturier Grapes
Rockel et al. [2] analyzed the VvMYBA1 promoters in teinturier grape varieties and discovered multiple 408 bp DNA sequence repeat insertions in the promoter regions. Moreover, the more inserted fragments there were, the higher the total anthocyanin content in the grape peel and pulp. The research previously assembled the genome of “Yan73” using T2T technology, revealing an 816 bp repeat insertion in the VvMYBA1 promoter of one chromosome of “Yan73” [21]. In this experiment, primers were designed at both ends of the repeat region to analyze grape leaf genomic DNA (Figure A1). Results showed that non-teinturier grape CS (Cabernet Sauvignon) exhibited a single band, while teinturier grape varieties Y73, A1, A2, B2, B4, B5, C1, G1, and G2 displayed multiple bands, indicating the presence of alleles of varying fragment lengths on both chromosomes of teinturier grapes, confirming their hybrid nature. The banding results showed that Y73, G1, and G2 contained three 408 bp repeat fragments, while A1, A2, B2, B4, B5, and C1 had five 408 bp repeat fragments.
3.2. Effects of Different Teinturier Grapes on Grape Color
The visual characteristics of grapes include fruit dimensions (transverse and longitudinal diameters), fruit shape index, and coloration. The fruit shape index reflects the roundness of the berries. As shown in Table 1, all eight varieties exhibited significantly smaller longitudinal diameters and fruit shape index compared to Y73. A1 grapes showed smaller transverse and longitudinal diameters, and a relatively low fruit shape index. B2 grapes demonstrated smaller transverse and longitudinal diameters than other teinturier varieties yet maintained a larger fruit shape index. C1 grapes exhibited the smallest fruit shape index. G1 grapes had larger transverse and longitudinal diameters and showed a smaller fruit shape index and a more rounded form.

Table 1.
Appearance measurements of grapes under different teinturier grapes at harvest.
The L* value indicates brightness in grape coloration, while the a* value represents greenish-red tones and the b* value denotes blue-yellow hues. The hue angle (h*) signifies different color variations, with c* meaning chroma, indicating color vibrancy. The color index of red grape (CIRG) measures redness intensity: lower CIRG values indicate yellowish hues, whereas higher values lean toward deep purple [25]. All eight varieties exhibited surface brightness exceeding Y73, with A1 showing the highest brightness. G1 had a* value < 0, indicating greenish tones, while other varieties predominantly displayed red tones. A1 demonstrated the most intense red hue, compared to G2’s minimal redness. Except for A1, B2, and G2, all other varieties showed yellowish tones. The nine varieties’ h* values ranged from −0.81 to 1.08, with values around zero suggesting dark surface colors. A1 achieved maximum color saturation (c* = 1.18), representing the purest hue, while G2 had the lowest saturation. The CIRG rankings were Y73 > G1 > C1 > B4 > B5 > A2 > G2 > B2 > A1, with CIRG > 6 indicating a bluish-black appearance [26].
3.3. Effects of Different Teinturier Grapes on Grape Physiochemical Parameters
The basic physicochemical index measurements of grapes from different cultivars are shown in Table 2. The reducing sugars in grapes primarily consist of glucose and fructose, which serve as the primary substrates for yeast fermentation. Except for B2 and G2 grapes, the reducing sugar content of all grapes is higher than Y73, and the reducing sugar content of A1 and C1 grapes is higher. The contents of total sugar and reducing sugar showed a highly consistent trend. The pH level in grapes is closely associated with acidic compounds. Titratable acid levels are crucial indicators of grape flavor and ripeness. Notably, the titratable acidity of C1 grapes is relatively low, with the highest pH value. The eight cultivar grapes showed significantly lower titratable acidity than Y73, while their pH values were notably higher. In contrast, G2 grapes displayed relatively low levels of reducing sugars, titratable acidity, soluble solids, and pH. These nine cultivar grapes exhibited substantial variations in physicochemical characteristics. The grape pH values ranged between 3.49 and 4.45, showing differences among cultivars but maintaining a relatively narrow variation range.
Table 2.
Physiochemical parameters of different teinturier grapes.
3.4. Effects of Different Teinturier Grapes on Wine Physiochemical Parameters
Physicochemical indicators serve as fundamental criteria for evaluating wine quality. As shown in Table 3, all samples exhibited residual sugar levels between 4.1 and 12.0 g/L, classifying them as semi-dry wines. The pH values ranged from 3.56 to 4.21. Among all tested samples, C1 wine demonstrated higher ethanol content, titratable acidity, pH, and residual sugar levels. Varieties A1 and G1 showed elevated ethanol content with lower values for other parameters, indicating the effective conversion of sugars into alcohol and carbon dioxide during fermentation, demonstrating good sugar utilization efficiency throughout the winemaking process. Varieties B4 and G2 had higher ethanol levels than Y73 but lower residual sugar content compared to others. Significant differences were observed in titratable acidity across varieties: A2 had the highest content while G1 had the lowest. pH values peaked in C1 wine and dipped in A1 wine. In summary, varieties A2 and C1 exhibited higher ethanol content, pH levels, and acidity compared to others.
Table 3.
Physiochemical parameters of different teinturier grape wines.
3.5. Effects of Different Teinturier Grapes on Wine Colour
Color is a crucial characteristic of wine, with nine color indicators for teinturier wines shown in Table 4. All samples showed L* values ranging from 2.77 to 29.57, indicating generally low brightness and darker body colors. Significant brightness variations were observed between samples: C1 had the lowest brightness and darkest color, while G2 exhibited the highest brightness and the brightest color. The a* values ranged from 4.19 to 54.48, showing distinct red-tone differences among teinturier varieties. G2 demonstrated significantly higher red tones compared to other samples, with C1 being the lowest. Notably, B2 and C1 wines showed lower red tones than other varieties by more than threefold. The b* values ranged from −1.92 to 18.33, with B5 exhibiting the strongest yellow tones. B2 and C1 wines had negative b* values, indicating bluish tones, while other samples displayed positive values, suggesting yellowish tones.
Table 4.
Color indicators of different teinturier grape wines.
The c* value indicates the concentration of color intensity. Wine samples showed significant differences with c* values ranging from 4.61 to 55.69, where C1 wine exhibited the lowest color saturation while G2 wine demonstrated the highest saturation and purest hue. h* represents the overall color tendency, with values between −0.43 and 0.40 indicating an overall inclination toward purplish-red or gemstone-red tones characteristic of new red wines [27]. ΔE measures the overall color variation, with all samples ΔE > 3 (ranging from 89.87 to 97.45), suggesting substantial color differences observable to the naked eye [28]. C1 wine showed the most pronounced color difference, while G2 wine had the least. The color parameter analysis revealed that A2, B5, and G2 wines displayed deeper hues with vibrant colors and excellent coloring performance.
3.6. Effects of Different Teinturier Grapes on Wine Monomeric Acid Content
The monomeric acids in wine primarily include citric acid, tartaric acid, malic acid, succinic acid, and lactic acid (Figure 1), which play a crucial role in shaping wine flavor [29]. All wine samples contained citric acid levels ranging from 0.24 to 0.45 g/L, meeting the national standard GB/T15037-2006 [30] “Wine” requirement of ≤1.0 g/L. Among the eight test samples, all exceeded the control Y73 wine in citric acid content, with A1 wine showing the highest levels. Tartaric acid, mainly derived from grapes, was present at elevated concentrations in nine samples. A1 wine demonstrated significantly higher tartaric acid content compared to others, while B2 wine had the lowest levels. Malic acid contributed to the wine’s higher acidity, while succinic acid exhibited complex taste profiles and chemical stability. B2 and B5 wines contained notably higher levels of both malic and succinic acids. Lactic acid enhanced wine body richness, and the lactate content of C1 and G2 wines were higher, with that of C1 wine being 2.62–31.24 times higher than other varieties, while B4 wine had the lowest. Overall, teinturier grape varieties contained the highest succinic acid content, followed by tartaric acid, with citric acid being the least abundant. Both C1 and G2 wines showed undetectable malic and citric acids, with succinic and tartaric acid levels remaining relatively low. The significant increase in lactic acid content likely resulted from malolactic fermentation processes in C1 and G2 wines, which consumed malic acid and consequently elevated lactic acid levels.

Figure 1.
Monomeric acid content of different teinturier grape wines (g/L). Different lowercase letters in the same color grid indicate significant differences (Tukey’s HSD, p < 0.05).
3.7. Effects of Different Teinturier Grapes on Wine Polyphenols Content
3.7.1. Total Phenol, Flavonoid, Anthocyanin, Flavan-3-ol and Tannin in Wines
During grape fermentation, phenolic compounds from grapes are extracted into wine through maceration, with their concentration playing a decisive role in determining the wine’s color and flavor profile [31]. This study conducted a comprehensive analysis of polyphenols in wines produced from teinturier grapes, including total phenols, total anthocyanin, total flavonoid, total flavan-3-ol, and total tannin content (Figure 2). The order of the total content of the five phenolic substances in the wines from high to low were C1, G1, B2, A1, B4, B5, A2, G2, and Y73. The content of total anthocyanins, total phenols, total flavonoids and total tannins in C1 wine were higher than other wine samples, corresponding to the lowest L* values in Table 4. B2, A1, and G1 wines contained elevated levels of all phenolic compounds. The A2 wine showed a higher total flavan-3-ol content but lower concentrations of other phenolic components. Notably, the G2 wine demonstrated higher total anthocyanins, while its total phenols, flavonoids, flavan-3-ol, and tannins were significantly lower than those in other samples.

Figure 2.
Effect of different teinturier grape on wine total anthocyanins (a), phenols (b), flavonoids (c), flavan-3-ol (d) and tannins (e). Different lowercase letters indicate significant differences (Tukey’s HSD, p < 0.05).
3.7.2. Effects of Different Teinturier Grapes on Wine Monomeric Anthocyanins Content
Anthocyanins are the primary colorants in wine. Table 5 showed the monomeric anthocyanin content in teinturier grape varieties. As illustrated, nine types of monomeric anthocyanins were analyzed, including five basic anthocyanins: Delphinidin 3-O-glucoside (Dp), Cyanidin 3-O-glucoside (Cy), Petunidin 3-O-glucoside (Pt), Peonidin 3-O-glucoside (Pn), and Malavidin 3-O-glucoside (Mv); two acetylated anthocyanins: Peonidin 3-O-(6-O-acetyl)-glucoside (Pn-ac) and Malavidin 3-O-(6-O-acetyl)-glucoside (Mv-ac); and two coumarinated anthocyanins: Trans-Peonidin 3-O-(6-O-p-coumaryl)-glucoside (t-Pn-co) and Trans-Malavidin 3-O-(6-O-p-coumaryl)-glucoside (t-Mv-co).
Table 5.
Monomeric anthocyanins of different teinturier grape wines (measured by Malavidin 3-O-glucoside, mg/L).
Among all teinturier wine samples, the predominant anthocyanin was Mv, followed by Mv-ac, with total concentrations of 5038.97 mg/L and 1617.00 mg/L, respectively. This indicated that delphinidin-based anthocyanins were the primary anthocyanins in these nine teinturier grape varieties. The remaining seven anthocyanin monomers ranked from highest to lowest content were Pn, t-Mv-co, Pt, Pn-ac, Dp, t-Pn-co, and Cy. The total monomer anthocyanin content in each wine sample followed this order: C1 > G1 > G2 > B2 > B5 > B4 > A1 > Y73 > A2. Except for Cy, the monomer anthocyanin content in C1 and G1 wines were significantly higher than in other samples. The Cy content in Y73 wine was notably 1.81 times higher than other samples. In comparison with other varieties, the t-Pn-co content in this variety was significantly lower, differing by 0.95 to 3.27 times compared to other wines.
3.8. Effects of Different Teinturier Grapes on Wine Antioxidant Activity
To evaluate the antioxidant activity in wines of different teinturier grape varieties, the scavenging activity of DPPH free radicals was determined. The scavenging activity range of DPPH free radicals in the nine wines were 16.84–29.67 mM TE/L, respectively (Figure 3). Among them, G1, C1 and B2 wines had relatively high antioxidant activity, while G2 wine had the lowest antioxidant activity. This was similar to the changing trend of phenolic substance content. The phenolic substance content of G1, C1 and B2 wines were relatively high, while the total phenol, total flavonoid, total flavane-3-alcohol and total tannin contents of G2 wine were all lower than those of other wines.
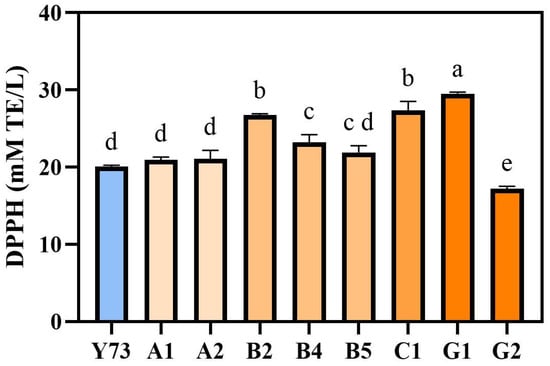
Figure 3.
Analysis of antioxidant activity in wines under different teinturier grapes. Different lowercase letters indicate significant differences (Tukey’s HSD, p < 0.05).
3.9. Effects of Different Teinturier Grapes on Wine Aroma
3.9.1. Free Volatile Components in Different Teinturier Grape Wines
Figure 4 presented the shared free volatile components in wines from different teinturier grape varieties, comprising 21 components, including 6 alcohols, 3 aldehydes, 2 ketones, 5 esters, and 5 other substances. Among all free volatile components in the nine wine samples, the highest concentrations were detected in ethyl acetate, trans-2-hexenal, geraniol, and β-Damascenone. Zhang et al. [32] has demonstrated that alcohols and esters significantly influence the aroma profile of wine. The total aroma contents of the nine wines are C1, B2, B5, G1, Y73, A2, B4, A1 and G2, in sequence.
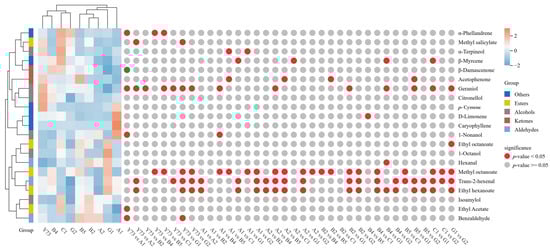
Figure 4.
Cluster heat map of free volatile compounds under different teinturier grape wines.
The heat map reveals the variation trends of free volatile components across different wines. Through cluster analysis, the results indicated that wines can be divided into two distinct categories based on aromatic composition. Y73, B4, C1 and G2 wines belong to the same category. Compared with other wines, the contents of α-phellandrene, methyl salicylate, α-Terpineol, β-Myrcene, isoamylol and ethyl acetate were the highest in the C1 wine. Citronellol, geraniol and p-cymene had relatively high contents in the Y73 wine. B5, B2, A2, G1 and A1 wines cluster together. Notably, A1 wine contained elevated 1-nonanol, D-limonene, and caryophyllene, while G1 wine showed higher levels of 1-octanol, methyl octanoate, trans-2-hexenal, ethyl hexanoate, hexanal, and ethyl octanoate. B2, B5, and C1 wine samples demonstrated a higher total aromatic content with a predominance of alcohols and esters, exhibiting rich wines and fruity aromas. In contrast, G2 wine showed the lowest total aromatic content among all varieties.
3.9.2. Glycosidically Bound Aroma Components in Different Teinturier Grape Wines
During wine fermentation or aging, glycosidically bound aroma compounds can be hydrolyzed into free-form aromatics through enzymatic or acid hydrolysis, enhancing the wine’s flavor profile. Figure 5 illustrated the shared glycosidically bound aroma compounds across different teinturier grapes, comprising 17 components, including 2 alcohols, 5 aldehydes, 2 ketones, 3 esters, and 5 other substances. Among the nine wine samples, the descending order of aromatic content is hexanal, 1-hexanol, α-terpineol, p-cymene, and nonanal.
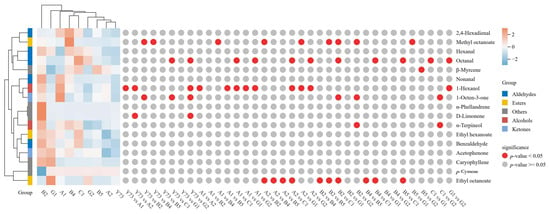
Figure 5.
Cluster heat map of glycosidically bound aroma compounds under different teinturier grape wines.
Cluster analysis revealed three distinct wine categories based on glycosidically bound aroma compounds. The B2 group stood alone as a unique category, exhibiting the highest total aromatic compound content—particularly notable for nonanal, benzaldehyde, α-terpineol, hexanal, α-phellandrene, and D-limonene—surpassing other wine samples. The Y73, G2, A2, and B5 wines formed another cluster with relatively lower total aromatic compounds. Y73 wine showed the lowest concentrations of octanal, nonanal, benzaldehyde, 1-octen-3-one, and caryophyllene. G1, A1, B4, and C1 wines formed the third cluster with moderate aromatic compounds; the contents of ethyl octanoate, acetophenone, p-cymene and caryophyllene in the G1 wine sample are all higher than those wines. A1 wine contained elevated levels of 1-hexanol and 1-octen-3-one.
3.9.3. Differences in Wine Aroma Composition
Principal component analysis (PCA) was conducted on common free volatile and glycosidically bound aroma components identified in different varieties of wine. As can be seen from Figure 6a, the proportion of PC1 is 50.6%, that of PC2 is 14.6%, and the total proportion of PC1 and PC2 is 65.2%. PC1 contained the information of the vast majority of aroma substances in different types of wines. It can be seen from the distribution positions of the samples that the free volatile components were distributed along the positive axis of the first principal component, while the glycosidically bound aroma compounds were distributed along the negative axis of the PC1.
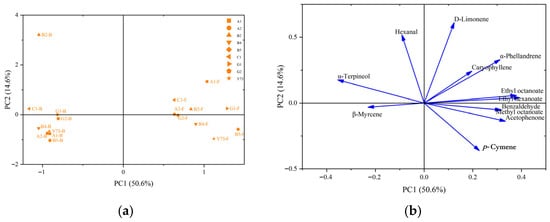
Figure 6.
Principal component analysis of aroma components in different teinturier grape wines. (a) Score plot; (b) loading plot. Abbreviations: F, free volatile compounds; B, glycosidically bound aroma compounds.
The principal component analysis of loading plot reflected the overall contribution of aroma substances to different types of wines. As can be seen from Figure 6b, the positive axis of the PC1 was distributed with acetophenone, benzaldehyde, methyl octanoate, ethyl octanoate, ethyl hexanoate, α-phellandrene, D-limonene, p-cymene and caryophyllene; its vector direction was highly consistent with the free volatile components data aggregation area of all wines, and these components were the key contributors to the real-time and perceptible free volatile components’ characteristics of wine. The components of α-terpineol, hexanal and β-myrcene were distributed on the negative axis of the PC1, which correspond to the glycosidically bound aroma components position of wines, and these substances constituted the potential aroma of wine. The glycosidically bound aroma components of B2 wine were different from other wines, which was consistent with the clustering results of glycosidically bound aroma components. Among them, the vector positions of hexanal and α-terpineol highly overlaped with those of the B2 wine, indicating that the B2 wine sample was rich in these two glycosidically bound aroma components.
3.10. Effects of Different Teinturier Grapes on Wine Sensory Evaluation
Appearance is the first impression of wine quality, mainly including clearness and tonality. None of the wines scored as high as Y73 in terms of appearance (Figure 7). On the one hand, the L* value of Y73 wine was higher than other wines; on the other hand, it may be related to the low anthocyanin and tannin content, and there was not too much polymer to precipitate. A1 and B5 wines were superior to Y73 in aroma purity and aroma fineness, indicating that their aromas were more pleasant and complex. B5 and C1 wines were superior to Y73 wine in all aspects of taste, which may be because the higher pH value reduced the astringency of the tannins and gave the wine a fuller sense of structure. B5, A1 and C1 performed better in balance, which may be related to their high scores in key indicators (aroma fineness and taste fineness). The sensory quality of wine is the result of the synergistic effect of all its attributes. Compared with the Y73 wine, the overall evaluation of most wines were higher than that of Y73, among which A1 and C1 were the best, while G2 had the same score as Y73, showing no obvious improvement effect.


Figure 7.
Radar chart for wine sensory evaluation. (a) Overall evaluation in different teinturier grape wines; (b) sensory evaluation of the appearance, aroma and taste in different teinturier grape wines.
4. Discussion
Anthocyanins, essential components in wine coloration, also exhibit diverse bioactive properties. Studies have shown that anthocyanins have antioxidant capacity [33], anti-inflammatory effects [34], and regulate blood lipids, offering significant benefits for cardiovascular diseases, diabetes, and neurological disorders [35]. Teinturier grape varieties, which contain abundant anthocyanins in both their skins and pulp, demonstrate remarkable advantages in antioxidant properties and health benefits.
Anthocyanins are synthesized through the phenylpropanoid pathway and flavonoid pathway, encoded by structural genes and regulatory genes. In grapes, VvMYBA1 and VvMYBA2 determine the color of the skin. Studies on “Yan73” indicate that anthocyanin accumulation in the pulp tissue may be coordinated by the transcription activator VvMYBA1 and the transcription repressor VvMYBC2-L1 [36]. Lu et al. [37] found that the “Mio Red” variety accumulates substantial anthocyanins in its pulp during ripening, with this accumulation closely associated with the high expression of specific genes such as DFR and ANS. Analysis of candidate transcription factors also revealed that genes like ERF23 and ERFCBF6 participate in the regulatory network of anthocyanin synthesis. In the study of the red-fleshed grape variety “Zhongshan Hongyu”, VvMYBA1 interacts with VvGST4 to activate its promoter activity [38]. The number of GCE repeats in the 408 bp promoter region of the VvMYBA1 gene in grapes is closely related to anthocyanin content [20]. We discovered that the VvMYBA1 promoter region on one chromosome of the teinturier grape “Yan73” contains two additional GCE fragments compared to non-teinturier grapes [21]. In this study, PCR technology identified multiple GCE insertions in nine teinturier grape varieties, while the non-teinturier grape variety “Cabernet Sauvignon” contained only one GCE fragment.
Different grape-growing regions have distinct terroir conditions, which may lead to significant differences in the accumulation of anthocyanins in grapes. The Yantai region has a temperate monsoon climate with concurrent rainfall and heat, typically featuring low solar radiation levels. Rainfall during grape ripening accounts for 70% of the annual total rainfall, creating climatic challenges for the accumulation of phenolic compounds in grapes, resulting in low sugar content and insufficient grape skin coloration [39]. The northwest region of China, blessed with abundant sunshine, large diurnal temperature variations, and arid conditions with scarce rainfall, is recognized as the primary area for cultivating wine grapes. However, the high summer temperatures in this region, particularly during grape ripening, reduce the synthesis rate of anthocyanins while accelerating their degradation [40], hindering their accumulation. Therefore, this study has developed several high-anthocyanin content teinturier grape varieties, with total anthocyanin levels in their wines reaching 474.08–2220.24 mg/L, providing solutions to the insufficient anthocyanin accumulation issue in grapes from various regions. In future studies, investigations can be conducted to examine the variations in grape and wine quality under abiotic stress conditions (e.g., drought stress). Such research will facilitate the breeding of novel teinturier grape varieties with enhanced stress tolerance and superior quality attributes, thereby addressing market requirements and driving industrial advancement.
The genetic traits of grapes play a crucial role in their anthocyanin composition, while external factors such as climate, soil types, and cultivation practices also influence the accumulation of anthocyanins in grapes. The interaction between genetic characteristics and terroir conditions is essential for enhancing both grape quality and wine uniqueness. Current research on teinturier grape varieties has been increasing. Multiple studies indicate that light significantly impacts the biosynthesis of anthocyanins. Li et al. [41] found that bagging treatments significantly reduced anthocyanin content in “Kolor” grapes, with more pronounced effects observed in the grape skin. UFGT expression increased in the pulp while decreasing in the skin. Bagging inhibited anthocyanin accumulation in the pulp of “Zhongshan Hongyu,” and the pulp coloration resumed after bag removal [42]. Different wavelengths of light, such as ultraviolet, blue, and red light, also affect anthocyanin biosynthesis, particularly blue light. Wang et al. [5] hypothesized that blue light activates the transcription of HY5 and COL2, subsequently inducing downstream transcription factors like VvMYBA1, VvMYBA2, and structural genes like CHS, CHI, and F3′5′H, ultimately leading to pulp color transformation in teinturier grapes. Through scientific cultivation practices and technological innovations, grape anthocyanin accumulation can be effectively promoted to enhance fruit quality. However, scientific cultivation control requires specific technical expertise and equipment investment, increasing labor costs and reducing profits. Conversely, variety improvement by selecting suitable grape varieties based on regional characteristics can effectively save labor and capital while boosting vineyard yields and profitability.
There are significant differences in the adaptability and application potential of different teinturier grape varieties, and their unique metabolic characteristics and sensory performance together constitute their own winemaking characteristics. A1 wine had typical characteristics of high phenols, high acidity, high balance, high purity of aroma and high aroma fineness, and may be suitable for making high-quality dry red wine with strong aging potential. A2 wine showed high ethanol content and titratable acidity, and had great coloring characteristics, but its phenolic content was lower than that of other varieties. B2 wine showed outstanding aroma complexity and structural strength. Its malic acid and succinic acid brought a unique sense of acidity layering. The high content of phenolic compounds ensured the excellent fullness and structure of the wine. The content of lactic acid and free volatile components in B4 wine were low. B5 wine was excellent in sensory balance. It had great coloring, high contents of malic acid and succinic acid, and the best evaluation on aroma purity, taste and overall balance. C1 wine had a high alcohol content and acidity, high content of phenols, rich free volatile components and good sensory evaluation. G1 wine had a high content of ethanol and phenolic substances, good color and antioxidant performance, but its acid content, free volatile and glycosidically bound aroma components were not high enough. G2 wine had relatively high lactic acid content, but its phenolic substance content was lower than that of other varieties, and both the content of free volatile and glycosidically bound aroma components and sensory evaluation were at the bottom. Overall, different resources have varying qualities. Specific applications can be made based on their quality performance. In the future, specific technical measures can also be formulated for specific varieties and types of wine to enhance their application value.
The high anthocyanin content of these teinturier grape varieties in this study provides a solution for improving cultivars in grape-growing regions with insufficient anthocyanin accumulation. Due to genetic characteristics, even under identical geographical and climatic conditions, there are significant differences in the quality of wine grapes among different varieties [43,44]. European grape varieties demonstrate higher total phenolic compounds, flavonoids, and flavan-3-ol content than other populations [45,46]. Compared to European grape varieties, Vitis vinifera × Vitis amurensis grapes exhibit higher total anthocyanin characteristics, but their fruits contain lower levels of five basic monomeric anthocyanins [47]. Reports indicate that Cabernet Sauvignon wines are rich in acylated anthocyanins, while Pinot Noir may contain none [48]. Li et al. [49] analyzed eight European red wine grapes and found that anthocyanins, particularly Mv, were most abundant in grape skins and wines. Oliveira et al. [50] discovered that wines made from teinturier grapes like Alicante Bouschet contain the highest levels of Mv. In this study, all nine teinturier grape varieties exhibited high anthocyanin content, with Mv and Mv-ac being the two most abundant monomeric anthocyanins. Different teinturier grape varieties also demonstrate unique characteristics. In this study, the C1 wine exhibited significantly higher levels of total anthocyanins, total phenols, total flavonoids, and total tannins compared to other wine samples, with multiple individual anthocyanins reaching elevated concentrations. The B2 wine samples demonstrated an abundant content of individual phenolic compounds. These findings provide material support for understanding the accumulation patterns of anthocyanins in different grape varieties, offering insights into the comprehensive utilization and mechanistic analysis of teinturier grapes.
5. Conclusions
There are differences in the quality of various teinturier grape varieties. A1 and B4 grapes showed higher sugar and acid levels during the harvest periods, while A2 and C1 wines showed elevated ethanol content, pH, and acidity. Among eight teinturier grape wines, their citric acid levels surpassed those in control sample Y73. B2 and B5 wines showed higher malic and succinic acid content, whereas C1 and G2 wines contained elevated lactic acid levels. Eight experimental wines showed higher total phenolic compounds (total anthocyanins, total phenols, total flavonoids, total flavan-3-ol, and total tannins) than the control sample Y73. Except for the A2 wine, all others showed higher total monomeric anthocyanin levels than the control Y73. Analysis of phenolic compounds revealed that C1, B2, and G1 wines contained elevated levels of monomeric anthocyanin compounds and total phenolic substances. Free volatile components of all the wines predominantly consisted of ethyl acetate, trans-2-hexenal and geraniol, while glycosidically bound aroma compounds of all the wines featured higher levels of hexanal, 1-hexanol, α-terpineol, and p-cymene, in that order. B2 wines demonstrated the highest combined free volatile and glycosidically bound aroma components, whereas G2 wine had the lowest. In sensory evaluation, B5 wine scored higher in aroma and taste. In conclusion, both A1 and B2 wines have a relatively high content of phenolic substances. Moreover, A1 wine performed better in sensory evaluations, while B2 endowed wine with more abundant monomer acids and aroma components; these grapes have the potential to become materials for enriching the wine varieties made from teinturier grapes.
Author Contributions
Conceptualization, K.C. and K.Z.; methodology, H.Z.; validation, H.Z., K.C. and K.Z.; investigation, X.Z., Y.D. (Yu Deng) and Y.Z.; resources, Y.D. (Yuanpeng Du); writing—original draft preparation, H.Z.; writing—review and editing, K.Z.; supervision, Y.F.; funding acquisition, Y.F. All authors have read and agreed to the published version of the manuscript.
Funding
This research was funded by the Ningxia Hui Autonomous Region Key R&D Program (2024BBF01003, 2025BBF02019), and the Open Project of Shaanxi Laboratory for Agriculture in Arid Areas (2024ZY-JCYJ-02-46).
Institutional Review Board Statement
The study was conducted in accordance with the Declaration of Helsinki and approved by the Institutional Review Board of Northwest A&F University (protocol code 2024122003 and date of approval 20 December 2024).
Informed Consent Statement
Informed consent was obtained from all subjects involved in the study.
Data Availability Statement
The original contributions presented in this study are included in the article. Further inquiries can be directed to the corresponding authors.
Conflicts of Interest
The authors declare no conflicts of interest.
Appendix A
Table A1.
The viticultural information on nine teinturier grape cultivars.
Table A1.
The viticultural information on nine teinturier grape cultivars.
| Number | Variety Name | Female Parent | Male Parent | Method of Correction | Spacing in the Rows and Spacing Between Rows |
|---|---|---|---|---|---|
| Y73 | Yan73 | Alicante Bouschet | Muscat Hamburg | Single-dish single-arm | 1 m × 2.2 m |
| A1 | MCS1 | Cabernet Sauvignon | Mitos | Single-dish single-arm | 1 m × 2.2 m |
| A2 | MCS2 | Cabernet Sauvignon | Mitos | Single-dish single-arm | 1 m × 2.2 m |
| B2 | Tai Zhu | Acolon | Merlot | Single-dish single-arm | 1 m × 2.2 m |
| B4 | Tai Mei | Acolon | Merlot | Single-dish single-arm | 1 m × 2.2 m |
| B5 | Tai zi | Acolon | Merlot | Single-dish single-arm | 1 m × 2.2 m |
| C1 | Zen Zi | Merlot | Mitos | Single-dish single-arm | 1 m × 2.2 m |
| G1 | Dai Hong | Cabernet Sauvignon | GM9322 | Single-dish single-arm | 1 m × 2.2 m |
| G2 | Dai Zhu | Cabernet Sauvignon | GM9322 | Single-dish single-arm | 1 m × 2.2 m |
Table A2.
Identification and quantification of the monomeric substances in wines by HPLC.
Table A2.
Identification and quantification of the monomeric substances in wines by HPLC.
| Classification | Analytes | Retention Time | Calibration Curves | R2 | Linear Range (mg/L) | LOD (mg/L) | LOQ (mg/L) |
|---|---|---|---|---|---|---|---|
| monomeric acid | Citric acid | 9.2 | y = 622.72x − 0.2284 | 0.9997 | 25–5000 | 0.41 | 1.35 |
| Tartaric acid | 9.8 | y = 864.7x − 0.0125 | 0.9997 | 25–5000 | 1.34 | 4.45 | |
| Malic acid | 10.9 | y = 432.57x − 2.8554 | 0.9999 | 25–5000 | 1.08 | 3.60 | |
| Succinic acid | 13.5 | y = 326.14x − 0.0706 | 0.9996 | 25–5000 | 1.08 | 3.60 | |
| Lactic acid | 14.5 | y = 427.34x − 12.18 | 0.9998 | 25–5000 | 0.63 | 2.10 | |
| monomeric anthocyanins | Malavidin 3-O-glucoside | 18.91 | y = 0.00002x − 0.1768 | 0.9998 | 50–200 | 0.12 | 0.41 |
Table A3.
Inter-day repeatability of partial analytes in HPLC (n = 5 × 3 days).
Table A3.
Inter-day repeatability of partial analytes in HPLC (n = 5 × 3 days).
| Classification | Analyte | Nominal Concentration (mg/L) | Experimental Concentration (mg/L) | Accuracy (%) | Inter-Day RSD (%) |
|---|---|---|---|---|---|
| monomeric acid | Citric acid | 25 | 26.52684 | 106.11 | 2.6 |
| 2000 | 2027.8462 | 101.39 | 1.2 | ||
| 5000 | 5031.78212 | 100.64 | 5.8 | ||
| Tartaric acid | 25 | 27.75632 | 111.03 | 5.1 | |
| 2000 | 2003.57492 | 100.18 | 1.4 | ||
| 5000 | 5011.72649 | 100.23 | 1.8 | ||
| Malic acid | 25 | 25.97321 | 103.89 | 1.9 | |
| 2000 | 2011.75643 | 100.59 | 1.6 | ||
| 5000 | 5034.83629 | 100.70 | 2.6 | ||
| Lactic acid | 25 | 23.84759 | 95.39 | 2.9 | |
| 2000 | 2112.85740 | 105.64 | 1.3 | ||
| 5000 | 5028.84641 | 100.58 | 2.8 | ||
| monomeric anthocyanins | Delphinidin 3-O-glucoside | 50 | 52.38259 | 104.77 | 1.6 |
| 100 | 113.847332 | 113.85 | 4.6 | ||
| 200 | 213.14551 | 106.57 | 3.3 | ||
| Cyanidin 3-O-glucoside | 50 | 49.76257 | 99.53 | 1.6 | |
| 100 | 99.47242 | 99.47 | 2.1 | ||
| 200 | 211.27496 | 105.64 | 3.6 | ||
| Peonidin 3-O-(6-O-acetyl)-glucoside | 50 | 50.72618 | 101.45 | 5.5 | |
| 100 | 105.27963 | 105.28 | 4.5 | ||
| 200 | 214.85760 | 107.43 | 1.3 | ||
| Trans-Malavidin 3-O-(6-O-p-coumaryl)-glucoside | 50 | 53.46362 | 106.93 | 2 | |
| 100 | 111.84736 | 111.85 | 4.2 | ||
| 200 | 217.36583 | 108.68 | 1.4 |
Table A4.
Identification and quantification of the aroma substances in wines by GC-MS.
Table A4.
Identification and quantification of the aroma substances in wines by GC-MS.
| Analytes | Slope | Intercept | R2 | Linear Range (μg/L) | LOD (μg/L) | LOQ (μg/L) |
|---|---|---|---|---|---|---|
| Ethyl Acetate | 28.72183151 | 62.00349364 | 0.9982 | 40–2560 | 8.75 | 29.15 |
| Isoamyl butyrate | 2.613956182 | 1.088799909 | 0.9975 | 10–640 | 2.57 | 8.58 |
| Hexanal | 0.436330304 | −1.207429816 | 0.9676 | 10–640 | 1.45 | 4.82 |
| Isoamyl acetate | 4.155747184 | 1.462047996 | 0.9662 | 10–640 | 1.54 | 5.15 |
| 1-Butanol | 11.40063854 | −5.143623509 | 0.9887 | 10–640 | 2.33 | 7.75 |
| β-Myrcene | 6.572226779 | −17.0888405 | 0.9960 | 10–640 | 1.81 | 6.05 |
| α-Phellandrene | 9.442930665 | −26.30715237 | 0.9629 | 10–640 | 2.56 | 8.52 |
| N-Butylcyanoacrylate | 10.56113161 | −9.232903773 | 0.9987 | 10–640 | 1.18 | 3.94 |
| Heptanal | 1.151034172 | 1.100261694 | 0.9735 | 10–640 | 0.63 | 2.11 |
| Isoamylol | 17.71006127 | 21.10712124 | 0.9984 | 10–640 | 2.04 | 6.79 |
| D-Limonene | 7.204079185 | −21.86312826 | 0.9913 | 10–640 | 1.19 | 3.98 |
| Cyclohexane | 0.219620016 | −0.059722789 | 0.9994 | 10–640 | 2.03 | 6.76 |
| Ethyl hexanoate | 10.16370793 | −14.52095964 | 0.9968 | 10–640 | 0.93 | 3.10 |
| Trans-2-hexenal | 1.046898853 | 0.30991204 | 0.9834 | 40–2560 | 11.45 | 38.15 |
| 1-Pentanol | 14.7852144 | 34.19925809 | 0.9970 | 10–640 | 1.34 | 4.47 |
| Hexyl acetate | 14.56991054 | −24.89606421 | 0.9926 | 10–640 | 1.46 | 4.85 |
| 2-Methylpyrazine | 0.311363247 | −0.74984534 | 0.9922 | 10–640 | 2.53 | 8.43 |
| p-Cymene | 58.89797178 | −212.7311277 | 0.9793 | 10–640 | 0.70 | 2.32 |
| Octanal | 4.16177065 | −5.398980123 | 0.9967 | 10–640 | 1.03 | 3.44 |
| 4-methyl-1-Pentanol | 0.419100708 | 0.577058889 | 0.9983 | 10–640 | 1.02 | 3.40 |
| Rose oxide | 3.903584057 | −4.250962621 | 0.9992 | 10–640 | 2.23 | 7.43 |
| 3-Hexen-1-ol | 3.822934789 | 0.456569239 | 0.9968 | 10–640 | 2.39 | 7.97 |
| Methyl octanoate | 30.2867111 | −83.05918065 | 0.9865 | 10–640 | 1.06 | 3.52 |
| Nonanal | 0.386707404 | −0.213751205 | 0.9805 | 10–640 | 1.85 | 6.16 |
| L-2-Octanol | 8.790893425 | −1.523211236 | 0.9993 | 10–640 | 0.63 | 2.11 |
| 2-Hexen-1-ol | 0.412279263 | 0.2052193 | 0.9989 | 10–640 | 2.86 | 9.52 |
| 2,4-Hexadienal | 2.05764212 | −5.047953032 | 0.9917 | 10–640 | 1.89 | 6.29 |
| Ethyl octanoate | 31.6049875 | −76.32695657 | 0.9958 | 10–640 | 1.68 | 5.59 |
| 1-Octen-3-ol | 3.92985586 | −0.43694163 | 0.9993 | 10–640 | 2.43 | 8.11 |
| Trans-2-Octenal | 5.399814874 | −12.28942574 | 0.9632 | 10–640 | 1.57 | 5.25 |
| 2-ethyl-1-Hexanol | 7.239032142 | 0.288917864 | 0.9984 | 10–640 | 1.22 | 4.06 |
| 2,4-Heptadienal | 3.061586702 | −3.41682021 | 0.9810 | 10–640 | 2.59 | 8.64 |
| Linalool | 3.783849513 | 1.657317641 | 0.9971 | 10–640 | 1.66 | 5.53 |
| 1-Octanol | 3.118756623 | −0.756687716 | 0.9993 | 10–640 | 1.21 | 4.03 |
| Benzaldehyde | 1.895352935 | −2.105297775 | 0.9802 | 10–640 | 1.26 | 4.21 |
| Terpinen-4-ol | 5.726504728 | −6.427456867 | 0.9989 | 10–640 | 1.71 | 5.70 |
| Caryophyllene | 2.013767812 | −5.172038446 | 0.9752 | 10–640 | 0.99 | 3.31 |
| Methyl benzoate | 12.64967674 | −24.52210362 | 0.9847 | 10–640 | 2.38 | 7.92 |
| 1-Nonanol | 3.114660168 | −0.8959524 | 0.9983 | 10–640 | 1.48 | 4.92 |
| Diethyl succinate | 0.763965233 | −1.098857307 | 0.9928 | 10–640 | 0.61 | 2.03 |
| Acetophenone | 3.091659261 | −3.12824877 | 0.9841 | 10–640 | 2.68 | 8.92 |
| α-Terpineol | 1.622010745 | −1.599972206 | 0.9985 | 10–640 | 1.96 | 6.52 |
| 2,4-Nonadienal | 2.495226599 | −5.063519669 | 0.9748 | 10–640 | 0.84 | 2.79 |
| Citronellol | 1.370939903 | 2.953547874 | 0.9874 | 10–640 | 2.92 | 9.73 |
| Carvone | 2.879921772 | −1.487297138 | 0.9909 | 10–640 | 1.63 | 5.45 |
| Cis-Geraniol | 1.245606067 | 2.80258494 | 0.9888 | 10–640 | 1.83 | 6.10 |
| Methyl salicylate | 4.257560496 | −8.562719577 | 0.9833 | 10–640 | 0.47 | 1.57 |
| Geraniol | 1.324735886 | 3.059142902 | 0.9904 | 10–640 | 2.63 | 8.75 |
| β-Damascenone | 9.313942676 | −0.898309756 | 0.9853 | 10–640 | 0.83 | 2.78 |
| Phenylethyl Alcohol | 23.44536421 | 239.789585 | 0.9860 | 10–640 | 2.19 | 7.28 |
| Trans-β-Ionone | 6.394218207 | −4.391426416 | 0.9999 | 10–640 | 1.59 | 5.29 |
| Perilla alcohol | 0.094982029 | −0.063624483 | 0.9978 | 10–640 | 2.10 | 6.99 |
Table A5.
Inter-day repeatability of partial analytes in GC-MS (n = 5 × 3 days).
Table A5.
Inter-day repeatability of partial analytes in GC-MS (n = 5 × 3 days).
| Analyte | Nominal Concentration (μg/L) | Experimental Concentration (μg/L) | Accuracy (%) | Inter-Day RSD (%) |
|---|---|---|---|---|
| 1-Butanol | 10 | 11.201 | 112.01 | 3.60 |
| 320 | 315.039 | 98.45 | 3.10 | |
| 640 | 625.127 | 97.68 | 4.00 | |
| 3-Hexen-1-ol | 10 | 9.152 | 91.52 | 3.20 |
| 320 | 318.125 | 99.41 | 1.70 | |
| 640 | 633.099 | 98.92 | 2.00 | |
| β-Damascenone | 10 | 8.606 | 86.06 | 1.90 |
| 320 | 345.787 | 108.06 | 4.10 | |
| 640 | 656.559 | 102.59 | 4.60 | |
| 1-Octen-3-ol | 10 | 10.467 | 104.67 | 3.60 |
| 320 | 322.456 | 100.77 | 6.50 | |
| 640 | 627.467 | 98.04 | 3.50 | |
| Linalool | 10 | 8.753 | 87.53 | 8.86 |
| 320 | 316.846 | 99.01 | 2.60 | |
| 640 | 623.375 | 97.40 | 7.09 | |
| Phenylethyl Alcohol | 10 | 9.430 | 94.30 | 2.66 |
| 320 | 312.561 | 97.68 | 9.97 | |
| 640 | 618.452 | 96.63 | 9.85 | |
| Hexyl acetate | 10 | 9.746 | 97.46 | 1.53 |
| 320 | 310.376 | 96.99 | 0.70 | |
| 640 | 631.725 | 98.71 | 7.56 | |
| Hexanal | 10 | 11.568 | 115.68 | 7.52 |
| 320 | 305.314 | 95.41 | 8.45 | |
| 640 | 658.452 | 102.88 | 5.99 | |
| Trans-2-hexenal | 10 | 10.957 | 109.57 | 3.03 |
| 320 | 329.857 | 103.08 | 6.43 | |
| 640 | 628.471 | 98.20 | 6.39 | |
| D-Limonene | 10 | 9.672 | 96.72 | 8.90 |
| 320 | 311.784 | 97.43 | 1.54 | |
| 640 | 619.32 | 96.77 | 2.21 |
Appendix B

Figure A1.
The tandem repeat insertions in the promoter region of VvMYBA1 for different teinturier grape cultivars. (a) The grape cluster of nine kinds of teinturier grapes; (b) PCR result of the teinturier varieties of DNA prepared from leaves.
References
- Tian, M.B.; Yuan, L.; Zheng, M.Y.; Xi, Z.M. Differences in Anthocyanin Accumulation Profiles between Teinturier and Non-Teinturier Cultivars during Ripening. Foods 2021, 10, 1073. [Google Scholar] [CrossRef]
- László, K.; Szilárd, M.; Péter, T.; Ágnes, D.; Erika, M.; Reinhard, T.; Tamás, M.; Éva, S.; Franco, R. Comparative Study on Grape Berry Anthocyanins of Various Teinturier Varieties. Foods 2022, 11, 3668. [Google Scholar] [CrossRef]
- Kui, L.-W.; Karen, B.; Karryn, G.; Anne, K.; Sakuntala, K.; Tony, M.; Richard, E.; Roger, H.; Andrew, A. An R2R3 MYB transcription factor associated with regulation of the anthocyanin biosynthetic pathway in Rosaceae. BMC Plant Biol. 2010, 10, 50. [Google Scholar] [CrossRef] [PubMed]
- Jin, W.; Wang, H.; Li, M.; Wang, J.; Yang, Y.; Zhang, X.; Yan, G.; Zhang, H.; Liu, J.; Zhang, K. The R2R3 MYB transcription factor PavMYB10.1 involves in anthocyanin biosynthesis and determines fruit skin colour in sweet cherry (Prunus avium L.). Plant Biotechnol. J. 2016, 14, 2120–2133. [Google Scholar] [CrossRef] [PubMed]
- Wang, Q.; Zheng, H.; Gao, S.; Li, H.; Tao, J. Transcriptomic analysis of berry development and a corresponding analysis of anthocyanin biosynthesis in teinturier grape. J. Plant Interact. 2019, 14, 617–629. [Google Scholar] [CrossRef]
- Li, H.; Yang, Y.; Wang, Q.; Li, H.; Wang, W.; Zheng, H.; Tao, J. Genome-Wide Identification of ATP-Binding Cassette (ABC) Transporter Provides Insight to Genes Related to Anthocyanin Transportation in New Teinturier Grape Germplasm ‘ZhongShan-HongYu’. Horticulturae 2023, 9, 532. [Google Scholar] [CrossRef]
- Bonada, M.; Jeffery, D.W.; Petrie, P.R.; Moran, M.A.; Sadras, V.O. Impact of elevated temperature and water deficit on the chemical and sensory profiles of B arossa S hiraz grapes and wines. Aust. J. Grape Wine Res. 2015, 21, 240–253. [Google Scholar] [CrossRef]
- Campbell, J.R.; Scholasch, T.; Waterhouse, A.L.; Kennedy, J.A. Napa Valley Cabernet Sauvignon Proanthocyanidin Changes During Fruit Ripening: A Multi-Appellation Survey. J. Agric. Food Chem. 2024, 72, 13561–13570. [Google Scholar] [CrossRef]
- Gao, X.T.; Wu, M.H.; Sun, D.; Li, H.Q.; Chen, W.K.; Yang, H.Y.; Liu, F.Q.; Wang, Q.C.; Wang, Y.Y.; Wang, J.; et al. Effects of gibberellic acid (GA3) application before anthesis on rachis elongation and berry quality and aroma and flavour compounds in Vitis vinifera L. ‘Cabernet Franc’ and ‘Cabernet Sauvignon’ grapes. J. Sci. Food Agric. 2020, 100, 3729–3740. [Google Scholar] [CrossRef]
- Bai, X.; Dai, B.; Liu, X.; Yang, H.; Wu, Y.; Li, Y.; Tao, Y. Design and implementation of popular quality analysis system for dry red wines originating from Northwest China. Int. J. Food Sci. Technol. 2024, 59, 3478–3490. [Google Scholar] [CrossRef]
- Rouxinol, M.I.; Martins, M.R.; Barroso, J.M.; Rato, A.E. Wine Grapes Ripening: A Review on Climate Effect and Analytical Approach to Increase Wine Quality. Appl. Biosci. 2023, 2, 347–372. [Google Scholar] [CrossRef]
- Soubeyrand, E.; Basteau, C.; Hilbert, G.; van Leeuwen, C.; Delrot, S.; Gomès, E. Nitrogen supply affects anthocyanin biosynthetic and regulatory genes in grapevine cv. Cabernet-Sauvignon berries. Phytochemistry 2014, 103, 38–49. [Google Scholar] [CrossRef] [PubMed]
- Duan, B.; Mei, Y.; Chen, G.; Su-Zhou, C.; Li, Y.; Merkeryan, H.; Cui, P.; Liu, W.; Liu, X. Deficit irrigation and leaf removal modulate anthocyanin and proanthocyanidin repartitioning of Cabernet Sauvignon (Vitis vinifera L.) grape and resulting wine profile. J. Sci. Food Agric. 2021, 102, 2937–2949. [Google Scholar] [CrossRef]
- Ju, Y.; Yang, B.; He, S.; Tu, T.; Min, Z.; Fang, Y.; Sun, X. Anthocyanin accumulation and biosynthesis are modulated by regulated deficit irrigation in Cabernet Sauvignon (Vitis Vinifera L.) grapes and wines. Plant Physiol. Biochem. 2019, 135, 469–479. [Google Scholar] [CrossRef]
- Guo, S.H.; Yang, B.H.; Wang, X.W.; Li, J.N.; Li, S.; Yang, X.; Ren, R.H.; Fang, Y.L.; Xu, T.F.; Zhang, Z.W.; et al. ABA signaling plays a key role in regulated deficit irrigation-driven anthocyanins accumulation in ‘Cabernet Sauvignon’ grape berries. Environ. Exp. Bot. 2021, 181, 104290. [Google Scholar] [CrossRef]
- Yue, X.; Zhao, Y.; Ma, X.; Jiao, X.; Fang, Y.; Zhang, Z.; Ju, Y. Effects of leaf removal on the accumulation of anthocyanins and the expression of anthocyanin biosynthetic genes in Cabernet Sauvignon (Vitis vinifera L.) grapes. J. Sci. Food Agric. 2020, 101, 3214–3224. [Google Scholar] [CrossRef] [PubMed]
- Wang, Y.C.; Wang, N.; Xu, H.F.; Jiang, S.H.; Fang, H.C.; Su, M.Y.; Zhang, Z.Y.; Zhang, T.L.; Chen, X.S. Auxin regulates anthocyanin biosynthesis through the Aux/IAA–ARF signaling pathway in apple. Hortic. Res. 2018, 5, 59. [Google Scholar] [CrossRef] [PubMed]
- Zhe, L.; Jalal, A.G. Hormonal regulation of anthocyanin biosynthesis for improved stress tolerance in plants. Plant Physiol. Biochem. PPB 2023, 201, 107835. [Google Scholar] [CrossRef]
- Liu, Z.; Zhu, C.; Sun, J.; Zhang, Z.J.; Zhao, S.; Shi, W.; Wang, W.; Zhao, B. Influence of rootstock on endogenous hormones and color change in Cabernet Sauvignon grapes. Sci. Rep. 2023, 13, 6608. [Google Scholar] [CrossRef]
- Röckel, F.; Moock, C.; Braun, U.; Schwander, F.; Cousins, P.; Maul, E.; Töpfer, R.; Hausmann, L. Color Intensity of the Red-Fleshed Berry Phenotype of Vitis vinifera Teinturier Grapes Varies Due to a 408 bp Duplication in the Promoter of VvmybA1. Genes 2020, 11, 891. [Google Scholar] [CrossRef]
- Zhang, K.; Du, M.; Zhang, H.; Zhang, X.; Cao, S.; Wang, X.; Wang, W.; Guan, X.; Zhou, P.; Li, J.; et al. The haplotype-resolved T2T genome of teinturier cultivar Yan73 reveals the genetic basis of anthocyanin biosynthesis in grapes. Hortic. Res. 2023, 10, uhad205. [Google Scholar] [CrossRef]
- Ju, Y.; Yang, L.; Yue, X.; Li, Y.; He, R.; Deng, S.; Yang, X.; Fang, Y. Anthocyanin profiles and color properties of red wines made from Vitis davidii and Vitis vinifera grapes. Food Sci. Hum. Wellness 2021, 10, 335–344. [Google Scholar] [CrossRef]
- Ding, W.; Tu, Q.; Xi, X.; Wu, X.; Bai, J.; Liu, S.; Li, J.; Yuan, C. Effects of X-ray and electron beam irradiation on wine quality: Emphasizing phenolic compounds and aroma profiles. Food Chem. X 2025, 25, 102124. [Google Scholar] [CrossRef]
- Yue, X.; Shi, P.; Tang, Y.; Zhang, H.; Ma, X.; Ju, Y.; Zhang, Z. Effects of methyl jasmonate on the monoterpenes of Muscat Hamburg grapes and wine. J. Sci. Food Agric. 2020, 101, 3665–3675. [Google Scholar] [CrossRef]
- Wang, L.; Lu, H.; Pang, Y.; Yin, Y.; Jia, H. Effect of different bagging treatments on fruit quality in Gengcunyangtao. J. Zhejiang Agric. Sci. 2023, 64, 1740–1744. (In Chinese) [Google Scholar] [CrossRef]
- Zhao, Z. Effect of Bagging and Spraying KH2PO4 on Fruit Quality of ‘Sunshine Rose’ Grape in Shihezi Area. Master’s Thesis, Shihezi University, Shihezi, China, 2023. (In Chinese) [Google Scholar]
- Li, Y.; Han, F.; Zhang, Y.; Wang, H. Visualization for Representation of Red Wine Color Based on CIELAB Color Space. Trans. Chin. Soc. Agric. Mach. 2017, 48, 296–301. (In Chinese) [Google Scholar] [CrossRef]
- Pati, S.; Crupi, P.; Savastano, M.L.; Benucci, I.; Esti, M. Evolution of phenolic and volatile compounds during bottle storage of a white wine without added sulfite. J. Sci. Food Agric. 2020, 100, 775–784. [Google Scholar] [CrossRef]
- Cao, Y.; Geng, Y.; Han, N.; Wang, Z.; Wang, X.; Sun, Z. Research on Organic Acids in Fruit Wine and Acid Reduction Strategies. Sci. Technol. Food Ind. 2023, 44, 457–464. (In Chinese) [Google Scholar] [CrossRef]
- GB/T 15037-2006; National Technical Committee 64 on Food Industry of Standardization Administration of China. Wines. General Administration of Quality Supervision, Inspection and Quarantine of the People’s Republic of China, Standardization Administration of the People’s Republic of China: Beijing, China, 2006.
- Wang, Z.; Huang, Y.; Yang, M.; Shang, H.; Lan, Y.; Shi, Y.; Duan, C.; Qi, M. Analysis of phenolic and sensory characteristics of red wines under different terroir conditions in the eastern foothills of Helan mountains. China Brew. 2024, 43, 32–42. (In Chinese) [Google Scholar] [CrossRef]
- Zhang, S. Study on Brewing Characteristics and AgingPotential of Characteristic Red GrapeVarieties in Yantai Area. Master Thesis, Yantai University, Yantai, China, 2023. (In Chinese) [Google Scholar]
- Monteiro, G.C.; Minatel, I.O.; Junior, A.P.; Gomez-Gomez, H.A.; Camargo, J.P.C.d.; Diamante, M.S.; Basílio, L.S.P.; Tecchio, M.A.; Lima, G.P.P. Bioactive compounds and antioxidant capacity of grape pomace flours. LWT 2021, 135, 110053. [Google Scholar] [CrossRef]
- Larissa, D.V.; Giulio, F.; Francesca, G.; Alessandra, A.; Marina, C.; Paolo, M.; Giancarlo, A.; Giovanna, B. Liquid Chromatography–High-Resolution Mass Spectrometry (LC-HRMS) Profiling of Commercial Enocianina and Evaluation of Their Antioxidant and Anti-Inflammatory Activity. Antioxidants 2022, 11, 1187. [Google Scholar] [CrossRef]
- Delić, K.; Milinčić, D.D.; Pešić, M.B.; Lević, S.; Nedović, V.A.; Gancel, A.L.; Jourdes, M.; Teissedre, P.L. Grape, wine and pomace anthocyanins: Winemaking biochemical transformations, application and potential benefits. Oeno One 2024, 58. [Google Scholar] [CrossRef]
- Xie, S.; Qiao, X.; Chen, H.; Nan, H.; Zhang, Z. Coordinated Regulation of Grape Berry Flesh Color by Transcriptional Activators and Repressors. J. Agric. Food Chem. 2019, 67, 11815–11824. [Google Scholar] [CrossRef]
- Lu, R.; Song, M.; Wang, Z.; Zhai, Y.; Hu, C.; Avihai, P.; Ma, H. Independent flavonoid and anthocyanin biosynthesis in the flesh of a red-fleshed table grape revealed by metabolome and transcriptome co-analysis. BMC Plant Biol. 2023, 23, 361. [Google Scholar] [CrossRef]
- Yang, Y.; Li, H.; Li, H.; Zheng, H.; Tao, J. Transcriptome analysis reveals the mechanism of ‘ZhongShan-HongYu’ grape anthocyanin accumulation. Sci. Hortic. 2023, 321, 112331. [Google Scholar] [CrossRef]
- Li, R.; Yang, D.; Li, Z.; Tang, X.; Zhong, K.; Ding, Y.; Han, X.; Guan, X.; Sun, Y. The effect of stem contact fermentation on the quality of Cabernet Sauvignon and Merlot wines from Yantai, China. Food Biosci. 2025, 64, 105872. [Google Scholar] [CrossRef]
- Zhu, L.; Huang, Y.; Zhang, Y.; Xu, C.; Lu, J.; Wang, Y. The growing season impacts the accumulation and composition of flavonoids in grape skins in two-crop-a-year viticulture. J. Food Sci. Technol. 2017, 54, 2861–2870. [Google Scholar] [CrossRef] [PubMed]
- Li, H.; Gao, X.; Wang, Y.; Lu, H.; Tian, M.; Duan, C.; Wang, J. Artificial shading of teinturier grape Kolor clusters reveals light-responsive biomarkers: Focus on flavonoid profiles and metabolism. Front. Plant Sci. 2024, 15, 1356799. [Google Scholar] [CrossRef]
- Li, H.; Bai, Y.; Yang, Y.; Zheng, H.; Xu, X.; Li, H.; Wang, W.; Tao, J. Transcriptomic analyses reveal light-regulated anthocyanin accumulation in ‘ZhongShan-HongYu’ grape berries. Sci. Hortic. 2023, 309, 111669. [Google Scholar] [CrossRef]
- Wu, L.; Fan, S.; Zhang, Y.; Li, Y. Correlation between Anthocyanins and Color of Aging Red Wines from Different Regions of China. Sino-Overseas Grapevine Wine 2022, 1–7. (In Chinese) [Google Scholar] [CrossRef]
- Lu, L.; Yang, Y.; Zhong, G.Y.; Liang, Z.; Cheng, L. Phytochemical Composition and Content of Red-Fleshed Grape Accessions. Horticulturae 2023, 9, 579. [Google Scholar] [CrossRef]
- Chen, Q.; Li, Y.; Xu, H.; Liu, X.; Luo, J. Nutritional Quality Differences Between European and Hybrid Grapes. J. Trop. Biol. 2023, 14, 521–529. (In Chinese) [Google Scholar] [CrossRef]
- Xia, L.; Xu, C.; Huang, K.; Lu, J.; Zhang, Y. Evaluation of phenolic compounds, antioxidant and antiproliferative activities of 31 grape cultivars with different genotypes. J. Food Biochem. 2019, 43, e12626. [Google Scholar] [CrossRef]
- Liu, S. Differenced Study of Berry Anthocyanin Accumulation between Vitis Vinifera and Hybrid of Vitis vinifera × Vitis amurensis in Red Wine Grapes. Master’s Thesis, Ningxia University, Yinchuan, China, 2020. (In Chinese) [Google Scholar]
- Casassa, L.F.; Fanzone, M.L.; Sari, S.E. Comparative phenolic, chromatic, and sensory composition of five monovarietal wines processed with microwave technology. Heliyon 2022, 8, e12332. [Google Scholar] [CrossRef] [PubMed]
- Li, Y.; He, H.; Cao, Y.; Zeng, Q.; Zhang, Z. Analysis of anthocyanin composition in different red grape varieties and wine from the eastern foot of Helan Mountain. China Brew. 2024, 43, 47–52. (In Chinese) [Google Scholar] [CrossRef]
- Oliveira, J.B.D.; Laureano, O.; Castro, R.; Pereira, G.E.; Ricardo-Da-Silva, J.M. Rootstock and harvest season affect the chemical composition and sensory analysis of grapes and wines of the Alicante Bouschet (Vitis vinifera L.) grown in a tropical semi-arid climate in Brazil. Oeno One 2020, 54, 1021–1039. [Google Scholar] [CrossRef]
Disclaimer/Publisher’s Note: The statements, opinions and data contained in all publications are solely those of the individual author(s) and contributor(s) and not of MDPI and/or the editor(s). MDPI and/or the editor(s) disclaim responsibility for any injury to people or property resulting from any ideas, methods, instructions or products referred to in the content. |
© 2026 by the authors. Licensee MDPI, Basel, Switzerland. This article is an open access article distributed under the terms and conditions of the Creative Commons Attribution (CC BY) license.