Author Contributions
Conceptualization, S.L.D., J.J.B., and J.T.S.; methodology, S.L.D.; validation, S.L.D., R.J.B.-C., N.E.G., and X.M.C.; formal analysis, S.L.D.; investigation, S.L.D., R.J.B.-C., and N.E.G.; resources, J.T.S.; data curation, S.L.D. and J.T.S.; writing—original draft preparation, S.L.D.; writing—review and editing, S.L.D., R.J.B.-C., N.E.G., X.M.C., J.J.B., D.R.M., S.P.R., and J.T.S.; supervision, J.T.S., project administration, J.T.S.; funding acquisition, J.T.S. All authors have read and agreed to the published version of the manuscript.
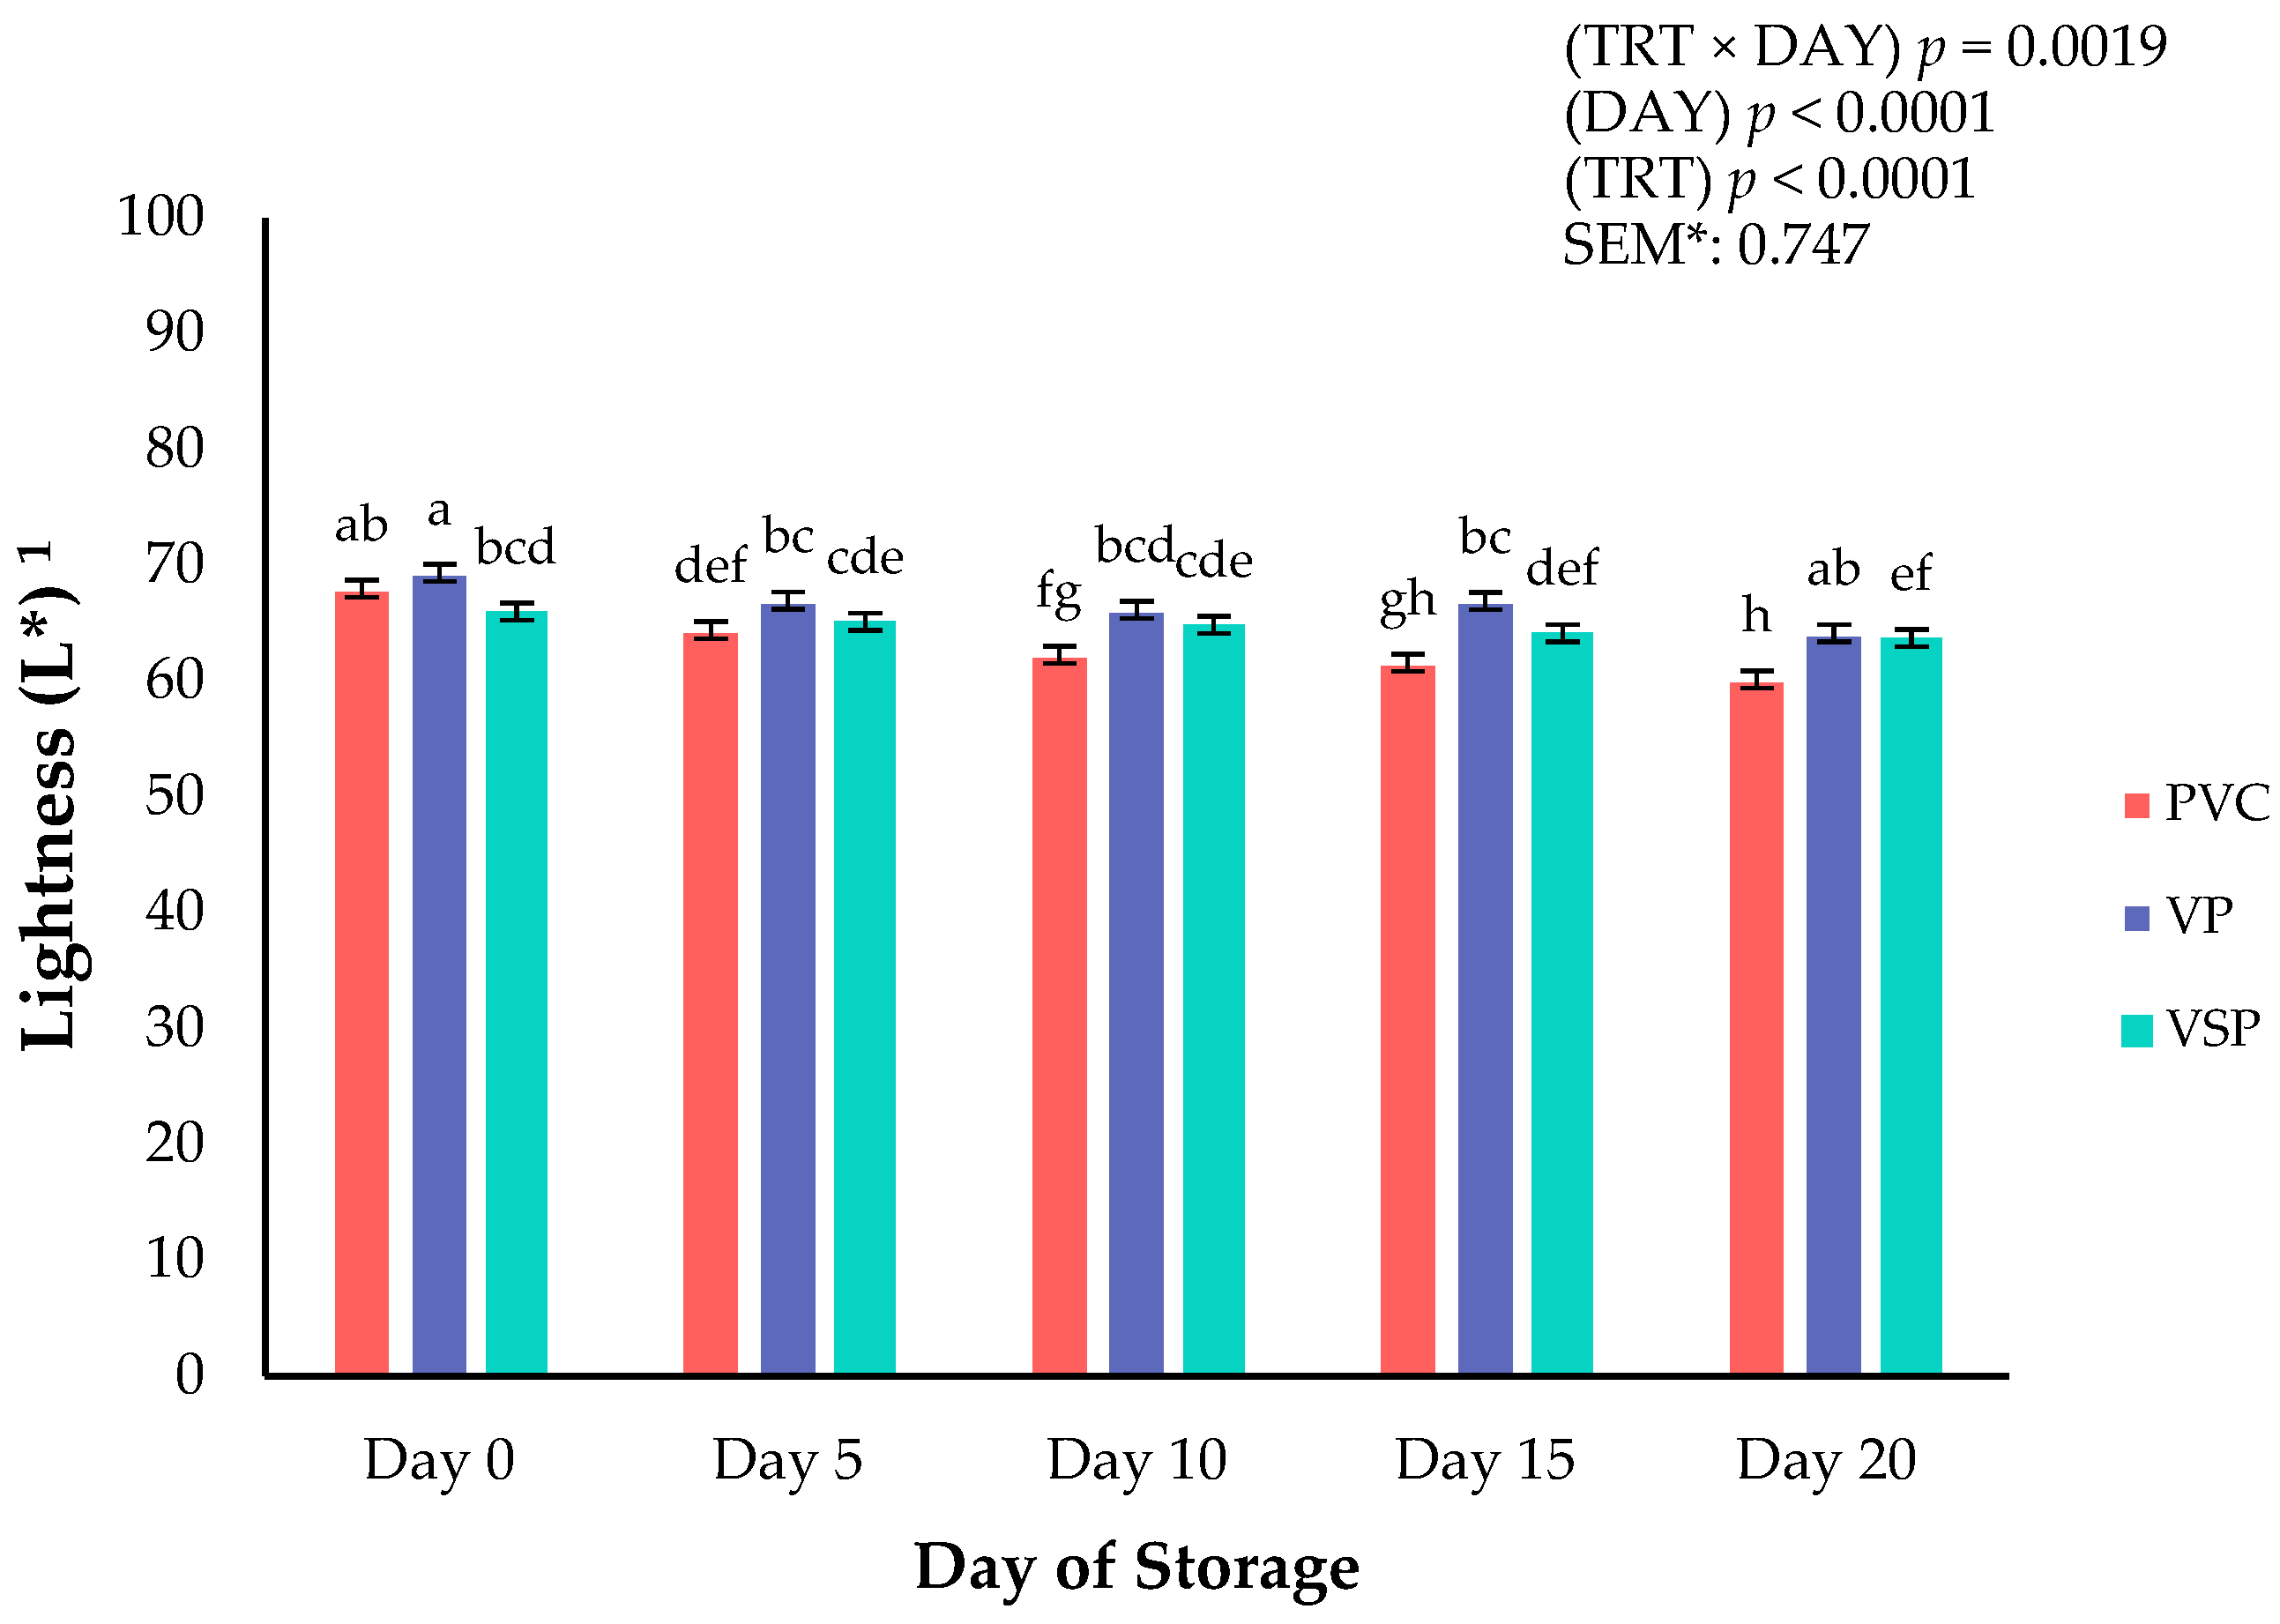
Figure 1.
Interaction of packaging treatment × day of storage for surface lightness (L*) on boneless–skinless chicken breast. a–h Means lacking common superscripts differ (p < 0.05). * SEM, standard error of the mean. Lightness (L*) values are a measure of darkness to lightness where 100 is white, and 0 is black. Packaging treatment (N = 10/treatment): PVC—10 μm polyvinyl chloride. OTR: 14,000 mL/m/24 h. VTR: 30 g/m/24 h. VP—forming: 175 μm nylon/EVOH/enhanced polyethylene coextrusion. OTR: 0.4 ML/m/24 h. VTR: 3.3 g/m/24 h. VP—non-forming: 65 μm nylon/polyolefin plastomer coextrusion. OTR: 53.0 mL/m/24 h. VTR: 6.5 g/m/24 h. VSP—forming: 350 μm polyester/EVOH/polyethylene coextrusion. OTR: 1.8 mL/m/24 h. VTR: 2.8 g/m/24 h. VSP—non-forming: 127 μ PE/EVOH/LLDPE. OTR: 0.8 mL/m/24 h. VTR: 0.4 g/m/24 h.
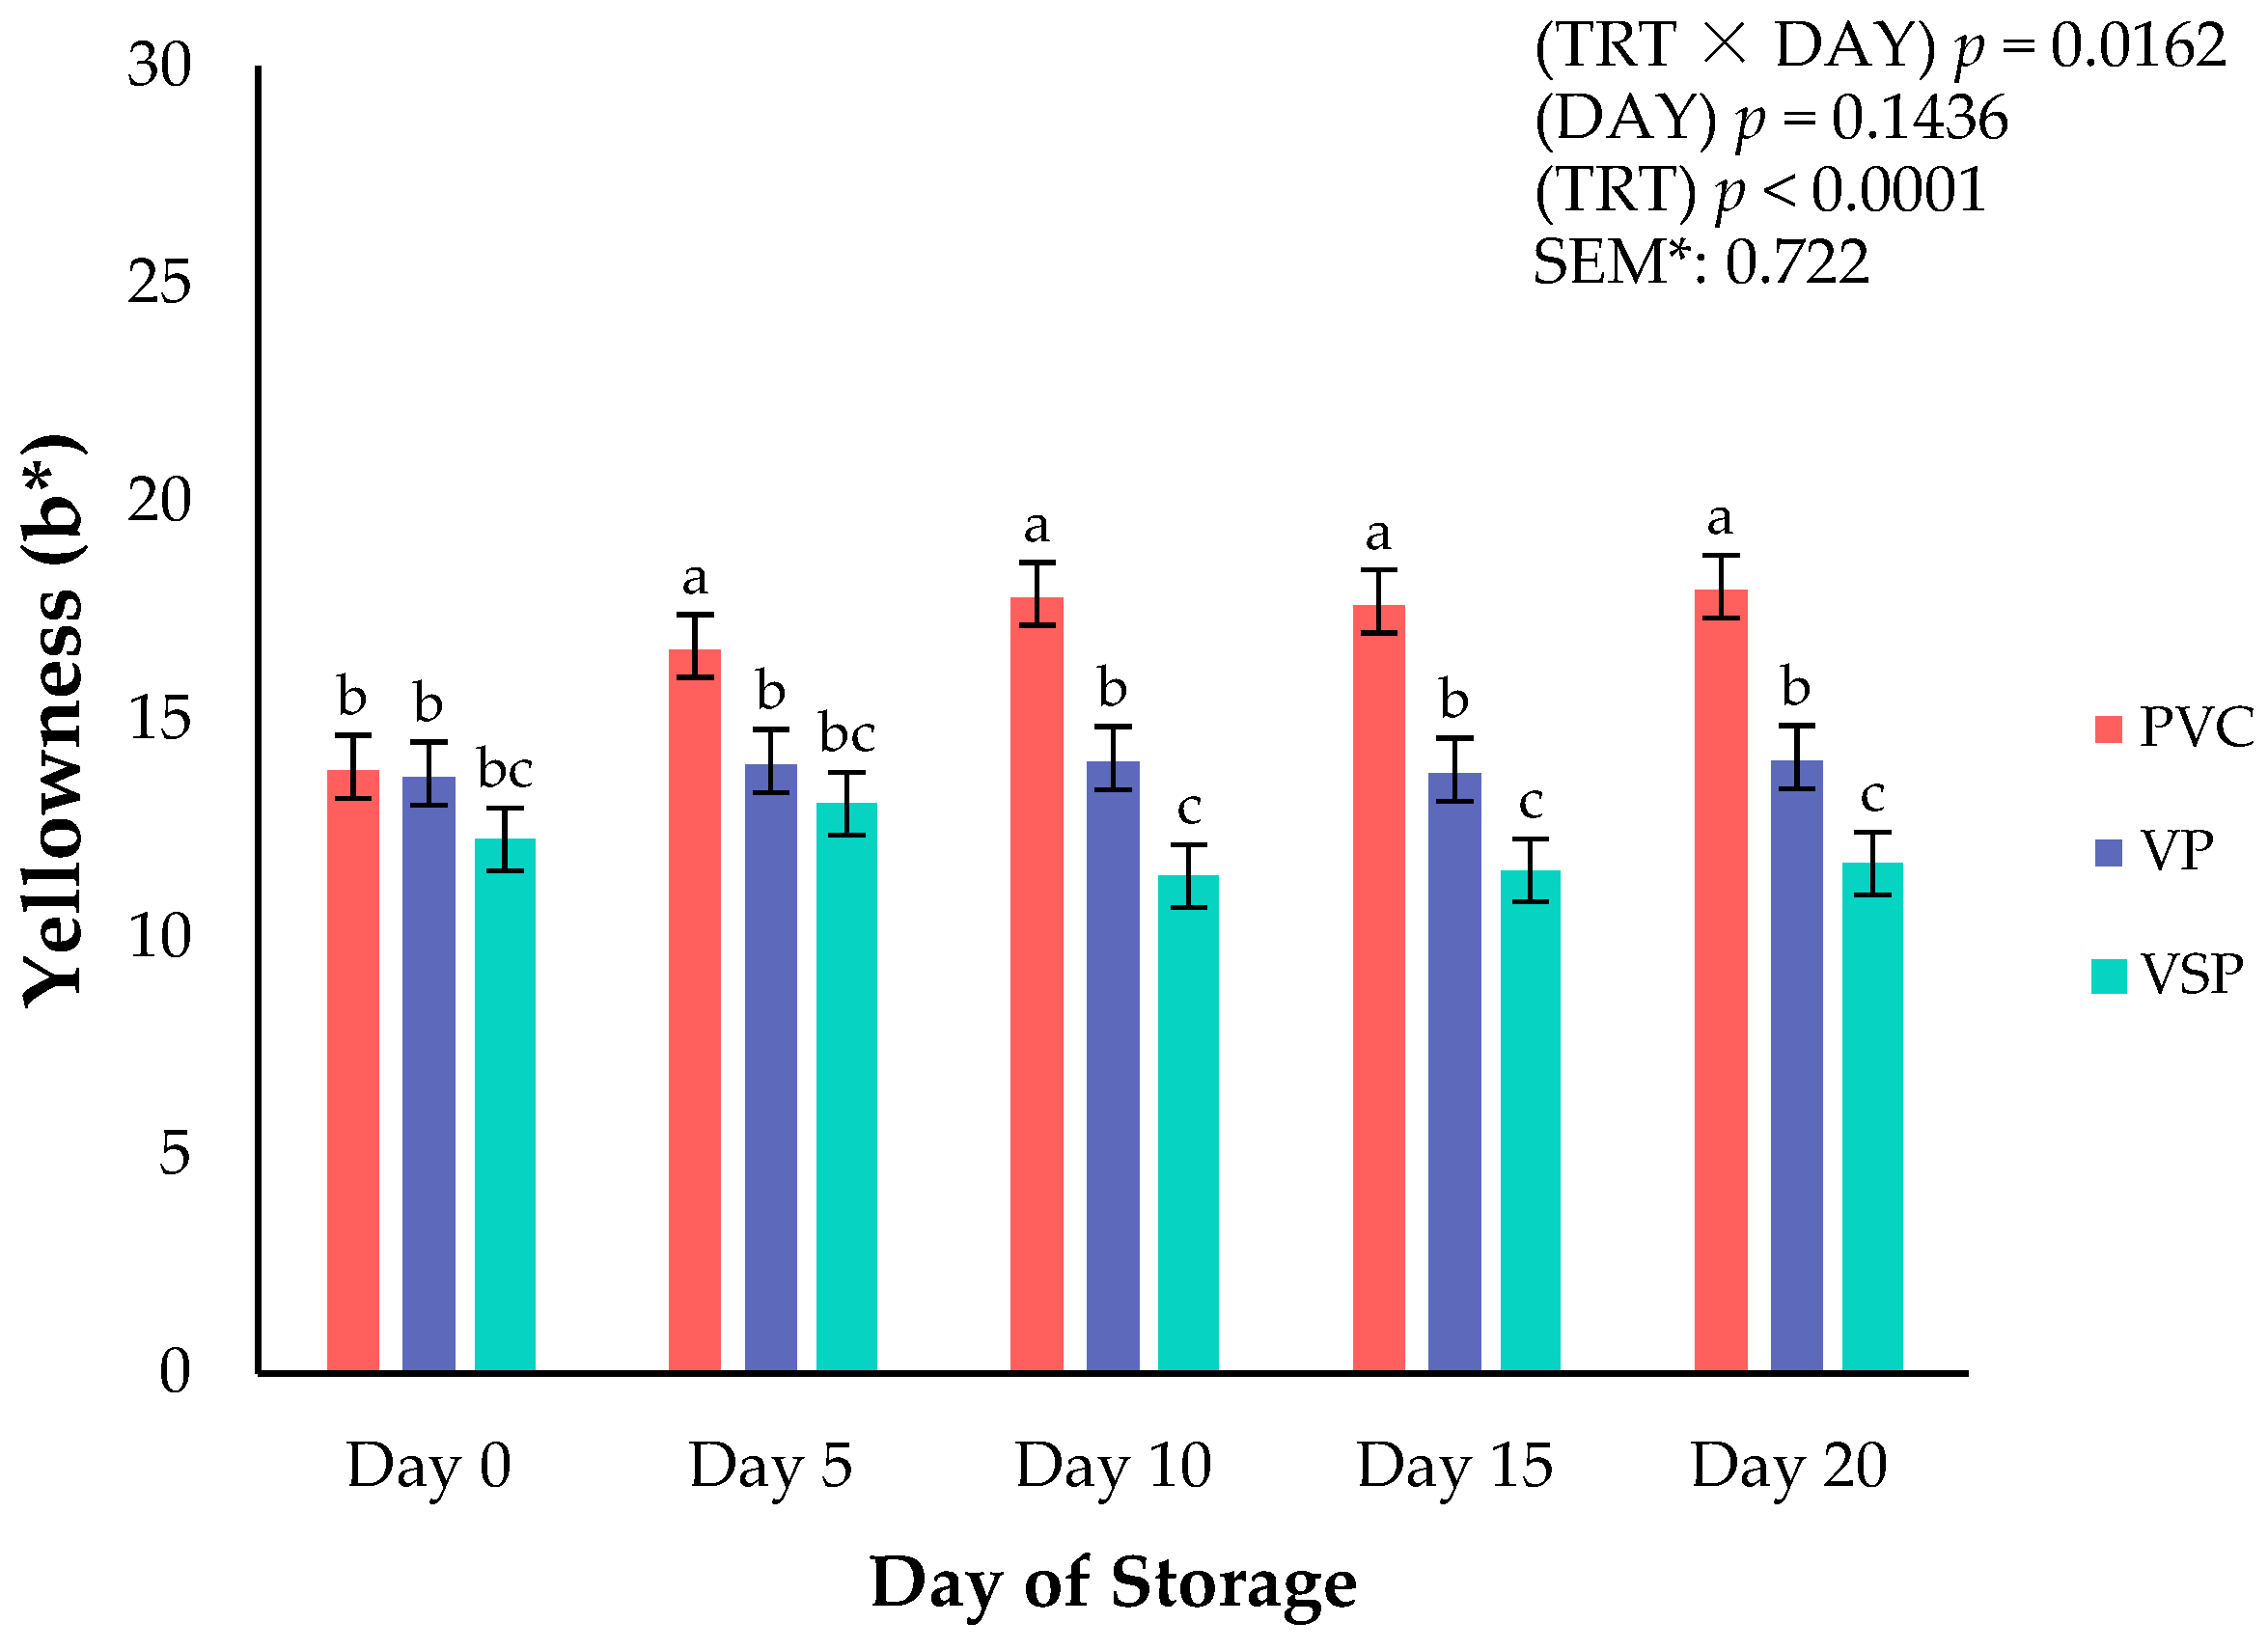
Figure 2.
Interaction of packaging treatment × day of storage for surface yellowness (b*) on boneless–skinless chicken breast. a–c Means lacking common superscripts differ (p < 0.05). * SEM, standard error of the mean. Yellowness (b*)—a larger value indicates a more yellow color, where +60 is yellow and −60 is blue. Packaging treatment (N = 10/Treatment): PVC—10 μm polyvinyl chloride. OTR: 14,000 mL/m/24 h. VTR: 30 g/m/24 h. VP—forming: 175 μm nylon/EVOH/enhanced polyethylene coextrusion. OTR: 0.4 ML/m/24 h. VTR: 3.3 g/m/24 h. VP—non-forming: 65 μm nylon/polyolefin plastomer coextrusion. OTR: 53.0 mL/m/24 h. VTR: 6.5 g/m/24 h. VSP—forming: 350 μm polyester/EVOH/polyethylene coextrusion. OTR: 1.8 mL/m/24 h. VTR: 2.8 g/m/24 h. VSP—non-forming: 127 μm PE/EVOH/LLDPE. OTR: 0.8 mL/m/24 h. VTR: 0.4 g/m/24 h.
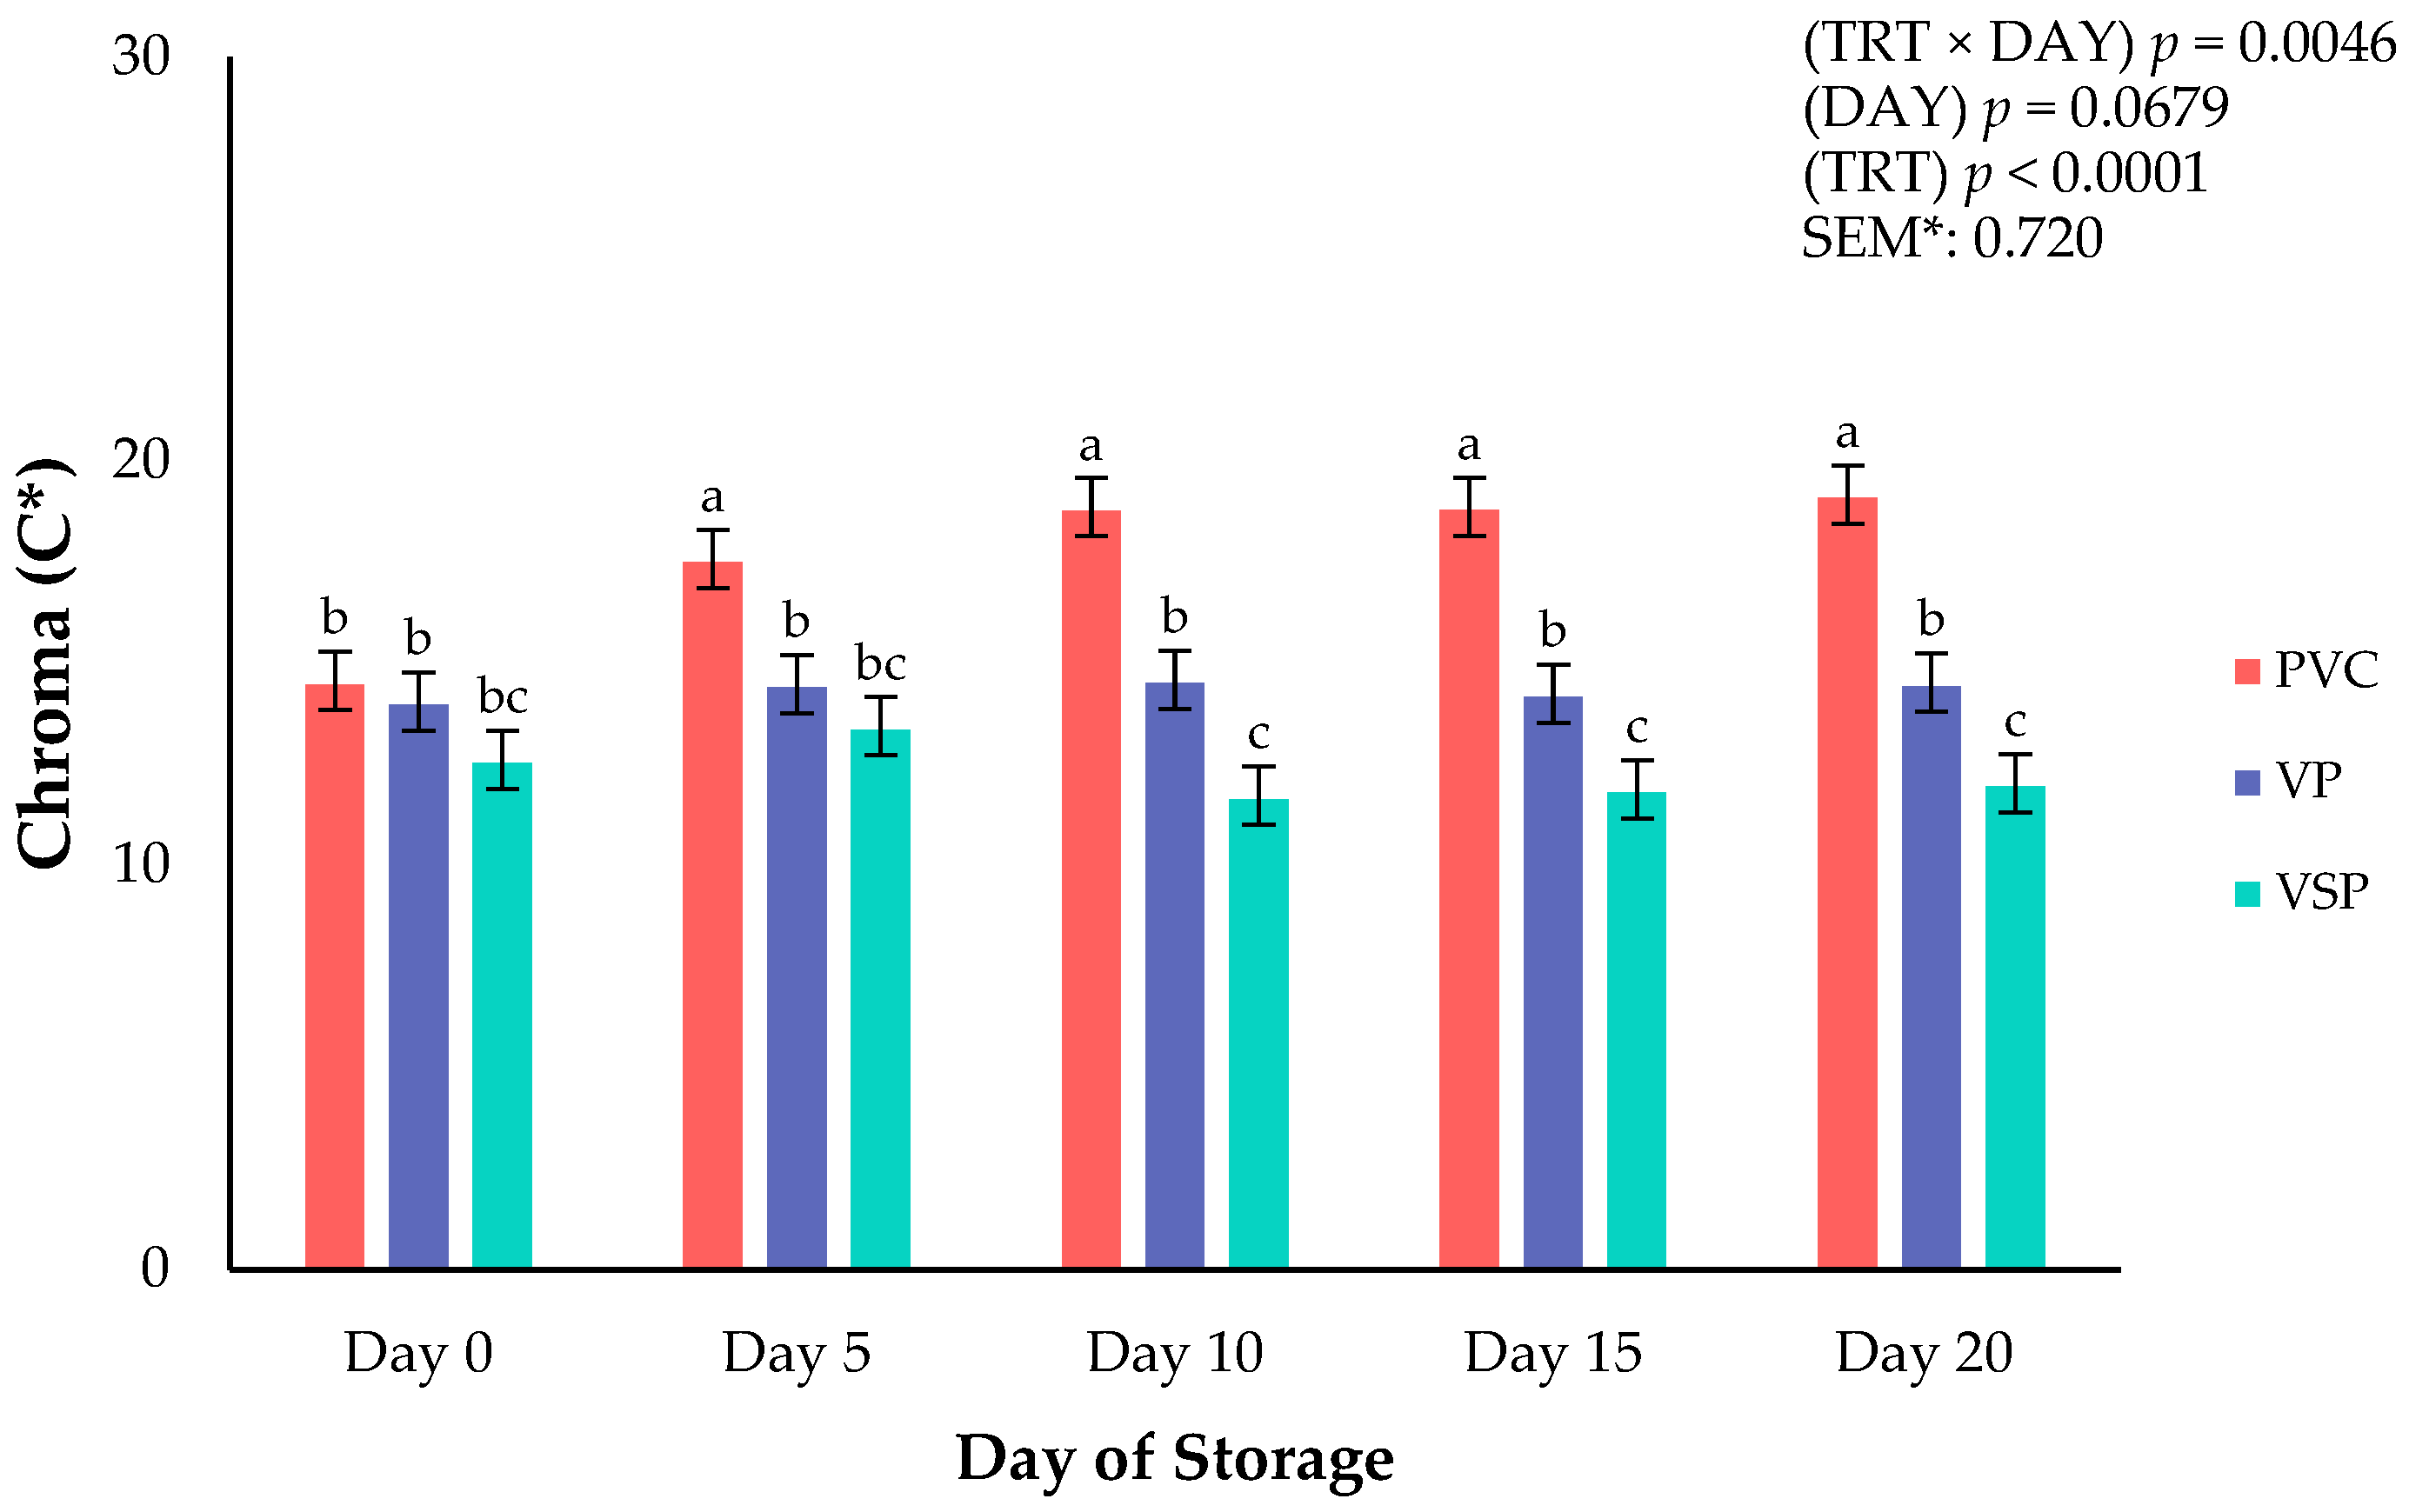
Figure 3.
Interaction of packaging treatment × day of storage for chroma (C*) of boneless–skinless chicken breast. a–c Means lacking common superscripts differ (p < 0.05). * SEM, standard error of the mean. Chroma (C*)—total color (a larger number indicates a more vivid color). Packaging treatment (N = 10/Treatment): PVC—10 μm polyvinyl chloride. OTR: 14,000 mL/m/24 h. VTR: 30 g/m/24 h. VP—forming: 175 μ nylon/EVOH/enhanced polyethylene coextrusion. OTR: 0.4 ML/m/24 h. VTR: 3.3 g/m/24 h. VP—non-forming: 65 μm nylon/polyolefin plastomer coextrusion. OTR: 53.0 mL/m/24 h. VTR: 6.5 g/m/24 h. VSP—forming: 350 μm polyester/EVOH/polyethylene coextrusion. OTR: 1.8 mL/m/24 h. VTR: 2.8 g/m/24 h. VSP—non-forming: 127 μm PE/EVOH/LLDPE. OTR: 0.8 mL/m/24 h. VTR: 0.4 g/m/24 h.
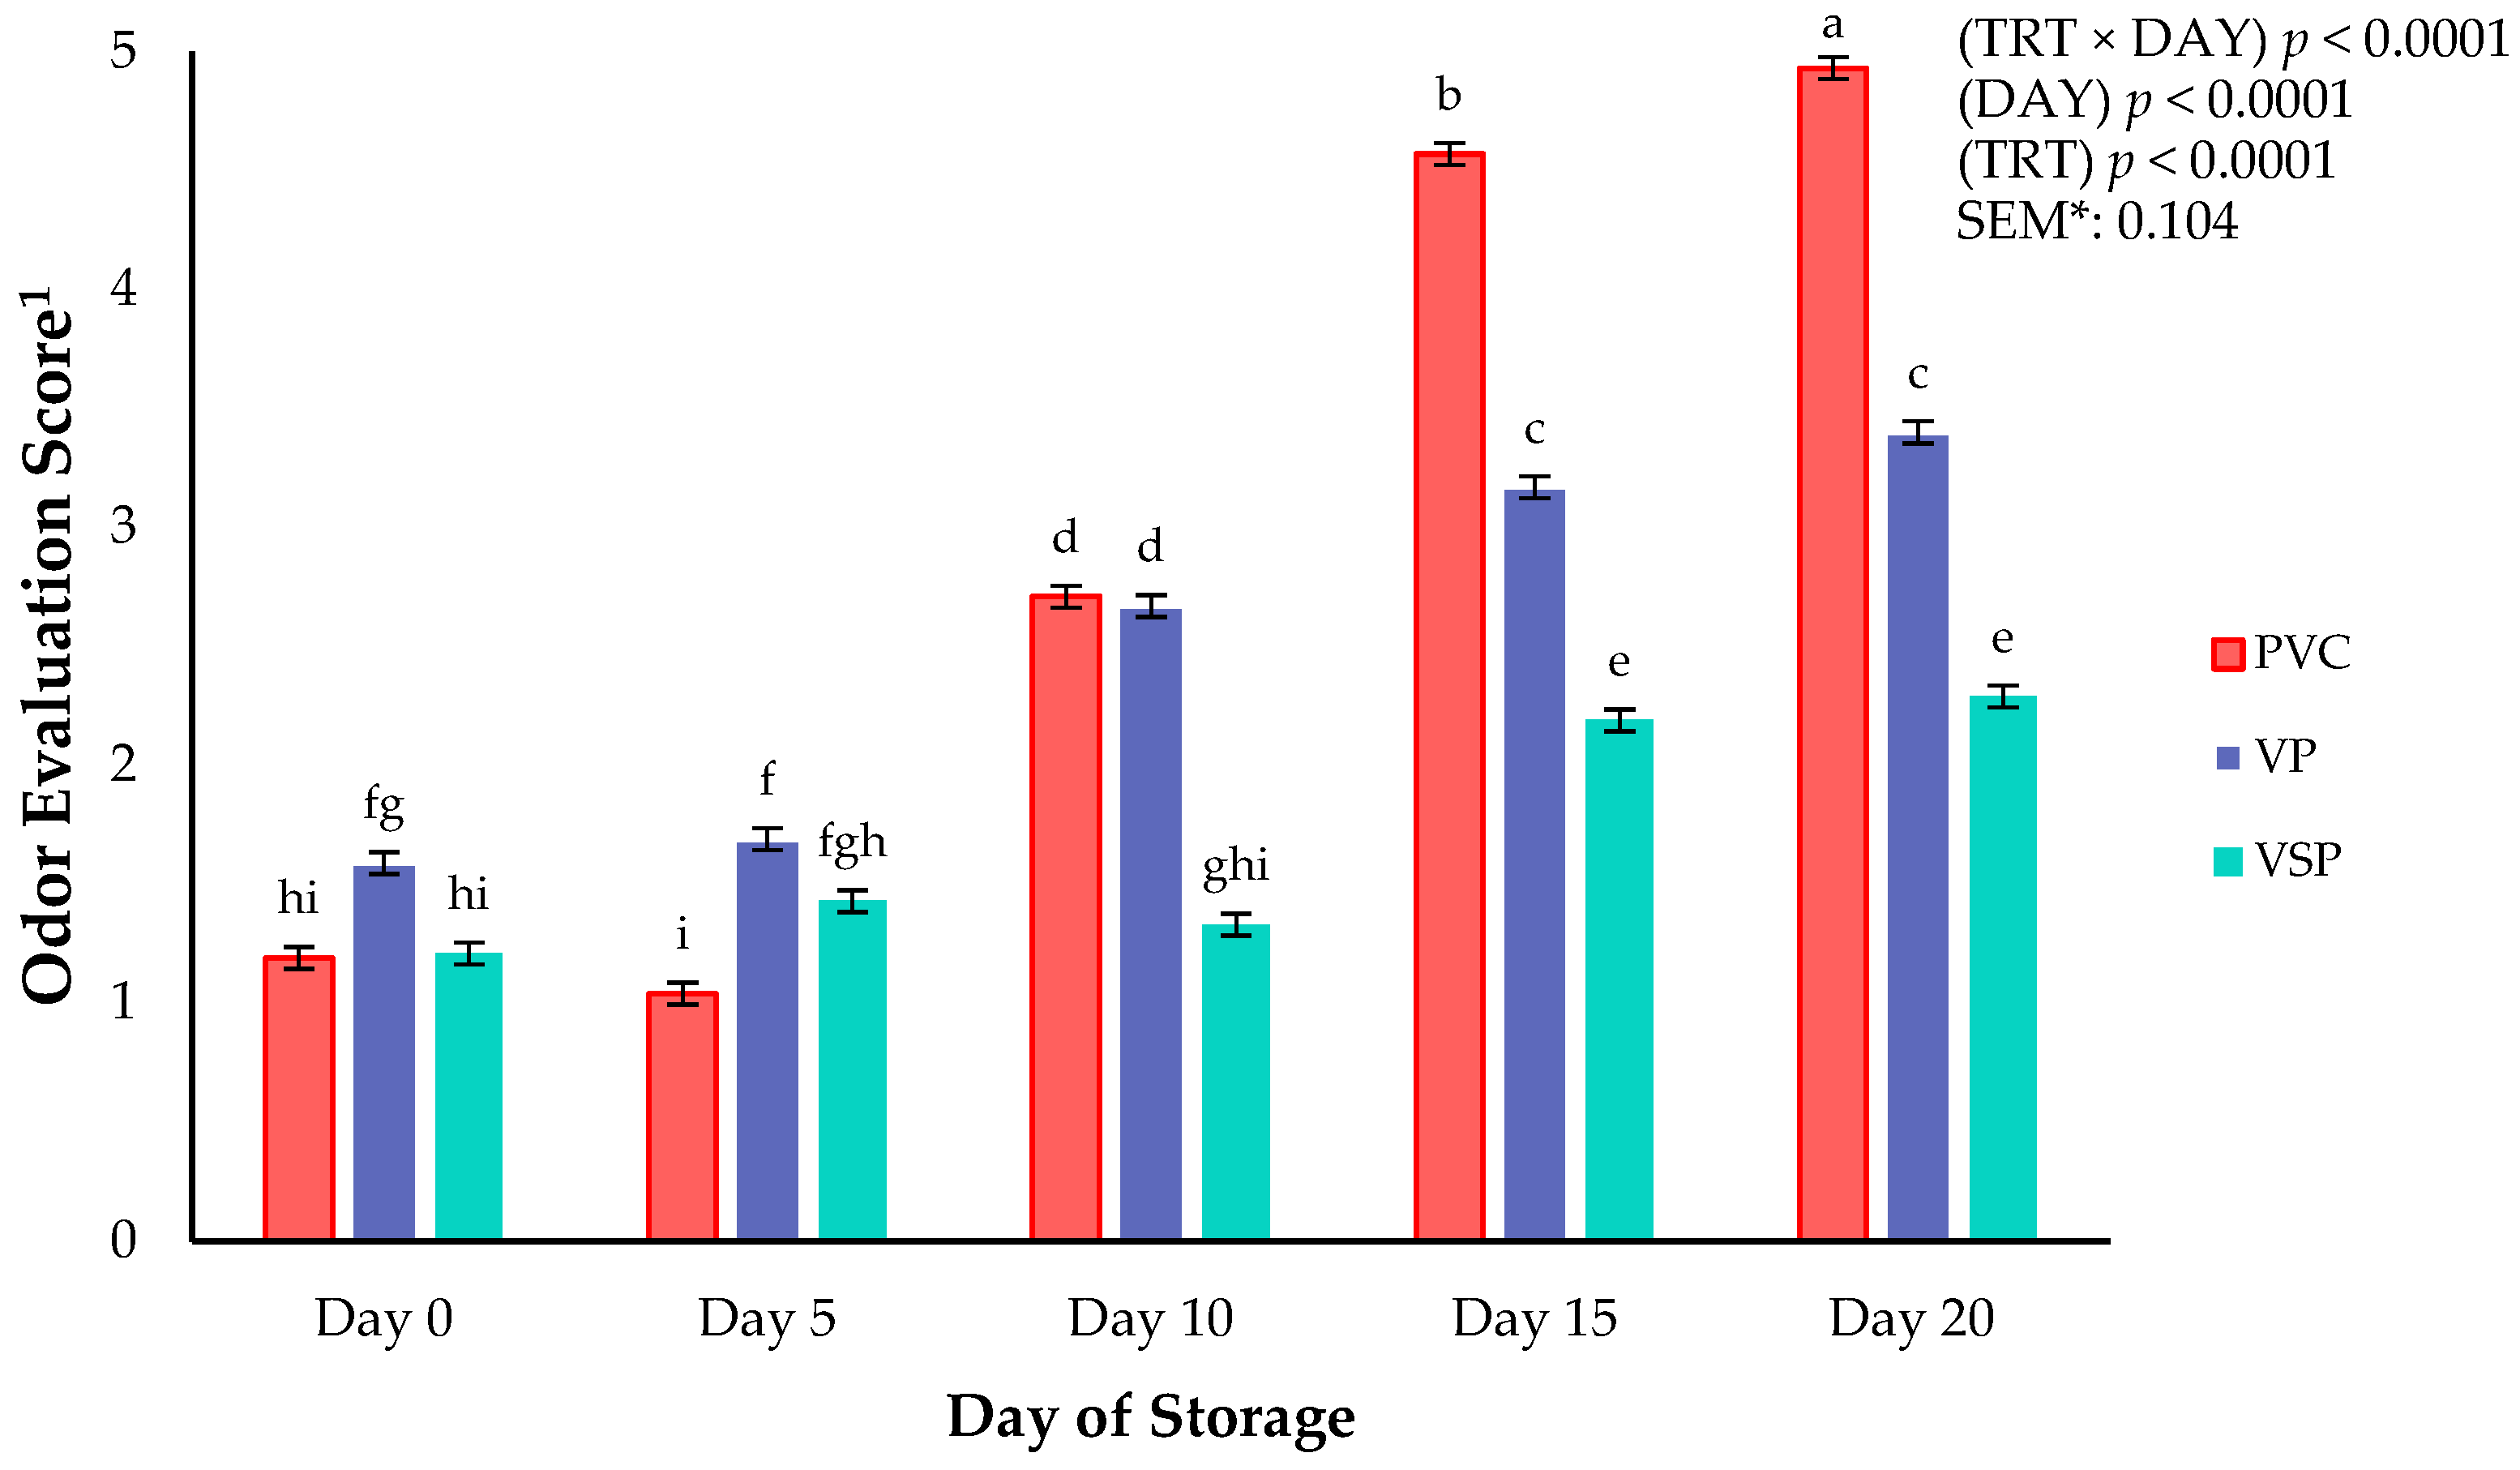
Figure 4.
Interaction of packaging treatment × day of storage on odor evaluation scores of boneless–skinless chicken breast. a–i Means lacking common superscripts differ (p < 0.05). * SEM, standard error of the mean. 1 Odor evaluation score anchors: 1 = “fresh chicken, no off odor”; 2 = “slight off odor”; 3 = “small off odor”; 4 = “moderate off odor, unacceptable”; 5 = “extremely unacceptable, extreme off odor”. Packaging treatment (N = 7/Treatment): PVC—10 μm polyvinyl chloride. OTR: 14,000 mL/m/24 h. VTR: 30 g/m/24 h. VP—forming: 175 μm nylon/EVOH/enhanced polyethylene coextrusion. OTR: 0.4 ML/m/24 h. VTR: 3.3 g/m/24 h. VP—non-forming: 65 μm nylon/polyolefin plastomer coextrusion. OTR: 53.0 mL/m/24 h. VTR: 6.5 g/m/24 h. VSP—forming: 350 μm polyester/EVOH/polyethylene coextrusion. OTR: 1.8 mL/m/24 h. VTR: 2.8 g/m/24 h. VSP—non-forming: 127 μm PE/EVOH/LLDPE. OTR: 0.8 mL/m/24 h. VTR: 0.4 g/m/24 h.
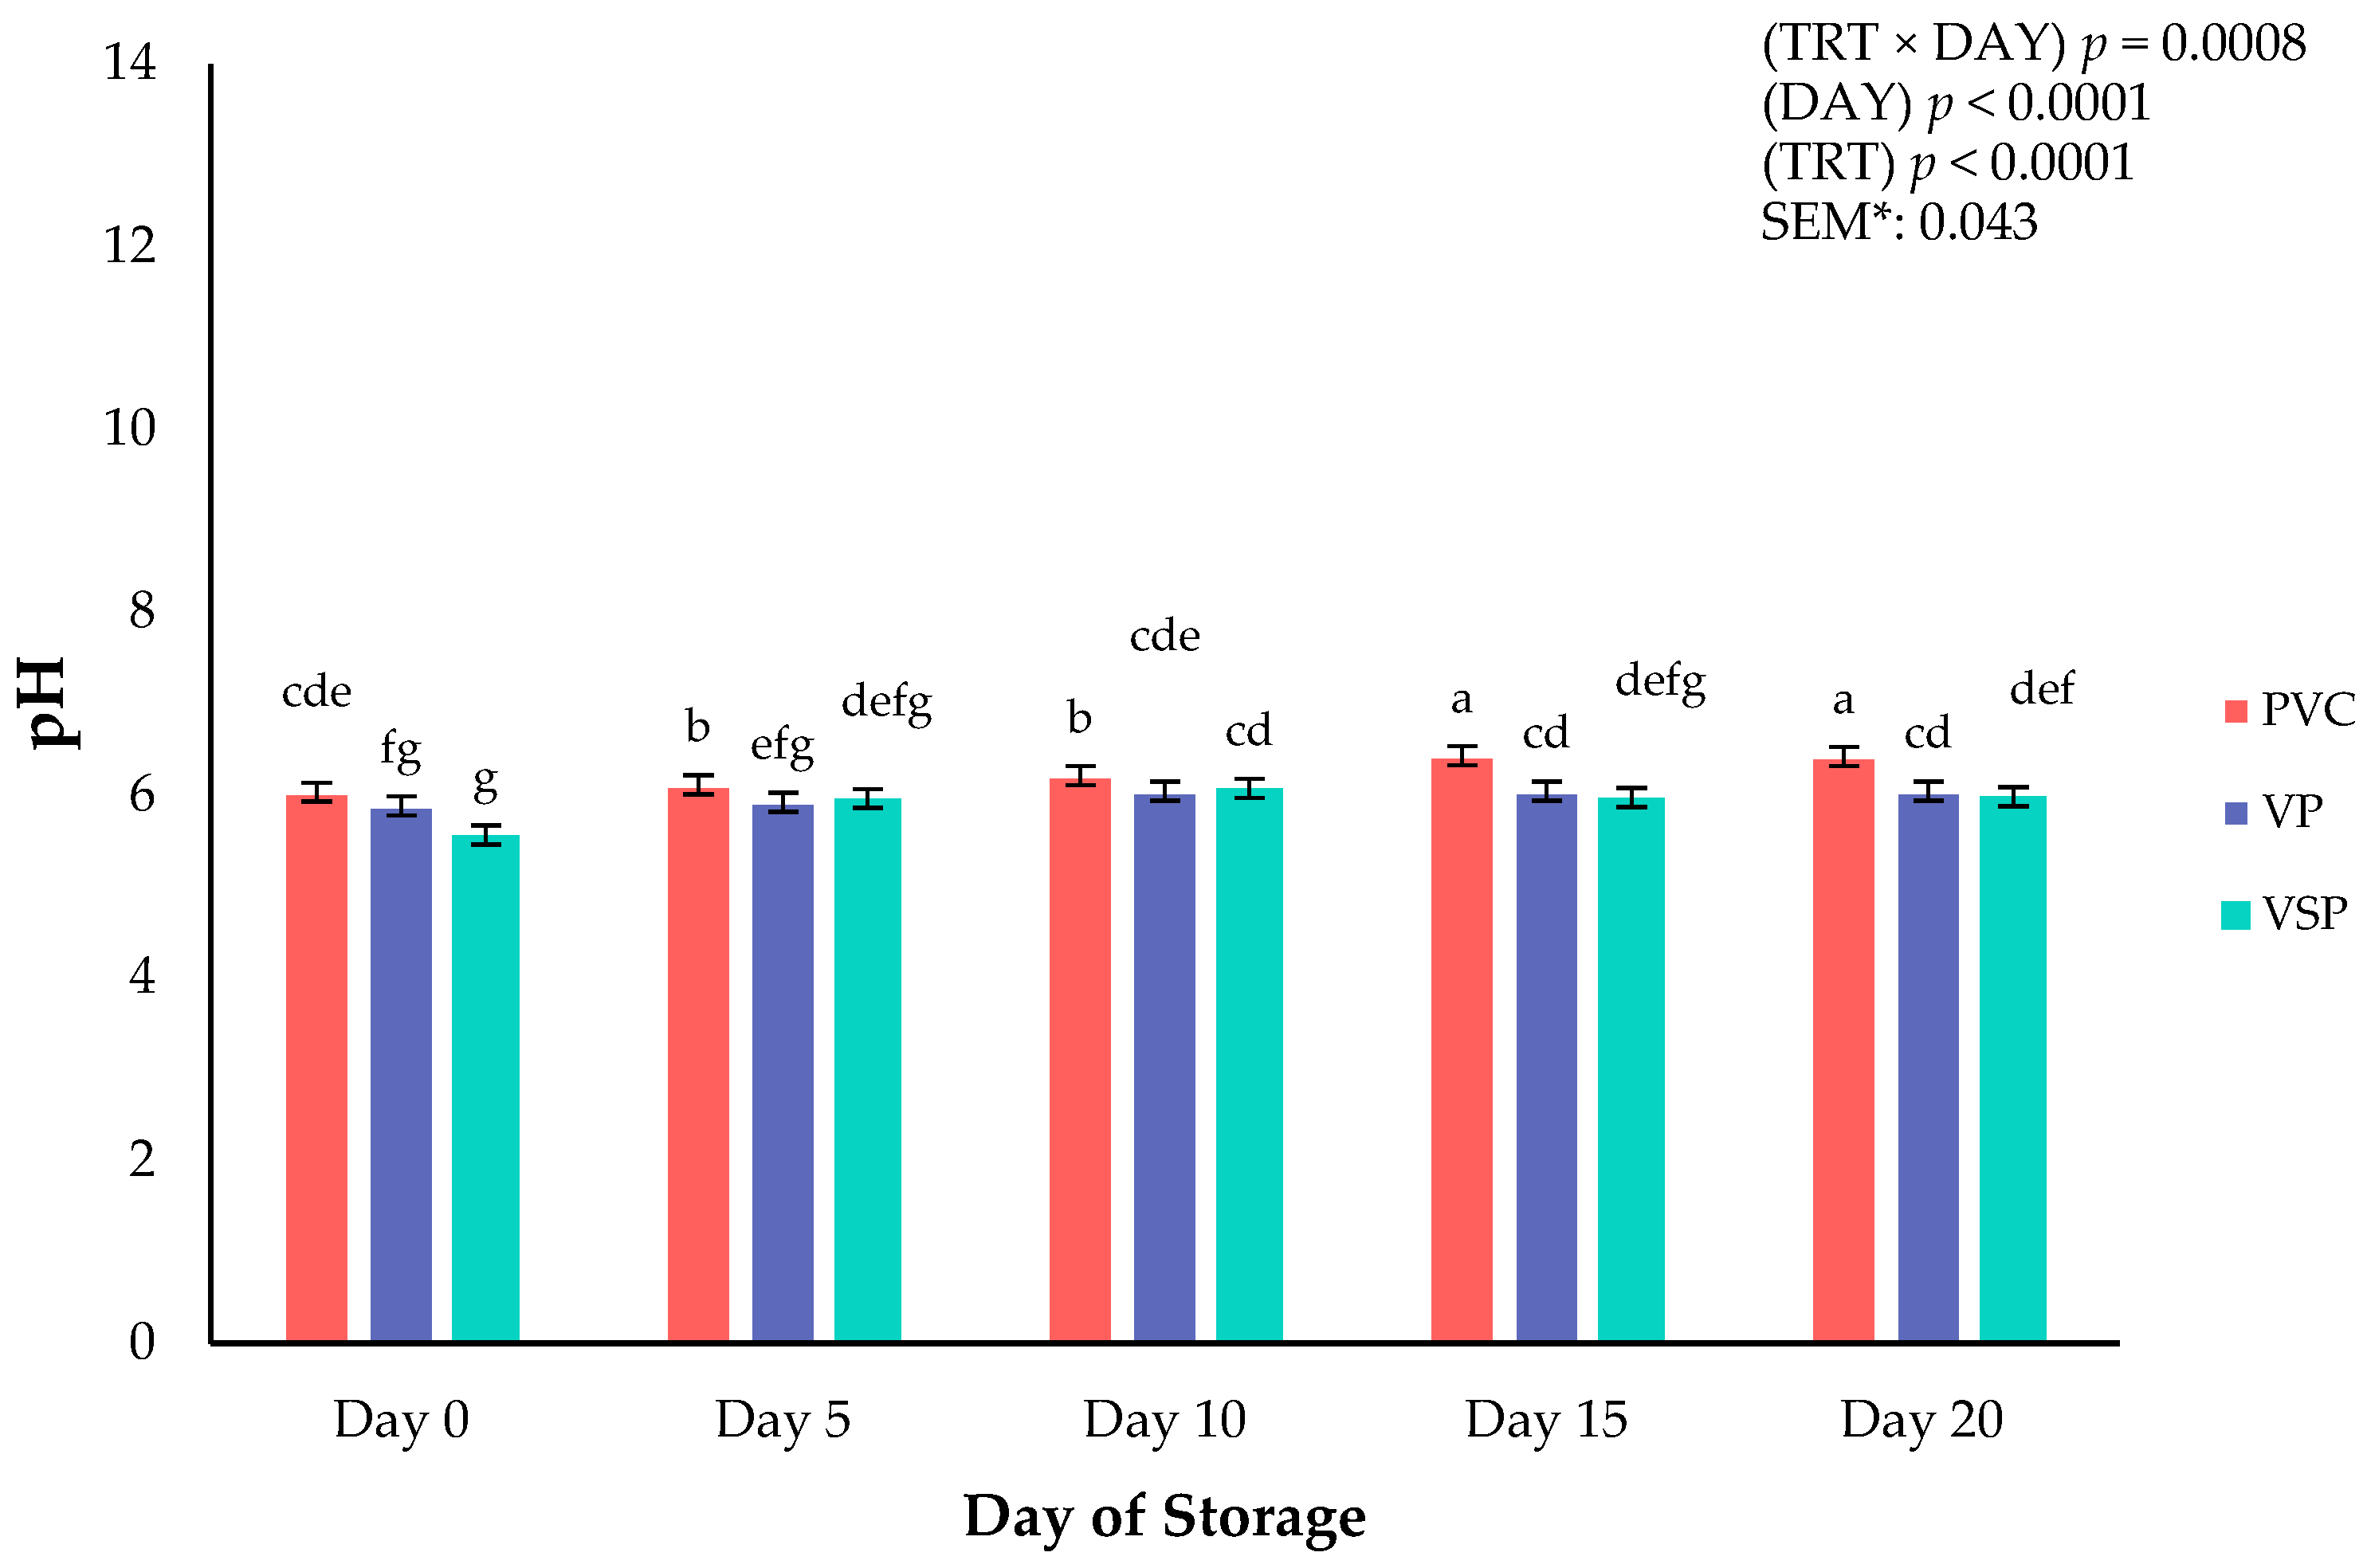
Figure 5.
Interaction of storage packaging treatment × day of storage on pH of boneless–skinless chicken breast. a–g Means lacking common superscripts differ (p < 0.05). * SEM, standard error of the mean. Packaging treatment (N = 7/Treatment/Day): PVC—10 μm polyvinyl chloride. OTR: 14,000 mL/m/24 h. VTR: 30 g/m/24 h. VP—forming: 175 μ nylon/EVOH/enhanced polyethylene coextrusion. OTR: 0.4 ML/m/24 h. VTR: 3.3 g/m/24 h. VP—non-forming: 65 μm nylon/polyolefin plastomer coextrusion. OTR: 53.0 mL/m/24 h. VTR: 6.5 g/m/24 h. VSP—forming: 350 μm polyester/EVOH/polyethylene coextrusion. OTR: 1.8 mL/m/24 h. VTR: 2.8 g/m/24 h. VSP—non-forming: 127 μm PE/EVOH/LLDPE. OTR: 0.8 mL/m/24 h. VTR: 0.4 g/m/24 h.
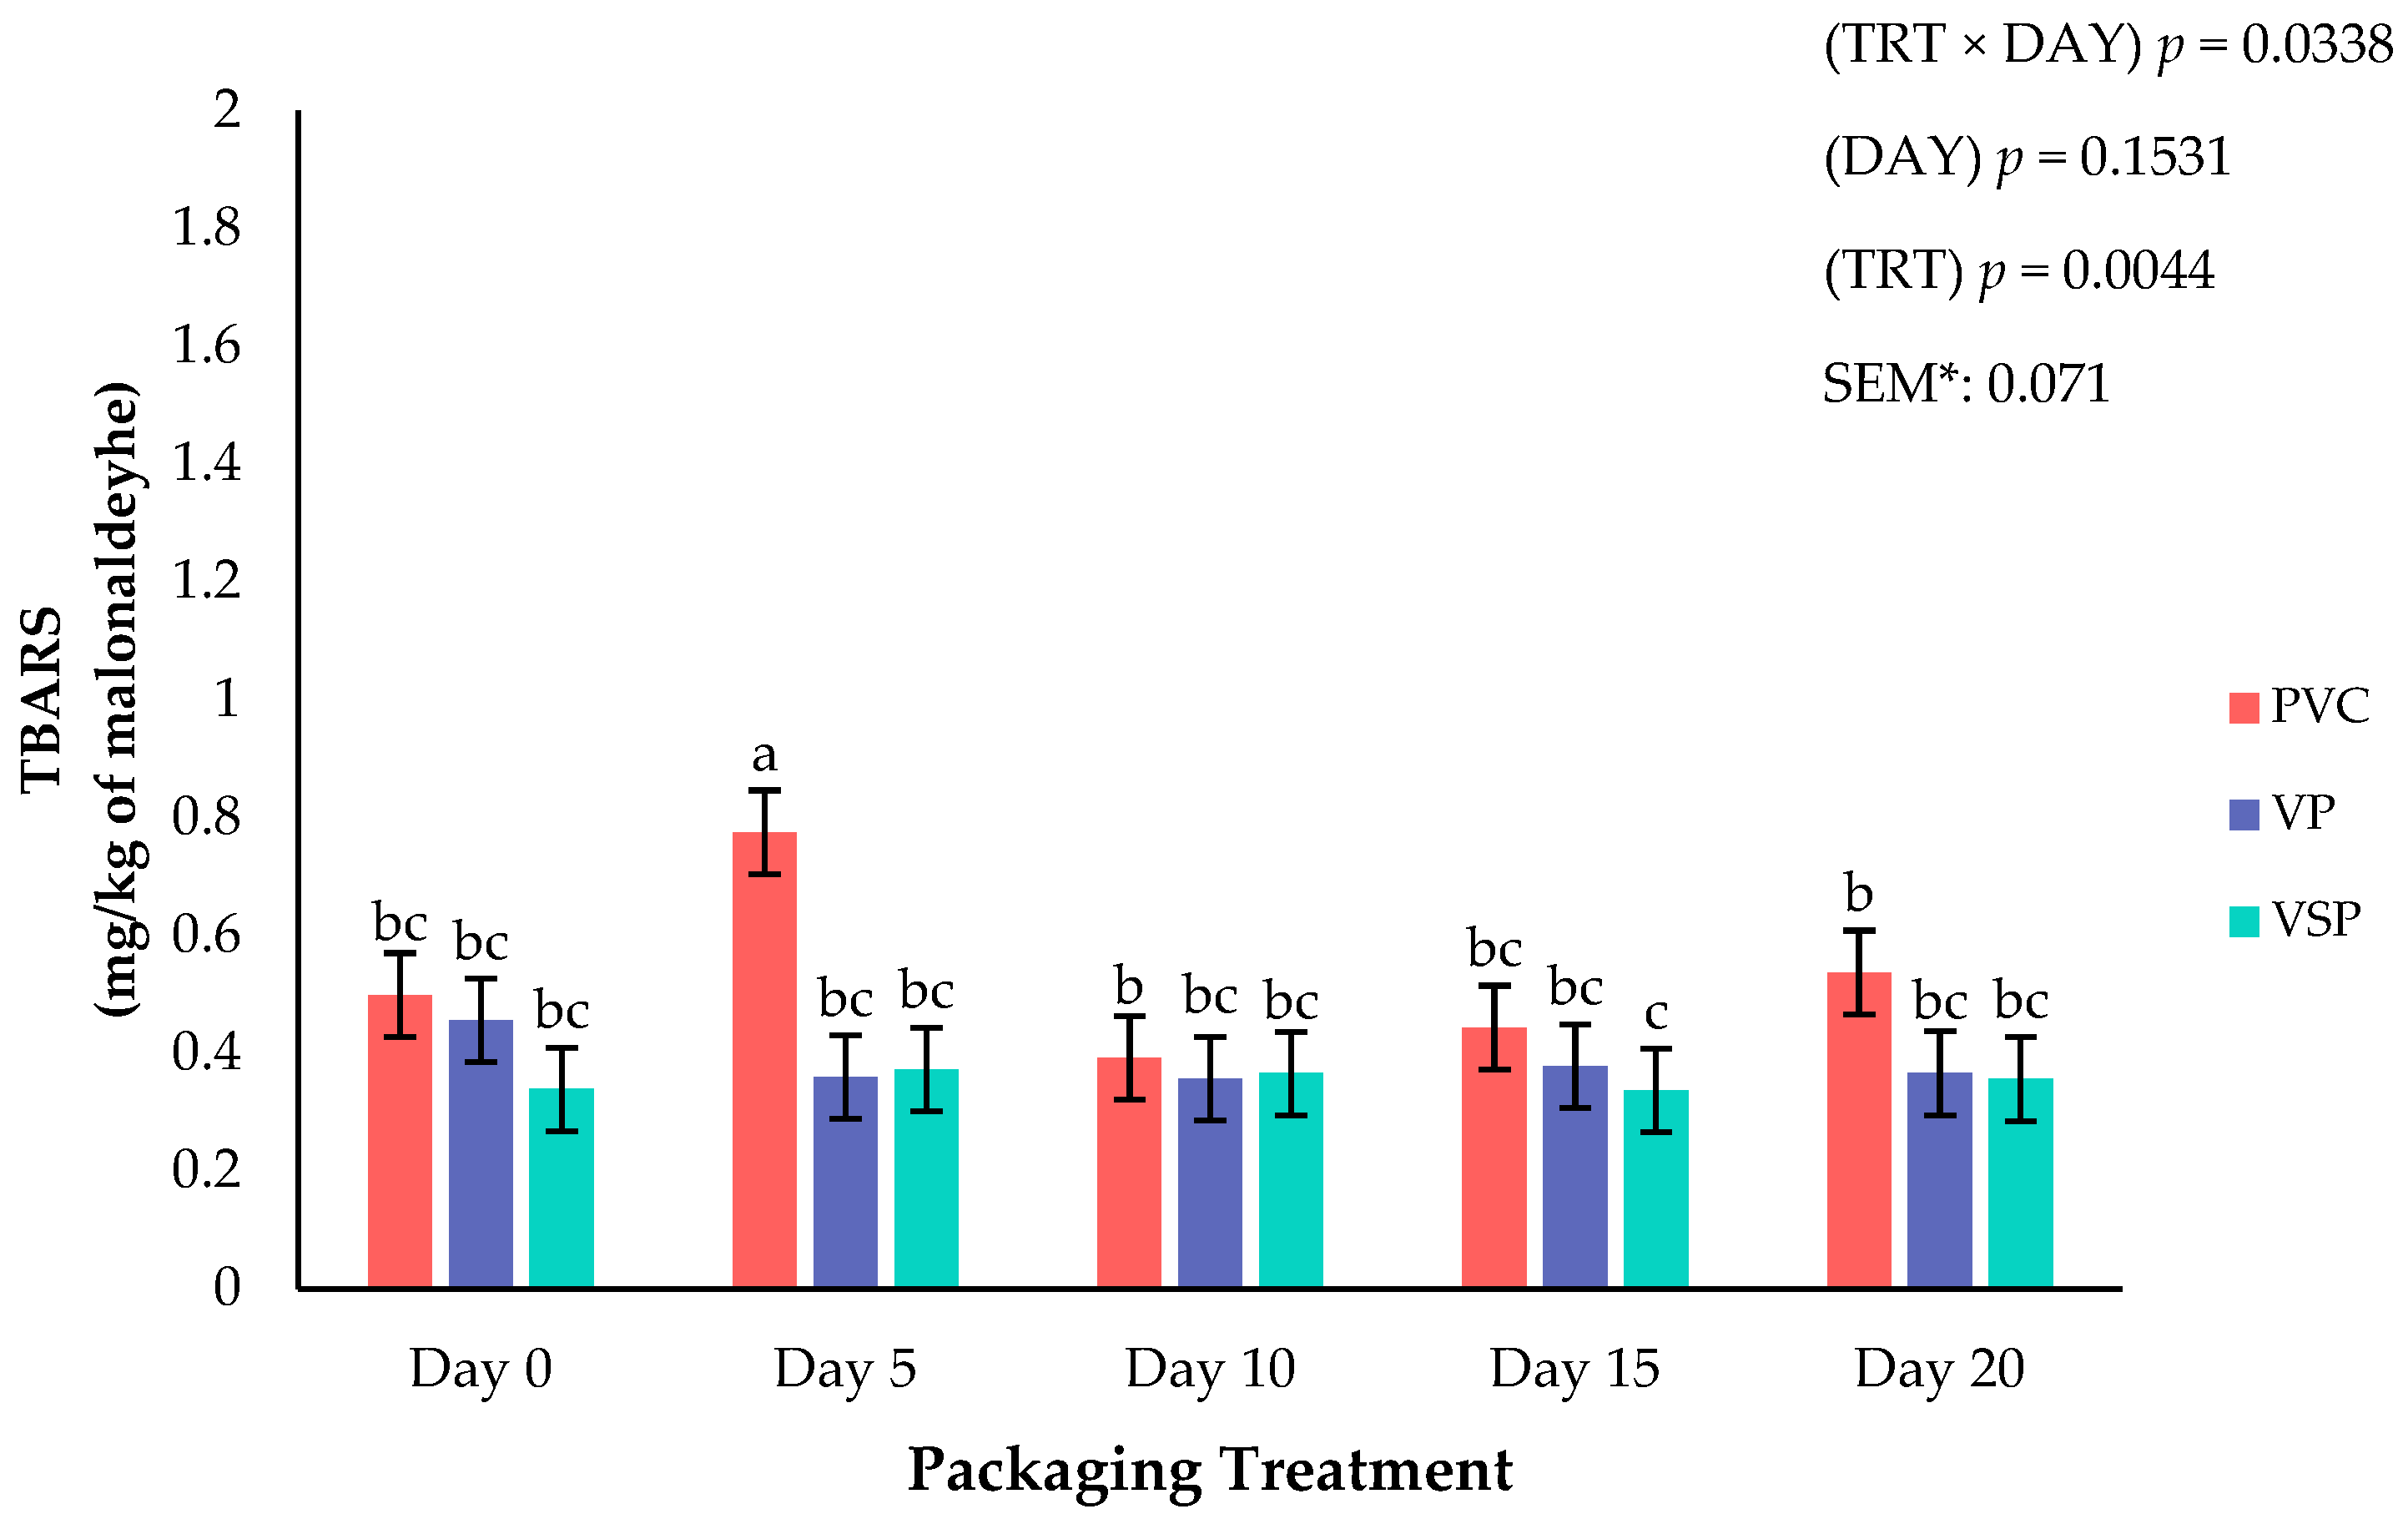
Figure 6.
Interaction of packaging treatment × day of storage on lipid oxidation (TBARS). a–c Means lacking common superscripts differ (p < 0.05). * SEM, standard error of the mean. Packaging treatment (N = 7/Treatment/Day): PVC—10 μm polyvinyl chloride. OTR: 14,000 mL/m/24 h. VTR: 30 g/m/24 h. VP—forming: 175 μm nylon/EVOH/enhanced polyethylene coextrusion. OTR: 0.4 ML/m/24 h. VTR: 3.3 g/m/24 h. VP—non-forming: 65 μm nylon/polyolefin plastomer coextrusion. OTR: 53.0 mL/m/24 h. VTR: 6.5 g/m/24 h. VSP—forming: 350 μm polyester/EVOH/polyethylene coextrusion. OTR: 1.8 mL/m/24 h. VTR: 2.8 g/m/24 h. VSP—non-forming: 127 μm PE/EVOH/LLDPE. OTR: 0.8 mL/m/24 h. VTR: 0.4 g/m/24 h.
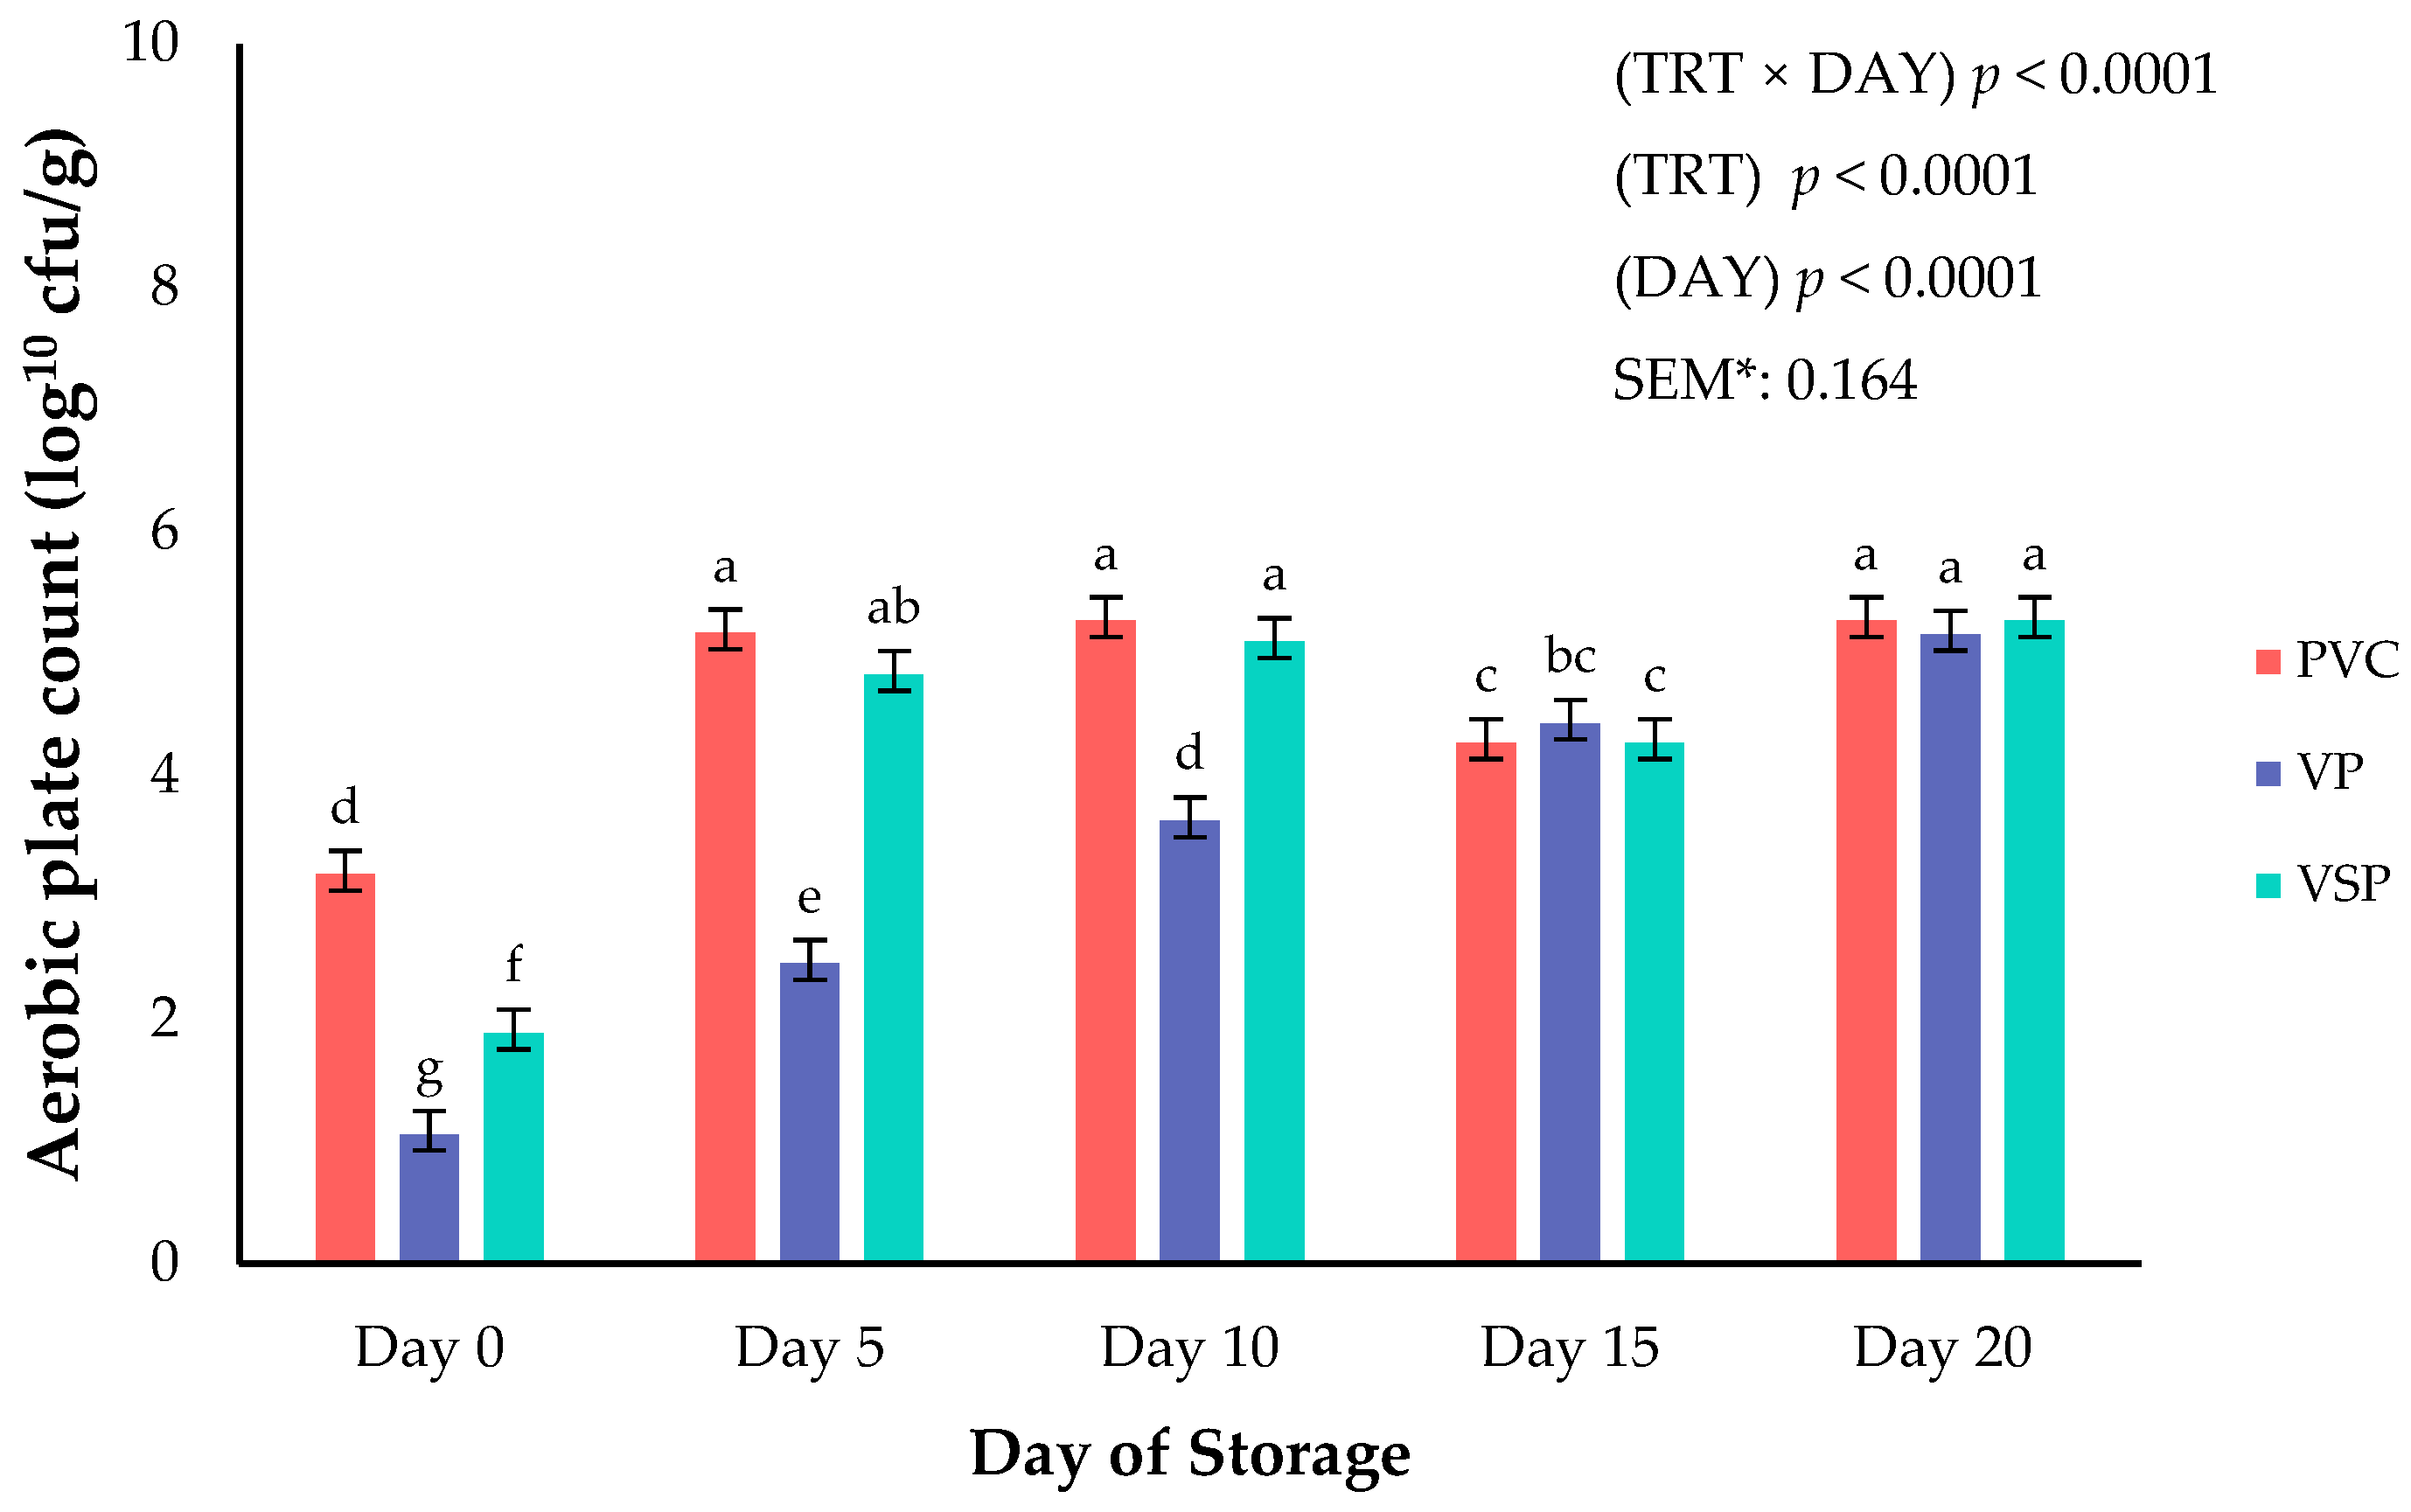
Figure 7.
Interaction of packaging treatment × day of storage on aerobic plate count. a–g Means lacking common superscripts differ (p < 0.05). * SEM, standard error of the mean. Packaging treatment (N = 7/Treatment/Day): PVC—10 μm polyvinyl chloride. OTR: 14,000 mL/m/24 h. VTR: 30 g/m/24 h. VP—forming: 175 μm nylon/EVOH/enhanced polyethylene coextrusion. OTR: 0.4 ML/m/24 h. VTR: 3.3 g/m/24 h. VP—non-forming: 65 μm nylon/polyolefin plastomer coextrusion. OTR: 53.0 mL/m/24 h. VTR: 6.5 g/m/24 h. VSP—forming: 350 μm polyester/EVOH/polyethylene coextrusion. OTR: 1.8 mL/m/24 h. VTR: 2.8 g/m/24 h. VSP—non-forming: 127 μm PE/EVOH/LLDPE. OTR: 0.8 mL/m/24 h. VTR: 0.4 g/m/24 h.
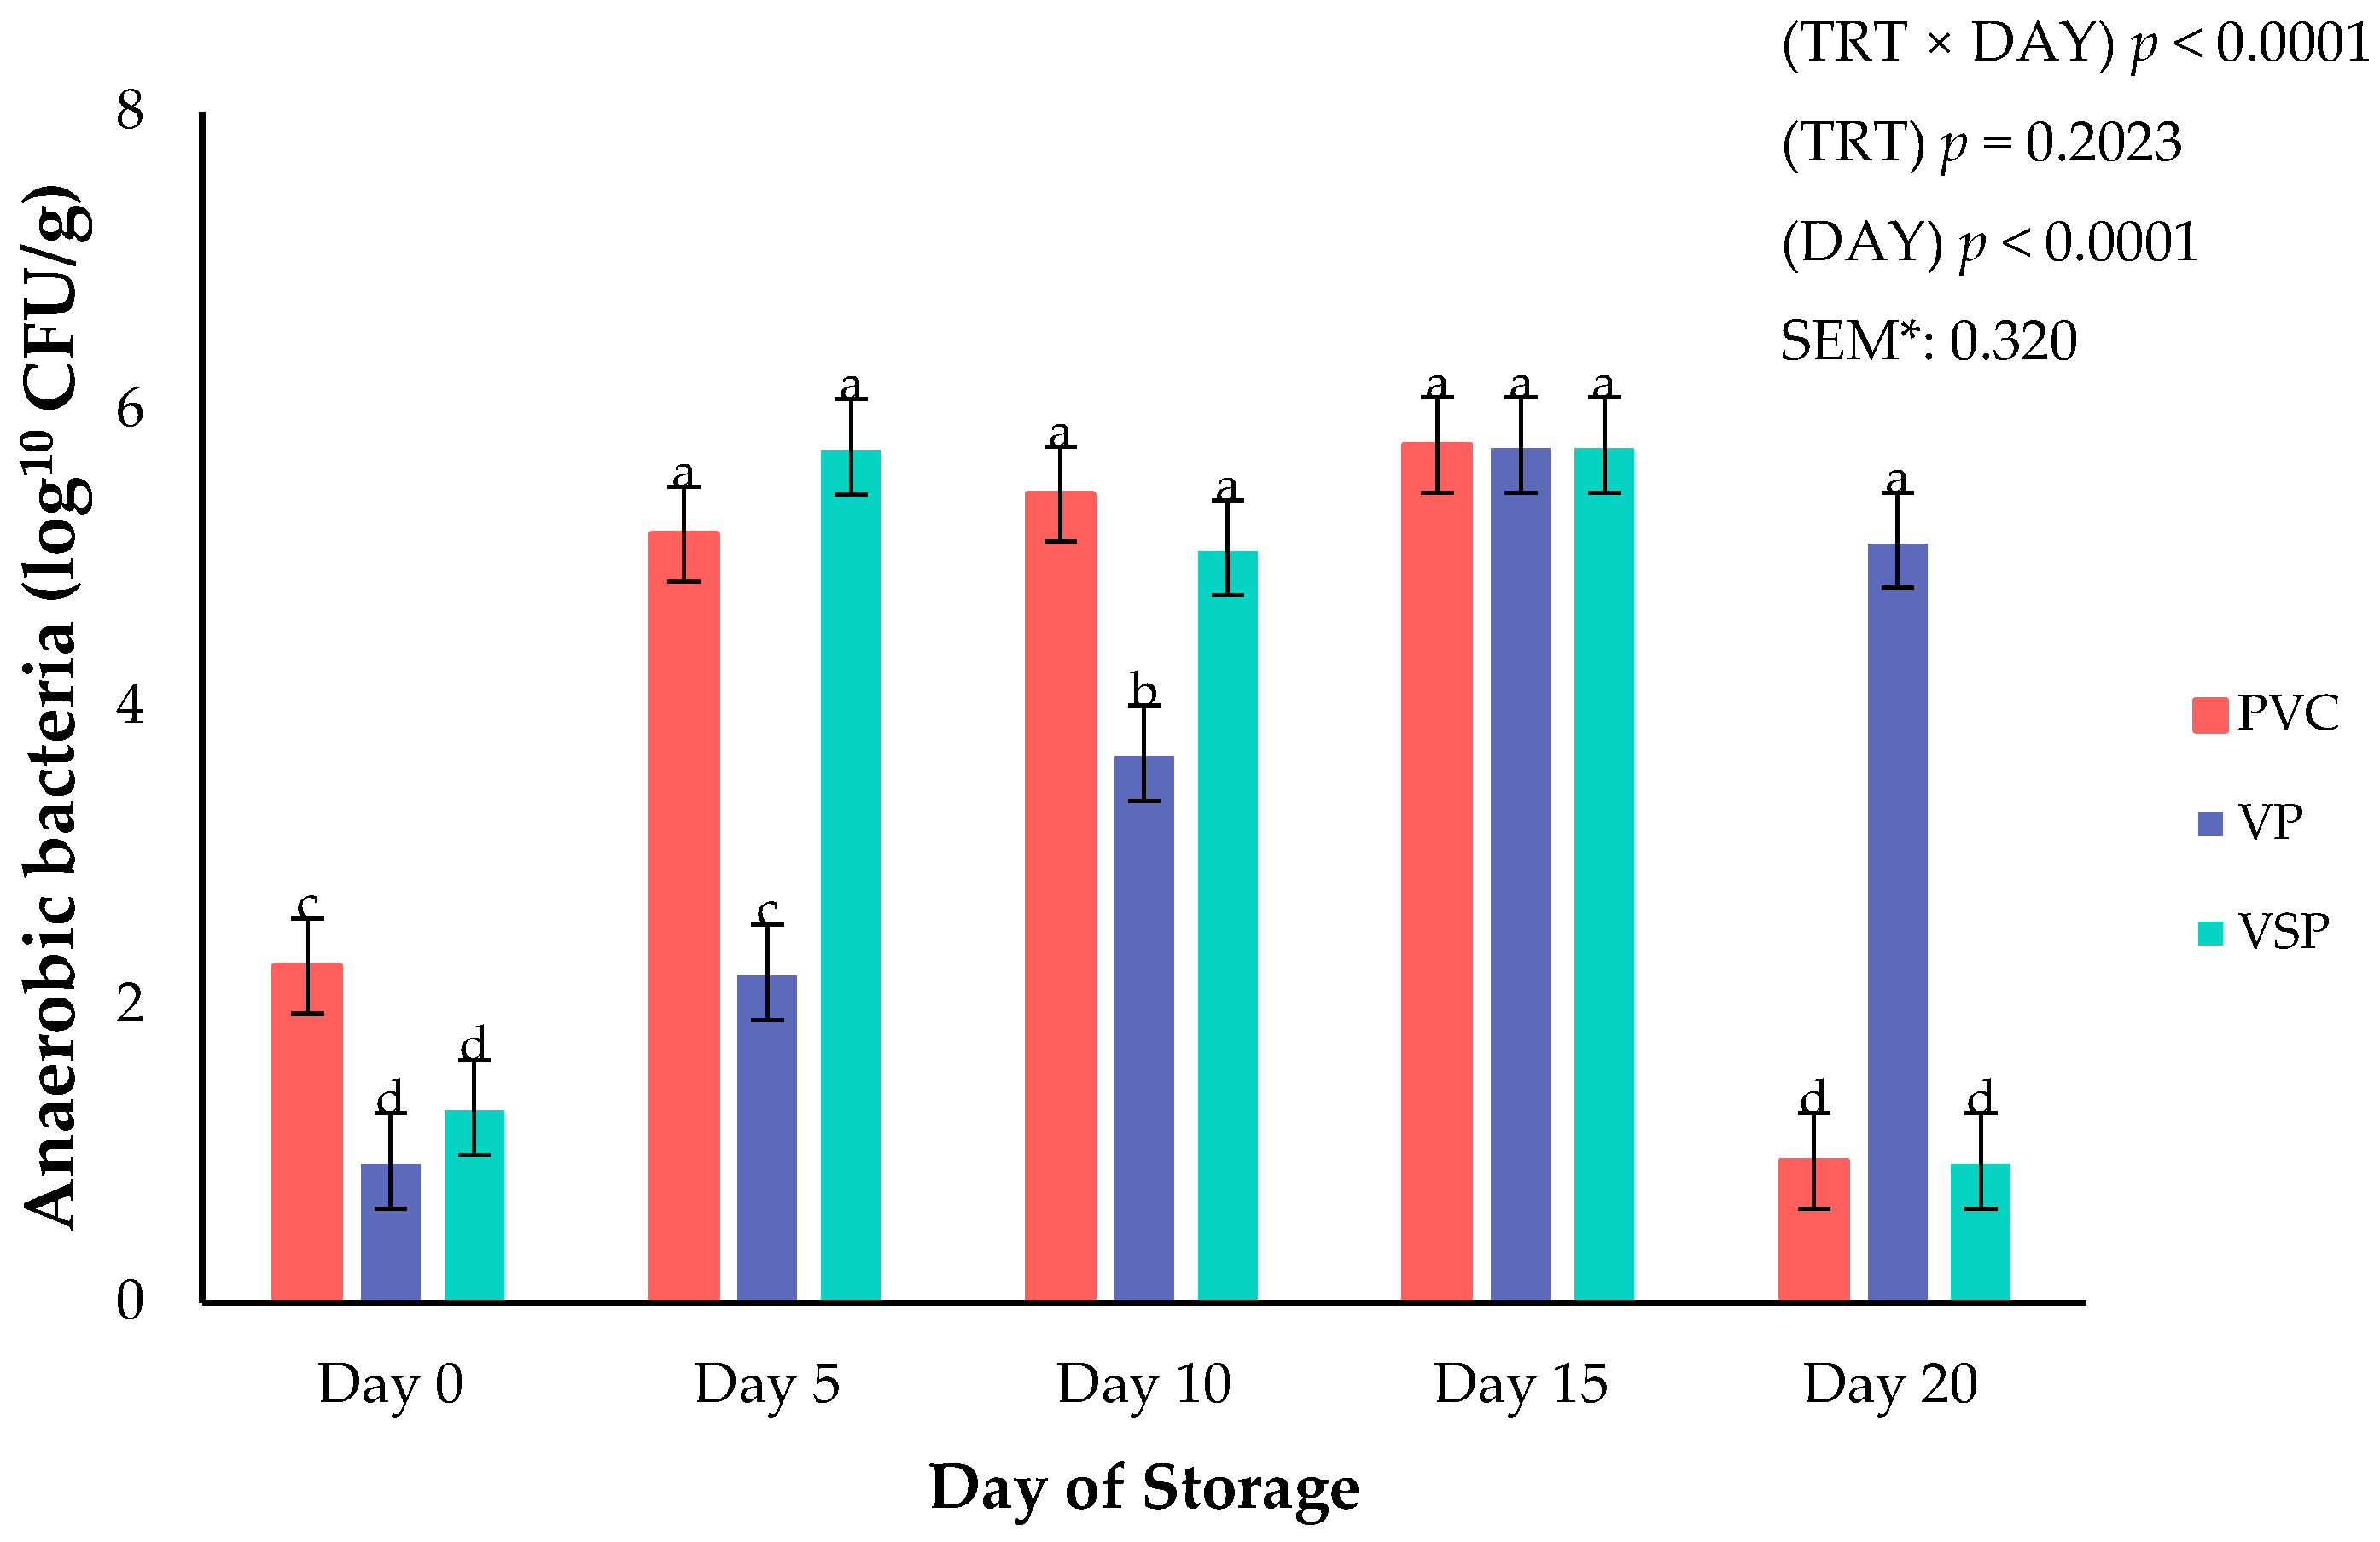
Figure 8.
Interaction of packaging treatment × day of storage on anaerobic bacteria growth. a–d Means lacking common superscripts differ (p < 0.05). * SEM, standard error of the mean. Packaging treatment (N = 7/Treatment/Day): PVC—10 μm polyvinyl chloride. OTR: 14,000 mL/m/24 h. VTR: 30 g/m/24 h. VP—forming: 175 μm nylon/EVOH/enhanced polyethylene coextrusion. OTR: 0.4 ML/m/24 h. VTR: 3.3 g/m/24 h. VP—non-forming: 65 μm nylon/polyolefin plastomer coextrusion. OTR: 53.0 mL/m/24 h. VTR: 6.5 g/m/24 h. VSP—forming: 350 μm polyester/EVOH/polyethylene coextrusion. OTR: 1.8 mL/m/24 h. VTR: 2.8 g/m/24 h. VSP—non-forming: 127 μm PE/EVOH/LLDPE. OTR: 0.8 mL/m/24 h. VTR: 0.4 g/m/24 h.
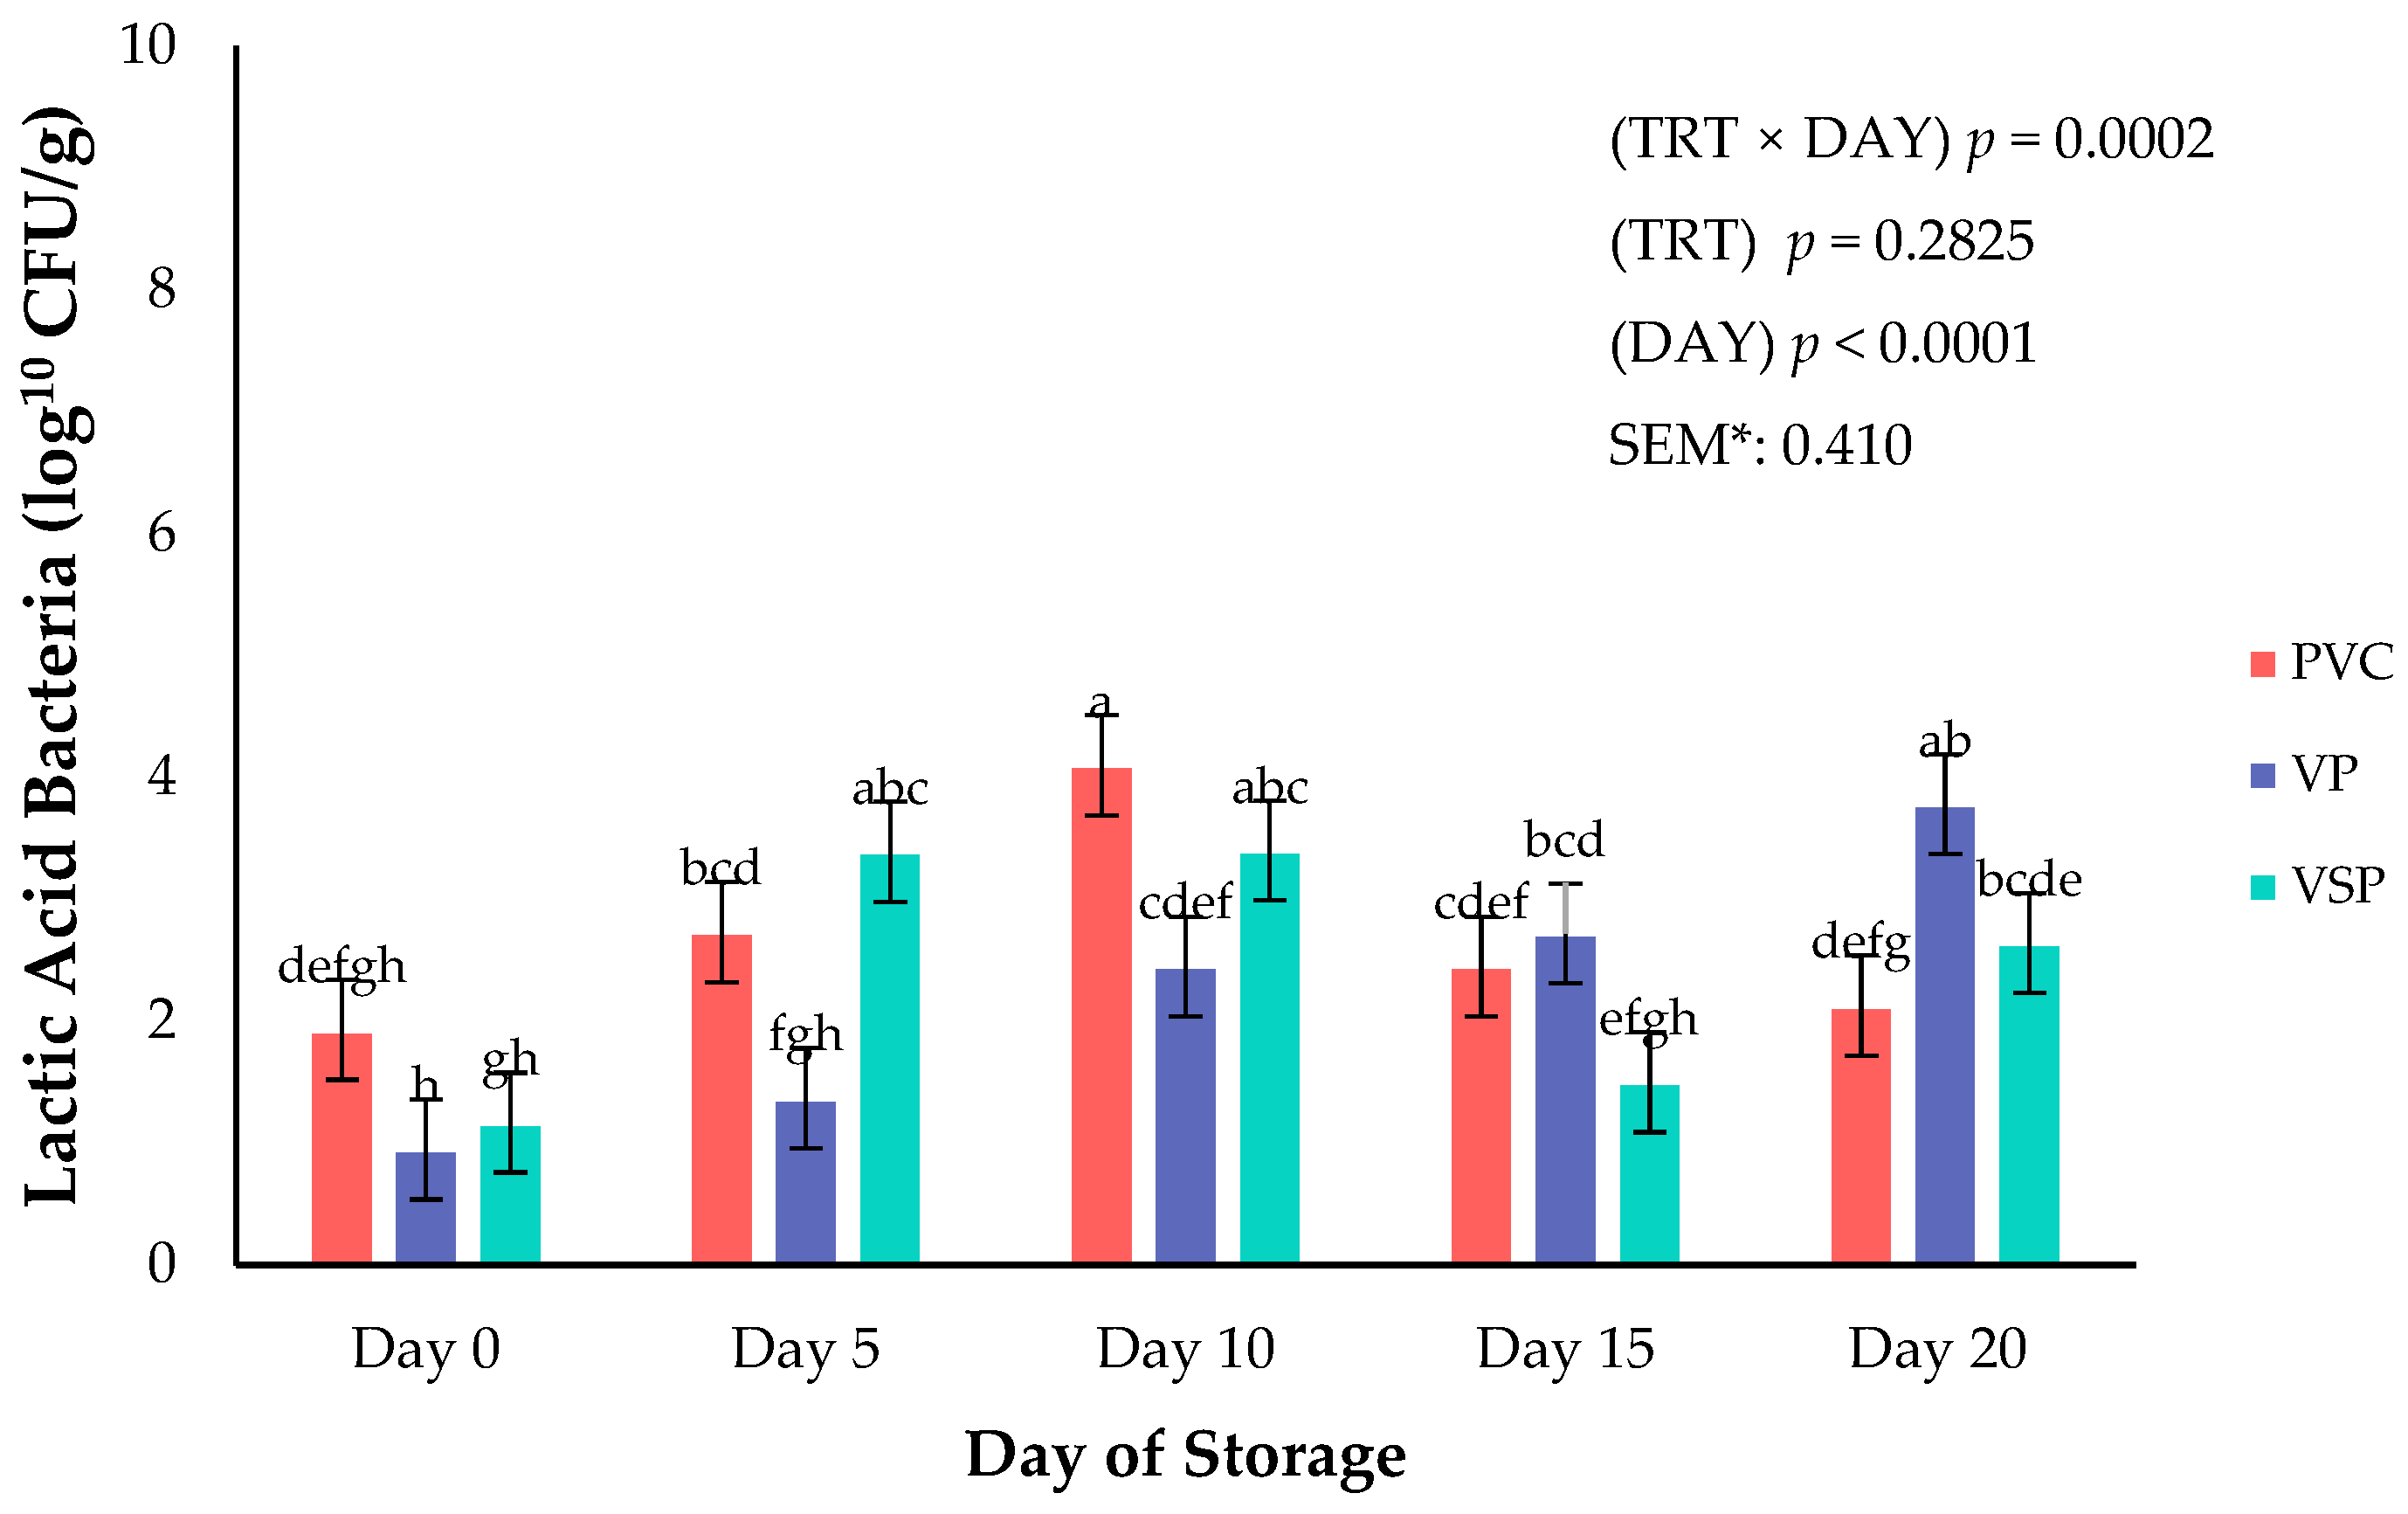
Figure 9.
Interaction of storage duration (day) × packaging treatment on lactic acid bacteria growth. a–h Means lacking common superscripts differ (p < 0.05). * SEM, standard error of the mean. Packaging treatment (N = 7/Treatment/Day): PVC—10 μm polyvinyl chloride. OTR: 14,000 mL/m/24 h. VTR: 30 g/m/24 h. VP—forming: 175 μ nylon/EVOH/enhanced polyethylene coextrusion. OTR: 0.4 ML/m/24 h. VTR: 3.3 g/m/24 h. VP—non-forming: 65 μm nylon/polyolefin plastomer coextrusion. OTR: 53.0 mL/m/24 h VTR: 6.5 g/m/24 h. VSP—forming: 350 μm polyester/EVOH/polyethylene coextrusion. OTR: 1.8 mL/m/24 h. VTR: 2.8 g/m/24 h. VSP—non-forming: 127 μm PE/EVOH/LLDPE. OTR: 0.8 mL/m/24 h. VTR: 0.4 g/m/24 h.
Table 1.
Packaging film specifications used during storage of fresh boneless–skinless chicken breast.
Table 1.
Packaging film specifications used during storage of fresh boneless–skinless chicken breast.
| Packaging Treatment 1 | Film Type | Thickness | OTR 2 | VPR 3 |
|---|
| PVC | - | 10 μm | 14,000 mL/m/24 h | 30 g/m/24 h |
| VP | Forming | 175 μm | 0.4 mL/m/24 h | 3.3 g/m/24 h |
| Non-Forming | 65 μm | 53.0 mL/m/24 h | 6.5 g/m/24 h |
| VSP | Forming | 350 μm | 1.8 mL/m/24 h | 2.8 g/m/24 h |
| Non-Forming | 127 μm | 0.8 mL/m/24 h | 0.4 g/m/24 h |
Table 2.
Impact of packaging treatment on surface color of boneless–skinless chicken breast.
Table 2.
Impact of packaging treatment on surface color of boneless–skinless chicken breast.
| | Packaging Treatment | | |
|---|
| | PVC | VP | VSP | SEM* | p-Value |
|---|
| REDNESS (a*) | 5.58 a | 3.2 b | 2.63 c | 0.339 | <0.0001 |
| HUE ANGLE (°) | 71.54 | 76.02 | 72.97 | 1.755 | 0.1749 |
Table 3.
Impact of storage duration on surface color of boneless–skinless chicken breast.
Table 3.
Impact of storage duration on surface color of boneless–skinless chicken breast.
| | Day of Storage | | |
|---|
| | 0 | 5 | 10 | 15 | 20 | SEM* | p-Value |
|---|
| REDNESS (a*)
| 3.14 b | 3.88 a | 3.99 a | 4.08 a | 3.93 a | 0.567 | 0.0100 |
| HUE ANGLE (°)
| 72.89 | 71.55 | 75.04 | 74.52 | 73.55 | 2.266 | 0.8282 |
Table 4.
Packaging influence on e-nose peak area volatile compounds in boneless–skinless chicken breast.
Table 4.
Packaging influence on e-nose peak area volatile compounds in boneless–skinless chicken breast.
| | Packaging Treatment | | |
|---|
| Compound | PVC | VP | VSP | p-Value | SEM* |
|---|
| Aldehyde | 295.98 b | 146.94 b | 2834.00 a | 0.0025 | 598.45 |
| Alkane | 655.23 a | 116.80 b | 505.95 b | 0.0143 | 162.82 |
| Hydrocarbon | 3925.89 | 2238.29 | 1141.75 | 0.7236 | 4256.64 |
| Sulfur | 607.20 | 440.22 | 302.80 | 0.4649 | 139.27 |
| Furan | 622.28 | 465.36 | 344.79 | 0.7630 | 285.81 |
| Ketone | 2653.01 | 2309.69 | 2075.15 | 0.5836 | 577.86 |
| Terpene | 239.93 a | 113.60 b | 47.91 b | 0.0214 | 44.47 |
| Ester | 3327.50 | 1944.81 | 1296.93 | 0.6280 | 1761.19 |
| Carboxylic | 154.35 | 85.61 | 128.67 | 0.1708 | 27.71 |
| Alcohol | 408.62 | 259.51 | 410.49 | 0.3475 | 83.53 |
Table 5.
Impact of storage duration on e-nose peak area volatile compounds in boneless–skinless chicken breast.
Table 5.
Impact of storage duration on e-nose peak area volatile compounds in boneless–skinless chicken breast.
| | Day of Storage | | |
|---|
| Compound | 0 | 5 | 10 | 15 | 20 | p-Value | SEM* |
|---|
| Alkane | 100.92 b | 220.86 b | 368.03 b | 519.77 a | 920.39 a | 0.0118 | 206.29 |
| Hydrocarbon | ND 1 | ND 1 | ND 1 | 452.80 | 4417.81 | 0.2275 | 2210.59 |
| Sulfur | 148.53 b | 65.66 b | 104.90 b | 568.75 b | 1362.53 a | 0.0040 | 299.11 |
| Furan | 123.71 | ND 1 | ND 1 | 949.05 | 359.68 | 0.1985 | 477.48 |
| Ketone | 1575.53 | 2544.94 | 2069.32 | 2568.81 | 2971.15 | 0.3198 | 517.44 |
| Terpene | 67.75 | 83.16 | 118.97 | 166.51 | 232.68 | 0.0941 | 133.81 |
| Ester | 3567.95 | 672.38 | 1125.81 | 3525.33 | 2057.27 | 0.8118 | 2319.44 |
| Carboxylic | 87.84 a | 60.16 a | 108.67 a | 234.84 b | ND1 | 0.0008 | 55.07 |
| Alcohol | 223.91 | 413.99 | 350.14 | 306.65 | 503.13 | 0.3167 | 109.01 |
Table 6.
Volatile compound group mean retention time and relevance index by day of storage.
Table 6.
Volatile compound group mean retention time and relevance index by day of storage.
| | Day of Storage | |
|---|
| Compound Group | Day 0 | Day 5 | Day 10 | Day 15 | Day 20 | Sensory Descriptors 3 |
|---|
| RT 1 | RI 2 | RT 1 | RI 2 | RT 1 | RI 2 | RT 1 | RI 2 | RT 1 | RI 2 |
|---|
| Alkane | 63.57 | 91.74 | 49.40 | 92.20 | 46.39 | 88.59 | 50.61 | 91.04 | 52.04 | 91.00 | Meaty |
| Hydrocarbon | ND 4 | ND 4 | ND 4 | ND 4 | ND 4 | ND 4 | 45.27 | 92.28 | 37.86 | 91.13 | Aldehydic; fatty |
| Sulfur | 60.61 | 90.57 | 45.73 | 84.93 | 24.52 | 90.18 | 27.92 | 92.64 | 24.96 | 92.06 | Cabbage; putrid |
| Furan | 73.22 | 90.14 | 59.87 | 94.71 | ND 4 | ND 4 | 36.00 | 90.91 | 40.74 | 94.97 | Metallic |
| Ketone | 49.97 | 94.04 | 26.98 | 91.56 | 30.34 | 91.91 | 34.29 | 92.49 | 33.93 | 91.14 | Fruity |
| Terpene | 69.57 | 94.52 | 65.02 | 95.06 | 65.00 | 86.47 | 63.31 | 92.53 | 66.72 | 88.18 | Terpenic |
| Ester | 52.80 | 94.15 | 36.55 | 94.60 | 33.87 | 94.16 | 39.71 | 93.51 | 36.47 | 91.62 | Onion; pungent |
| Carboxylic | 43.34 | 91.91 | 33.20 | 89.42 | 34.76 | 88.47 | 29.86 | 90.86 | ND 4 | ND 4 | Sour; rancid |
| Alcohol | 41.82 | 89.60 | 26.78 | 89.31 | 26.76 | 89.34 | 34.79 | 91.21 | 41.84 | 89.66 | Pleasant; burnt |
Table 7.
Mean volatile compound group retention time and relevance index by packaging treatment.
Table 7.
Mean volatile compound group retention time and relevance index by packaging treatment.
| | Treatment | |
|---|
Compound
Group | PVC | VP | VSP | Sensory Descriptors 3 |
|---|
| RT 1 | RI 2 | RT 1 | RI 2 | RT 1 | RI 2 |
|---|
| Aldehyde | 35.91 | 93.13 | 35.18 | 91.39 | 36.13 | 91.56 | Pungent |
| Alkane | 52.64 | 90.85 | 56.12 | 91.46 | 53.74 | 90.31 | Meaty |
| Hydrocarbon | 44.76 | 94.21 | 60.38 | 90.43 | 36.43 | 91.08 | Aldehydic; fatty |
| Sulfur | 39.29 | 92.96 | 33.08 | 91.82 | 29.98 | 89.86 | Cabbage; putrid |
| Furan | 63.46 | 92.78 | 61.21 | 91.99 | 62.87 | 90.89 | Metallic |
| Ketone | 41.19 | 89.07 | 36.58 | 94.56 | 30.61 | 94.36 | Fruity |
| Terpene | 63.25 | 93.07 | 67.51 | 91.76 | 66.38 | 89.79 | Terpenic |
| Ester | 41.35 | 93.37 | 32.47 | 94.65 | 38.06 | 91.99 | Onion; pungent |
| Carboxylic | 44.04 | 90.43 | 29.60 | 88.45 | 27.19 | 91.72 | Sour; rancid |
| Alcohol | 38.87 | 89.47 | 36.19 | 88.69 | 31.99 | 91.63 | Pleasant; burnt |
