Article

The Role of CO2 Levels in High-Oxygen Modified Atmosphere Packaging on Microbial Communities of Chilled Goat Meat During Storage and Their Relationship with Quality Attributes

by
Samart Sai-Ut
1,
Sylvia Indriani
2,
Nattanan Srisakultiew
2,
Passakorn Kingwascharapong
3,
Sarisa Suriyarak
4,
Utthapon Issara
5,
Suphat Phongthai
6,
Saroat Rawdkuen
7 and
Jaksuma Pongsetkul
2,*
1
Department of Food Science, Faculty of Science, Burapha University, Chonburi 20131, Thailand
2
School of Animal Technology and Innovation, Institute of Agricultural Technology, Suranaree University of Technology, Nakhon Ratchasima 30000, Thailand
3
Department of Fishery Products, Faculty of Fisheries, Kasetsart University, Bangkok 10900, Thailand
4
Department of Food Technology, Faculty of Food Science, Chulalongkorn University, Bangkok 10330, Thailand
5
Division of Food Science and Technology Management, Faculty of Science and Technology, Rajamangala University of Technology Thanyaburi, Pathum Thani 12110, Thailand
6
Faculty of Agro-Industry, Chiang Mai University, Chiang Mai 50200, Thailand
7
Food Science and Technology Program, School of Agro-Industry, Mae Fah Luang University, Chiang Rai 57100, Thailand
*
Author to whom correspondence should be addressed.
Foods 2025, 14(11), 1837; https://doi.org/10.3390/foods14111837
Submission received: 6 May 2025 / Revised: 14 May 2025 / Accepted: 20 May 2025 / Published: 22 May 2025

Abstract

:
This study investigated the influence of CO2 levels (20–40%: M20, M30, and M40) in high-oxygen modified atmosphere packaging (Hi-O2 MAP) on microbial communities and quality attributes of chilled goat meat stored at 4 °C for 12 days. Alpha diversity indices (Chao1, ACE, Simpson, and Shannon) revealed a significant decline in microbial diversity over time, with storage duration exerting a greater impact than packaging conditions. Nonetheless, MAP played a crucial role in shaping microbial profiles, with air packaging (AP) showing the most distinct community, while M40 differed notably from M20 and M30, particularly by day 12, as shown by beta diversity analysis using principal coordinates analysis (PCoA). Proteobacteria and Firmicutes dominated microbial composition, with Pseudomonas and Brochothrix linked to spoilage in AP, while MAP, especially M40, favored the growth of Lactococcus, Acinetobacter, and Vagococcus, enhancing microbial stability. Despite pathogen levels remaining within safe limits, AP exceeded the spoilage threshold (TVC > 7.00 log colony-forming unit (CFU)/g), whereas all MAPs extended shelf life, with M40 most effectively suppressing microbial growth (p < 0.05). Interestingly, metagenomic functional profiling revealed that elevated CO2 levels (>30%) altered metabolic pathways, shifting spoilage mechanisms from protein degradation in AP to carbohydrate metabolism in MAP, potentially influencing odor and texture attributes. MAP, particularly M40, also reduced protein and lipid degradation and oxidation, as indicated by lower total volatile base nitrogen (TVB-N), thiobarbituric acid reactive substances (TBARSs), and shear force, suggesting better prevention of increased meat hardness and the development of undesirable odors and flavors, although high CO2 negatively affected redness. Overall, M40 provided the greatest microbial stability and shelf life extension, highlighting the potential of optimized CO2 levels in Hi-O2 MAP to preserve goat meat quality and regulate spoilage dynamics.

1. Introduction

Goat meat, valued for its leanness and distinct flavor, is widely consumed in Asia, Africa, and the Middle East [1]. Goat farming supports sustainable food systems, as goats efficiently convert low-quality feed and thrive in harsh environments, making them essential in rural areas [1,2]. Rising global demand reflects its nutritional benefits, with the goat population reaching 1.128 billion in 2020 [3]. However, goat meat is highly perishable, lasting only 6–12 days under chilled storage due to microbial and biochemical spoilage [4,5,6]. This short shelf life is largely due to microbial growth and biochemical deterioration, underscoring the need for effective preservation strategies to maintain quality and safety. Modified atmosphere packaging (MAP) is widely used to extend fresh meat shelf life by adjusting gas composition: O2 maintains color, CO2 inhibits microbial growth, and N2 prevents oxidation and package collapse [7]. High-oxygen MAP (Hi-O2 MAP), with 50–80% O2, is common for red meats to stabilize oxymyoglobin, giving the meat its bright red color [8], with 50% O2 considered optimal for balancing color retention and oxidation [9]. While O2’s role is well understood, optimal CO2 levels are less defined; 20–40% CO2 is generally effective for microbial control without risking package collapse, which may occur above 40% [10]. CO2 also modulates microbial community dynamics, influencing spoilage pathways and meat quality.
The gas composition in MAP plays a critical role in shaping bacterial succession, modifying microbial community structure and the characteristics of spoilage over time. Changes in packaging conditions can lead to distinct microbial shifts and spoilage outcomes. Under aerobic storage, Pseudomonas dominates and drives spoilage, whereas CO2-enriched or anaerobic conditions favor the growth of Gram-positive bacteria such as lactic acid bacteria (LAB) and B. thermosphacta [11]. Interestingly, despite being aerobic and CO2-sensitive, Pseudomonas has been shown to adapt to MAP environments, reaching high counts in minced beef and contributing to spoilage [12]. Spoilage microbiota developed in a somewhat unpredictable manner during storage, influenced by the differing metabolic activities of individual species [6]. However, the specific roles of these microbes remain unclear, highlighting the need for further investigation. High-throughput DNA sequencing has emerged as a powerful tool for analyzing microbial community dynamics, offering higher resolution than conventional culture-based methods [13]. While numerous studies have explored the impact of MAP on the microbiota of beef, pork, poultry and seafood [14,15,16,17], comparable studies on goat meat remains limited. Although Carrizosa et al. [11] identified Enterobacteriaceae as dominant in MAP-stored goat meat, their study did not explore long-term microbial succession or the relationship between microbial shifts and biochemical or physicochemical changes. Furthermore, the role of CO2 levels in shaping microbial communities under Hi-O2 MAP conditions and their subsequent effects on goat meat quality has not been extensively investigated. To address this gap, the present study utilized high-throughput DNA sequencing and metagenomic analysis to examine microbial metabolic pathways in goat meat stored in Hi-O2 MAP with varying CO2 concentrations (20%, 30%, and 40%) at 4 °C over a 12-day period. Additionally, principal component analysis (PCA) was performed to assess correlations between microbial profiles and key quality attributes, including color stability, lipid oxidation, pH, and texture. These integrated approaches aim to elucidate how CO2 levels influence microbial succession and spoilage mechanisms, ultimately helping to identify the optimal gas composition for maximizing the shelf life and quality of goat meat under Hi-O2 MAP conditions.

2. Materials and Methods

2.1. Chemicals

Peptone water (0.1%) and plate count agar (PCA) were obtained from Merck (Darm-stadt, Germany). Reagents for total volatile base nitrogen (TVB-N) analysis, including boric acid (H3BO3) and hydrochloric acid (HCl), were of analytical grade and purchased from Sigma-Aldrich (St. Louis, MO, USA). For lipid oxidation analysis, thiobarbituric acid (TBA) and malonaldehyde bis(dimethyl acetal) standards were also procured from Sigma-Aldrich. All other chemicals, including distilled water, were of analytical grade and used as required in the respective analytical procedures.

2.2. Sample Preparation and Packaging Conditions

Longissimus thoracis (LT) loin muscles were obtained from 39 male crossbred goats (Thai-native × Anglo-Nubian), aged between 6 and 8 months, with carcass weights ranging from 9.95 to 12.41 kg. The animals were sourced from multiple commercial farms in Nakhon Ratchasima province and processed at a commercial slaughterhouse. After slaughter, the loins were immediately placed in an ice box maintained at −2 to 1 °C and transported to the laboratory within 1 h. Upon arrival, they were stored at 4 °C for 48 h. Surface fat and connective tissues were then trimmed off, and the loins were sliced into 1.5 cm-thick pieces, each weighing around 150–180 g, for subsequent packaging treatments. The experiment was conducted in three separate batches, each containing 13 goat loin samples. From each batch, 65 slices were prepared. Five slices were retained as Day 0 samples for analysis, while the remaining 60 slices were divided into 4 treatment groups (15 pieces/treatment) and packed under different MAP conditions. We performed MAP condition using a Henkovac type 1000 (Tecnovac, Grassobbio, Italy) with a gas mixture including M20: 20% CO2/50% O2/30% N2, M30: 30% CO2/50% O2/20% N2, and M40: 40% CO2/50% O2/10%, with an air-packed group serving as the control (AP). For packing, each meat slice was individually placed on a polyethylene terephthalate (PET) tray (18 × 13 × 4 cm3 with a thickness of 0.25 mm), with O2, N2, and CO2 permeability values of 2.5, 2.5, and 45 cm3/m2·day·atm, respectively, and a water vapor permeability of <1 g/m2·day (85% RH, 25 °C). The desired gas mixtures were introduced into the trays, maintaining a gas-to-meat volume ratio of 3:1. The trays were then sealed using a multilayer polyamide (PA)/ethylene vinyl alcohol (EVOH) MAP film (O2 transmission rate <1 cm3/m2·day·atm; Greenpak, Jiangyin, China) using a Henkovac tray sealer (Type 1000, Tecnovac, Grassobbio, Italy). During storage at 4 °C for 12 days, samples were collected for analysis on Days 0 (D0), 6 (D6), and 12 (D12).

2.3. Determination of Microbial Community (Microbiome Analysis)

Genomic DNA was isolated from three samples per treatment group using the FavorPrep Stool DNA Isolation Mini Kit (Favorgen, Ping-Tung, Taiwan), following the manufacturer’s instructions. DNA quality was evaluated via 1% agarose gel electrophoresis, and concentrations were determined using a NanoDrop 2000 spectrophotometer (NanoDrop Technologies, Wilmington, DE, USA). Library preparation, sequencing, and bioinformatics analyses were carried out by Novogene (Beijing, China). In total, seven DNA libraries were constructed to amplify the V3–V4 regions of the 16S rRNA gene. Following library preparation, DNA quantification was performed using the Qubit dsDNA HS Reagent Kit, and sequencing was conducted on the Illumina HiSeq 2500 platform (Illumina Inc., San Diego, CA, USA) with 2 × 250 bp paired end reads, adhering to standard protocols. Raw sequencing reads were quality-filtered and processed using Mothur software (Version 1.48.0, University of Michigan, Ann Arbor, MI, USA) [18] to remove low-quality reads and chimeras. Operational taxonomic units (OTUs) were classified based on the Greengenes database (Version 13_8) at 97% similarity. Rarefaction curves were generated to evaluate sequencing depth and species richness in each sample. The alpha diversity (Chao1, Simpson, and Shannon indices) were estimated and tested using the Mann–Whitney test (nonparametric t-test) with a 95% level of confidence. Principal Coordinates Analysis (PCoA), Venn diagrams, and hierarchically clustered dendrogram were conducted to examine the similarities or differences of the microbiome across various treatments. Graphical representation of the relative abundance of microbial diversity was visualized using the ampvis2 R-package in RStudio (Version 2023.12.0, Boston, MA, USA). Functional gene prediction of microbial communities was carried out using the retained OTUs from the predicted metagenomes through the PICRUSt tool (Version 1.1.4) [19]. The predicted genes were then assigned to biological functions based on the Kyoto Encyclopedia of Genes and Genomes (KEGG) pathway database (Kyoto, Japan) (http://www.kegg.jp/kegg/pathway.html, accessed on 15 January 2025).

2.4. Determination of Total Viable Count (TVC) and Pathogen

For TVC, a 25 g of each sample was mixed with 225 mL of 0.1% peptone water and homogenized at high speed for 3 min using a Stomacher 400 Lab Blender (Seward Ltd., Worthing, UK). Serial tenfold dilutions were then prepared, and the appropriate dilutions were plated on Plate Count Agar (Merck, Rahway, NJ, USA). The plates were incubated at 37 °C for 3 days, and results were expressed as colony-forming unit (CFU)/g sample [20]. For pathogens, Escherichia coli, Staphylococcus aureus, Clostridium perfringens, Salmonella spp., and Campylobacter jejuni, were counted following the Thai agricultural commodity and food standard (ACFS, Bangkok, Thailand) [21].

2.5. Determination of Quality Attributes

The pH was measured by blending 10 g of ground sample with 100 mL of distilled water, using a pH meter (Sartorius, Model PB-10, Göttingen, Germany). Redness (a*) was measured at seven different spots on the sample using a chromameter (Konica Minolta, Model CR-410, Tokyo, Japan). Total volatile base nitrogen (TVB-N) content was measured using the Conway microtitration method and reported as mg N/g sample [22]. Lipid oxidation was determined using the thiobarbituric acid reactive substances (TBARSs) method described by Pongsetkul et al. [23]. A standard curve was prepared using malonaldehyde bis(dimethyl acetal) at concentrations ranging from 0 to 2 ppm. TBARS values were expressed as mg of malonaldehyde (MDA)/kg sample. Shear force was assessed using a Texture Analyzer (Stable Micro Systems, Model TA.XT Plus, Surrey, UK). Samples were cut into cubes measuring 1 × 2 × 1 cm3, with muscle fibers aligned along the longitudinal axis. A Warner–Bratzler blade was used for the test, operated at a speed of 4 mm/s with a 50 kg load cell [24].

2.6. Statistical Analysis

A completely randomized design (CRD) was applied, with three independent batches allocated to each treatment group. Each batch was processed and analyzed separately to ensure true replication. Results are presented as mean ± standard deviation. Statistical analysis was conducted using two-way analysis of variance (ANOVA), followed by Tukey’s post-hoc test to identify significant differences among treatment means at a 95% confidence level, using SPSS software (Version 25.0, IBM Corp., Chicago, IL, USA). Additionally, principal component analysis (PCA) was performed using XLSTAT software (Version 2018.7, Addinsoft, New York, NY, USA) to explore the associations between dominant microbial communities and key quality parameters of samples stored under different MAP conditions.

3. Results and Discussion

3.1. Dynamic Changes in Microbial Communities During Storage

3.1.1. Microbial Richness and Diversity in Goat Meat Stored Under Map Conditions

To gain a clear understanding of changes microbial diversity and abundance under MAP conditions, high-throughput sequencing of bacterial communities in chilled goat meat was performed using the Illumina MiSeq platform. A total of 488,780 high-quality reads were obtained across seven libraries, with read counted from 49,299 to 57,340 reads (Table 1). These sequences were clustered into 3737 OTUs and classified into 47 phyla, 101 classes, 299 orders, 472 families, 889 genera, and 1253 species based on the Greengenes database at a 97% similarity threshold (Table S1). Sequencing depth exceeded 97% coverage for all samples, indicating comprehensive detection of bacterial populations (Table 1).
Alpha diversity indices, including Chao1, ACE, Simpson, and Shannon, were used to assess microbial richness and evenness within individual samples. At Day 0, fresh goat meat exhibited the highest microbial richness and diversity, with the highest OTU count (492), Chao1 (922), Simpson (0.96), and Shannon (6.02) values, suggesting a more diverse microbial population compared to samples during storage. Over time, microbial richness and diversity declined at varying rates among the samples. Interestingly, the AP sample showed a sharper drop in OTUs, decreasing to 366 by Day 12, yet it retained higher Chao1, ACE, and Simpson values compared to MAP samples. This rapid drop in OTUs, coupled with sustained high diversity indices, suggested that AP initially harbored many rare taxa, which were lost over time, while a stable and even microbial community persisted during storage under atmospheric conditions. Under MAP conditions, microbial diversity was generally suppressed. M20 and M30 showed lower richness than M40 on both Day 6 and Day 12, as indicated by lower alpha diversity indices. This suggested that 20–30% CO2 selectively inhibited bacterial growth, whereas 40% CO2 might have supported the development of distinct microbial communities. Moreover, the results showed that M40 exhibited higher or comparable microbial evenness to AP, as reflected by similar or higher Shannon and Simpson indices, both of which were greater than those of M20 and M30. This indicated that M40 supported a more balanced microbial community, which may help slow spoilage. Although storage time was the primary factor influencing microbial changes, packaging conditions, especially higher CO2 levels in M40, also played a significant role. These conditions likely shaped microbial dynamics by regulating bacterial succession and spoilage pathways, thereby potentially extending shelf life [14,25]. Similar to our findings, Chen et al. [26] reported that Firmicutes and Bacteroidetes dominated in fermented goat sausage, accounting for over 66% of all OTUs, with microbial diversity decreasing over time. A similar trend of declining microbial diversity has also been observed in various meat products such as portly, oysters, bacon and beef [13,14,16,17], where specific packaging conditions favored certain bacterial groups, leading to shifts in microbial communities.
Beta diversity, which refers to the difference in species composition between samples, was assessed using PCoA, revealing distinct clustering patterns that explained 74.59% of the total variation (Figure 1A). PC1 (53.26%) showed a clear separation between AP samples from Day 6 and Day 12 (left side) and all MAP samples (right side), emphasizing the dominant effect of packaging on microbial composition. This suggested that packaging plays a critical role in shaping microbial communities, which in turn impacts meat quality and safety. Microbial composition of AP deviated the most from Day 0, as early as Day 6, suggesting that rapid spoilage and quality changes occurred in meat stored under atmospheric conditions, while all MAP treatments were more effective at retarding these changes. These findings align with previous reports demonstrating that MAP can slow microbial succession compared to aerobic conditions [25,27,28]. PC2 (21.33%) reflected the influence of storage time, as Day 12 samples positioned in the upper region, while earlier samples remained in the lower region. Interestingly, M20 and M30 samples exhibited close clustering with minimal dispersion, suggesting similar microbial communities and reduced diversity over time. In contrast, M40 samples showed greater variation, indicating a more dynamic shift in microbial communities during storage, which may correspond to their distinct quality attributes under 40% CO2 conditions. The Venn diagram (Figure 1B) further supported these observations, illustrating shared and unique OTUs among different storage days. On Day 6, 204 OTUs were common across all samples, but this number declined to 160 by Day 12, suggesting that microbial shifts depend on packaging conditions due to extended storage. Remarkably, AP samples exhibited the highest number of unique OTUs on Day 6, but by Day 12, they had the lowest, reinforcing the idea that microbial communities in MAP samples remained more stable over time.

3.1.2. Microbial Community Composition and Abundance

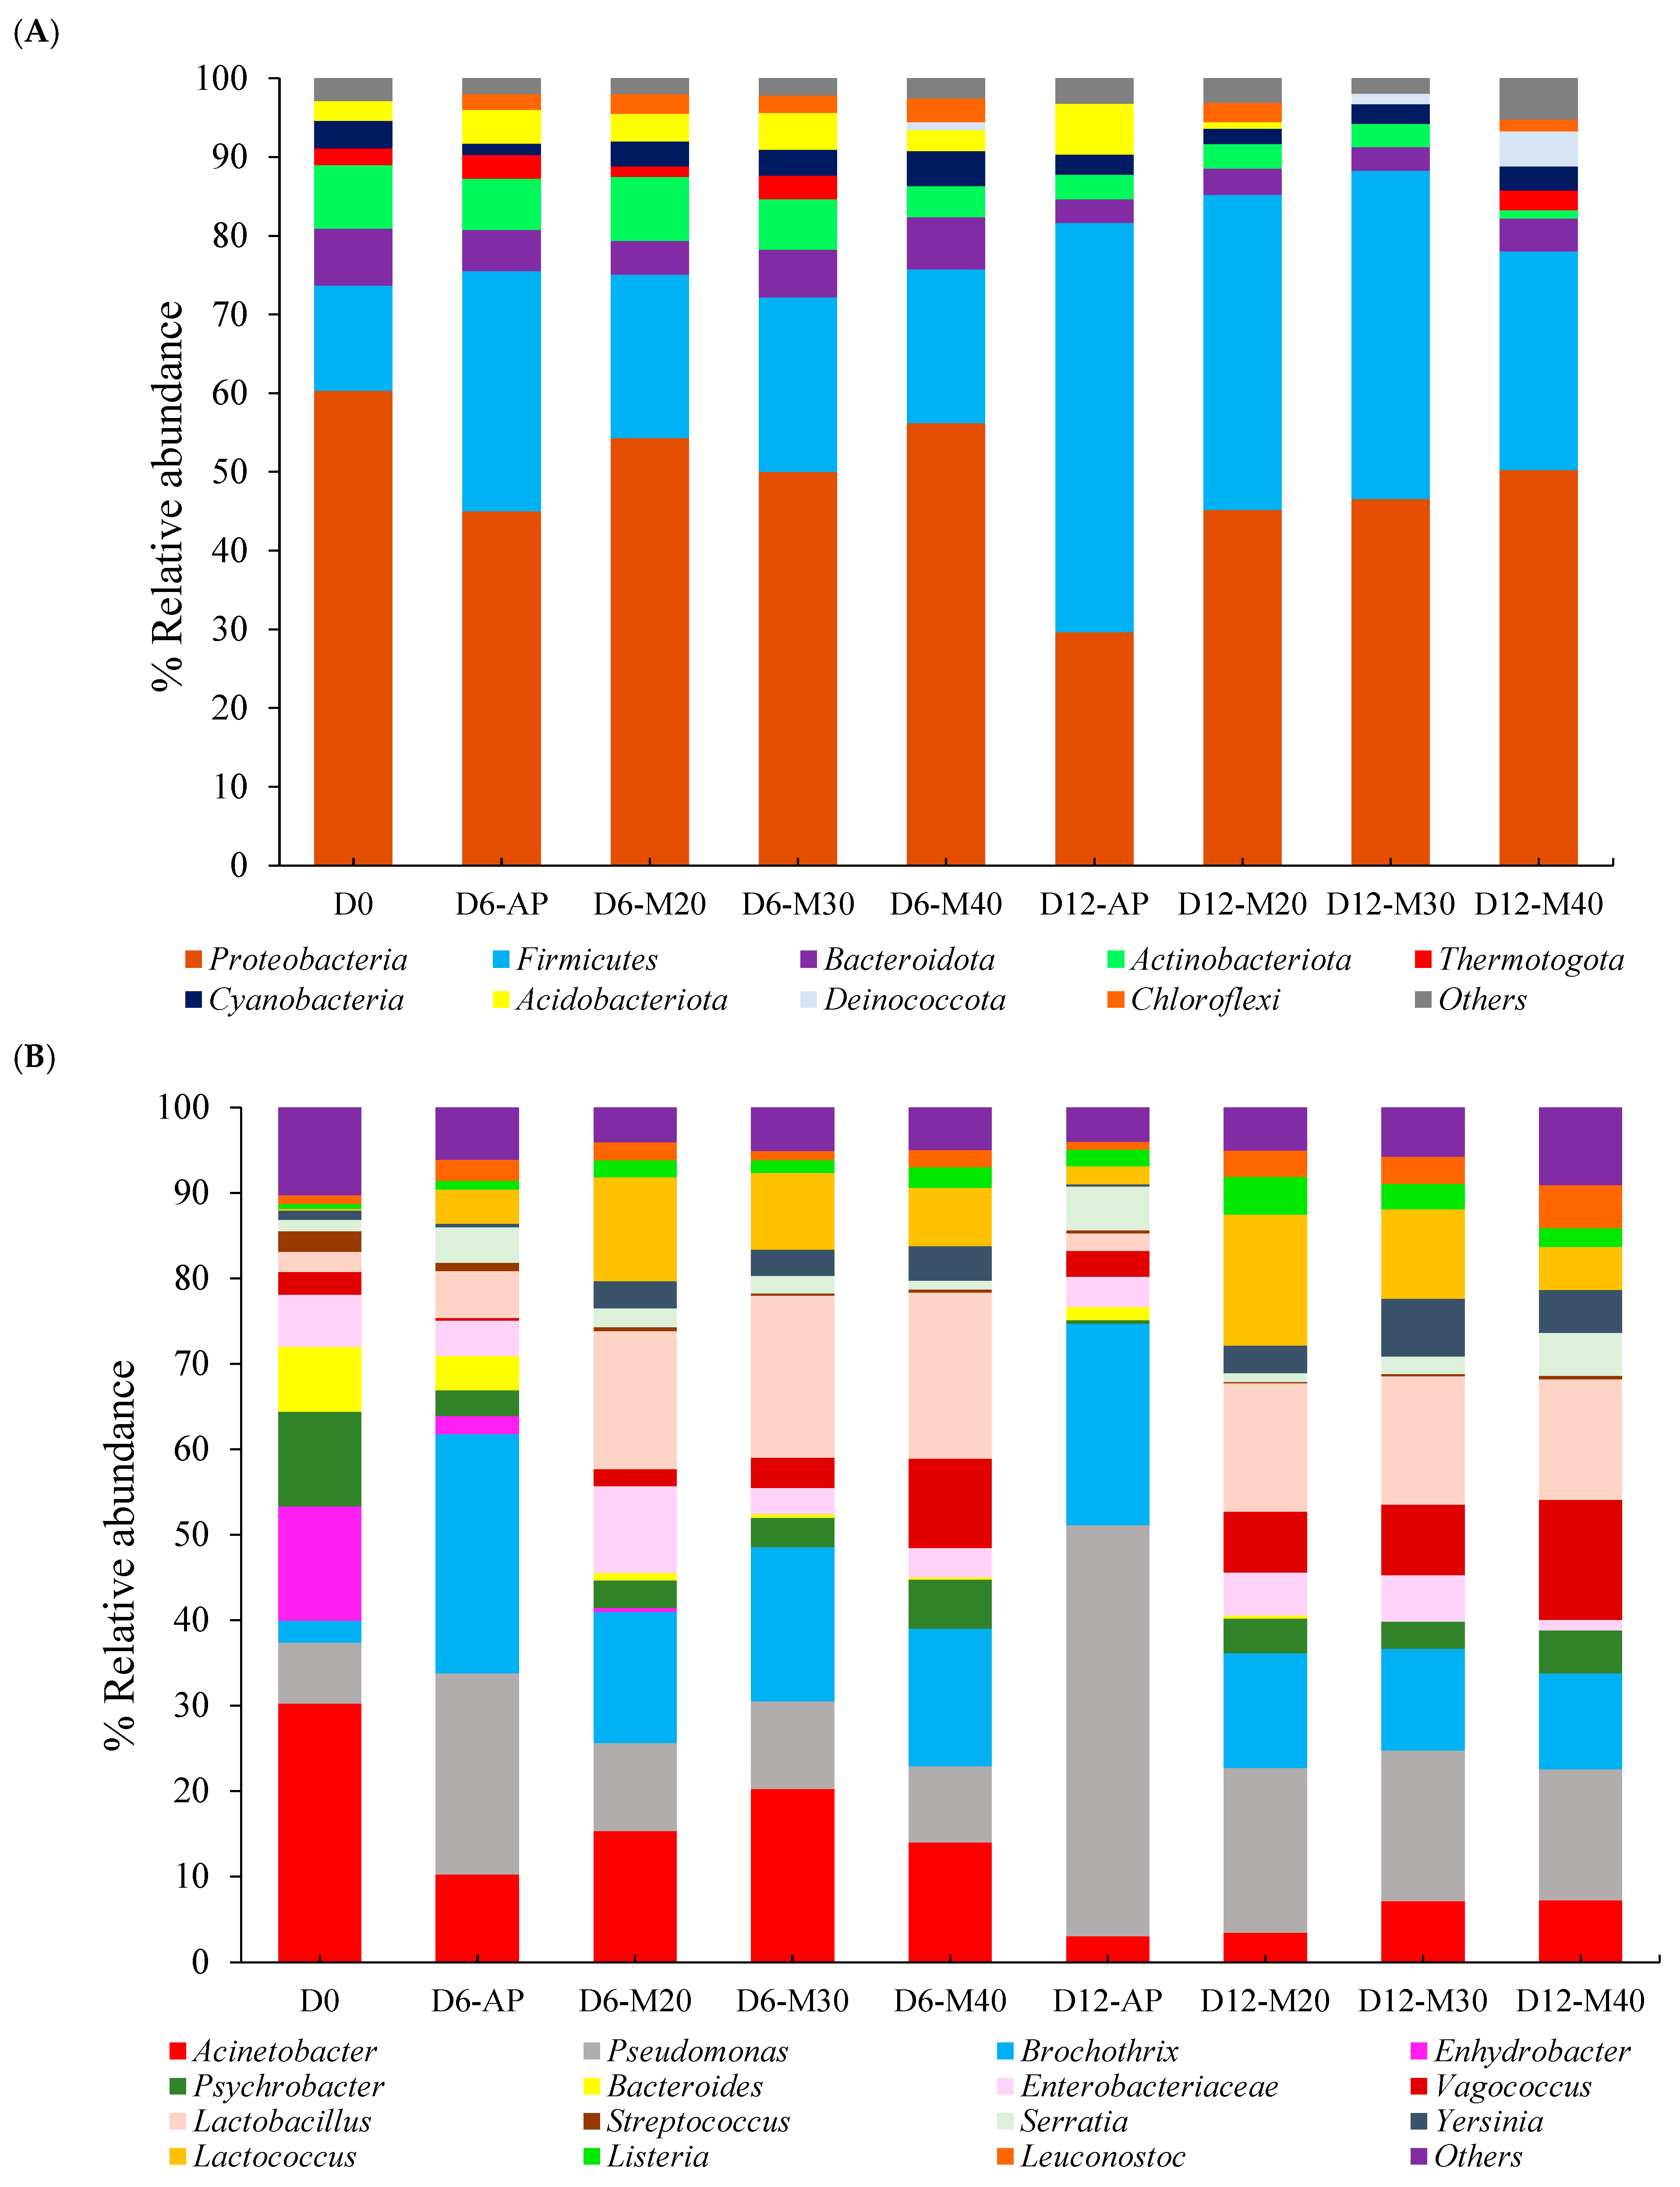
At the phylum level (Figure 2A), Proteobacteria was the dominant phylum in all samples (>45%), except for AP on Day 12, where its abundance decreased to 29.63%, while Firmicutes became predominant (51.99%). Together, these two phyla accounted for over 70% of all bacterial communities, with their relative abundances influenced by packaging conditions and storage duration. This pattern was consistent with previous studies that identified them as the primary microbial groups in both fresh and spoiled meat [13,14,17]. A notable shift between these two phyla was observed over time, with Proteobacteria decreasing and Firmicutes increasing, particularly in AP samples. This trend suggested a microbial succession process, where spoilage conditions favor Firmicutes, while the decline in Proteobacteria may indicate a reduction in spoilage-related bacteria commonly associated with aerobic conditions. In this study, AP contained lower oxygen levels than MAPs (50% O2), which likely accelerated the growth of Firmicutes, as this phylum generally thrives under anaerobic conditions. It includes many anaerobic or facultatively anaerobic bacteria, such as Clostridium and Lactobacillus, that are well adapted to low-oxygen environments, especially during meat storage and spoilage [29]. In MAP samples, the proportion of Firmicutes also increased over time, though at a slower rate, particularly in M40. Yang et al. [14] reported a significant increase in Firmicutes under both high-O2 MAP (80% O2/20% CO2) and high-CO2 MAP (0.4% CO/30% CO2/69.6% N2), indicating beef steak spoilage. This increase was attributed to the outgrowth of the dominant genera Brochothrix thermosphacta and Lactococcus under each condition, respectively. These findings support our results, suggesting that the lower increase of Firmicutes observed in M40 may reflect a slower spoilage rate in goat meat under this condition. Other phyla, such as Bacteroidota, Actinobacteria, and Thermotogota, were initially detected in fresh goat meat (Day 0) but declined or disappeared in certain packaging treatments over time. In contrast, Deinococcota increased in M40, suggesting a potential adaptation to high-CO2 conditions. By Day 12, M40 had the lowest abundance of Acidobacteriota compared to the other treatments. Notably, M40 also exhibited the highest proportion of other bacterial phyla (5.23%), indicating a more diverse and distinct microbial community. This may reflect the unique influence of 40% CO2 in shaping the microbial profile, potentially affecting meat quality during storage, distinct from the effects observed with 20–30% CO2 or atmospheric conditions.
At the genus level (Figure 2B), microbial diversity was highest in fresh goat meat (Day 0) and declined with storage. The microbial profiles of AP samples were distinct from MAP samples, reinforcing the influence of packaging over time. Acinetobacter was the most dominant genus in fresh meat (30.22%) but declined as storage progressed, regardless of packaging conditions (3.07–7.22% on Day 12). This aerobic bacterium is often associated with fresh meat but is less competitive under storage conditions that favor anaerobic or facultative anaerobic bacteria [30]. In contrast, Pseudomonas and Brochothrix were initially present at lower levels (7.16% and 2.55%, respectively) but increased over time, particularly in AP. By Day 12, Pseudomonas accounted for 48.02% of the AP microbial community, highlighting its role as a dominant spoilage bacterium under aerobic conditions. This aligned with previous studies showing that Pseudomonas is a key contributor to spoilage in meat stored under air due to its proteolytic and lipolytic activity, which accelerates quality deterioration [10,31,32]. The lower abundance of Pseudomonas in MAP suggested that CO2 can effectively suppress its growth, thus extending shelf life. Interestingly, Brochothrix became highly abundant in AP from Day 6 onward, whereas MAP selectively promoted the growth of Lactobacillus and Lactococcus, which remained above 10% and 5%, respectively, throughout storage. The consistent presence of Lactobacillus in MAP samples suggested a beneficial role in meat preservation, as it can outcompete spoilage bacteria and produce antimicrobial metabolites that help maintain meat quality, particularly in terms of flavor and odor. These LAB are commonly found in MAP meat products and contribute to quality preservation by producing organic acids that inhibit spoilage microorganisms [33]. Their presence is often associated with improved odor and flavor stability due to reduced proteolysis and lipid oxidation [34]. Furthermore, the suppression of B. thermosphacta, a bacterium commonly linked to off-odors in meat, highlighted the superior ability of MAPs, particularly with higher CO2 concentrations, to preserve flavor and limit spoilage. Notably, by Day 12, the microbial composition of M40 was distinctly different from that of M20 and M30. M40 exhibited lower levels of Lactococcus but higher abundances of Vagococcus (14.06%), Psychrobacter (5.02%), and Leuconostoc (4.99%). While Leuconostoc is often linked to LAB-driven fermentation and improved sensory attributes, Psychrobacter has been linked to off-odors and spoilage under cold storage [16]. The presence of Vagococcus in M40 suggested a shift in microbial dynamics that may influence both beneficial and undesirable quality traits [35]. These results confirmed a unique microbial pattern associated with the increase in CO2 to 40% in high-O2 MAP, which may contribute to distinct changes in meat quality during storage. Furthermore, it also highlighted the importance of CO2 levels in regulating the microbial pattern to preserve meat quality.
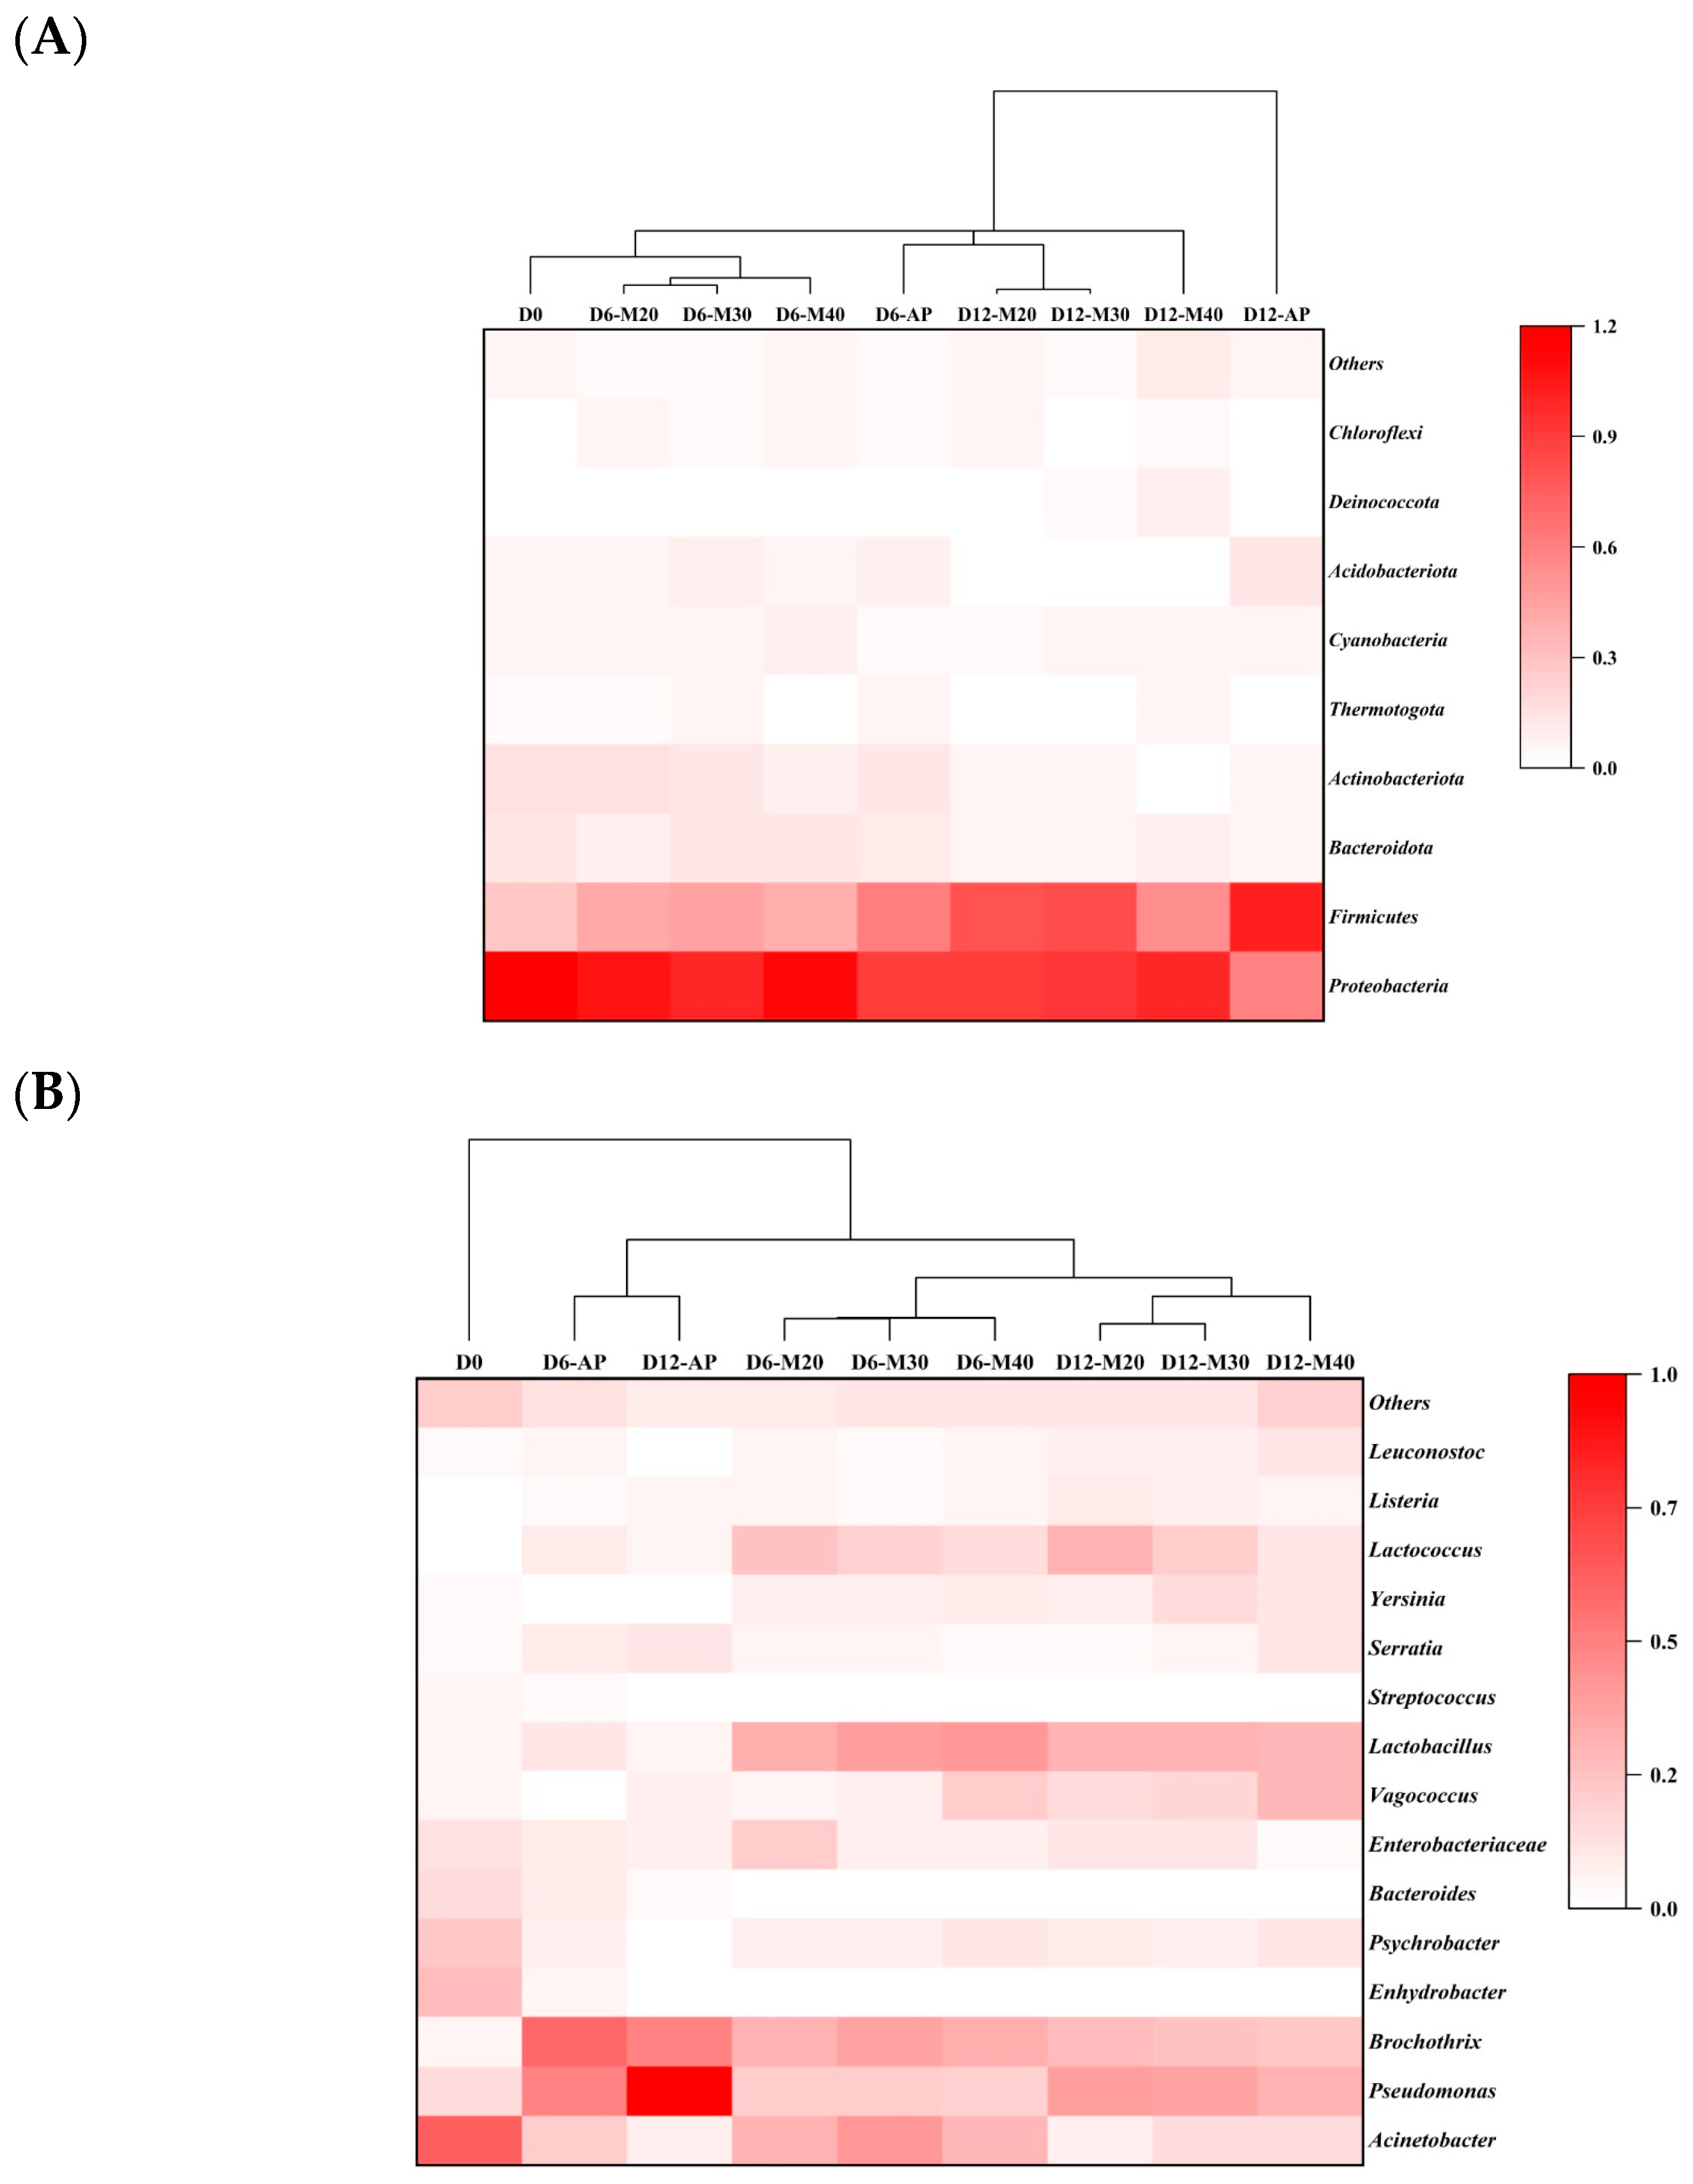
The hierarchical clustering dendrograms at both the phylum and genus levels are shown in Figure 3A and Figure 3B, respectively. The correlation dendrogram confirmed distinct microbial distributions that were strongly influenced by packaging. Notably, D0 was clearly separated from the others, while within the remaining samples, all MAP samples clustered together, and AP samples exhibited unique microbial patterns. In particular, two phyla including Proteobacteria and Firmicutes, along with ten genera, including Acinetobacter, Pseudomonas, Brochothrix, Enterobacteriaceae, Vagococcus, Lactobacillus, Serratia, Yersinia, Lactococcus, and others, showed high abundance (intensity > 0.3 or abundance > 5%) in at least one sample on Day 12 of storage, suggesting their potential for differentiating the microbial communities among samples. These twelve microbial taxa were therefore selected for correlation analysis with quality attributes.

3.1.3. Metagenomic Functional Profiling

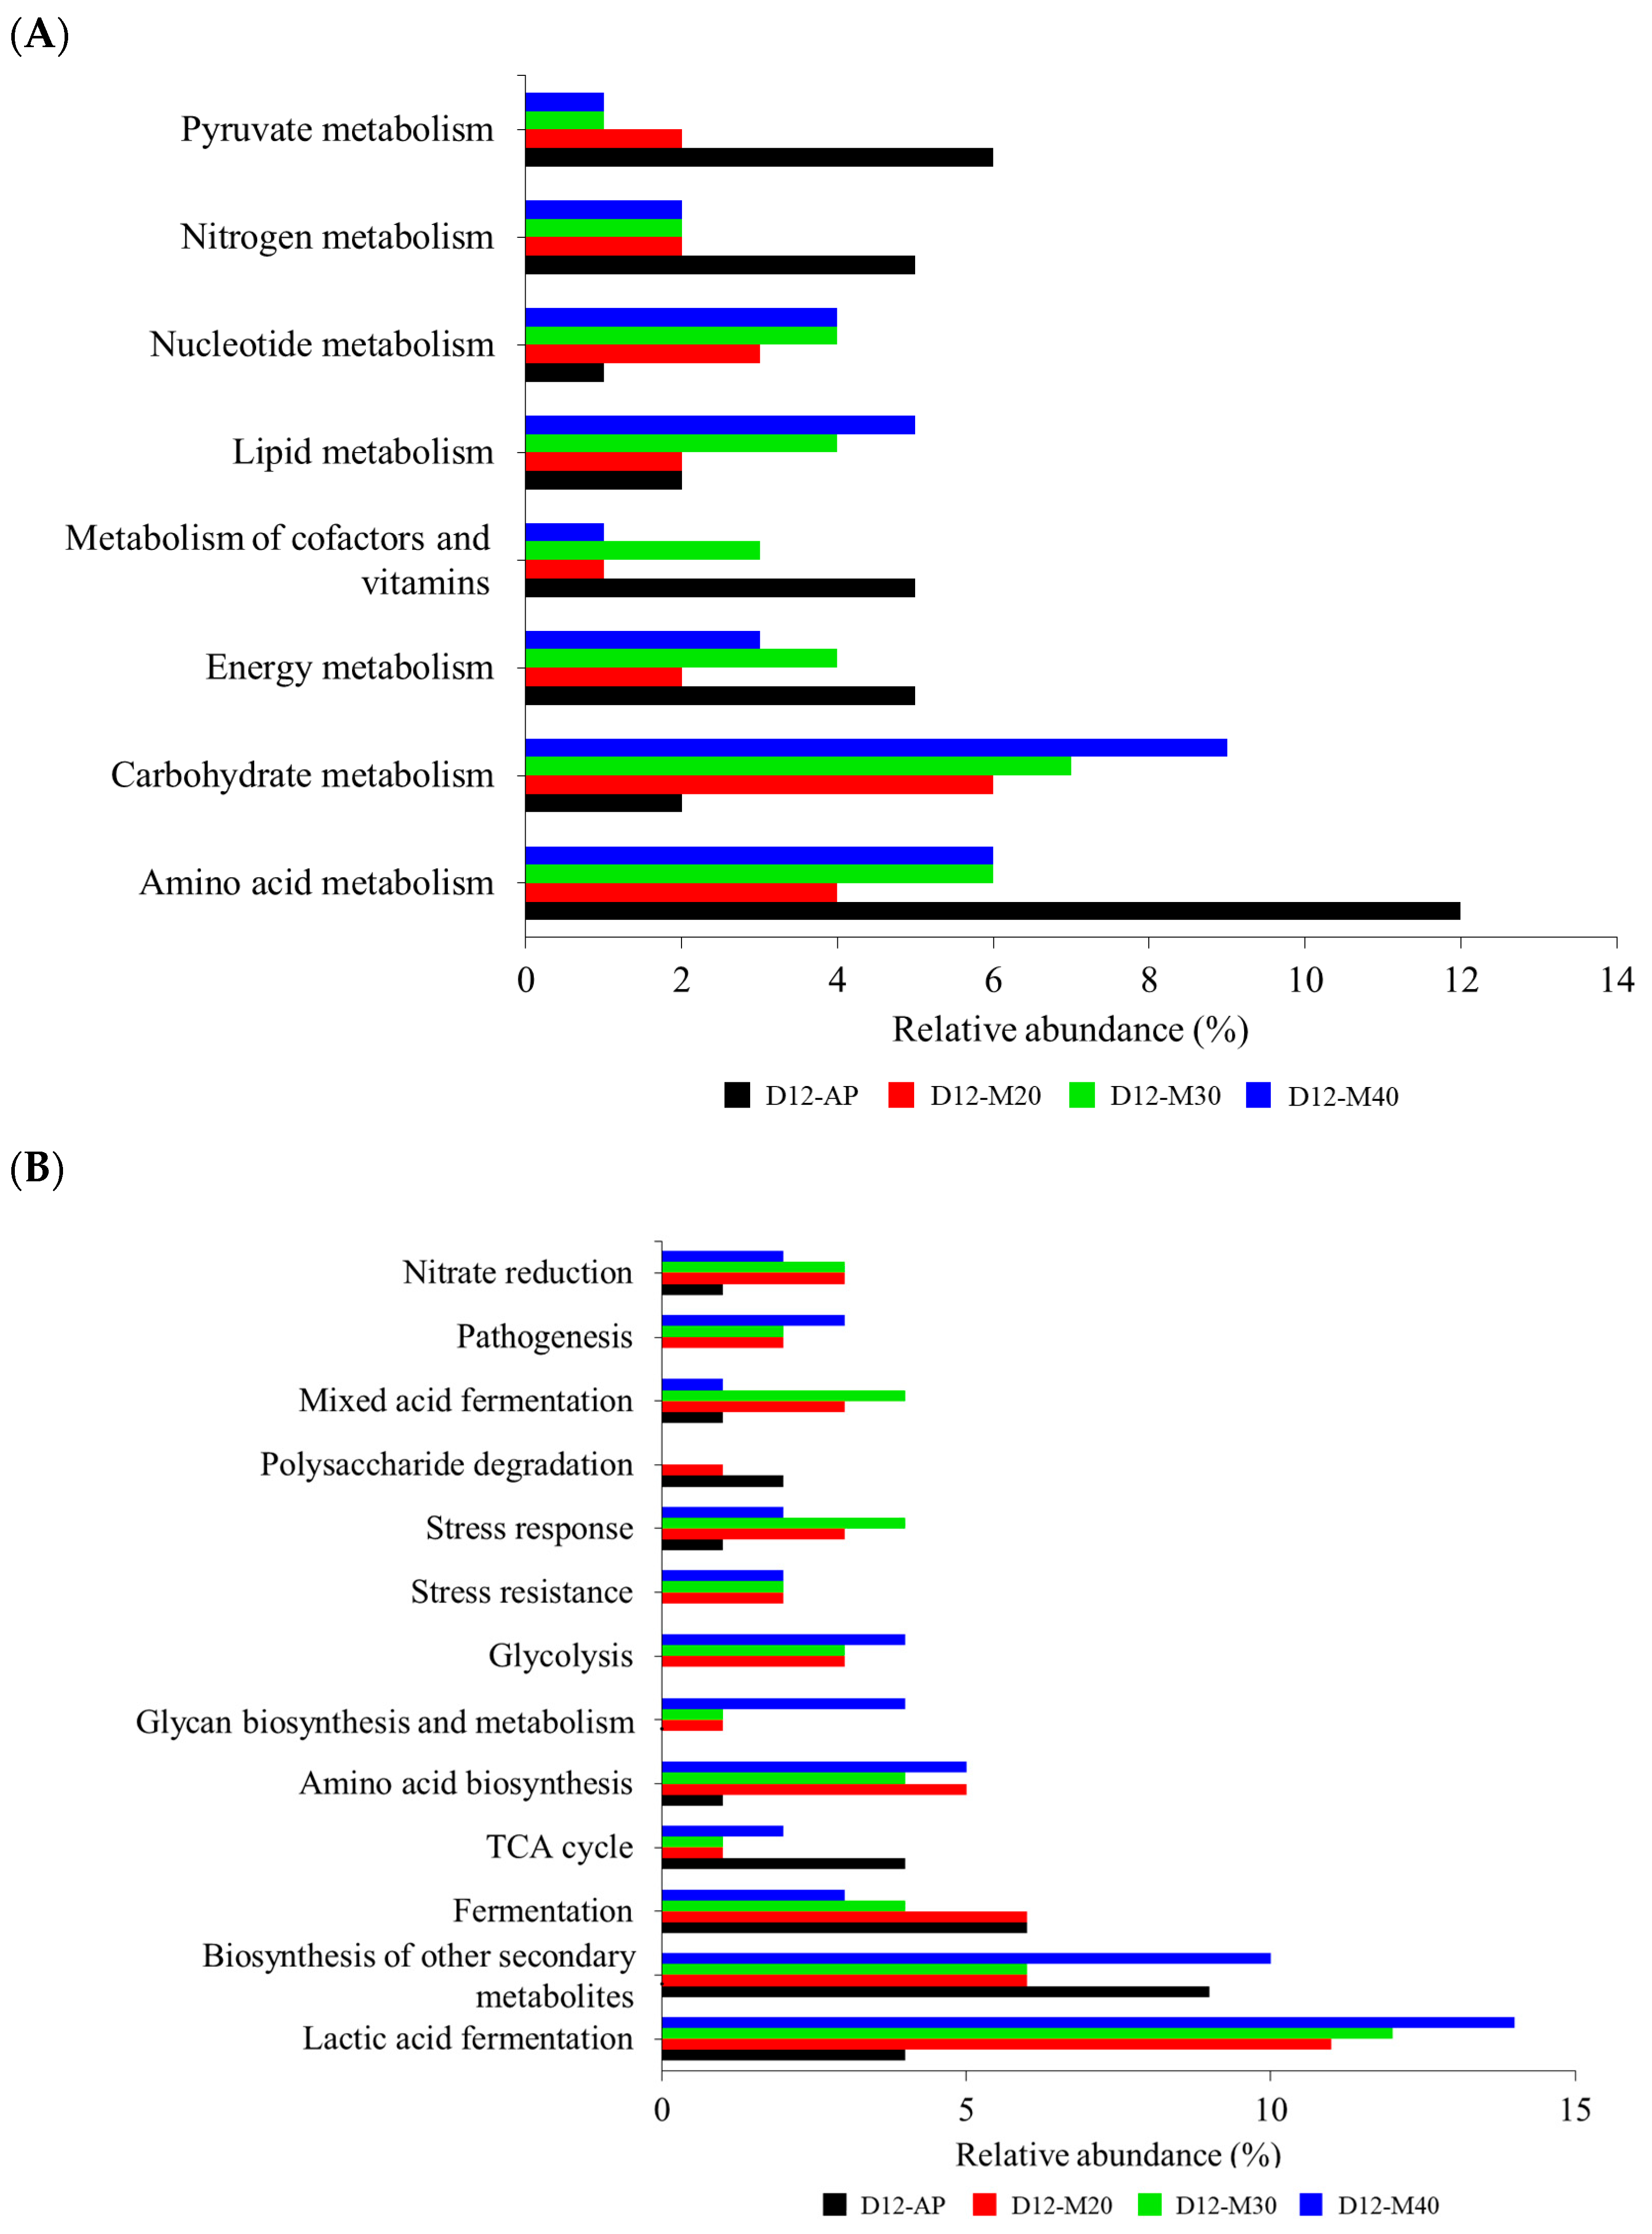
To gain deeper insights into microbial patterns under different packaging treatments, particularly their impact on molecular pathways involved quality changes, functional gene analysis was performed using microbial profiles from Day 12. The shelf life of meat is influenced not only by the total bacterial load but also by microbial metabolic activity, as spoilage is primarily driven by the accumulation of degradation compounds [36]. Thus, understanding bacterial metabolic pathways through predicted 16S rRNA sequencing functions is essential. Figure 4A and Figure 4B revealed functional genes related to microbial metabolism and other biological functions, respectively. The AP and MAP samples exhibited distinct metabolic profiles, with AP showing dominant pathways in amino acid metabolism (12%), secondary metabolite biosynthesis (9%), and pyruvate metabolism (6%), consistent with spoilage mechanisms under normal air conditions. In AP packaging, O2 exposure combined with low CO2 levels promotes the growth of aerobic spoilage bacteria such as Pseudomonas, Acinetobacter, and Shewanella, which rely on proteolysis and oxidative metabolism for survival [37]. These metabolic pathways are closely linked to proteolytic activity, with Pseudomonas, the predominant genus in AP, utilizing amino acid degradation for energy and producing nitrogenous spoilage compounds such as ammonia and biogenic amines [38]. The high availability of proteins and amino acids in meat supports these metabolic activities by serving as an optimal nutrient source [39]. These findings suggested that AP facilitates spoilage primarily through protein and amino acid degradation. Conversely, MAP samples exhibited dominant pathways in lactic acid fermentation (11–14%) and carbohydrate metabolism (6–9%), likely due to increased prevalence of LAB such as Lactobacillus, which ferment carbohydrates into organic acids. This metabolic shift can lower pH, suppress spoilage bacteria, and influence meat texture and flavor [40]. As is typical in MAP systems, the presence of CO2 in all high-O2 MAP treatments used in this study suppressed anaerobic competitors, allowing O2-tolerant species to dominate the microbial community and accelerate spoilage in the manner distinct from that observed under normal air packaging. This was reflected in the detection of pathways related to lipid metabolism, nitrate reduction, pathogenesis, stress response and resistance, glycolysis, glycan biosynthesis and metabolism, as well as amino acid biosynthesis, which were found at higher levels in MAP samples and were either absent or barely detectable in AP samples. Notably, among MAP treatments, M40 favored carbohydrate metabolism and glycolysis, likely due to CO2-induced stress altering microbial metabolism. In contrast, M20 and M30 exhibited more dominant pathways in mixed acid fermentation and stress response, suggesting microbial adaptation to CO2 enrichment. The results suggested that AP promoted spoilage through proteolytic activity and amino acid degradation, while MAP (particularly with higher CO2 levels) mitigated these effects by favoring carbohydrate metabolism and stress-related pathways, depending on CO2 levels. Not only did MAP extend shelf life by inhibiting total microbial growth, but its metabolic byproducts could also impact meat quality, warranting further investigation into sensory and physicochemical implications.

3.2. Changes in TVC and Pathogen of Goat Meat During Storage

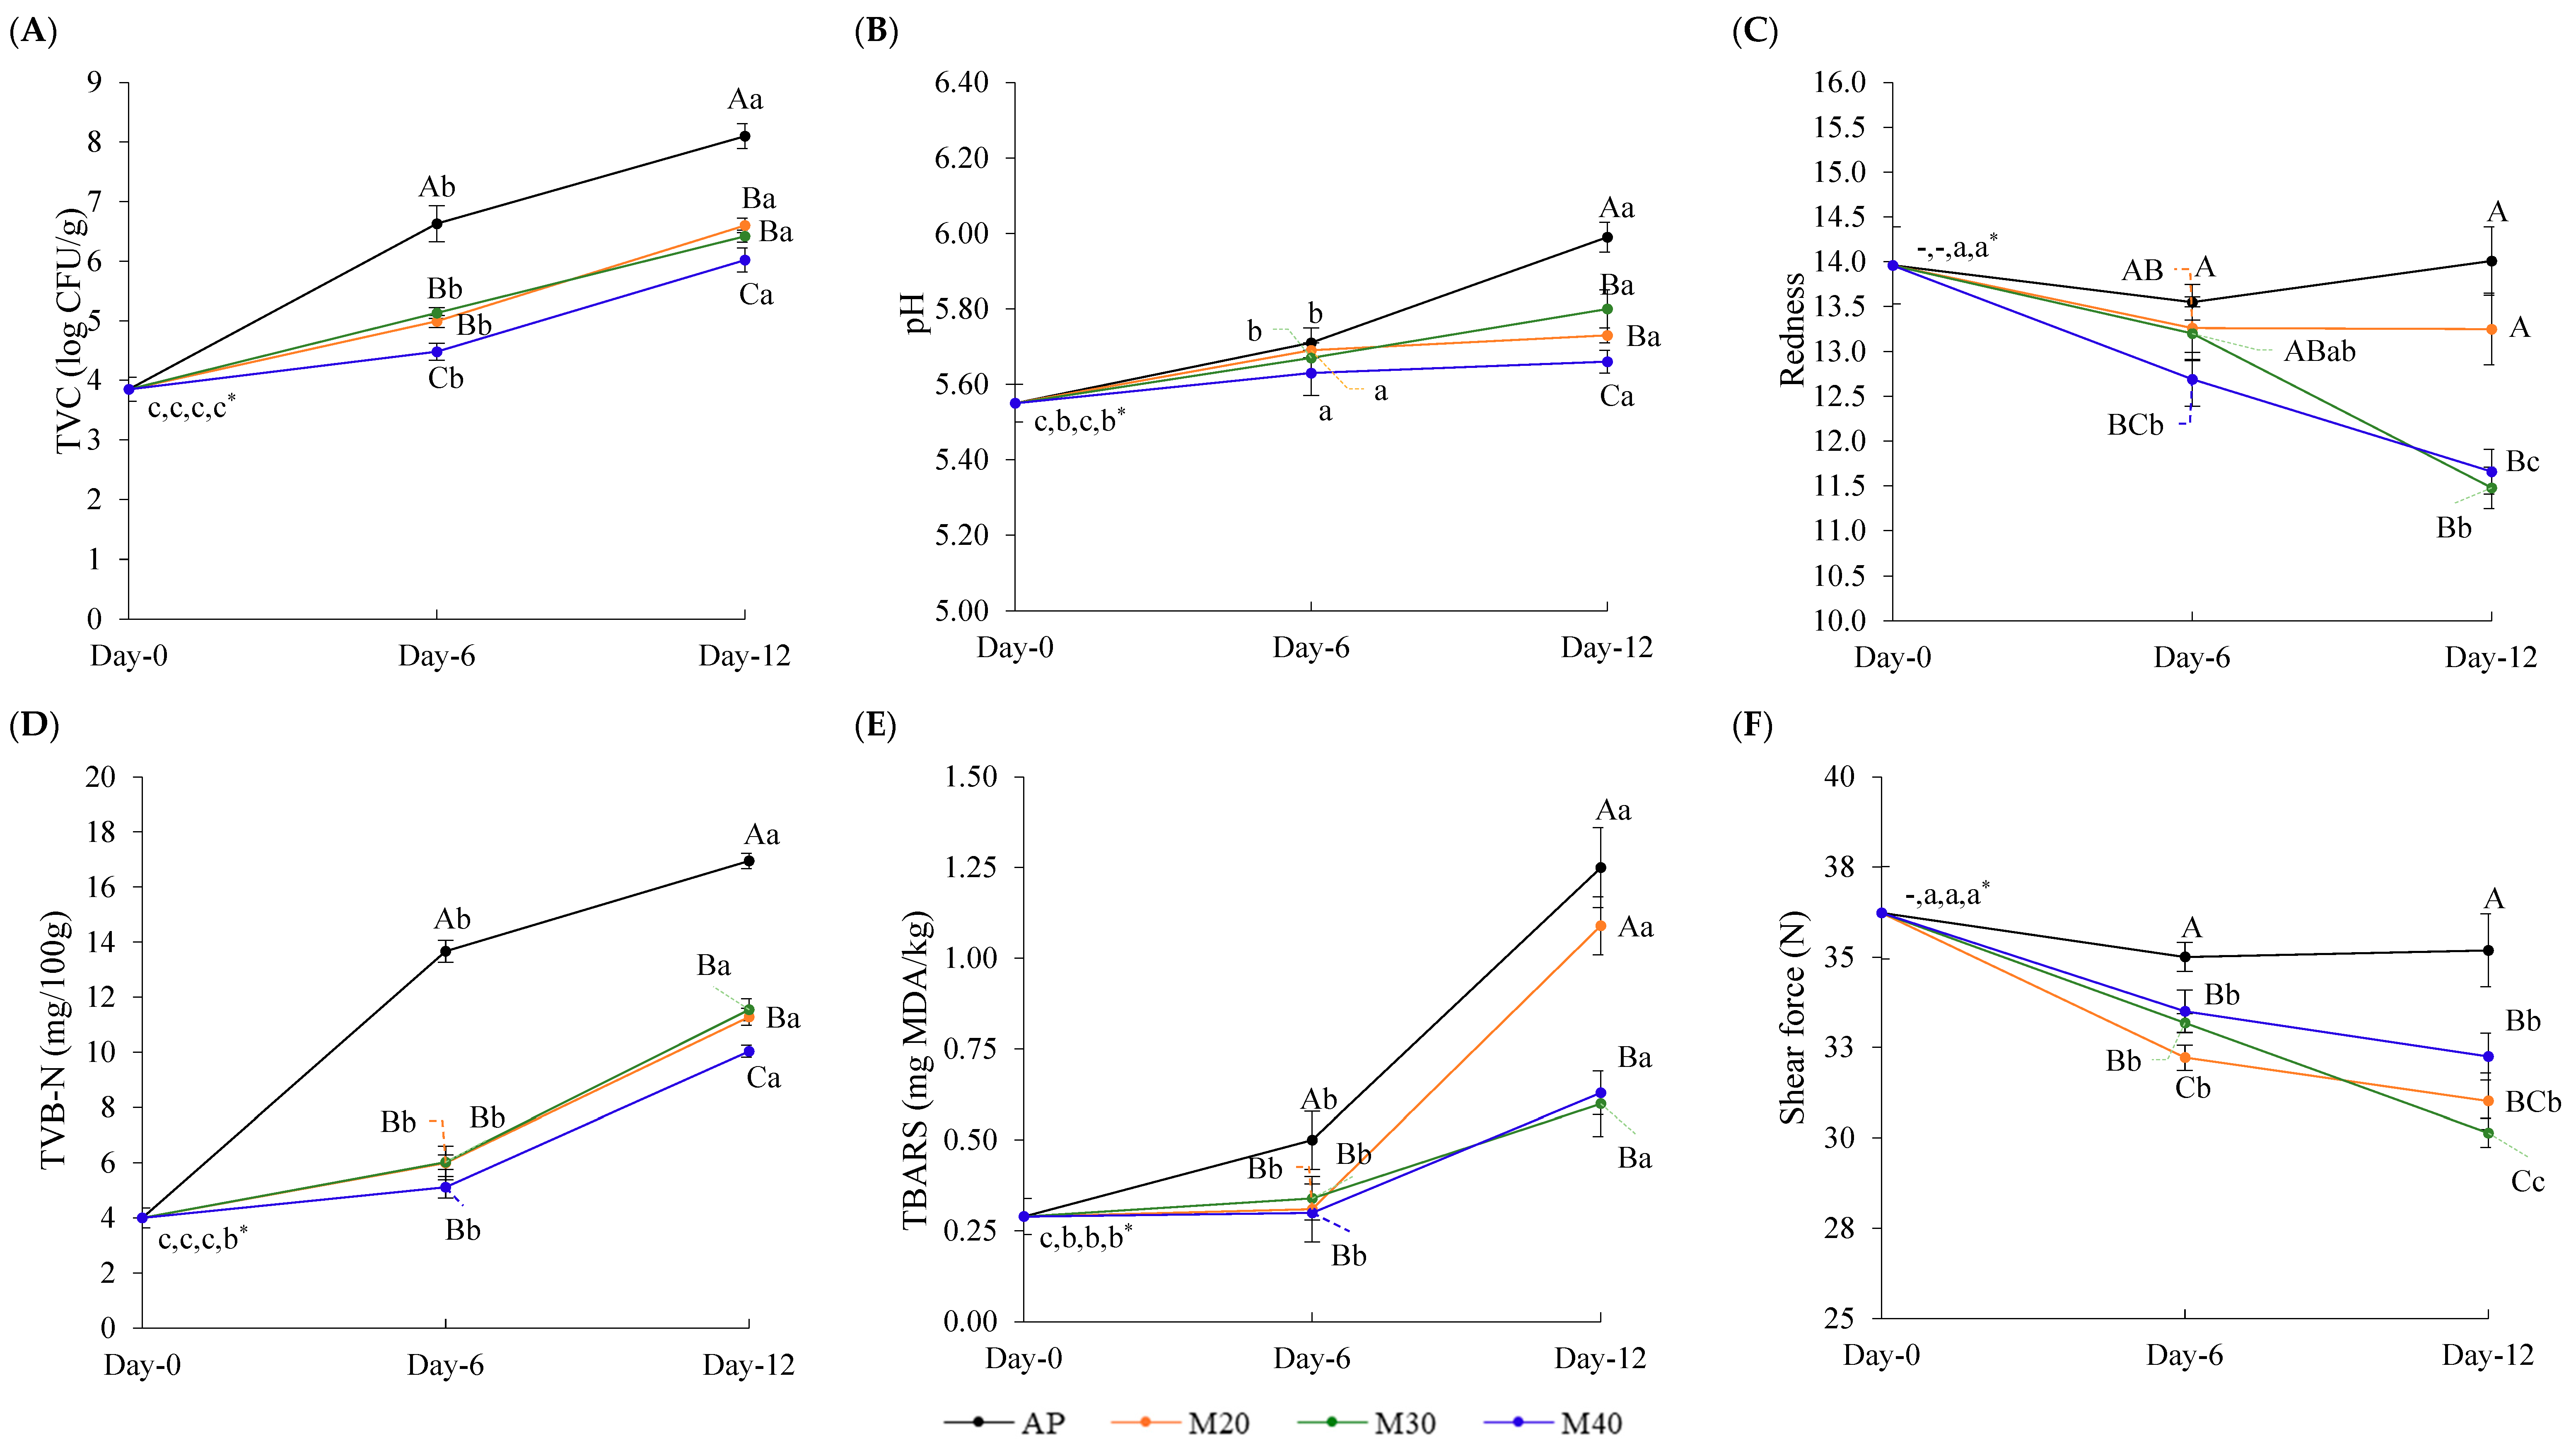
TVC of all samples increased from 3.85 log CFU/g at Day 0, with varying rates as storage time progressed (p < 0.05) (Figure 5A). AP samples exhibited higher TVC than MAP samples at both Day 6 and Day 12 (p < 0.05), exceeding the spoilage threshold (>7.00 log CFU/g, [41]) within 12 days. This indicated faster deterioration and a shelf life of less than 12 days under normal air condition. As storage progressed, bacteria transitioned from the lag to the exponential growth phase, utilizing proteins, amino acids, and carbohydrates [42]. By day 12, dominant spoilage bacteria detected in AP including Pseudomonas, Brochothrix, and Shewanella, likely played a significant role in accelerating degradation and driving quality changes, with their accumulation exceeding safety limits of fresh meat products. All MAP conditions effectively delayed spoilage, as they resulted in lower TVC compared to AP throughout storage, with M40 demonstrating the most pronounced inhibitory effect (p < 0.05). The TVC of 7.00 log CFU/g at Day 12 indicated that MAP products were within standard regulations. The increase in TVC of MAP samples can be attributed to the fact that CO2 initially suppressed bacterial growth, but CO2-tolerant bacteria (e.g., Enterobacteriaceae, LAB) gradually adapted and proliferated. Meanwhile, endogenous proteases broke down muscle proteins, providing nutrients that fueled bacterial expansion [43]. The accumulation of metabolic byproducts (e.g., ammonia, biogenic amines) altered pH, further promoting microbial growth. High CO2 concentrations, particularly 40%, reduced TVC more effectively during storage, likely due to CO2 creating acidic conditions that disrupt bacterial metabolism and reduce protein degradation [27]. These shifts in microbial patterns and metabolic activities helped delay spoilage. Indriani et al. [17] described that limiting O2 in MAP suppressed aerobic bacteria like Pseudomonas and Brochothrix, while promoting the growth of CO2-tolerant bacteria such as Lactobacillus, which are less spoilage prone. This suggested that increasing CO2 concentrations plays a critical role in microbial suppression, likely through its bacteriostatic properties that reduce bacterial proliferation and metabolic activity.
Pathogen counts are reported in Table 2. At Day 0, the detection of all pathogens in goat meat was either undetectable or very low (<10 CFU/g). However, some pathogens appeared in higher numbers during storage, though they remained within the standard limits set by the Thai Agricultural Commodity and Food Standard [21], confirming that the samples were safe and not spoiled by pathogens. In AP, a continuous increase in S. aureus was observed, reaching 69 CFU/g by Day 12, likely due to the aerobic environment that favors its growth. In contrast, all MAPs effectively inhibited S. aureus growth, with levels being undetectable, suggesting that CO2 suppresses S. aureus by lowering pH and reducing O2 availability [44]. Interestingly, C. jejuni, which was not detected at Day 0 in AP samples, was found only in M30 and M40 samples. C. jejuni, known as anaerobic and microaerophilic pathogens, can adapt to CO2-rich environments, which may explain its survival [45]. Our results remind us that while MAP conditions, particularly those consisting of high CO2 levels, can extend meat shelf life by suppressing overall microorganisms, they may promote the growth of resistant species like C. jejuni, which could impact the safety of the products.

3.3. Changes in Quality Attributes of Goat Meat During Storage

The crucial quality attributes of goat meat, including pH, color, TVB-N, TBARSs, and shear force, were monitored throughout storage under different packaging conditions (Figure 5B–F). The pH of goat meat at Day 0 was 5.55 (Figure 5B). It increased slightly by Day 6 with no significant difference among samples (p > 0.05), but rose more noticeably by Day 12, with AP reaching the highest pH (5.99) and M40 the lowest (5.66) (p < 0.05). This trend could be associated with the metabolic activity of spoilage microorganisms, particularly proteolytic bacteria like Pseudomonas, which produce ammonia and amines as byproducts of protein degradation [27]. The lower pH observed in MAP samples suggested that CO2-enriched environments may suppress spoilage-related microbial activities, slowing down the accumulation of alkaline metabolites. Additionally, the higher abundance of LAB, acid-producing bacteria, under MAP conditions might also contribute to pH reduction.
Redness is a key indicator of the freshness of red meat and plays a significant role in consumer perception. On Day 12, redness (a*) was significantly reduced in M30 and M40 (p < 0.05), while no significant difference was observed between AP and M20 (p > 0.05) (Figure 5C). The decline in redness in M30 and M40 likely resulted from CO2-induced oxidation of oxymyoglobin to metmyoglobin [46], which could plausibly affect consumer perception at the later stages of storage. High CO2 concentrations (>30%) are known to negatively impact meat color due to increased oxidative stress, while CO2 suppresses microbial growth, excessive levels may affect color stability [47,48].
TVB-N in all samples increased as storage time progressed, with AP exhibiting the most pronounced rise, accumulating higher levels than all MAP samples (p < 0.05) (Figure 5C). This increase is attributed to spoilage bacteria breaking down proteins and producing nitrogenous compounds (NH3, TMA, DMA), which contribute to undesirable characteristics, particularly off-odor, in stored meat, as reflected by elevated TVB-N levels [23]. This trend corresponded with the fastest increase in TVC in AP (Figure 5A), which exceeded the spoilage thresholds by Day 12, indicating rapid deterioration. After 12 days, bacterial loads in AP had surpassed this threshold, aligning with a sharp rise in TVB-N and signaling advanced spoilage. MAP effectively controlled TVB-N accumulation, suggesting extended shelf life and reduced spoilage under CO2-enriched conditions. Among all MAP samples, M40 was the most effective in delaying spoilage, as indicated by the lowest TVB-N value (p < 0.05), suggesting high CO2 concentrations suppressed spoilage bacteria, thereby limiting the formation of volatile nitrogenous compounds. CO2 is known to inhibit key pathogens like Pseudomonas and B. thermosphacta, reduce enzyme activity, and slow metabolism [10]. Additionally, CO2 promotes LAB growth, which outcompete spoilage microbes and produce organic acids that further inhibit proteolysis. However, while CO2 initially inhibits bacterial growth, CO2-resistant bacteria like Enterobacteriaceae and Lactobacillus can adapt over time, accelerating protein degradation [49]. Both endogenous proteases and microbial enzymes contribute to nitrogenous spoilage [50]. Therefore, although microbial activity is slowed at 4 °C in MAP samples, it still occurs, leading to pH fluctuations that enhance proteolytic processes. According to Xia et al. [51], the acceptable TVB-N limit for fresh products is 30 mg/100 g. In this study, TVB-N levels remained within that standard across all samples after 12 days of storage, suggesting that undesirable spoilage characteristics may not have developed significantly during this period.
The TBARS value represents the secondary products of lipid oxidation, which are responsible for the undesirable odor/flavor associated with lipid deterioration, with values between 2.00 and 2.25 mg MDA/kg recognized as the limit indicating no rancidity in meat and meat products [52]. As shown in Figure 5E, the TBARS value remained stable in all MAP samples until Day 6, whereas a gradual increase was observed in AP. However, by Day 12, TBARS levels had clearly increased in all samples, with higher amounts observed in AP and M20 (p < 0.05). This suggested that lipid oxidation occurred during storage, particularly after 6 days, and that M30 and M40 were effective in suppressing this reaction. The delayed onset of lipid oxidation may be attributed to the naturally low fat content of goat meat, which initially limits oxidative reactions [53,54]. In addition, CO2 concentrations above 30% appeared to suppress lipid oxidation by reducing O2 availability and inhibiting oxidative enzymes [55].
Shear force remained unchanged in AP throughout the 12-day storage period Figure 5F, which may be attributed to a balance between oxidative-induced toughness and proteolytic softening. The certain O2 of atmosphere condition likely promoted oxidative cross-linking of myofibrillar proteins, helping to maintain firmness despite proteolytic degradation during storage. This corresponded to the statement by Wang et al. [56] that oxidation typically increases meat toughness under air packaging conditions. In contrast, shear force of all MAP samples gradually decreased (p < 0.05), suggesting a reduction in firmness over time. The results indicated that CO2 retards protein oxidation, thereby allowing proteolytic enzyme activity to predominantly improve tenderness. This suggested that, while CO2 slows microbial spoilage, it does not inhibit calpains and cathepsins, which are the main proteolytic enzymes responsible for proteolysis during storage [57]. High CO2 reduces O2 availability, minimizing oxidative cross-linking of myofibrillar proteins, preventing toughness [58]. It also promotes LAB growth, which lowers pH and enhances proteolytic activity, further tenderizing the meat [57]. Altogether, MAP, particularly with >30% CO2, preserved goat meat quality by suppressing spoilage indicators such as TVB-N and TBARSs. Additionally, CO2’s ability to modulate protein oxidation, pH levels, and microbial activity contributes to reduced water loss, helping to maintain the meat’s softness and overall quality during storage [59]. However, these conditions (30–40% CO2) may have negatively impacted the color stability of high O2 MAP, as they accelerated the reduction in redness. The regulation of microbial populations and meat characteristics by CO2 levels during storage was observed. Understanding the correlation between them could help optimize CO2 levels and improve our understanding of how CO2 regulates these changes, both in terms of prolonging shelf life and maintaining desirable characteristics.

3.4. Correlation Analysis Between Microbial Communities and Quality Attributes

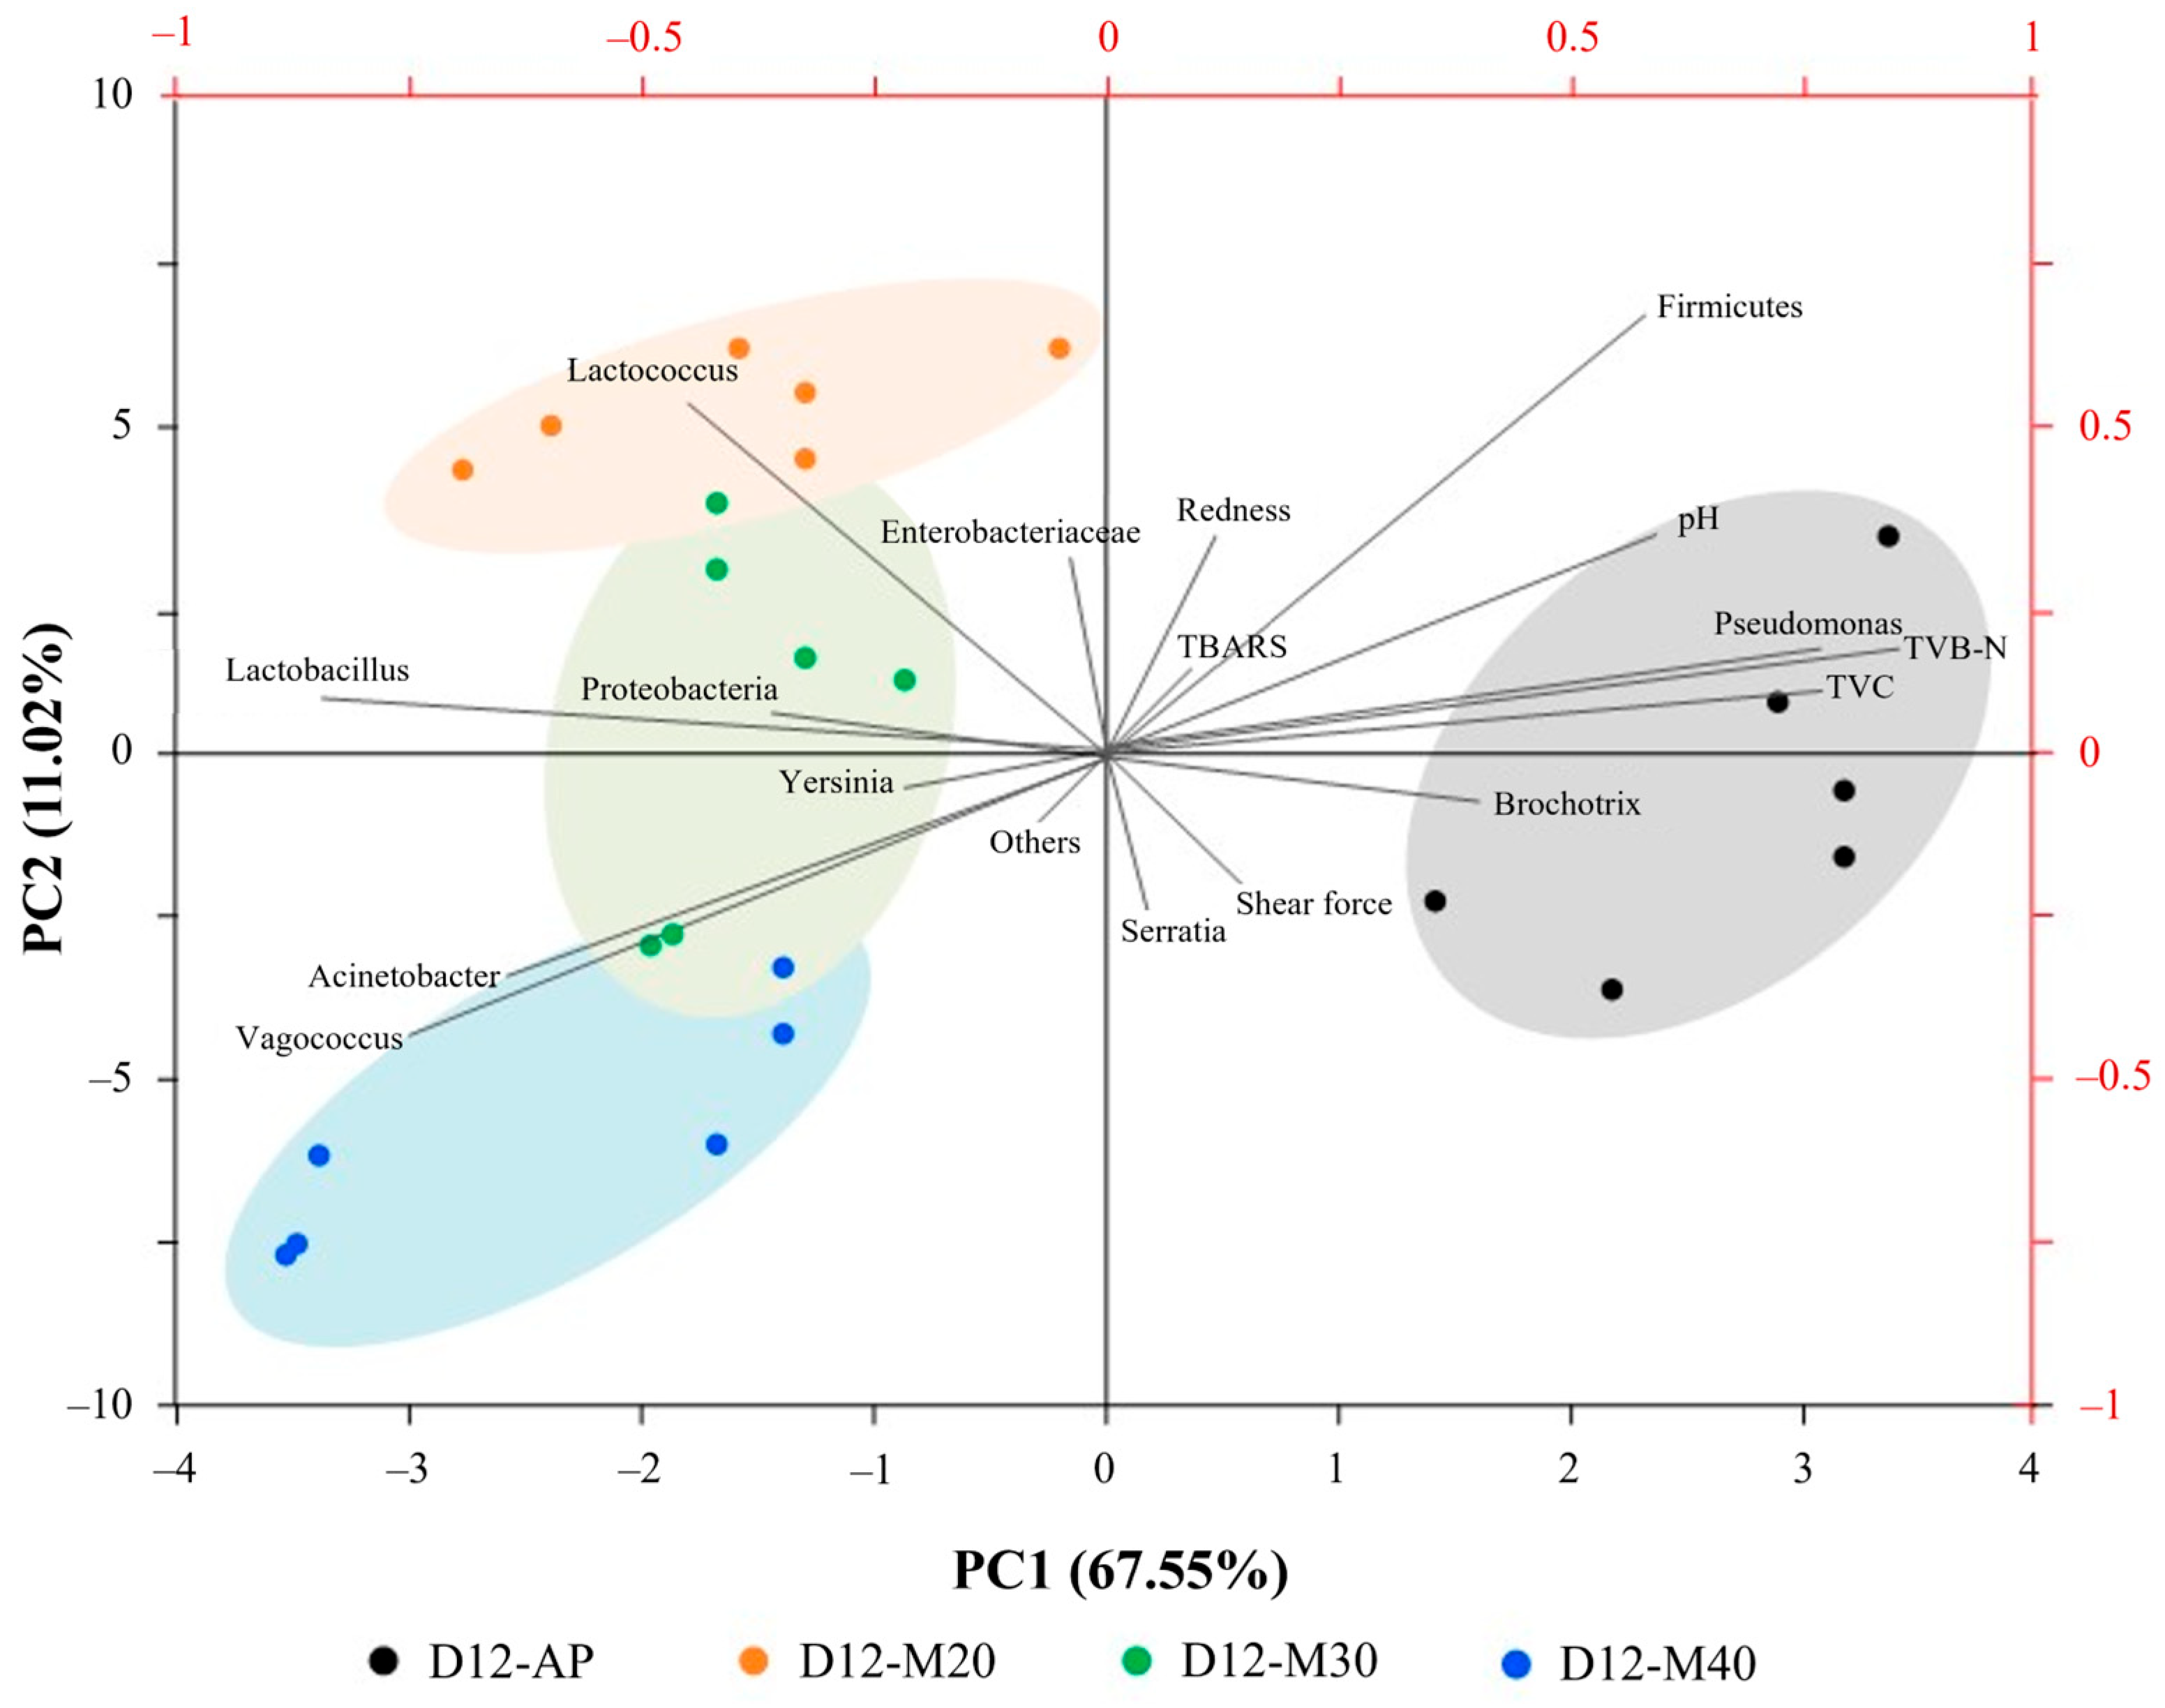
A PCA biplot was used to assess the relationship between the most differentiating microbial abundances at both the phylum and genus levels and the quality attributes of the samples on Day 12 (Figure 6). PC1 (67.55%) clearly separated AP (on the right side) from MAP samples (on the left side), indicating that specific CO2 levels (20–40%) in high-O2 MAP influenced distinct microbial and quality profiles of goat meat during storage. PC2 (11.02%) further discriminated among the MAP treatments, suggesting that each CO2 level shaped unique microbial communities and corresponding quality changes. On the right side of the biplot, a strong positive correlation was observed between TVB-N, TVC, Pseudomonas, and Brochothrix, which were strongly associated with AP. This suggested that these spoilage-associated bacteria were the primary contributors to protein degradation and nitrogenous compound accumulation in AP, leading to faster deterioration of meat quality during storage. The dominance of Pseudomonas in AP aligned with previous findings highlighting its role in aerobic spoilage, particularly through proteolysis and the production of volatile compounds [60]. Lactobacillus was the most distinct genus separating MAP samples from AP, appearing at the far left of the axis; however, each MAP sample also exhibited its own dominant genera. Lactococcus was positively correlated with M20, suggesting that lower CO2 levels may favor the dominance of LAB, which can enhance microbial stability and potentially improve quality by inhibiting spoilage organisms [40]. Proteobacteria and Yersinia showed a strong correlation with M30, likely reflecting their ability to adapt to CO2-enriched environments. Proteobacteria, including Pseudomonas, are facultative anaerobes capable of thriving under high CO2 conditions due to their flexible metabolic pathways [12]. Similarly, Yersinia, particularly Y. enterocolitica, is known to tolerate elevated CO2 levels, allowing it to persist when other microbes are suppressed [61]. These bacteria likely gain a competitive advantage in MAP by exploiting available nutrients and adapting to the CO2-rich atmosphere. Moreover, microbial interactions between Proteobacteria and Yersinia may further support their co-occurrence in this packaging environment. The high CO2 concentration, through its pH-lowering and O2-reducing effects, likely promotes the dominance of these taxa in 30% CO2 MAP. In contrast, the clustering of Acinetobacter and Vagococcus, which were strongly correlated with M40, suggested the accumulation of distinct microbial genera in the meat after the CO2 concentration was increased to 40%. This can be similarly described as their adaptation to CO2-enriched, low-O2 environments. Acinetobacter, a facultative anaerobe, thrives in high CO2 concentrations due to its metabolic flexibility [62]. Similarly, Vagococcus, a lactic acid bacterium, can tolerate low O2 and CO2, benefiting from the pH-lowering effects of CO2 [35]. Interestingly, the biplot suggested that MAP had a greater influence on microbial composition than on quality attributes, implying that factors beyond microbial presence such as enzymatic activity, oxidative changes, and metabolic byproducts, also play a role in determining meat quality. This study revealed the complex interactions between microbial succession, gas composition, and biochemical processes in MAP-stored goat meat, particularly under elevated CO2 levels, emphasizing the need for further in-depth studies into the specific mechanisms driving these changes.

4. Conclusions

CO2 levels in Hi-O2 MAP significantly influenced microbial communities and quality attributes of chilled goat meat over 12 days of storage. Microbial richness and diversity declined across all treatments, with the most rapid deterioration in AP. AP was associated with the dominance of Pseudomonas and Brochothrix, contributing to higher TVB-N and TBARS levels, indicating faster spoilage. In contrast, MAP, particularly with 40% CO2 (M40), suppressed these spoilage bacteria and instead promoted LAB such as Lactococcus and Vagococcus, enhancing microbial stability. MAP also helped preserve meat texture by limiting oxidative protein cross-linking; however, elevated CO2 levels negatively affected redness and overall color stability. Among treatments, M40 provided the most extended microbial stability, though its effect on specific quality traits warrants further study. Future research should assess consumer acceptance and explore microbial metabolic byproducts to better understand CO2’s role in shelf life extension and quality maintenance. Storage beyond 12 days should be investigated to determine the actual maximum shelf life. Moreover, monitoring headspace gas dynamics in the packaging should be considered to understand the role of gas ratio changes in relation to microbial and quality changes during storage.

Supplementary Materials

The following supporting information can be downloaded at: https://www.mdpi.com/article/10.3390/foods14111837/s1. Table S1. Annotated OTUs of bacterial communities in goat meat stored under different MAP conditions at 4 °C for 12 days.

Author Contributions

Conceptualization, S.S., S.I. and J.P.; methodology, S.S. and J.P.; software, S.I. and N.S.; validation, S.S. and J.P.; formal analysis, S.I. and N.S.; investigation, S.S., S.I., N.S. and J.P.; resources, S.S., N.S. and J.P.; data curation, S.S. and J.P.; writing—original draft preparation, S.S. and J.P.; writing—review and editing, S.S., S.I., N.S., P.K., S.S.-U., U.I., S.P., S.R. and J.P.; visualization, S.I. and J.P.; supervision, P.K., S.S.-U., U.I., S.P., S.R. and J.P.; project administration, J.P.; funding acquisition, S.I. and J.P. All authors have read and agreed to the published version of the manuscript.

Funding

This work was supported by (i) Suranaree University of Technology (SUT), (ii) Thailand Science Research and Innovation (TSRI), and (iii) National Science, Research and Innovation Fund (NSRF) (project codes: FF3-303-68-24-27), the Reinventing University Program Fund [F01-683R-04-045], as well as SUT for the Full-time Doctoral Researcher [grant number FtR.66/41/2567].

Institutional Review Board Statement

The research was conducted in adherence to the regulations on animal experimentation and the Guidelines for the Use of Animals in Research, as recommended by the National Research Council of Thailand (NRCT) under reference document no. IACUC-030/2024. All procedures described herein were approved by the Animal Ethics Committee of Suranaree University of Technology.

Informed Consent Statement

Not applicable.

Data Availability Statement

The original contributions presented in the study are included in the article/Supplementary Material, further inquiries can be directed to the corresponding author.

Acknowledgments

The authors would like to express their gratitude to Faculty of Science, Burapha University, for providing the necessary facilities and financial support.

Conflicts of Interest

The authors declare no conflicts of interest.

References

  1. Olmo, L.; Van, N.; Nguyen, B.; Bui Thi, N.; Cuc, N.; Don, N.; Hoang, N.; Morales, L.; Walkden-Brown, S. Goat meat supply and demand in Vietnam: Global context and opportunities and risks for smallholder producers. Anim. Prod. Sci. 2024, 64, AN23416. [Google Scholar] [CrossRef]
  2. Hegde, N. Goat development: An opportunity to strengthen rural economy in Asia and Africa. Asian J. Anim. Vet. Adv. 2020, 3, 30–47. [Google Scholar] [CrossRef]
  3. FAOSTAT. FAOSTAT Statistics Database. Food and Agriculture Organization of the United Nations Statistics Division. 2022. Available online: https://www.fao.org/faostat/en/#data (accessed on 10 February 2025).
  4. Azad, M.; Sayeed, M.; Mukta, S.P.; Parvin, S.; Murshed, H.M.; Rahman, M. Quality of cattle, buffalo, and goat meat keema at different storage temperatures. Meat Res. 2023, 3, 1–10. [Google Scholar] [CrossRef]
  5. Xiao, Y.; Zhao, J.; Zhang, X.; Jiao, Y.; Liu, Y. Analysis of quality changes of Hengshan goat hindquarter meat at four storage temperatures. J. Food Comp. Anal. 2023, 117, 105129. [Google Scholar] [CrossRef]
  6. Indriani, S.; Srisakultiew, N.; Sangsawad, P.; Paengkoum, P.; Pongsetkul, J. Characterization of the non-volatiles and volatiles in correlation with flavor development of cooked goat meat as affected by different cooking methods. Food Sci. Anim. Resour. 2024, 44, 662–683. [Google Scholar] [CrossRef] [PubMed]
  7. Jaspal, M.H.; Ijaz, M.; ul Haq, H.A.; Yar, M.K.; Asghar, B.; Manzoor, A.; Badar, I.H.; Ullah, S.; Islam, M.S.; Hussain, J. Effect of oregano essential oil or lactic acid treatments combined with air and modified atmosphere packaging on the quality and storage properties of chicken breast meat. LWT 2021, 146, 111459. [Google Scholar] [CrossRef]
  8. Carpenter, B.J.; Dobbins, T.W.; Hernandez, M.S.; Barker, S.N.; Loomas, K.R.; Osburn, W.N.; Legako, J.F. Comparison of gas treatments of high oxygen, carbon monoxide, and nitric oxide on ground beef color in modified atmosphere packaging. Foods 2024, 13, 902. [Google Scholar] [CrossRef]
  9. Spanos, D.; Tørngren, M.; Christensen, M.; Baron, C. Effect of oxygen level on the oxidative stability of two different retail pork products stored using modified atmosphere packaging (MAP). Meat Sci. 2016, 113, 138–143. [Google Scholar] [CrossRef]
  10. Yang, J.; Liang, R.; Mao, Y.; Dong, P.; Zhu, L.; Luo, X.; Zhang, Y.; Yang, X. Potential inhibitory effect of carbon dioxide on the spoilage behaviors of Pseudomonas fragi in high-oxygen packaged beef during refrigerated storage. Food Microbiol. 2023, 112, 104229. [Google Scholar] [CrossRef]
  11. Carrizosa, E.; Benito, M.; Ruiz-Moyano Seco de Herrera, S.; Hernández, A.; Villalobos, C.; Martín, A.; Córdoba, M. Bacterial communities of fresh goat meat packaged in modified atmosphere. Food Microbiol. 2017, 65, 57–64. [Google Scholar] [CrossRef]
  12. Hilgarth, M.; Lehner, E.M.; Behr, J.; Vogel, R.F. Diversity and anaerobic growth of Pseudomonas spp. isolated from modified atmosphere packaged minced beef. J. Appl. Microbiol. 2019, 127, 159–174. [Google Scholar] [CrossRef] [PubMed]
  13. Li, X.; Xiong, Q.; Zhou, H.; Xu, B.; Sun, Y. Analysis of microbial diversity and dynamics during bacon storage inoculated with potential spoilage bacteria by high-throughput sequencing. Front. Microbiol. 2021, 12, 713513. [Google Scholar] [CrossRef] [PubMed]
  14. Yang, X.; Zhu, L.; Zhang, Y.; Liang, R.; Luo, X. Microbial community dynamics analysis by high-throughput sequencing in chilled beef longissimus steaks packaged under modified atmospheres. Meat Sci. 2018, 141, 94–102. [Google Scholar] [CrossRef] [PubMed]
  15. Sequino, G.; Cobo-Diaz, J.F.; Valentino, V.; Tassou, C.; Volpe, S.; Torrieri, E.; Nychas, G.J.; Álvarez Ordóñez, A.; Ercolini, D.; De Filippis, F. Environmental microbiome mapping in poultry processing chain and assessment of microbial dynamics in response to different storage conditions. Food Microbiol. 2025, 128, 104734. [Google Scholar] [CrossRef] [PubMed]
  16. Dou, H.; Zhu, W.; Chen, S.; Zou, Y.; Xia, X. Studies on quality deterioration and metabolomic changes in oysters induced by spoilage bacteria during chilled storage. Foods 2025, 14, 193. [Google Scholar] [CrossRef]
  17. Indriani, S.; Srisakultiew, N.; Boonchuen, P.; Kingwascharapong, P.; Sai-ut, S.; Benjakul, S.; Pongsetkul, J. Investigating the relationship between microbial community dynamics and flavor profiles in Korat chicken breast fillets under varied packaging conditions. Int. J. Food Microbiol. 2025, 435, 111157. [Google Scholar] [CrossRef]
  18. Schloss, P.D.; Westcott, S.L.; Ryabin, T.; Hall, J.R.; Hartmann, M.; Hollister, E.B.; Weber, C.F. Introducing mothur: Open-source, platform-independent, community-supported software for describing and comparing microbial communities. Appl. Environ. Microbiol. 2009, 75, 7537–7541. [Google Scholar] [CrossRef]
  19. Langille, M.G.; Zaneveld, J.; Caporaso, J.G.; McDonald, D.; Knights, D.; Reyes, J.A.; Clemente, J.C.; Burkepile, D.E.; Vega Thurber, R.L.; Knight, R. Predictive functional profiling of microbial communities using 16S rRNA marker gene sequences. Nat. Biotechnol. 2013, 31, 814–821. [Google Scholar] [CrossRef]
  20. BAM. Aerobic plate count. In Bacteriological Analytical Manual; Bryce, J., Ed.; U.S. Food and Drug Administration, E-Con Publishing: Silver Spring, MD, USA, 2001; pp. 53–67. [Google Scholar]
  21. Thai Agricultural Commodity and Food Standard. Microbiological criteria. In Safety Requirements for Agricultural Commodity and Food; National Bureau of Agricultural Commodity and Food Standards, Ministry of Agriculture and Cooperatives: Bangkok, Thailand, 2005; pp. 1–34. ISBN 974-403-356-8. [Google Scholar]
  22. Conway, E.J.; Byrne, A. An absorption apparatus for the micro-determination of certain volatile substances I: The micro-determination of ammonia. Biochem. J. 1936, 27, 419–429. [Google Scholar] [CrossRef]
  23. Pongsetkul, J.; Benjakul, S.; Takeungwongtrakul, S.; Sai-Ut, S. Impact of stocking density during live transportation on meat quality of Nile tilapia (Oreochromis niloticus) and their changes during storage. J. Food Process. Preserv. 2021, 45, e16523. [Google Scholar] [CrossRef]
  24. Wattanachant, S.; Benjakul, S.; Ledward, D.A. Composition, color, and texture of Thai indigenous and broiler chicken muscles. Poult. Sci. 2004, 83, 123–128. [Google Scholar] [CrossRef]
  25. Wang, Q.; Chen, Q.; Xu, J.; Sun, F.; Liu, H.; Kong, B. Effects of modified atmosphere packaging with various CO2 concentrations on the bacterial community and shelf-life of smoked chicken legs. Foods 2022, 11, 559. [Google Scholar] [CrossRef] [PubMed]
  26. Chen, J.; Niu, Y.; Wang, J. Physicochemical property, bacterial diversity, and volatile profile during ripening of naturally fermented dry mutton sausage produced from Jianzhou big-eared goat. Front. Microbiol. 2022, 13, 961117. [Google Scholar] [CrossRef] [PubMed]
  27. Hou, X.; Zhao, H.; Yan, L.; Li, S.; Chen, X.; Fan, J. Effect of CO2 on the preservation effectiveness of chilled fresh boneless beef knuckle in modified atmosphere packaging and microbial diversity analysis. LWT 2023, 187, 115262. [Google Scholar] [CrossRef]
  28. Caleb, O.J.; Mahajan, P.V.; Al-Said, F.A.; Opara, U.L. Modified Atmosphere Packaging Technology of Fresh and Fresh-cut Produce and the Microbial Consequences-A Review. Food Bioprocess Technol. 2023, 6, 303–329. [Google Scholar] [CrossRef]
  29. Lorenzo, J.M.; Munekata, P.E.; Dominguez, R.; Pateiro, M.; Saraiva, J.A.; Franco, D. Main groups of microorganisms of relevance for food safety and stability: General aspects and overall description. In Innovative Technologies for Food Preservation; Barba, F.J., Sant’Ana, A.M., Orlien, V., Koubaa, M., Eds.; Academic Press: Cambridge, MA, USA, 2018; pp. 53–107. [Google Scholar] [CrossRef]
  30. Lyu, C.; Li, Y.; Dong, Y.; Xu, X.; Wang, H. Comprehensive evaluation of the bacterial adhesion and spoilage capacity of meat-borne Acinetobacter spp. Food Res. Int. 2025, 203, 115831. [Google Scholar] [CrossRef]
  31. Wickramasinghe, N.; Ravensdale, J.; Coorey, R.; Chandry, S.; Dykes, G. The predominance of psychrotrophic Pseudomonads on aerobically stored chilled red meat. Compr. Rev. Food Sci. Food Saf. 2019, 18, 1541–4337. [Google Scholar] [CrossRef]
  32. Karanth, S.; Feng, S.; Patra, D.; Pradhan, A.K. Linking microbial contamination to food spoilage and food waste: The role of smart packaging, spoilage risk assessments, and date labeling. Front. Microbiol. 2023, 14, 1198124. [Google Scholar] [CrossRef]
  33. Barcenilla, C.; Ducic, M.; López, M.; Prieto, M.; Álvarez-Ordóñez, A. Application of lactic acid bacteria for the biopreservation of meat products: A systematic review. Meat Sci. 2022, 183, 108661. [Google Scholar] [CrossRef]
  34. Marcelli, V.; Osimani, A.; Aquilanti, L. Research progress in the use of lactic acid bacteria as natural biopreservatives against Pseudomonas spp. in meat and meat products: A review. Food Res. Int. 2024, 196, 115129. [Google Scholar] [CrossRef]
  35. Teixeira, L.M.; Merquior, V.L.C.; Shewmaker, P.L. Vagococcus. In Encyclopedia of Food Microbiology, 2nd ed.; Batt, C.A., Tortorello, M.L., Eds.; Academic Press: Cambridge, MA, USA, 2014; pp. 673–679. [Google Scholar] [CrossRef]
  36. Casaburi, A.; Piombino, P.; Nychas, G.J.; Villani, F.; Ercolini, D. Bacterial populations and the volatilome associated with meat spoilage. Food Microbiol. 2015, 45 Pt A, 83–102. [Google Scholar] [CrossRef]
  37. Mortazavi, S.M.H.; Kaur, M.; Farahnaky, A.; Torley, P.J.; Osborn, A.M. The pathogenic and spoilage bacteria associated with red meat and application of different approaches of high CO2 packaging to extend product shelf-life. Crit. Rev. Food Sci. Nutr. 2023, 63, 1733–1754. [Google Scholar] [CrossRef] [PubMed]
  38. Zhuang, S.; Tian, L.; Liu, Y.; Wang, L.; Hong, H.; Luo, Y. Amino acid degradation and related quality changes caused by common spoilage bacteria in chill-stored grass carp (Ctenopharyngodon idella). Food Chem. 2023, 399, 133989. [Google Scholar] [CrossRef] [PubMed]
  39. Ruxton, C.H.S.; Gordon, S. Animal board invited review: The contribution of red meat to adult nutrition and health beyond protein. Animal 2024, 18, 101103. [Google Scholar] [CrossRef] [PubMed]
  40. Ibrahim, S.A.; Ayivi, R.D.; Zimmerman, T.; Siddiqui, S.A.; Altemimi, A.B.; Fidan, H.; Esatbeyoglu, T.; Bakhshayesh, R.V. Lactic acid bacteria as antimicrobial agents: Food safety and microbial food spoilage prevention. Foods 2021, 10, 3131. [Google Scholar] [CrossRef]
  41. CAC/RCP 58-2005; Codex Alimentarius Commission. Code of Hygienic Practice for Fresh Meat. Food and Agriculture Organization of the United Nations (FAO): Rome, Italy, 2020. Available online: http://www.fao.org (accessed on 9 March 2025).
  42. Donenko, F.V.; Gruber, I.M.; Semenova, I.B.; Priyatkin, R.G.; Ziganshin, R.H.; Zaryadyeva, E.A.; Efferth, T. Growth-dependent release of carbohydrate metabolism-related and antioxidant enzymes from Staphylococcus aureus strain 6 as determined by proteomic analysis. Exp. Ther. Med. 2011, 2, 1199–1204. [Google Scholar] [CrossRef] [PubMed]
  43. Zhang, Y.Z.; Zhang, W.X.; Chen, X.L. Mechanisms for induction of microbial extracellular proteases in response to exterior proteins. Appl. Envi. Microbiol. 2020, 86, e01036-20. [Google Scholar] [CrossRef]
  44. Persson, M.; Svenarud, P.; Flock, J.I.; van der Linden, J. Carbon dioxide inhibits the growth rate of Staphylococcus aureus at body temperature. Surg. Endosc. 2005, 19, 91–94. [Google Scholar] [CrossRef]
  45. Pokhrel, D.; Thames, H.T.; Zhang, L.; Dinh, T.T.N.; Schilling, W.; White, S.B.; Ramachandran, R.; Theradiyil, S.A. Roles of aerotolerance, biofilm formation, and viable but non-culturable state in the survival of Campylobacter jejuni in poultry processing environments. Microorganisms 2022, 10, 2165. [Google Scholar] [CrossRef]
  46. Jakobsen, M.; Bertelsen, G. The use of CO2 in packaging of fresh red meats and its effect on chemical quality changes in the meat: A review. J. Muscle Foods 2020, 13, 143–168. [Google Scholar] [CrossRef]
  47. Hunt, M.C.; Mancini, R.A.; Hachmeister, K.; Kropf, D.; Merriman, M.; Leduca, G.; Milliken, G. Carbon monoxide in modified atmosphere packaging affects color, shelf life, and microorganisms of beef steaks and ground beef. J. Food Sci. 2008, 69, FCT45–FCT52. [Google Scholar] [CrossRef]
  48. Martinez, L.; Djenane, D.; Cilla, I.; Beltrán, J.; Roncalés, P. Effect of different concentrations of carbon dioxide and low concentration of carbon monoxide on the shelf-life of fresh pork sausages packaged in modified atmosphere. Meat Sci. 2005, 71, 563–570. [Google Scholar] [CrossRef] [PubMed]
  49. Anumudu, C.K.; Miri, T.; Onyeaka, H. Multifunctional Applications of Lactic Acid Bacteria: Enhancing Safety, Quality, and Nutritional Value in Foods and Fermented Beverages. Foods 2024, 13, 3714. [Google Scholar] [CrossRef]
  50. Bekhit, A.E.; Holman, B.W.B.; Giteru, S.G.; Hopkins, D.L. Total volatile basic nitrogen (TVB-N) and its role in meat spoilage: A review. Trends Food Sci. Technol. 2021, 109, 280–302. [Google Scholar] [CrossRef]
  51. Xia, J.; Jiang, N.; Zhang, B.; Sun, R.; Zhu, Y.; Xu, W.; Wang, C.; Liu, Q.; Ma, Y. Bacterial changes in boiled crayfish between different storage periods and characterizations of the specific spoilage bacteria. Foods 2023, 12, 3006. [Google Scholar] [CrossRef]
  52. Piranavatharsan, U.; Jinadasa, B.K.K.K.; Jayasinghe, C.V.L. Validation of thiobarbituric acid reactive substances (TBARS) method for measuring secondary lipid oxidation products in fresh Indian mackerel (Rastrelliger kanagurta). Food Humanit. 2023, 1, 1194–1199. [Google Scholar] [CrossRef]
  53. Su, T.; Fu, Y.; Tan, J.; Gagaoua, M.; Bak, K.H.; Soladoye, O.P.; Zhao, Z.; Zhao, Y.; Wu, W. Effects of intramuscular fat on the flavor of fresh sheep and goat meat: Recent insights into pre-mortem and post-mortem factors. Food Chem. X 2025, 25, 102159. [Google Scholar] [CrossRef]
  54. Pongsetkul, J.; Kingwascharapong, P.; Senphan, T. Biochemical changes of Nile tilapia (Oreochromis niloticus) meat during ice storage: A comparison between slurry ice vs flake ice. J. Aquat. Food Prod. Technol. 2022, 31, 814–827. [Google Scholar] [CrossRef]
  55. Kolbeck, S.; Kienberger, H.; Kleigrewe, K. Effect of high levels of CO2 and O2 on membrane fatty acid profile and membrane physiology of meat spoilage bacteria. Eur. Food Res. Technol. 2021, 247, 999–1011. [Google Scholar] [CrossRef]
  56. Wang, C.; Wang, H.; Li, X.; Zhang, C. Effects of oxygen concentration in modified atmosphere packaging on water holding capacity of pork steaks. Meat Sci. 2019, 148, 189–197. [Google Scholar] [CrossRef]
  57. Kaur, L.; Hui Seah, X.; Morton, J.D.; Kaur, R.; Chian, F.M.; Boland, M. Endogenous proteolytic systems and meat tenderness: Influence of post-mortem storage and processing. Food Sci. Anim. Resour. 2021, 41, 589–607. [Google Scholar] [CrossRef] [PubMed]
  58. Chen, L.; Yang, R.; Fan, X.; He, G.; Zhao, Z.; Wang, F.; Liu, Y.; Wang, M.; Han, M.; Ullah, N.; et al. Changes in the quality of myofibrillar protein gel damaged by high doses of epigallocatechin-3-gallate as affected by the addition of amylopectin. Foods 2023, 12, 1790. [Google Scholar] [CrossRef] [PubMed]
  59. Kasałka-Czarna, N.; Stachniuk, A.; Fornal, E.; Montowska, M. Proteomic analysis of wild boar meat: Effect of storage method and time on muscle protein stability. Food Chem. 2025, 464 Pt 3, 141774. [Google Scholar] [CrossRef]
  60. Stanborough, T.; Fegan, N.; Powell, S.; Singh, T.; Tamplin, M.; Chandry, P. Genomic and metabolic characterization of spoilage-associated Pseudomonas species. Int. J. Food Microbiol. 2018, 268, 61–72. [Google Scholar] [CrossRef] [PubMed]
  61. Wu, F.; Ren, F.; Xie, X. The implication of viability and pathogenicity by truncated lipopolysaccharide in Yersinia enterocolitica. Appl. Microbiol. Biotechnol. 2023, 107, 7165–7180. [Google Scholar] [CrossRef]
  62. Hernández Villamizar, S.; Chica Cárdenas, L.A.; Morales Mancera, L.T.; Vives Florez, M.J. naerobiosis, a neglected factor in phage-bacteria interactions. App. Envi. Microbiol. 2023, 89, e0149123. [Google Scholar] [CrossRef]
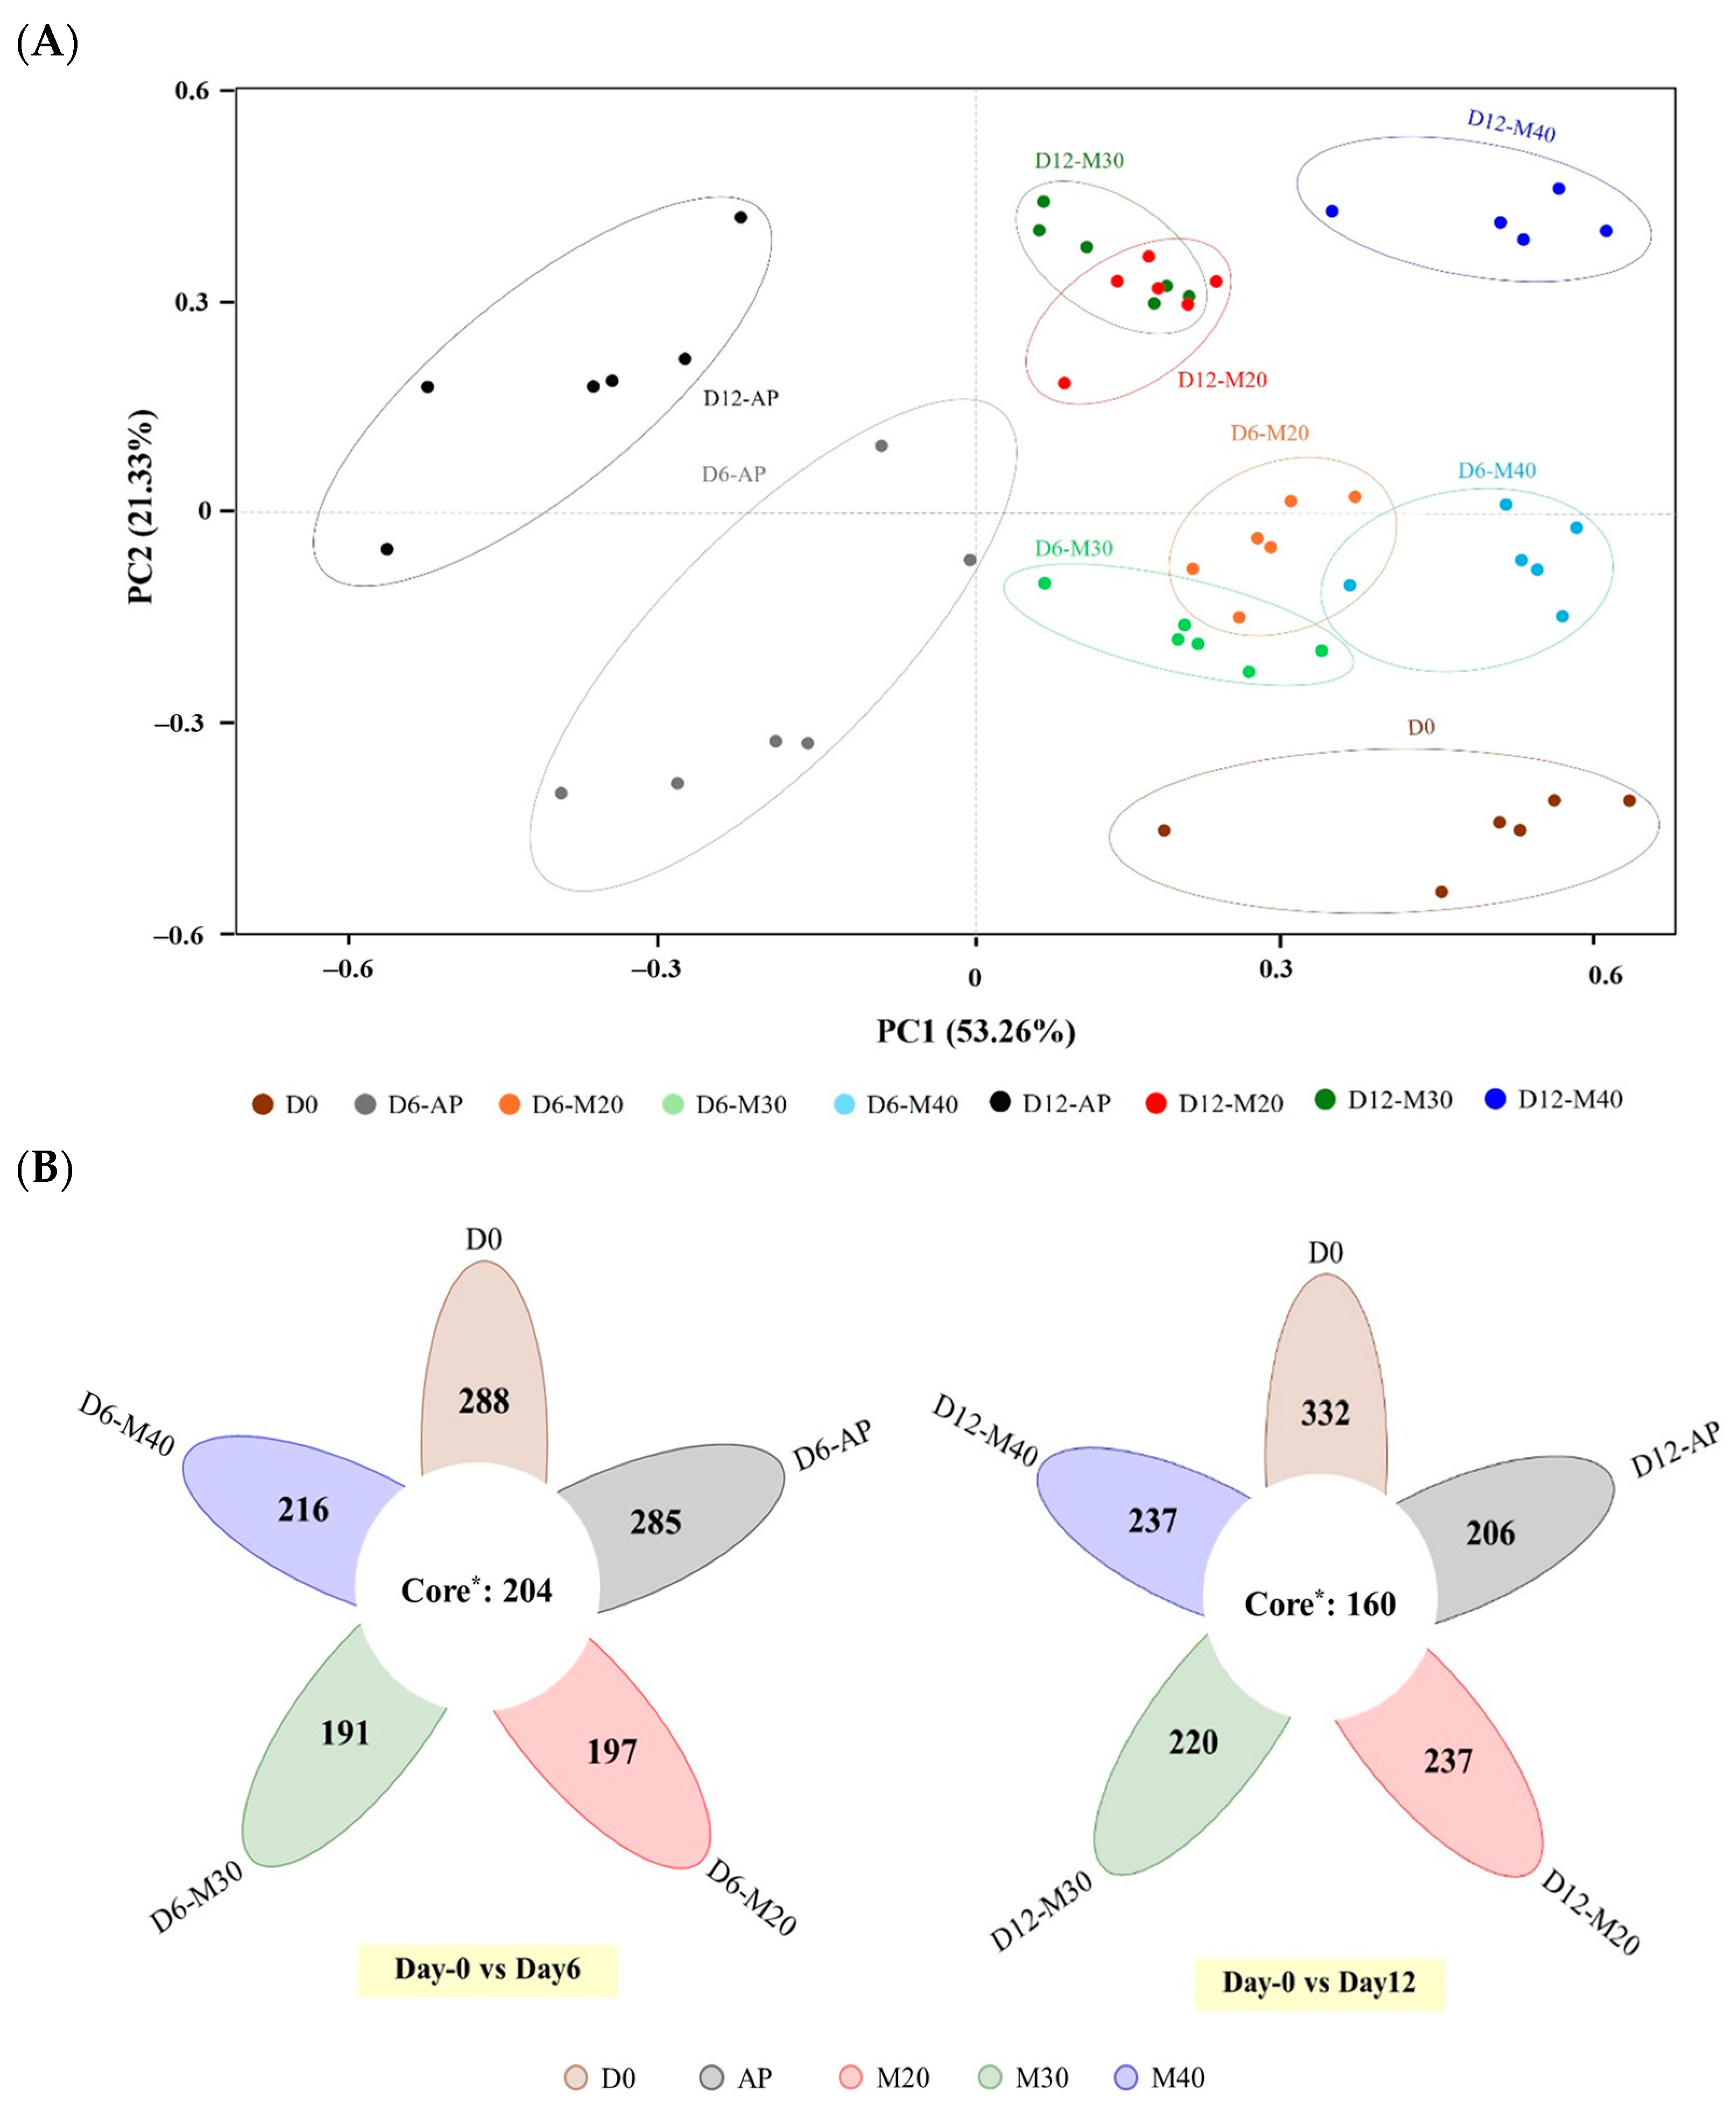
Figure 1. Beta diversity (PCoA plot) (A), and Venn diagram (B) of bacterial communities in goat meat stored under different MAP conditions at 4 °C for 12 days. * Core: OTUs commonly found in all samples.
Foods 14 01837 g001
Figure 2. Relative abundance (%) at phylum (A) and genus (B) levels of bacterial communities in goat meat stored under different MAP conditions at 4 °C for 12 days.
Foods 14 01837 g002
Figure 3. Hierarchically clustered dendrogram of bacterial communities at phylum (A) and genus (B) levels of bacterial communities in goat meat stored under different MAP conditions at 4 °C for 12 days.
Foods 14 01837 g003
Figure 4. Functional genes related to microbial metabolism (A) and other microbial biological functions (B) in goat meat stored under different MAP conditions at 4 °C on day 12th of storage.
Foods 14 01837 g004
Figure 5. Changes in TVC (A), pH (B), redness (C), TVB-N (D), TBARSs (E), and shear force (F) in goat meat stored under different MAP conditions at 4 °C for 12 days. Different uppercase letters denote significant differences due to MAP conditions at the same storage time (p < 0.05). Different lowercase letters denote significant differences across storage durations (p < 0.05). * The orders of lowercase letters are for AP, M20, M30, and M40, respectively.
Foods 14 01837 g005
Figure 6. Biplot of a PCA performed on bacterial phyla and genera (relative abundance >5%) and quality attributes of goat meat stored under different MAP conditions at 4 °C on day 12th of storage.
Foods 14 01837 g006
Table 1. Richness diversity estimators of bacterial communities in goat meat stored under different MAP conditions at 4 °C for 12 days.
SampleRead no.OTUs *Chao1 **ACE **Simpson **Shannon **Coverage ***
Day 0 57,3404929229800.966.020.9997
Day 6AP57,00248980110020.965.280.9997
M2055,4134018009030.935.020.9998
M3054,6783957898880.955.210.9997
M4055,2934208229650.955.390.9998
Day 12AP55,4653667999930.955.200.9998
M2053,8903975037850.934.990.9998
M3049,2993805657030.924.890.9999
M4050,4003977459020.955.550.9998
* OTUs: operational taxonomic units; ** Chao1, ACE (abundance-based coverage estimator); Simpson and Shannon are alpha diversity indices used to assess species richness and diversity within a sample. *** Coverage indicates how completely microbial diversity is captured by sequencing.
Table 2. Pathogenic microorganism counts in goat meat stored under different MAP conditions at 4 °C for 12 days.
SampleE. coliS. aureusSalmonella spp.C. perfringensC. jejuni
Day 0 <10 CFU/gND *ND<10 CFU/gND
Day 6AP<10 CFU/g30 CFU/gND<10 CFU/gND
M20<10 CFU/gNDND<10 CFU/gND
M30<10 CFU/gNDND<10 CFU/gND
M40<10 CFU/gNDND<10 CFU/g<10 CFU/g
Day 12AP53 CFU/g69 CFU/gND<10 CFU/gND
M20<10 CFU/gNDND<10 CFU/gND
M30<10 CFU/gNDND<10 CFU/g<10 CFU/g
M40<10 CFU/gNDND<10 CFU/g22 CFU/g
* ND = not detected.
Disclaimer/Publisher’s Note: The statements, opinions and data contained in all publications are solely those of the individual author(s) and contributor(s) and not of MDPI and/or the editor(s). MDPI and/or the editor(s) disclaim responsibility for any injury to people or property resulting from any ideas, methods, instructions or products referred to in the content.