

Healthiness of Meat-Based Products in Comparison to Their Plant-Based Alternatives in the UK Market: A Packaging Evaluation


Abstract
1. Introduction
2. Methods
2.1. Data Collection
2.2. Analysis of Nutritional Labels and Claims
2.3. Nutrient Profiling
2.4. Statistical Analysis
3. Results
3.1. Nutritional Assessment
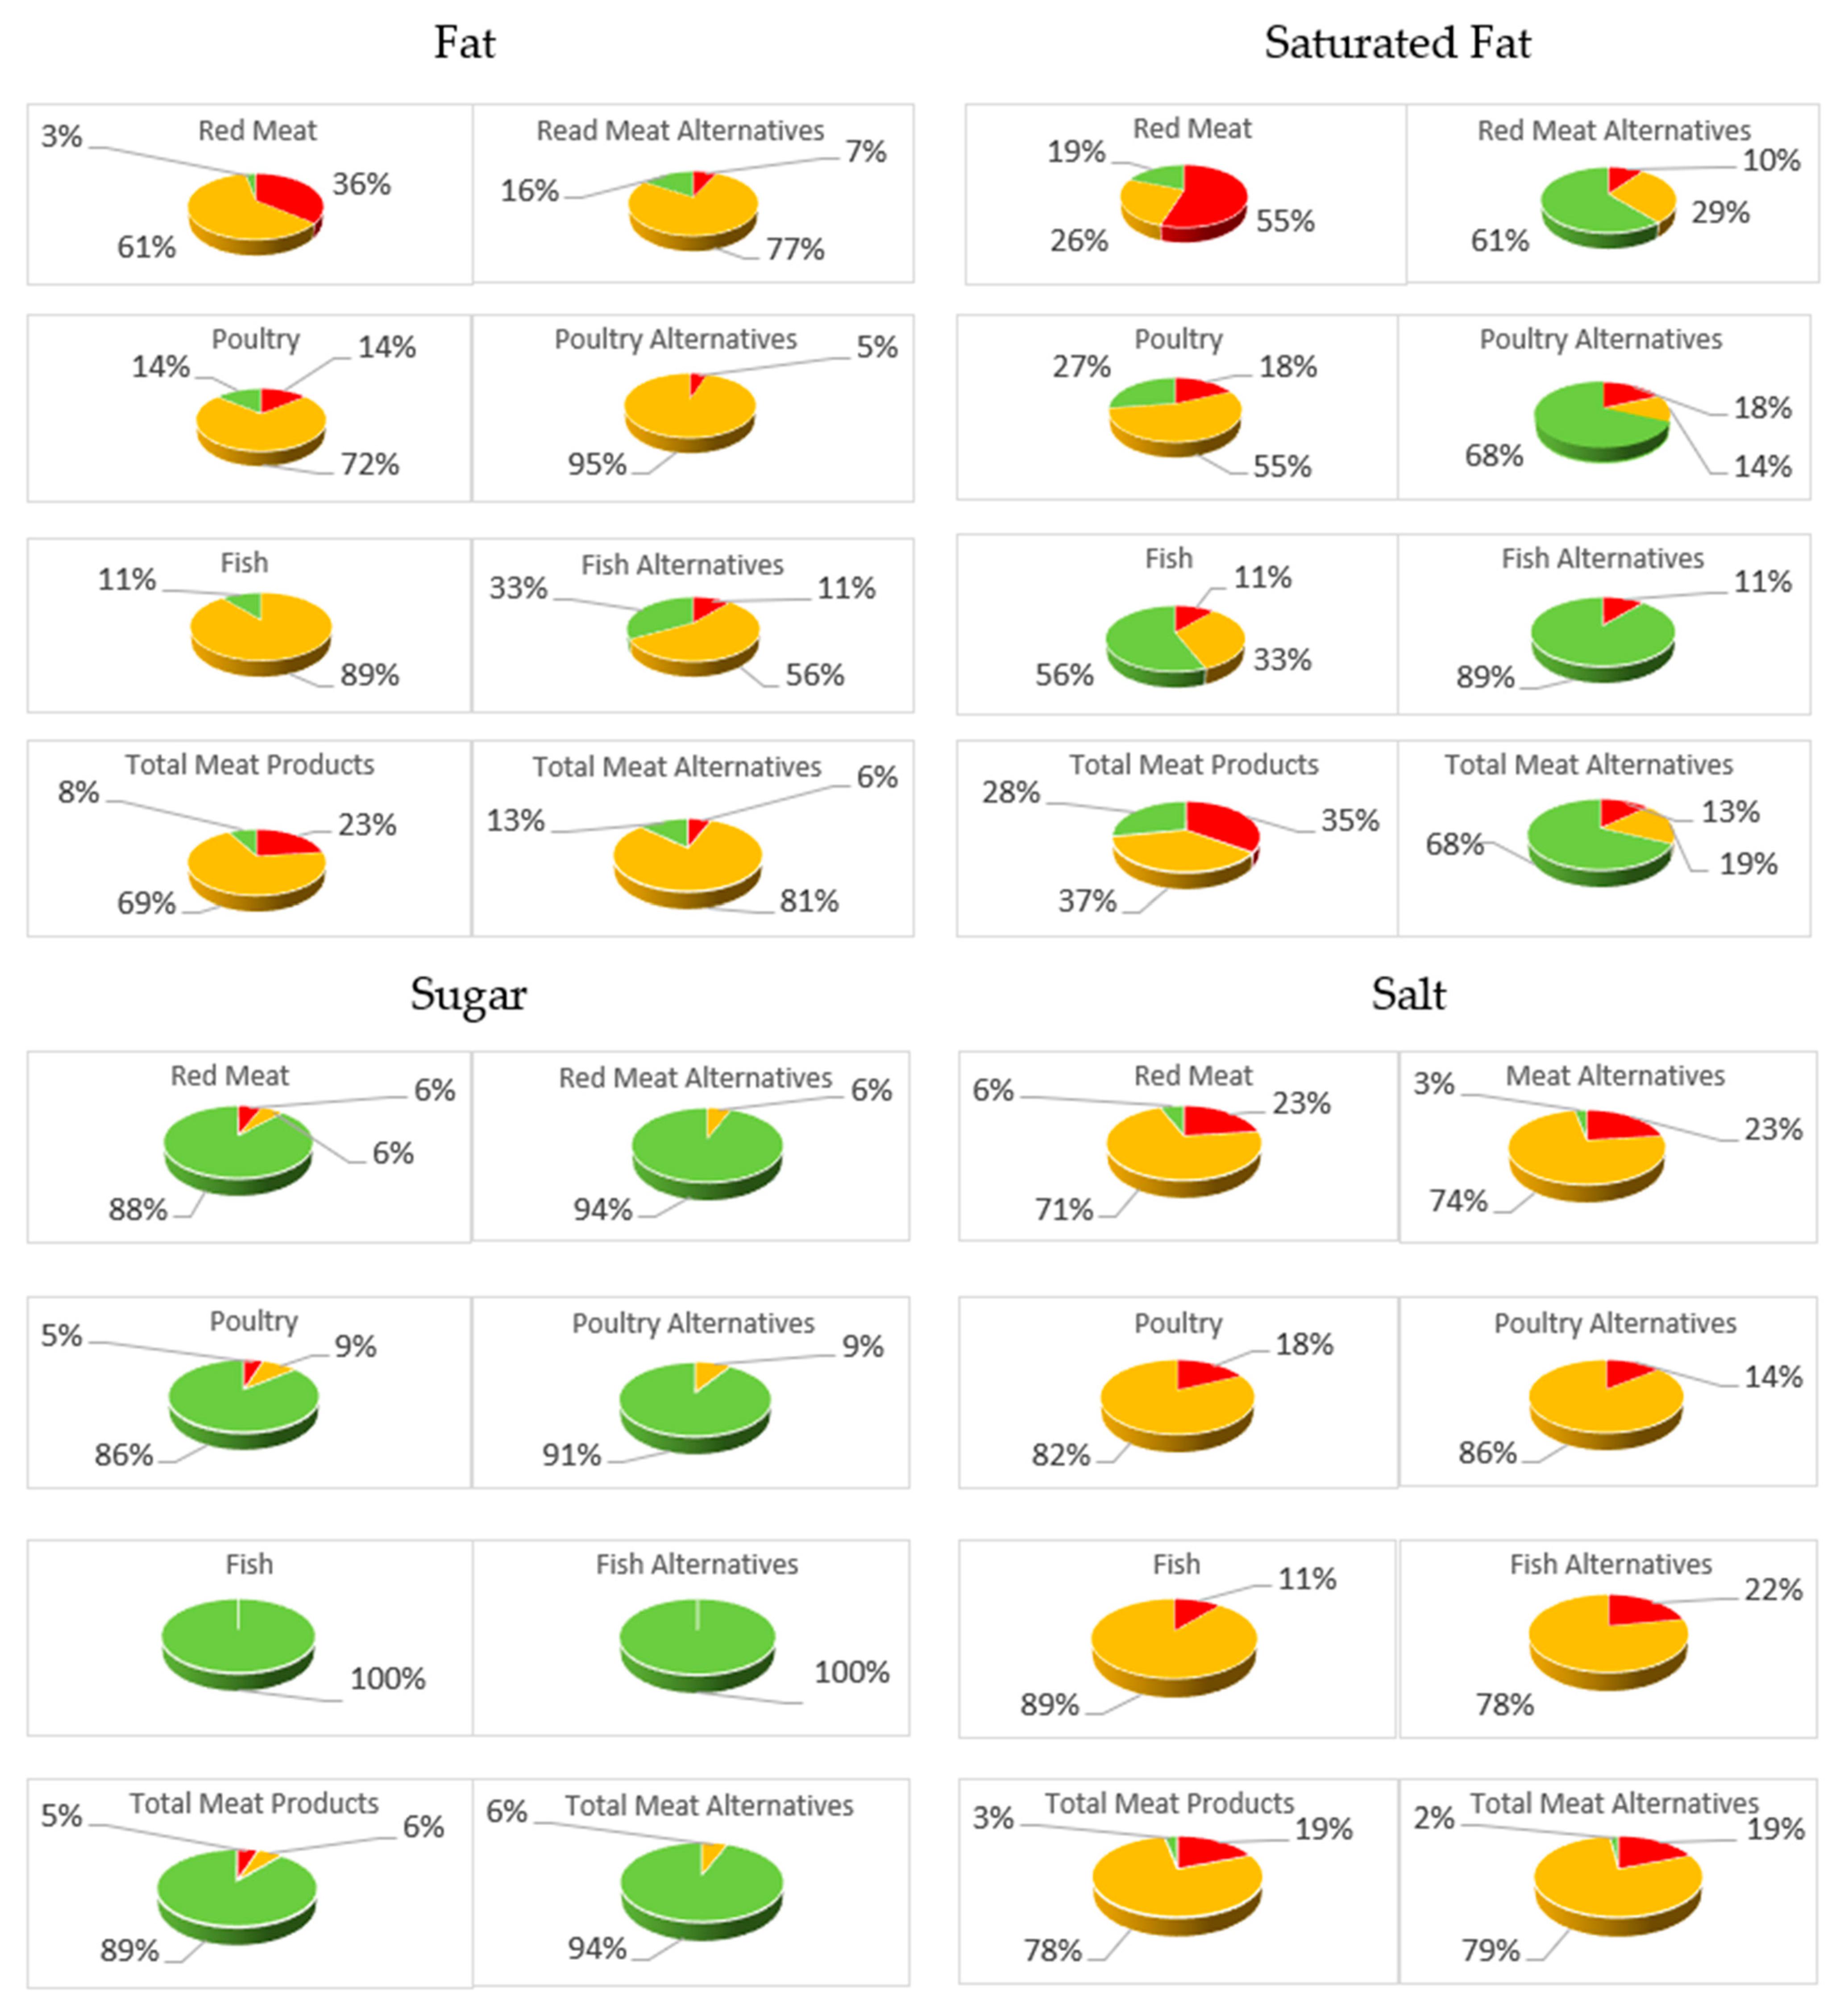
3.2. Front of Pack Nutrition Labels
3.3. Nutrition and Health Claims
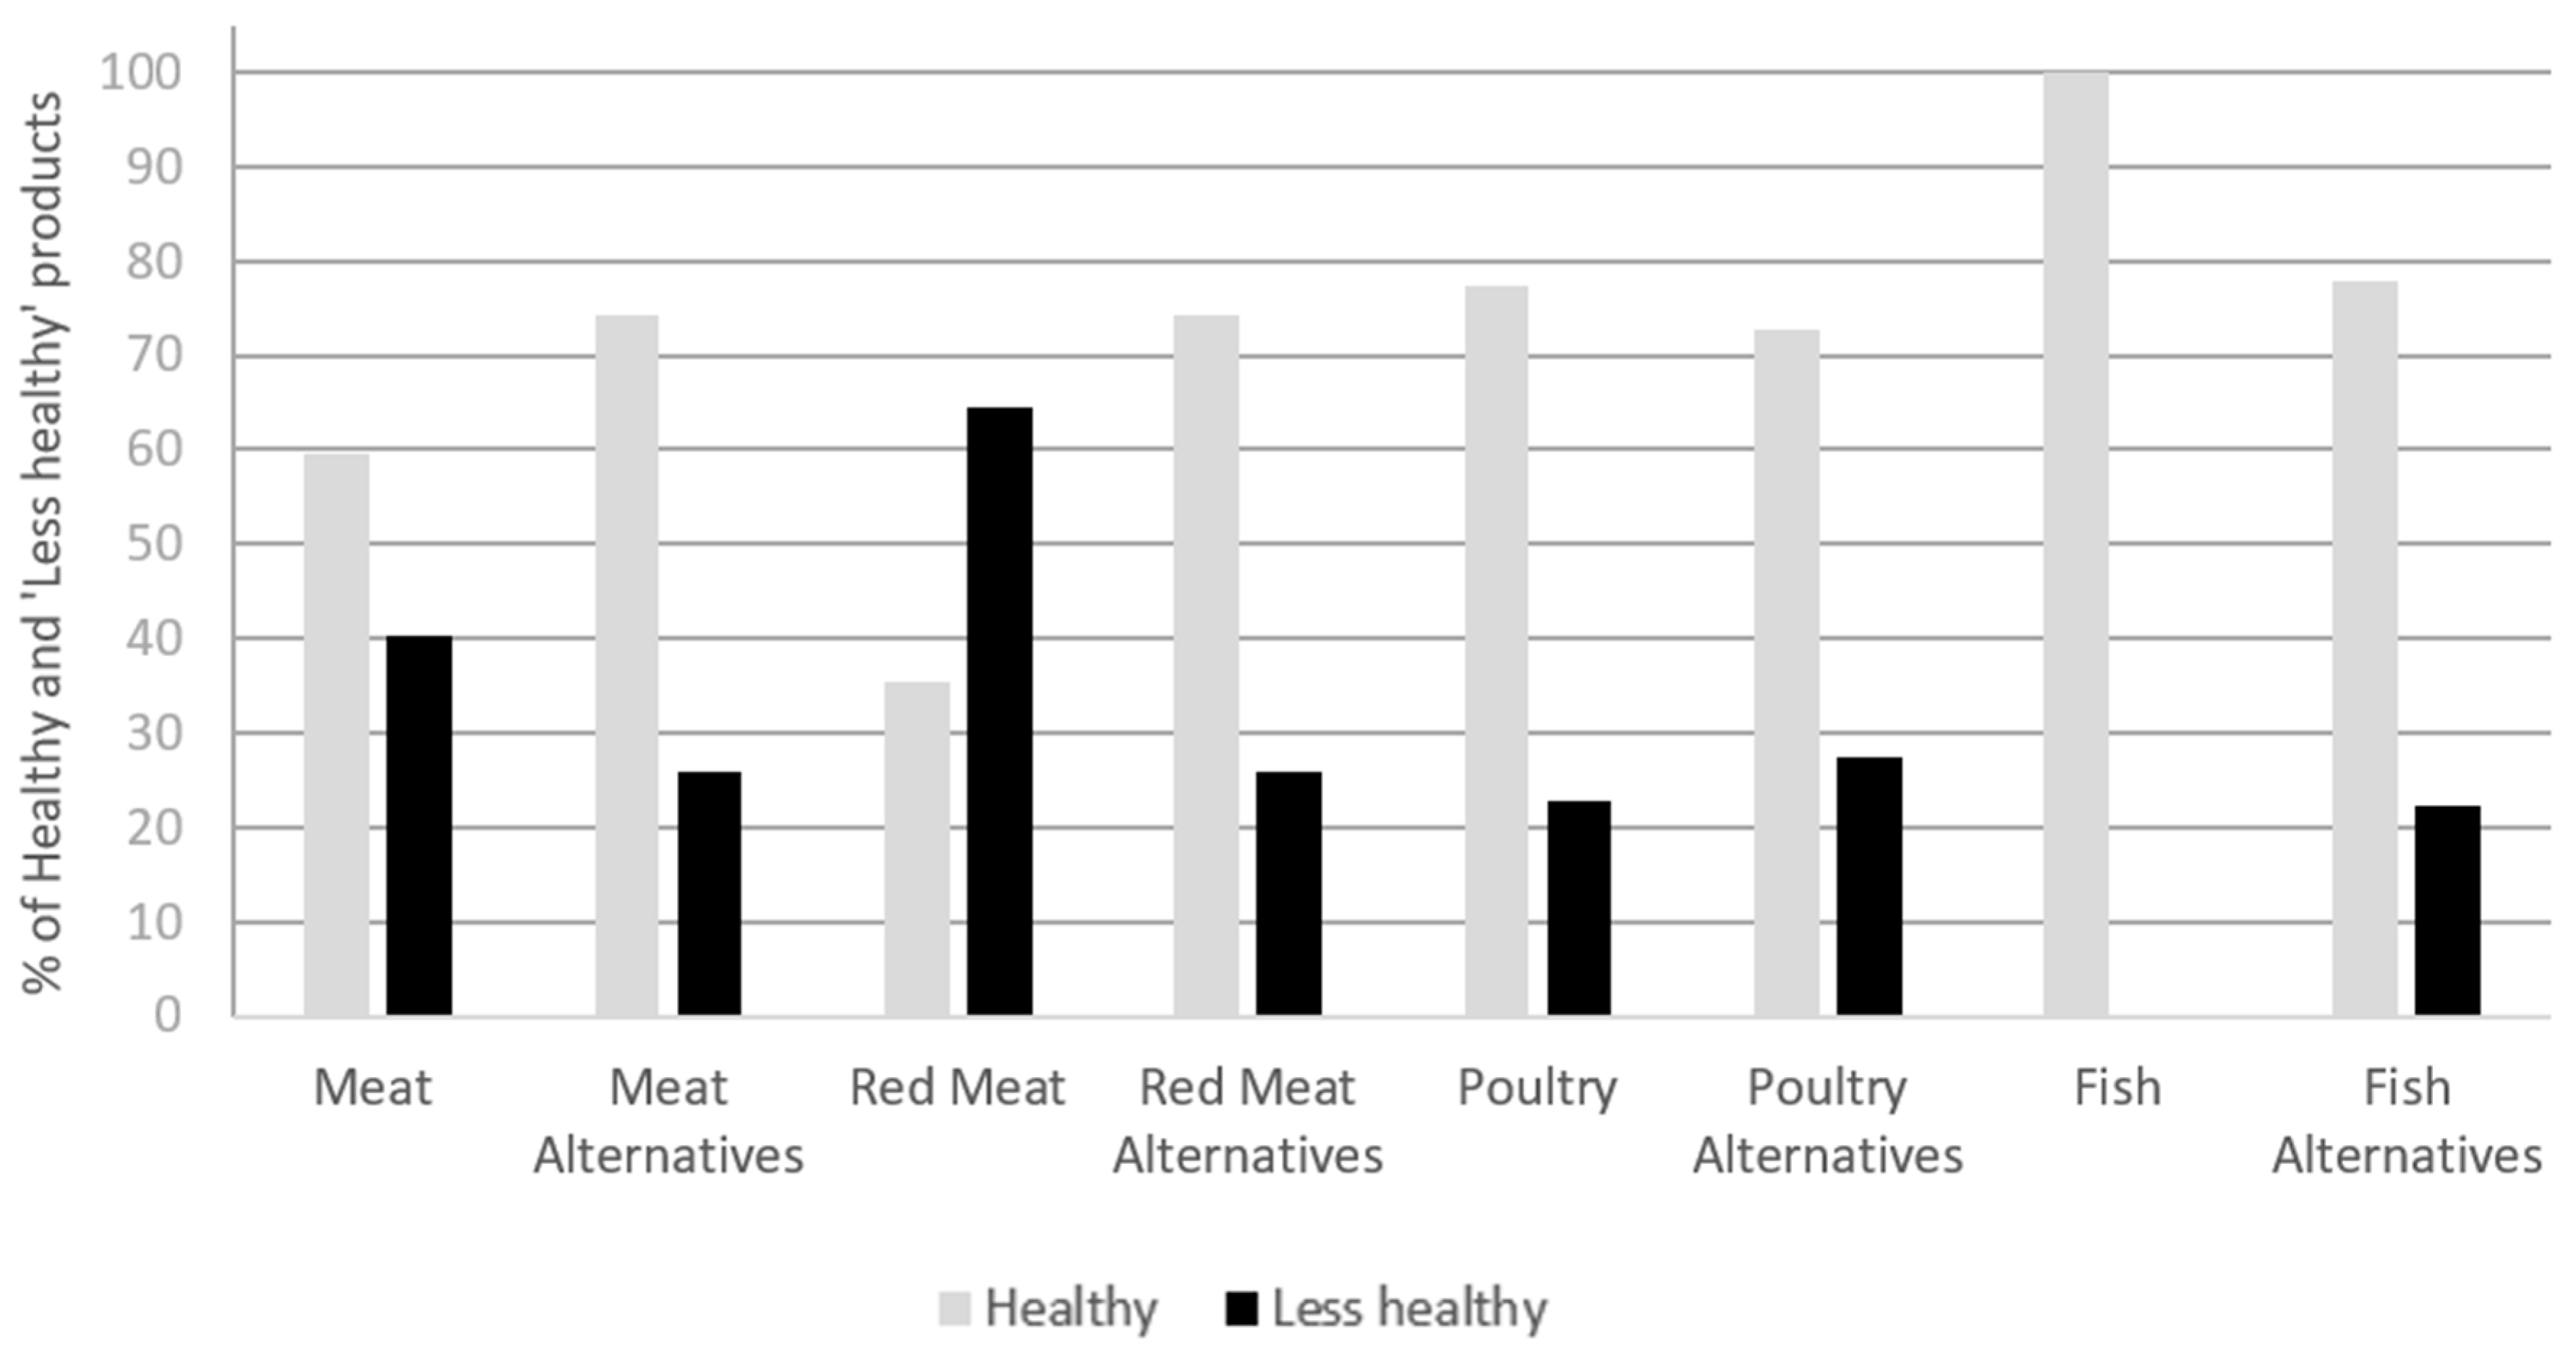
3.4. Healthiness of Foods
4. Discussion
4.1. Nutritional Value
4.2. Nutrient Profiling Model (NPM)
4.3. Health and Nutrition Claims
5. Conclusions
Author Contributions
Funding
Institutional Review Board Statement
Informed Consent Statement
Data Availability Statement
Conflicts of Interest
Appendix A

| Meat Products | Plant-Based Alternatives | |
|---|---|---|
| 1 | Tesco 72 Breaded Chicken Nuggets 1 kg | Tesco Breaded Meat-Free Nuggets 320 g |
| 2 | Tesco 50 Sausage Rolls 750 g | Linda McCartney’s Vegetarian Mini Sausage Rolls 168 g |
| 3 | Tesco Sliced Chorizo Sausage 150 g | Linda McCartney’s Vegetarian Chorizo & Red Pepper 270 g |
| 4 | Heck Italian Chipolatas 340 g | Tesco Meat Free Vegan Chipolatas 300 g |
| 5 | Charlie Bigham’s Fish Pie 340 g | M&S Mushroom Pie 200 g |
| 6 | Asda Tender Beef Stir-Fry Strips 350 g | Dopsu No Beef Pieces 280 g |
| 7 | Birds Eye Beef Burgers with Onions 227 g | Tesco 2 Meat Free Burgers 226 g |
| 8 | Asda Beef Stew & Dumplings 400 g | Waitrose No Beef Bourguignon with Mash 400 g |
| 9 | Asda Flavoursome Oak Smoked Salmon 120 g | Vegan Zeastar Sashimi Zalmon 300 g |
| 10 | Asda Sliced Chargrill Style Chicken Breast 120 g | This Isn’t Chicken Plant-Based Pieces 170 g |
| 11 | Sainsbury’s British Turkey Meatballs 400 g | Tesco 12 Meat Free Balls 336 g |
| 12 | Cajun British Chicken Breast Slices 160 g | Quorn Roast Chicken Style Slices 105 g |
| 13 | Sainsbury’s Pulled Pork with BBQ Sauce 569 g | Tesco BBQ Pulled No-Pork 350 g |
| 14 | Gressingham Crispy Aromatic Half Duck 550 g | Linda McCartney’s Vegetarian Shredded Hoisin Duck 300 g |
| 15 | Itsu Korean BBQ Beef Gyoza 240 g | Asda 10 Vegetable Gyoza 210 g |
| 16 | Morrisons Chicken & Bacon Pasta Bake 400 g | Tesco (Wicked Kitchen) Nana’s Lasagne 700 g |
| 16 | Young’s 2 XL Fillets in Salt & Vinegar Batter 300 g | Birds Eye Fishless Battered Fillets x2 240 g |
| 18 | Morrisons The Best Reduced Fat Sausages 400 g | THIS Isn’t Pork Plant Based Sausages 270 g |
| 19 | Morrisons Reduced Fat Pork Sausages 400 g | Tesco 6 Herby Bangers 300 g |
| 20 | Oakpark Smoked Turkey Breast Rashers 150 g | Asda 10 Meat-Free Bacon Style Rashers 180 g |
| 21 | Waitrose Classic Frankfurters 350 g | Plant Menu 4 Meat Free Hot Dogs 240 g |
| 22 | Waitrose Corned Beef 4 Slices 100 g | Quorn Vegan Roast Beef Style Slices 105 g |
| 23 | Waitrose No.1 Beef Bourguignon 650 g | Tesco (Wicked Kitchen) Beautiful Bourguignon 300 g |
| 24 | Waitrose Italian Recipe Tuna Pasta Bake 380 g | Sainsbury’s Roasted Vegetable Pasta Salad 225 g |
| 25 | M&S 2 Chicken Kyivs 320 g | Tesco 10 Meat Free Bangers in Duvet 220 g |
| 26 | M&S Chicken, Leek & Smoked Bacon Pie 500 g | Magpye Chick’n, Leek & Bacun Pie 200 g |
| 27 | The Jolly Hog Pigs in Blankets 210 g | This Isn’t Pork Plant Based Pigs in Blankets 190 g |
| 28 | M&S British Basted Beef Joint Boneless 450 g | Dopsu No Beef Pieces 280 g |
| 29 | Aldi Melt in The Middle Cod Fishcake 290 g | Waitrose No Fishcakes 260 g |
| 30 | Aldi Meal Kit Teriyaki Beef Stir Fry 500 g | The Tofoo Co. Teriyaki Tofu 280 g |
| 31 | Crestwood Quiche Lorraine 400 g | Pukka Vegan Minced Steak & Onion Pie 210 g |
| 32 | Sainsbury’s 12 Beef Meat Balls 350 g | Taste and Glory 12 Meat Free Vegan Balls 288 g |
| 33 | M&S 12 British Meat Balls 300 g | Linda McCartney’s Vegetarian Meat Balls 240 g |
| 34 | Tesco Finest 12 British Meat Balls 336 g | Taste & Glory 12 No Meat Balls 288 g |
| 35 | Ocado 12 Beef Meat Balls Italian Style 336 g | OUMPH Balls 280 g |
| 36 | Birds Eye 4 Original Beef Burgers 227 g | Quorn Vegan Hot & Spicy Burgers 246 g |
| 37 | M&S Organic 2 British Beef Burgers 225 g | Quorn Ultimate Meat Free Burger 227 g |
| 38 | Iceland Family Beef Lasagne 1.6 kg | Plant Pioneers Vegan Lasagne 400 g |
| 39 | Bisto Spaghetti Bolognese 375 g | Bistro Vegan Spaghetti Bolognese 375 g |
| 40 | M&S Roast Beef 390 g | Sainsbury’s Three Nut Roast 500 g |
| 41 | Iceland 2 Beef Pasties 260 g | Naughty Vegan 2 No Beef Pasties 360 g |
| 42 | Sainsbury’s Lamb Mince 500 g | Linda McCartney’s Vegemince 500 g |
| 43 | Heck Simply Chicken Chipolatas 340 g | Heck meat Free Chicken Chipolatas 300 g |
| 44 | Birds Eye 2 Chicken Burgers 228 g | Birds Eye Chicken free Burgers 200 g |
| 45 | Heck Simply Chicken Burgers 228 g | Linda McCartney’s 2 Quarter Pounder Burgers 227 g |
| 46 | Sainsbury’s Teriyaki Chicken Breast Kebabs 290 g | Vivera Veggie Greek Kebab 175 g |
| 47 | Asda Slow Cooked Chicken Shawarma 580 g | Vivera Plant Shawarma Kebab 175 g |
| 48 | M&S BBQ Chicken Kebabs 100 g | OUMPH Kebab Spiced 280 g |
| 49 | Tesco Ready to Roast Chicken Drumsticks 460 g | Wicked Kitchen No Chicken Drumettes 250 g |
| 50 | M&S Crispy Chicken Nuggets 290 g | Quorn 15 No Chicken Nuggets 300 g |
| 51 | Lovelife Keralan Chicken Biryani 350 g | Sainsbury’s Vegetable Biryani with Basmati Rice 400 g |
| 52 | Pukka Chicken & Mushroom Pie 212 g | Pukka Vegan Chicken and Mushroom Pie 210 g |
| 53 | Sainsbury’s Duck Spring Rolls 200 g | Sainsbury’s 10 No Duck Spring Rolls 180 g |
| 54 | Sainsbury’s 8 Pork Sausages 454 g | Richmond 8 Meat Free Sausages 336 g |
| 55 | M&S 6 Free Range Pork Sausages 400 g | Linda McCartney’s Vegetarian Sausages 270 g |
| 56 | Tesco 2 Melton Mowbray Pork Pies 150 g | Tesco 2 Vegan Porkless Pies 130 g |
| 57 | M&S Cured Smoked Ham 115 g | Quorn Vegetarian Ham Slices 100 g |
| 58 | Tesco Pepperoni Slices 160 g | Quorn Vegan Pepperoni Slices 100 g |
| 59 | Birds Eye 2 Breaded Fish Fillets 200 g | Quorn 2 Breaded Fishless Fillets 200 g |
| 60 | Birds Eye 8 Fish Fingers 200 g | Quorn Fish Fingers 200 g |
| 61 | Asda 2 Cod & parsley Fish Cakes 270 g | Morrisons Thai Style Fishless Cakes 260 g |
| 62 | Tuna Chunks in Spring Water 145 g | Good Catch Plant Based Tuna Naked in Water 94 g |
References
- Saari, U.A.; Herstatt, C.; Tiwari, R.; Dedehayir, O.; Mäkinen, S.J. The vegan trend and the microfoundations of institutional change: A commentary on food producers’ sustainable innovation journeys in Europe. Trends Food Sci. Technol. 2021, 107, 161–167. [Google Scholar] [CrossRef]
- Veganuary: New Report Proves It’s the Trend That Keeps on Trending! Available online: https://veganuary.com/veganuary-2023-in-review/ (accessed on 18 January 2024).
- How Many Vegetarians and Vegans Are in the UK in 2024?—Finder UK. Available online: https://www.finder.com/uk/stats-facts/uk-diet-trends (accessed on 27 May 2024).
- Vegan Food Market: Global Market Value 2024|Statista. Available online: https://www.statista.com/statistics/1280275/value-of-the-global-vegan-food-market/ (accessed on 19 September 2024).
- Plant-Based Food Market Value Worldwide 2030|Statista. Available online: https://www.statista.com/statistics/1280394/global-plant-based-food-market-value/ (accessed on 8 May 2023).
- Andreani, G.; Sogari, G.; Marti, A.; Froldi, F.; Dagevos, H.; Martini, D. Plant-Based Meat Alternatives: Technological, Nutritional, Environmental, Market, and Social Challenges and Opportunities. Nutrients 2023, 15, 452. [Google Scholar] [CrossRef]
- Giacalone, D.; Clausen, M.P.; Jaeger, S.R. Understanding barriers to consumption of plant-based foods and beverages: Insights from sensory and consumer science. Curr. Opin. Food Sci. 2022, 48, 100919. [Google Scholar] [CrossRef]
- Ford, H.; Zhang, Y.; Gould, J.; Danner, L.; Bastian, S.E.P.; Yang, Q. Comparing motivations and barriers to reduce meat and adopt protein alternatives amongst meat-eaters in Australia, China and the UK. Food Qual. Prefer. 2024, 118, 105208. [Google Scholar] [CrossRef]
- Fichera, E.; Von Hinke, S. The response to nutritional labels: Evidence from a quasi-experiment. J. Health Econ. 2020, 72, 102326. Available online: http://www.bristol.ac.uk/red/research-policy/pure/user-guides/ebr-terms/ (accessed on 9 May 2023). [CrossRef]
- Nutrition Labelling|Food Standards Agency. Available online: https://www.food.gov.uk/business-guidance/nutrition-labelling (accessed on 9 May 2023).
- Vergeer, L.; Ahmed, M.; Franco-Arellano, B.; Mulligan, C.; Dickinson, K.; Bernstein, J.T.; Labonté, M.; L’abbé, M.R. Methodology for the Determination of Fruit, Vegetable, Nut and Legume Points for Food Supplies without Quantitative Ingredient Declarations and Its Application to a Large Canadian Packaged Food and Beverage Database. Foods 2020, 9, 1127. [Google Scholar] [CrossRef]
- Drewnowski, A.; Amanquah, D.; Gavin-Smith, B. Perspective: How to Develop Nutrient Profiling Models Intended for Global Use: A Manual. Adv. Nutr. Int. Rev. J. 2021, 12, 609–620. [Google Scholar] [CrossRef]
- Dunford, E.K.; Ni Mhurchu, C.; Huang, L.; Vandevijvere, S.; Swinburn, B.; Pravst, I.; Tolentino-Mayo, L.; Reyes, M.; L’Abbé, M.; Neal, B.C. A comparison of the healthiness of packaged foods and beverages from 12 countries using the Health Star Rating nutrient profiling system, 2013–2018. Obes. Rev. 2019, 20 (Suppl. S2), 107–115. [Google Scholar] [CrossRef]
- Santana, A.H.; Andrade, S.W.B.; Aleman, D.R.; Enríquez, J.P.; Di Iorio, A.B. Evaluation of the Nutritional Quality of Processed Foods in Honduras: Comparison of Three Nutrient Profiles. Int. J. Environ. Res. Public Health 2020, 17, 7060. [Google Scholar] [CrossRef]
- Turnwald, B.P.; Handley-Miner, I.J.; Samuels, N.A.; Markus, H.R.; Crum, A.J. Nutritional Analysis of Foods and Beverages Depicted in Top-Grossing US Movies 1994–2018. JAMA Intern. Med. 1994, 181, 61–70. Available online: https://jamanetwork.com/journals/jamainternalmedicine/fullarticle/2772938 (accessed on 10 May 2023). [CrossRef]
- Coffey, A.A.; Lillywhite, R.; Oyebode, O. Meat versus meat alternatives: Which is better for the environment and health? A nutritional and environmental analysis of animal-based products compared with their plant-based alternatives. J. Hum. Nutr. Diet. 2023, 36, 2147–2156. [Google Scholar] [CrossRef] [PubMed]
- Alessandrini, R.; Brown, M.K.; Pombo-Rodrigues, S.; Bhageerutty, S.; He, F.J.; MacGregor, G.A. Nutritional Quality of Plant-Based Meat Products Available in the UK: A Cross-Sectional Survey. Nutrients 2021, 13, 4225. [Google Scholar] [CrossRef] [PubMed]
- Zhang, L.; Langlois, E.; Williams, K.; Tejera, N.; Omieljaniuk, M.; Finglas, P.; Traka, M.H. A comparative analysis of nutritional quality, amino acid profile, and nutritional supplementations in plant-based products and their animal-based counterparts in the UK. Food Chem. 2024, 448, 139059. [Google Scholar] [CrossRef] [PubMed]
- Lindberg, L.; Mulhall, S.; Woodside, J.; Walton, J.; Nugent, A. The nutritional profile of plant-based meat alternatives compared with meat products: An audit of products available in the UK and Ireland. Proc. Nutr. Soc. 2022, 81, E103. Available online: https://www.cambridge.org/core/journals/proceedings-of-the-nutrition-society/article/nutritional-profile-of-plantbased-meat-alternatives-compared-with-meat-products-an-audit-of-products-available-in-the-uk-and-ireland/3F32615E9E3CAA7675995E995180B258 (accessed on 6 August 2024). [CrossRef]
- Guide to Creating a Front of Pack (FoP) Nutrition Label for Pre-Packed Products Sold through Retail Outlets. 2016. Available online: https://www.gov.uk/government/publications (accessed on 4 June 2023).
- Nutrient Profile Model Calculator. Available online: https://npmcalculator.cdrc.ac.uk/ (accessed on 4 June 2023).
- Nutrient Profiling Technical Guidance. 2011. Available online: http://www.dh.gov.uk/publications (accessed on 10 May 2023).
- Poon, T.; Labonté, M.È.; Mulligan, C.; Ahmed, M.; Dickinson, K.M.; L’Abbé, M.R. Comparison of nutrient profiling models for assessing the nutritional quality of foods: A validation study. Br. J. Nutr. 2018, 120, 567–582. Available online: https://www.cambridge.org/core/journals/british-journal-of-nutrition/article/comparison-of-nutrient-profiling-models-for-assessing-the-nutritional-quality-of-foods-a-validation-study/CFEE176088105E6BE0CF50F687C3511B (accessed on 20 June 2023). [CrossRef]
- Khan, T. Nutritional Comparative Study on Meat Based and Alternative Meat Products. Master’s Thesis, University of Lincoln, Lincoln, UK, 2021. [Google Scholar]
- Rizzolo-Brime, L.; Orta-Ramirez, A.; Martin, Y.P.; Jakszyn, P. Nutritional Assessment of Plant-Based Meat Alternatives: A Comparison of Nutritional Information of Plant-Based Meat Alternatives in Spanish Supermarkets. Nutrients 2023, 15, 1325. [Google Scholar] [CrossRef]
- Cole, E.; Goeler-Slough, N.; Cox, A.; Nolden, A. Examination of the nutritional composition of alternative beef burgers available in the United States. Int. J. Food Sci. Nutr. 2021, 73, 425–432. [Google Scholar] [CrossRef] [PubMed]
- Sacks, F.M.; Lichtenstein, A.H.; Wu, J.H.Y.; Appel, L.J.; Creager, M.A.; Kris-Etherton, P.M.; Miller, M.; Rimm, E.B.; Rudel, L.L.; Robinson, J.G.; et al. Dietary Fats and cardiovascular disease: A presidential advisory from the American Heart Association. Circulation 2017, 136, e1–e23. [Google Scholar] [CrossRef]
- Bajželj, B.; Laguzzi, F.; Röös, E. The role of fats in the transition to sustainable diets. Lancet Planet. Health 2021, 5, e644–e653. [Google Scholar] [CrossRef]
- Ratnayake, W.N.; Gilani, G.S. Nutritional and Health Effects of Dietary Fats. Pak. J. Nutr. 2004, 3, 205–212. Available online: https://www.researchgate.net/publication/26563385_Nutritional_and_Health_Effects_of_Dietary_Fats (accessed on 20 January 2024).
- Manson, J.E.; Cook, N.R.; Lee, I.-M.; Christen, W.; Bassuk, S.S.; Mora, S.; Gibson, H.; Albert, C.M.; Gordon, D.; Copeland, T.; et al. Marine n−3 Fatty Acids and Prevention of Cardiovascular Disease and Cancer. N. Engl. J. Med. 2019, 380, 23–32. [Google Scholar] [CrossRef] [PubMed]
- Forouhi, N.G.; Krauss, R.M.; Taubes, G.; Willett, W. Dietary fat and cardiometabolic health: Evidence, controversies, and consensus for guidance. BMJ 2018, 361, k2139. [Google Scholar] [CrossRef] [PubMed]
- Astrup, A.; Magkos, F.; Bier, D.M.; Brenna, J.T.; de Oliveira Otto, M.C.; Hill, J.O.; King, J.C.; Mente, A.; Ordovas, J.M.; Volek, J.S.; et al. Saturated Fats and Health: A Reassessment and Proposal for Food-Based Recommendations: JACC State-of-the-Art Review. J. Am. Coll. Cardiol. 2020, 76, 844–857. [Google Scholar] [CrossRef] [PubMed]
- Myhre, J.B.; Løken, E.B.; Wandel, M.; Andersen, L.F. Differences in nutrient composition and choice of side dishes between red meat and fish dinners in Norwegian adults. Food Nutr. Res. 2016, 60, 29555. [Google Scholar] [CrossRef] [PubMed]
- Abbas, K.A.; Mohamed, A.; Jamilah, B. Fatty Acids in Fish and Beef and Their Nutritional Values: A Review. J. Food Agric. Environ. Available online: https://www.researchgate.net/publication/255613645_Fatty_acids_in_fish_and_beef_and_their_nutritional_values_A_review (accessed on 25 May 2024).
- Daniel, C.R.; Cross, A.J.; Graubard, B.I.; Hollenbeck, A.R.; Park, Y.; Sinha, R. Prospective investigation of poultry and fish intake in relation to cancer risk. Cancer Prev. Res. 2011, 4, 1903–1911. [Google Scholar] [CrossRef]
- Bryngelsson, S.; Moshtaghian, H.; Bianchi, M.; Hallström, E. Nutritional assessment of plant-based meat analogues on the Swedish market. Int. J. Food Sci. Nutr. 2022, 73, 889–901. [Google Scholar] [CrossRef]
- Sultan, L.; Maganinho, M.; Padrão, P. Comparative assessment of the nutritional composition and degree of processing of meat products and their plant-based analogues. J. Food Compos. Anal. 2024, 133, 106390. [Google Scholar] [CrossRef]
- Silva RC da Ferdaus, M.J.; Foguel, A.; da Silva, T.L.T. Oleogels as a Fat Substitute in Food: A Current Review. Gels 2023, 9, 180. Available online: https://www.mdpi.com/2310-2861/9/3/180/htm (accessed on 17 August 2024). [CrossRef]
- Munialo, C.D.; Vriesekoop, F. Plant-based foods as meat and fat substitutes. Food Sci. Nutr. 2023, 11, 4898–4911. [Google Scholar] [CrossRef]
- Wu, G. Dietary protein intake and human health. Food Funct. 2016, 7, 1251–1265. Available online: https://pubmed.ncbi.nlm.nih.gov/26797090/ (accessed on 30 July 2023). [CrossRef]
- Lim, M.T.; Pan, B.J.; Toh, D.W.K.; Sutanto, C.N.; Kim, J.E. Animal Protein versus Plant Protein in Supporting Lean Mass and Muscle Strength: A Systematic Review and Meta-Analysis of Randomized Controlled Trials. Nutrients 2021, 13, 661. [Google Scholar] [CrossRef] [PubMed]
- Soh, B.X.P.; Smith, N.W.; von Hurst, P.R.; McNabb, W.C. Evaluation of Protein Adequacy From Plant-Based Dietary Scenarios in Simulation Studies: A Narrative Review. J. Nutr. 2024, 154, 300–313. [Google Scholar] [CrossRef]
- Lawrence, A.S.; Huang, H.; Johnson, B.J.; Wycherley, T.P. Impact of a Switch to Plant-Based Foods That Visually and Functionally Mimic Animal-Source Meat and Dairy Milk for the Australian Population—A Dietary Modelling Study. Nutrients 2023, 15, 1825. [Google Scholar] [CrossRef]
- Farsi, D.N.; Uthumange, D.; Munoz, J.M.; Commane, D.M. The nutritional impact of replacing dietary meat with meat alternatives in the UK: A modelling analysis using nationally representative data. Br. J. Nutr. 2022, 127, 1731–1741. [Google Scholar] [CrossRef] [PubMed]
- NDNS: Results from Years 9 to 11 (Combined)—Statistical Summary—GOV.UK. Available online: https://www.gov.uk/government/statistics/ndns-results-from-years-9-to-11-2016-to-2017-and-2018-to-2019/ndns-results-from-years-9-to-11-combined-statistical-summary (accessed on 21 January 2024).
- Švarc, P.L.; Jensen, M.B.; Langwagen, M.; Poulsen, A.; Trolle, E.; Jakobsen, J. Nutrient content in plant-based protein products intended for food composition databases. J. Food Compos. Anal. 2021, 106, 104332. [Google Scholar] [CrossRef]
- Pointke, M.; Pawelzik, E. Plant-Based Alternative Products: Are They Healthy Alternatives? Micro- and Macronutrients and Nutritional Scoring. Nutrients 2022, 14, 601. [Google Scholar] [CrossRef]
- Formulating Plant-Based Foods—Nutrition Challenges and Opportunities. Available online: https://khni.kerry.com/news/formulating-plant-based-foods-nutrition-tips/ (accessed on 26 May 2024).
- Romão, B.; Botelho, R.B.A.; Torres, M.L.; Maynard, D.d.C.; de Holanda, M.E.M.; Borges, V.R.P.; Raposo, A.; Zandonadi, R.P. Nutritional Profile of Commercialized Plant-Based Meat: An Integrative Review with a Systematic Approach. Foods 2023, 12, 448. [Google Scholar] [CrossRef]
- Haron, H.; Hiew, I.; Shahar, S.; Michael, V.; Ambak, R. A Survey on Salt Content Labeling of the Processed Food Available in Malaysia. Int. J. Environ. Res. Public Health 2020, 17, 2469. [Google Scholar] [CrossRef]
- Taghian Dinani, S.; Zhang, Y.; Vardhanabhuti, B.; Jan van der Goot, A. Enhancing textural properties in plant-based meat alternatives: The impact of hydrocolloids and salts on soy protein-based products. Curr. Res. Food Sci. 2023, 7, 100571. [Google Scholar] [CrossRef] [PubMed]
- Cornet, S.H.; Snel, S.J.; Lesschen, J.; van der Goot, A.J.; van der Sman, R.G. Enhancing the water holding capacity of model meat analogues through marinade composition. J. Food Eng. 2021, 290, 110283. [Google Scholar] [CrossRef]
- He, F.J.; Tan, M.; Ma, Y.; MacGregor, G.A. Salt Reduction to Prevent Hypertension and Cardiovascular Disease: JACC State-of-the-Art Review. J. Am. Coll. Cardiol. 2020, 75, 632–647. Available online: https://pubmed.ncbi.nlm.nih.gov/32057379/ (accessed on 30 July 2023). [CrossRef] [PubMed]
- Salt Reduction Targets for 2024. 2020. Available online: https://assets.publishing.service.gov.uk/media/5f5618c8d3bf7f4d75de6ff1/2024_salt_reduction_targets_070920-FINAL-1.pdf (accessed on 30 July 2023).
- Melville, H.; Shahid, M.; Gaines, A.; McKenzie, B.L.; Alessandrini, R.; Trieu, K.; Wu, J.H.Y.; Rosewarne, E.; Coyle, D.H. The nutritional profile of plant-based meat analogues available for sale in Australia. Nutr. Diet. 2023, 80, 211–222. [Google Scholar] [CrossRef] [PubMed]
- Duranti, M. Grain legume proteins and nutraceutical properties. Fitoterapia 2006, 77, 67–82. [Google Scholar] [CrossRef] [PubMed]
- Berrazaga, I.; Micard, V.; Gueugneau, M.; Walrand, S. The Role of the Anabolic Properties of Plant- versus Animal-Based Protein Sources in Supporting Muscle Mass Maintenance: A Critical Review. Nutrients 2019, 11, 1825. [Google Scholar] [CrossRef]
- Nurmilah, S.; Cahyana, Y.; Utama, G.L.; Aït-Kaddour, A. Strategies to Reduce Salt Content and Its Effect on Food Characteristics and Acceptance: A Review. Foods 2022, 11, 3120. [Google Scholar] [CrossRef]
- Benson, T.; Lavelle, F.; Bucher, T.; McCloat, A.; Mooney, E.; Egan, B.; Collins, C.E.; Dean, M. The Impact of Nutrition and Health Claims on Consumer Perceptions and Portion Size Selection: Results from a Nationally Representative Survey. Nutrients 2018, 10, 656. [Google Scholar] [CrossRef]
- Alcorta, A.; Porta, A.; Tárrega, A.; Alvarez, M.D.; Vaquero, M.P. Foods for Plant-Based Diets: Challenges and Innovations. Foods 2021, 10, 293. [Google Scholar] [CrossRef]
 : red meat,
  : poultry,
  : fish), SS: Serving size, F: Fat, SF: Saturated fat, Su: Sugar, Sa: Salt.
: red meat, : poultry, : fish), SS: Serving size, F: Fat, SF: Saturated fat, Su: Sugar, Sa: Salt.
: fish), SS: Serving size, F: Fat, SF: Saturated fat, Su: Sugar, Sa: Salt.
: red meat, : poultry, : fish), SS: Serving size, F: Fat, SF: Saturated fat, Su: Sugar, Sa: Salt.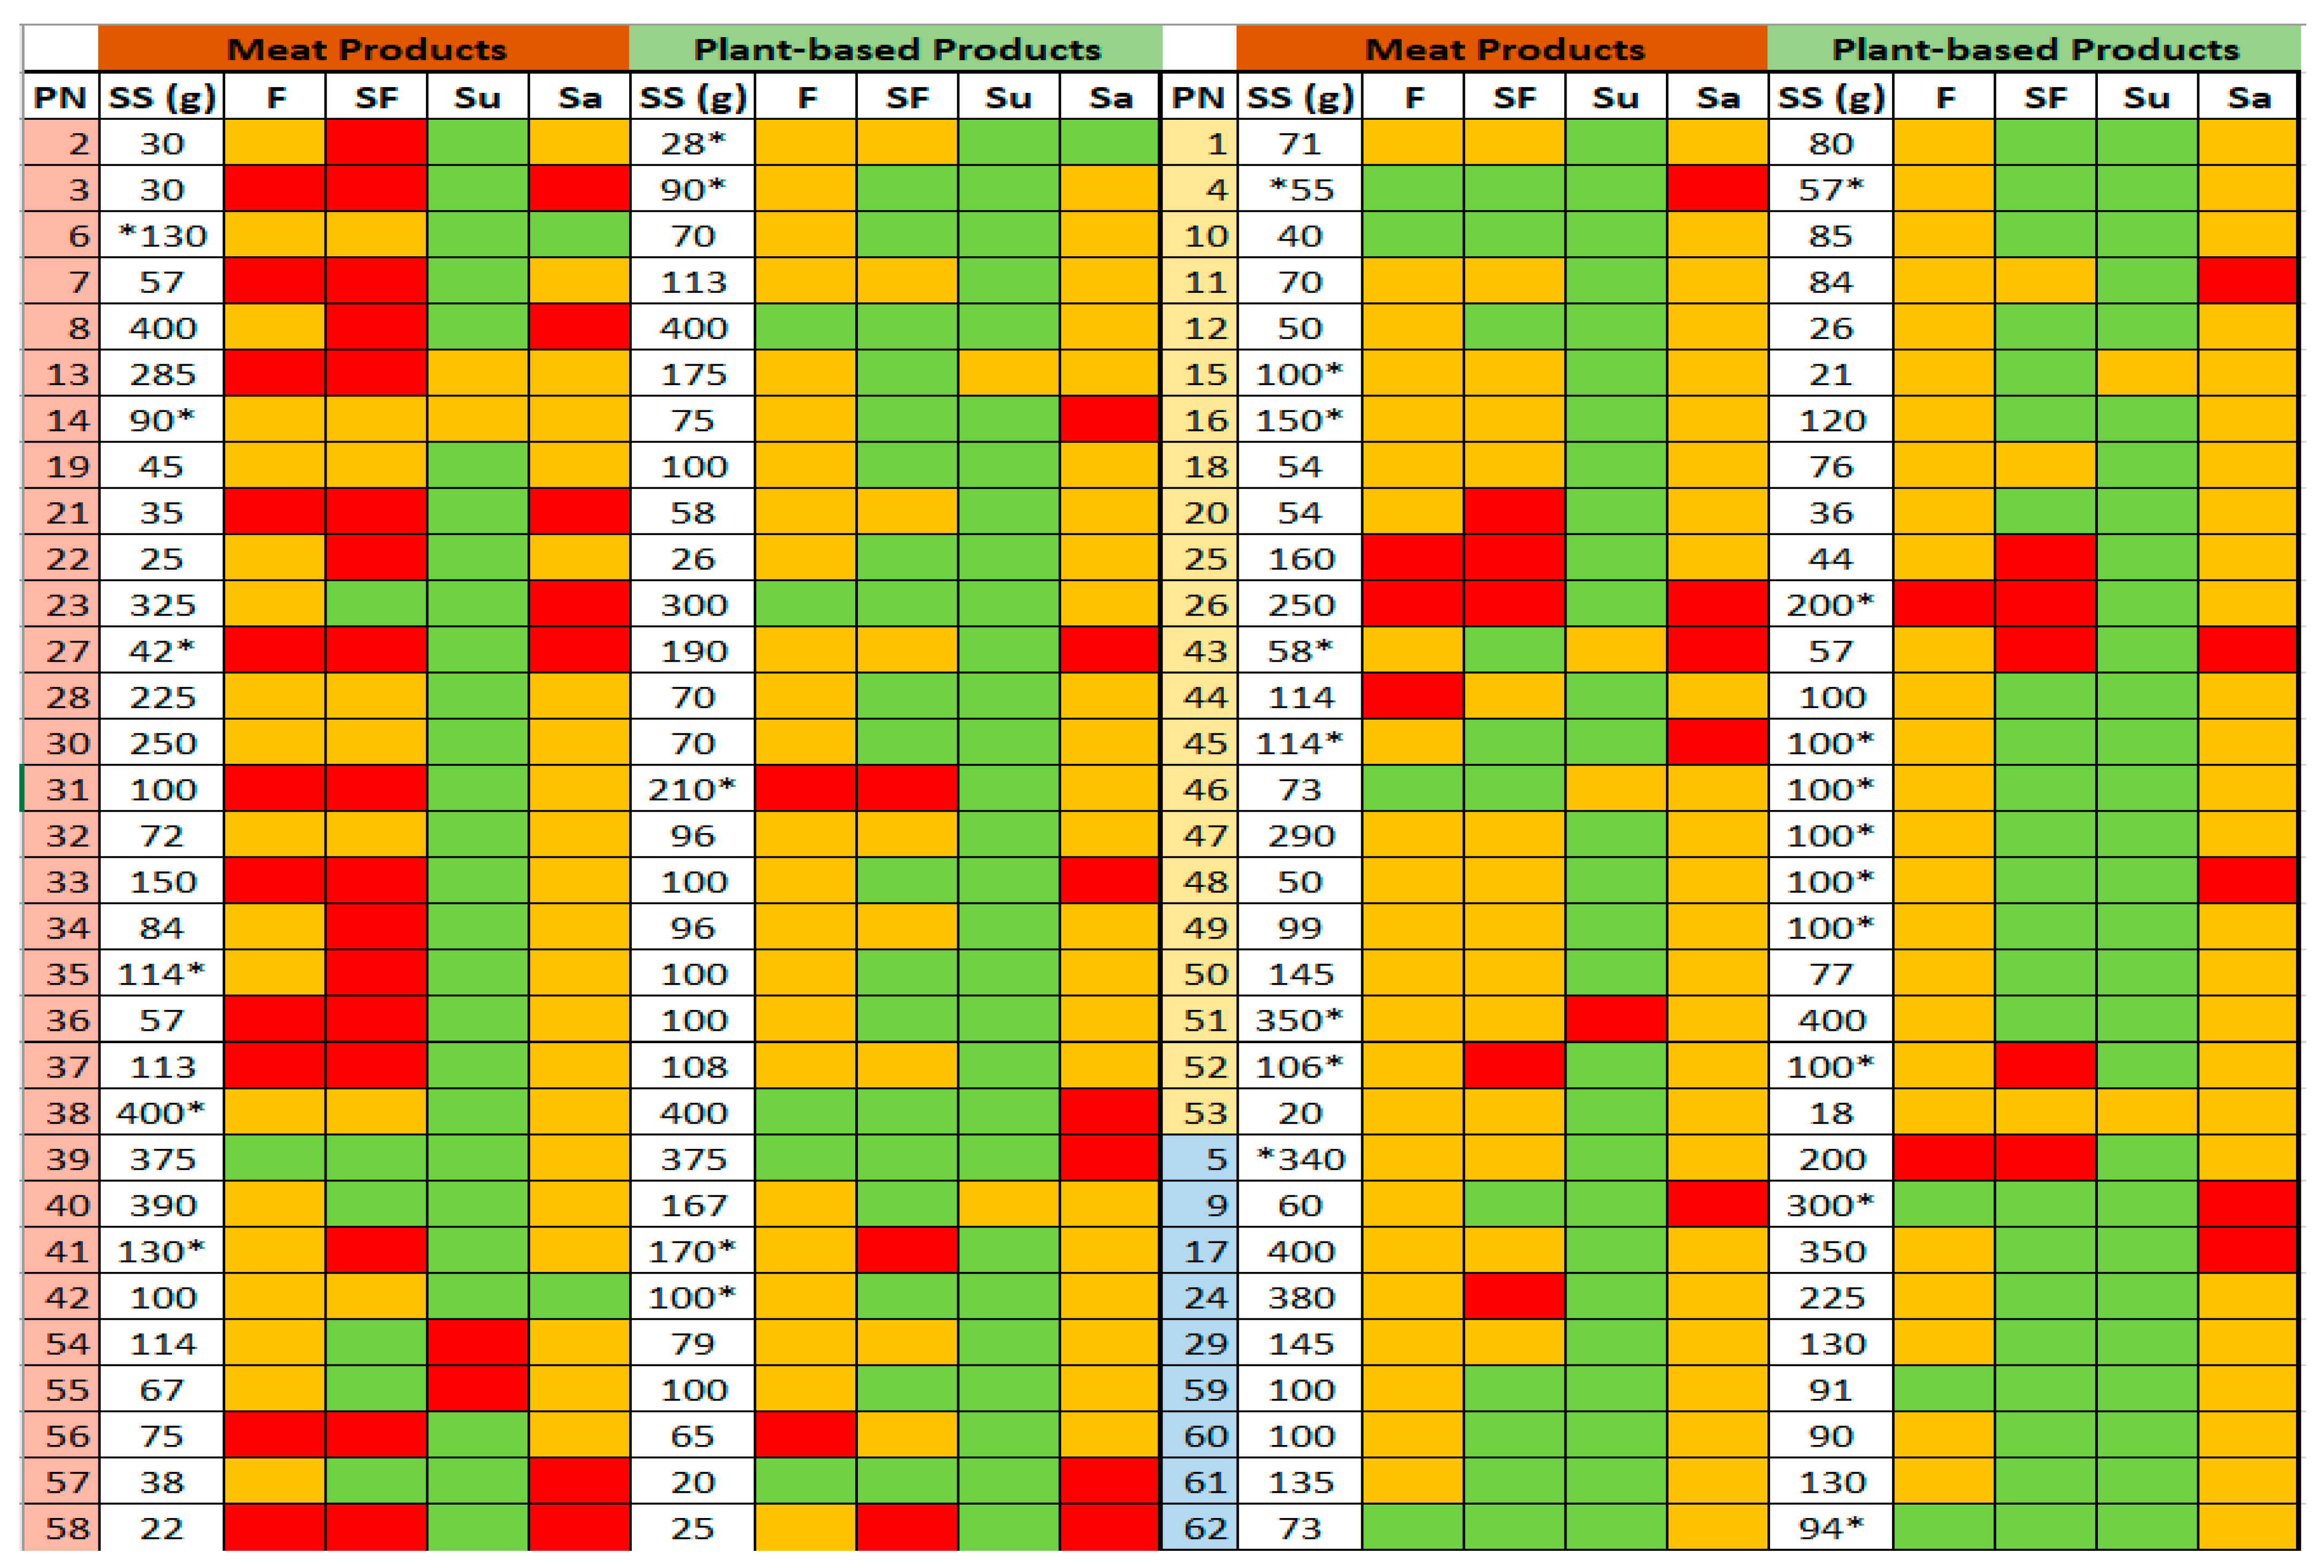
| FVN Content (%) | ‘In-House’ Criteria Based on the Ingredients List Used to Estimate FVN Content |
|---|---|
| Non-concentrated FVN ingredients | |
| ≤40 | FVN is not one of the first two ingredients. |
| >40 | FVN is the second ingredient. |
| >60 | FVN is the first ingredient, but non-FVN ingredients contribute substantially to the product’s weight. |
| >80 | FVN is the first ingredient, and only FVN ingredients contribute substantially to the product’s weight. |
| Concentrated FVN ingredients | |
| ≤40 | FVN is not one of the first three ingredients. |
| >40 | FVN is the second ingredient, but the amounts of the first and second ingredients are not similar. |
| >60 | FVN is the first ingredient, but non-FVN ingredients appear substantially to the product’s weight. |
| >80 | FVN is the first ingredient, and only FVN ingredients contribute substantially to the product’s weight. |
| Meat Products | Plant-Based (PB) | p-Value | |
|---|---|---|---|
| Meat (n = 62) vs. PB alternative | |||
| Energy (kcal) | 202.0 ± 9.4 | 194.0 ± 9 | 0.377 |
| Fat (g) | 10.9 ± 1 | 8.9 ± 0.6 | 0.029 |
| Saturated fat (g) | 3.8 ± 0.4 | 1.9 ± 0.3 | <0.001 |
| Carbohydrates (g) | 9.5 ± 1.1 | 14.4 ± 1.2 | <0.001 |
| Sugar (g) | 1.8 ± 0.3 | 1.9 ± 0.2 | 0.742 |
| Protein (g) | 16.3 ± 1.6 | 12 ± 0.8 | <0.001 |
| Fibre (g) | 1.2 ± 0.2 | 4.1 ± 0.3 | <0.001 |
| Salt (g) | 1.0 ± 0.1 | 1.1 ± 0.1 | 0.151 |
| Red meat (n = 31) vs. PB alternative | |||
| Energy (kcal) | 221.0 ± 14.7 | 184.0 ± 10.5 | <0.001 |
| Fat (g) | 13.7 ± 1.6 | 8.3 ± 0.8 | <0.001 |
| Saturated fat (g) | 5.3 ± 0.6 | 2 ± 0.4 | <0.001 |
| Carbohydrates (g) | 8.3 ± 1.5 | 12.3 ± 1.4 | <0.001 |
| Sugar (g) | 1.5 ± 0.3 | 2.1 ± 0.4 | 0.105 |
| Protein (g) | 16 ± 1.2 | 12.9 ± 1.0 | <0.001 |
| Fibre (g) | 1.2 ± 0.2 | 4.2 ± 0.5 | <0.001 |
| Salt (g) | 1.1 ± 0.2 | 1.1 ± 0.1 | 0.828 |
| Poultry (n = 22) vs. PB alternative | |||
| Energy (kcal) | 183.0 ± 63.0 | 216.0 ± 87.0 | 0.026 |
| Fat (g) | 8.0 ± 1.2 | 10.6 ± 1.2 | 0.010 |
| Saturated fat (g) | 2.3 ± 0.5 | 2.0 ± 0.5 | 0.503 |
| Carbohydrates (g) | 9.6 ± 1.7 | 14.3 ± 2.4 | 0.022 |
| Sugar (g) | 2.0 ± 0.5 | 1.8 ± 0.4 | 0.747 |
| Protein (g) | 21.9 ± 4.0 | 13.4 ± 1.5 | <0.001 |
| Fibre (g) | 1.2 ± 0.3 | 4.4 ± 0.4 | <0.001 |
| Salt (g) | 0.9 ± 0.1 | 1.2 ± 0.1 | 0.030 |
| Fish (n = 9) vs. PB alternative | |||
| Energy (kcal) | 176 ± 13.2 | 177 ± 20 | 0.966 |
| Fat (g) | 8.0 ± 1.3 | 6.7 ± 1.5 | 0.359 |
| Saturated fat (g) | 1.7 ± 0.4 | 1.0 ± 0.5 | 0.101 |
| Carbohydrates (g) | 12.5 ± 2.6 | 22.1 ± 2.7 | <0.001 |
| Sugar (g) | 1.3 ± 0.3 | 1.6 ± 0.6 | 0.656 |
| Protein (g) | 13.1 ± 2.2 | 5.7 ± 1.8 | 0.009 |
| Fibre (g) | 3.6 ± 2.6 | 2.5 ± 0.6 | 0.712 |
| Salt (g) | 0.8 ± 0.1 | 1.0 ± 0.1 | 0.012 |
| Meat Products | Plant-Based Alternatives | ||
|---|---|---|---|
| Product No | Claim | Product No | Claim |
| 18 | 30% Less fat | 6 | High protein |
| 19 | 50% Less fat | 18 | High protein/source of fibre/75% Less fat |
| 32 | High protein | 20 | Source of protein/High fibre |
| 20 | Low fat/High protein/Low energy | 21 | High protein |
| 43 | High protein | 22 | High protein/source of fibre |
| 45 | Low fat/High protein | 27 | High protein/High fibre |
| 51 | Low fat | 28 | High protein/Low saturated fat |
| 9 | High omega-3 | 32 | High protein/source of fibre |
| 60 | Source of omega-3 | 34 | Source of protein/source of fibre |
 | 36 | High protein/High fibre/Low saturated fat | |
| 37 | High protein/source of fibre | ||
| 46 | High protein/Source of vitamin B12/Source of iron | ||
| 47 | High protein/Source of vitamin B12/Source of iron | ||
| 54 | High protein | ||
| 4 | High protein | ||
| 10 | High protein/High fibre/Source of vitamin B12/Source of iron | ||
| 12 | High protein/Low saturated fat/source of fibre | ||
| 14 | High protein/Low saturated fat | ||
| 43 | High protein/High fibre/Low fat | ||
| 44 | Source of protein/High fibre | ||
| 50 | Source of protein/Low saturated fat | ||
| 59 | Source of fibre | ||
| 60 | Source of fibre/Low saturated fat | ||
| 61 | Source of fibre/Low saturated fat | ||
| 62 | High protein/High omega-3 | ||
Disclaimer/Publisher’s Note: The statements, opinions and data contained in all publications are solely those of the individual author(s) and contributor(s) and not of MDPI and/or the editor(s). MDPI and/or the editor(s) disclaim responsibility for any injury to people or property resulting from any ideas, methods, instructions or products referred to in the content. |
© 2024 by the authors. Licensee MDPI, Basel, Switzerland. This article is an open access article distributed under the terms and conditions of the Creative Commons Attribution (CC BY) license (https://creativecommons.org/licenses/by/4.0/).
Share and Cite
Ciobotaru, R.; Tas, A.A.; Khan, T.A. Healthiness of Meat-Based Products in Comparison to Their Plant-Based Alternatives in the UK Market: A Packaging Evaluation. Foods 2024, 13, 3346. https://doi.org/10.3390/foods13213346
Ciobotaru R, Tas AA, Khan TA. Healthiness of Meat-Based Products in Comparison to Their Plant-Based Alternatives in the UK Market: A Packaging Evaluation. Foods. 2024; 13(21):3346. https://doi.org/10.3390/foods13213346
Chicago/Turabian StyleCiobotaru, Ruxandra, Ayten Aylin Tas, and Tabrez Ahmed Khan. 2024. "Healthiness of Meat-Based Products in Comparison to Their Plant-Based Alternatives in the UK Market: A Packaging Evaluation" Foods 13, no. 21: 3346. https://doi.org/10.3390/foods13213346
APA StyleCiobotaru, R., Tas, A. A., & Khan, T. A. (2024). Healthiness of Meat-Based Products in Comparison to Their Plant-Based Alternatives in the UK Market: A Packaging Evaluation. Foods, 13(21), 3346. https://doi.org/10.3390/foods13213346