
Characterization of Key Compounds of Organic Acids and Aroma Volatiles in Fruits of Different Actinidia argute Resources Based on High-Performance Liquid Chromatography (HPLC) and Headspace Gas Chromatography–Ion Mobility Spectrometry (HS-GC-IMS)

 ,
,
Abstract
:1. Introduction
2. Materials and Methods
2.1. Materials and Reagents
2.1.1. Materials
2.1.2. Reagents
2.2. Instruments and Equipment
2.3. Methods
2.3.1. Determination of Soluble Sugar and Titratable Acid Content
2.3.2. Determination of Organic Acid Content
2.3.3. HS-GC-IMS Analytical Methods
2.4. Odor Activity Value (OAV) Calculation
2.5. Data Processing
3. Results and Analysis
3.1. Analysis of Soluble Sugar Content, Titratable Acid Content, and Sugar–Acid Ratio of Fruits from Different A. arguta Resources
3.2. Analysis of Organic Acid Content in Fruits of Different A. arguta Resources
3.3. HS-GC-IMS Analysis of Fruits from Different A. arguta Resources
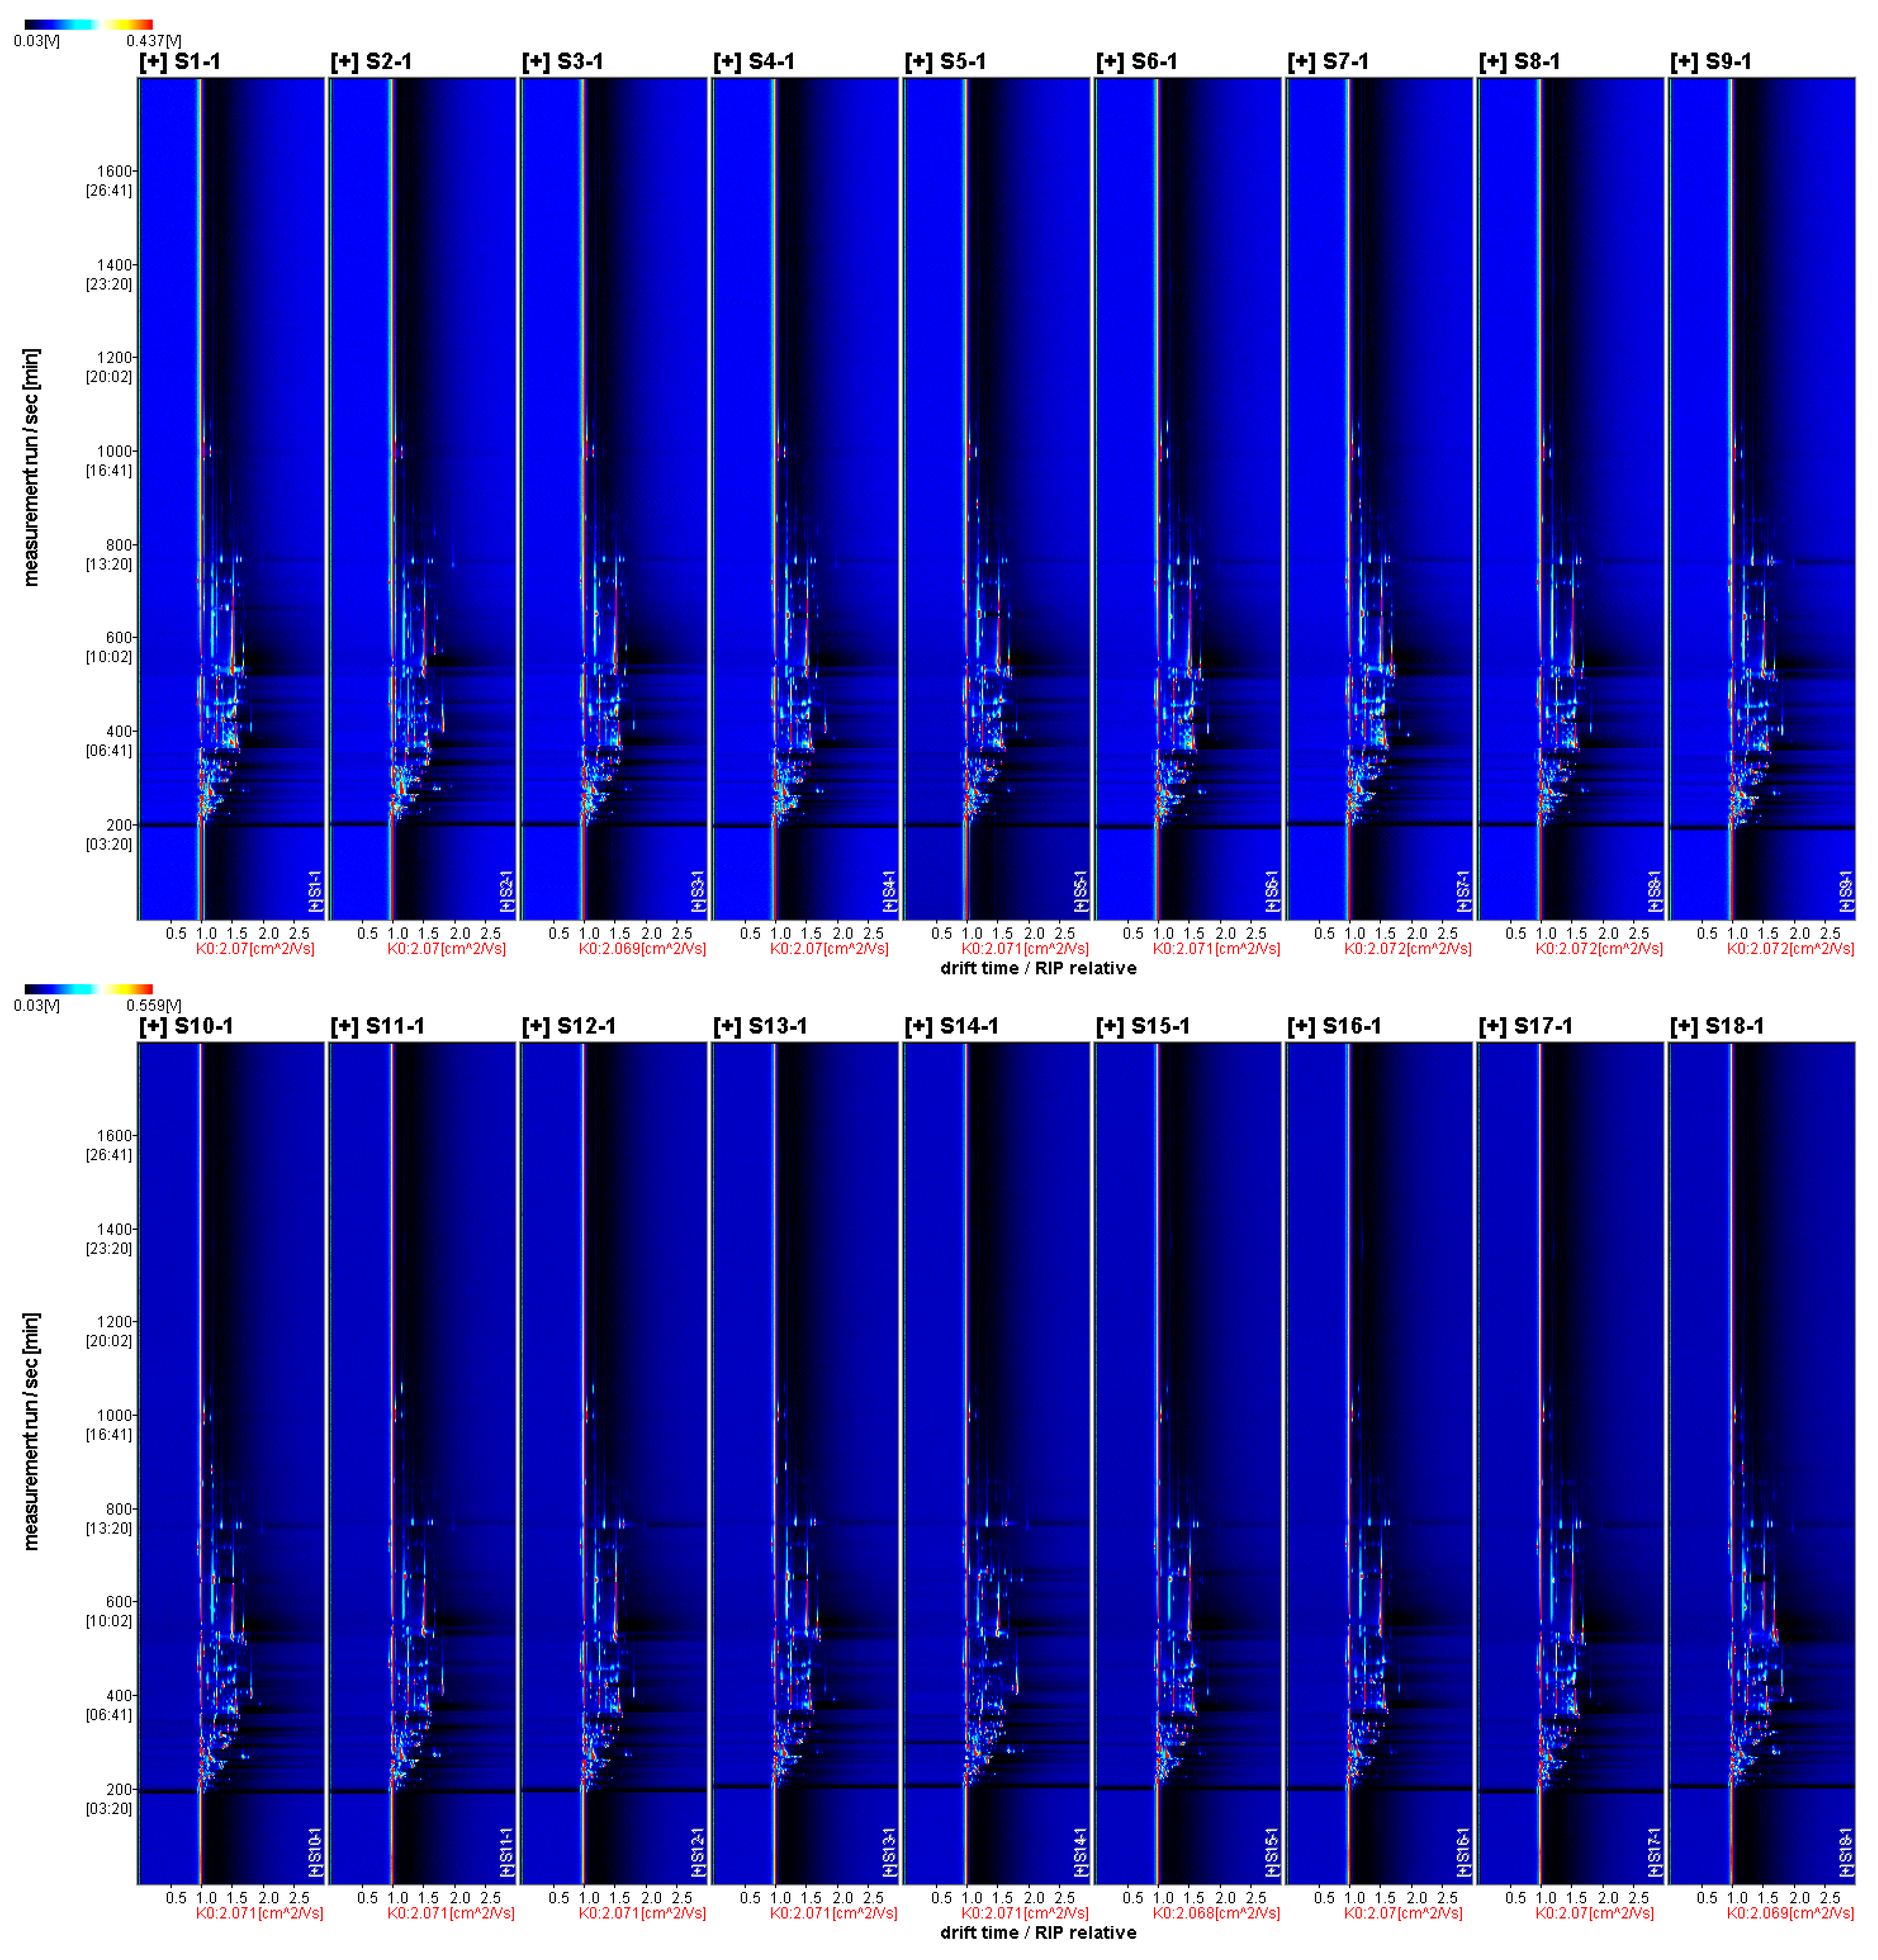
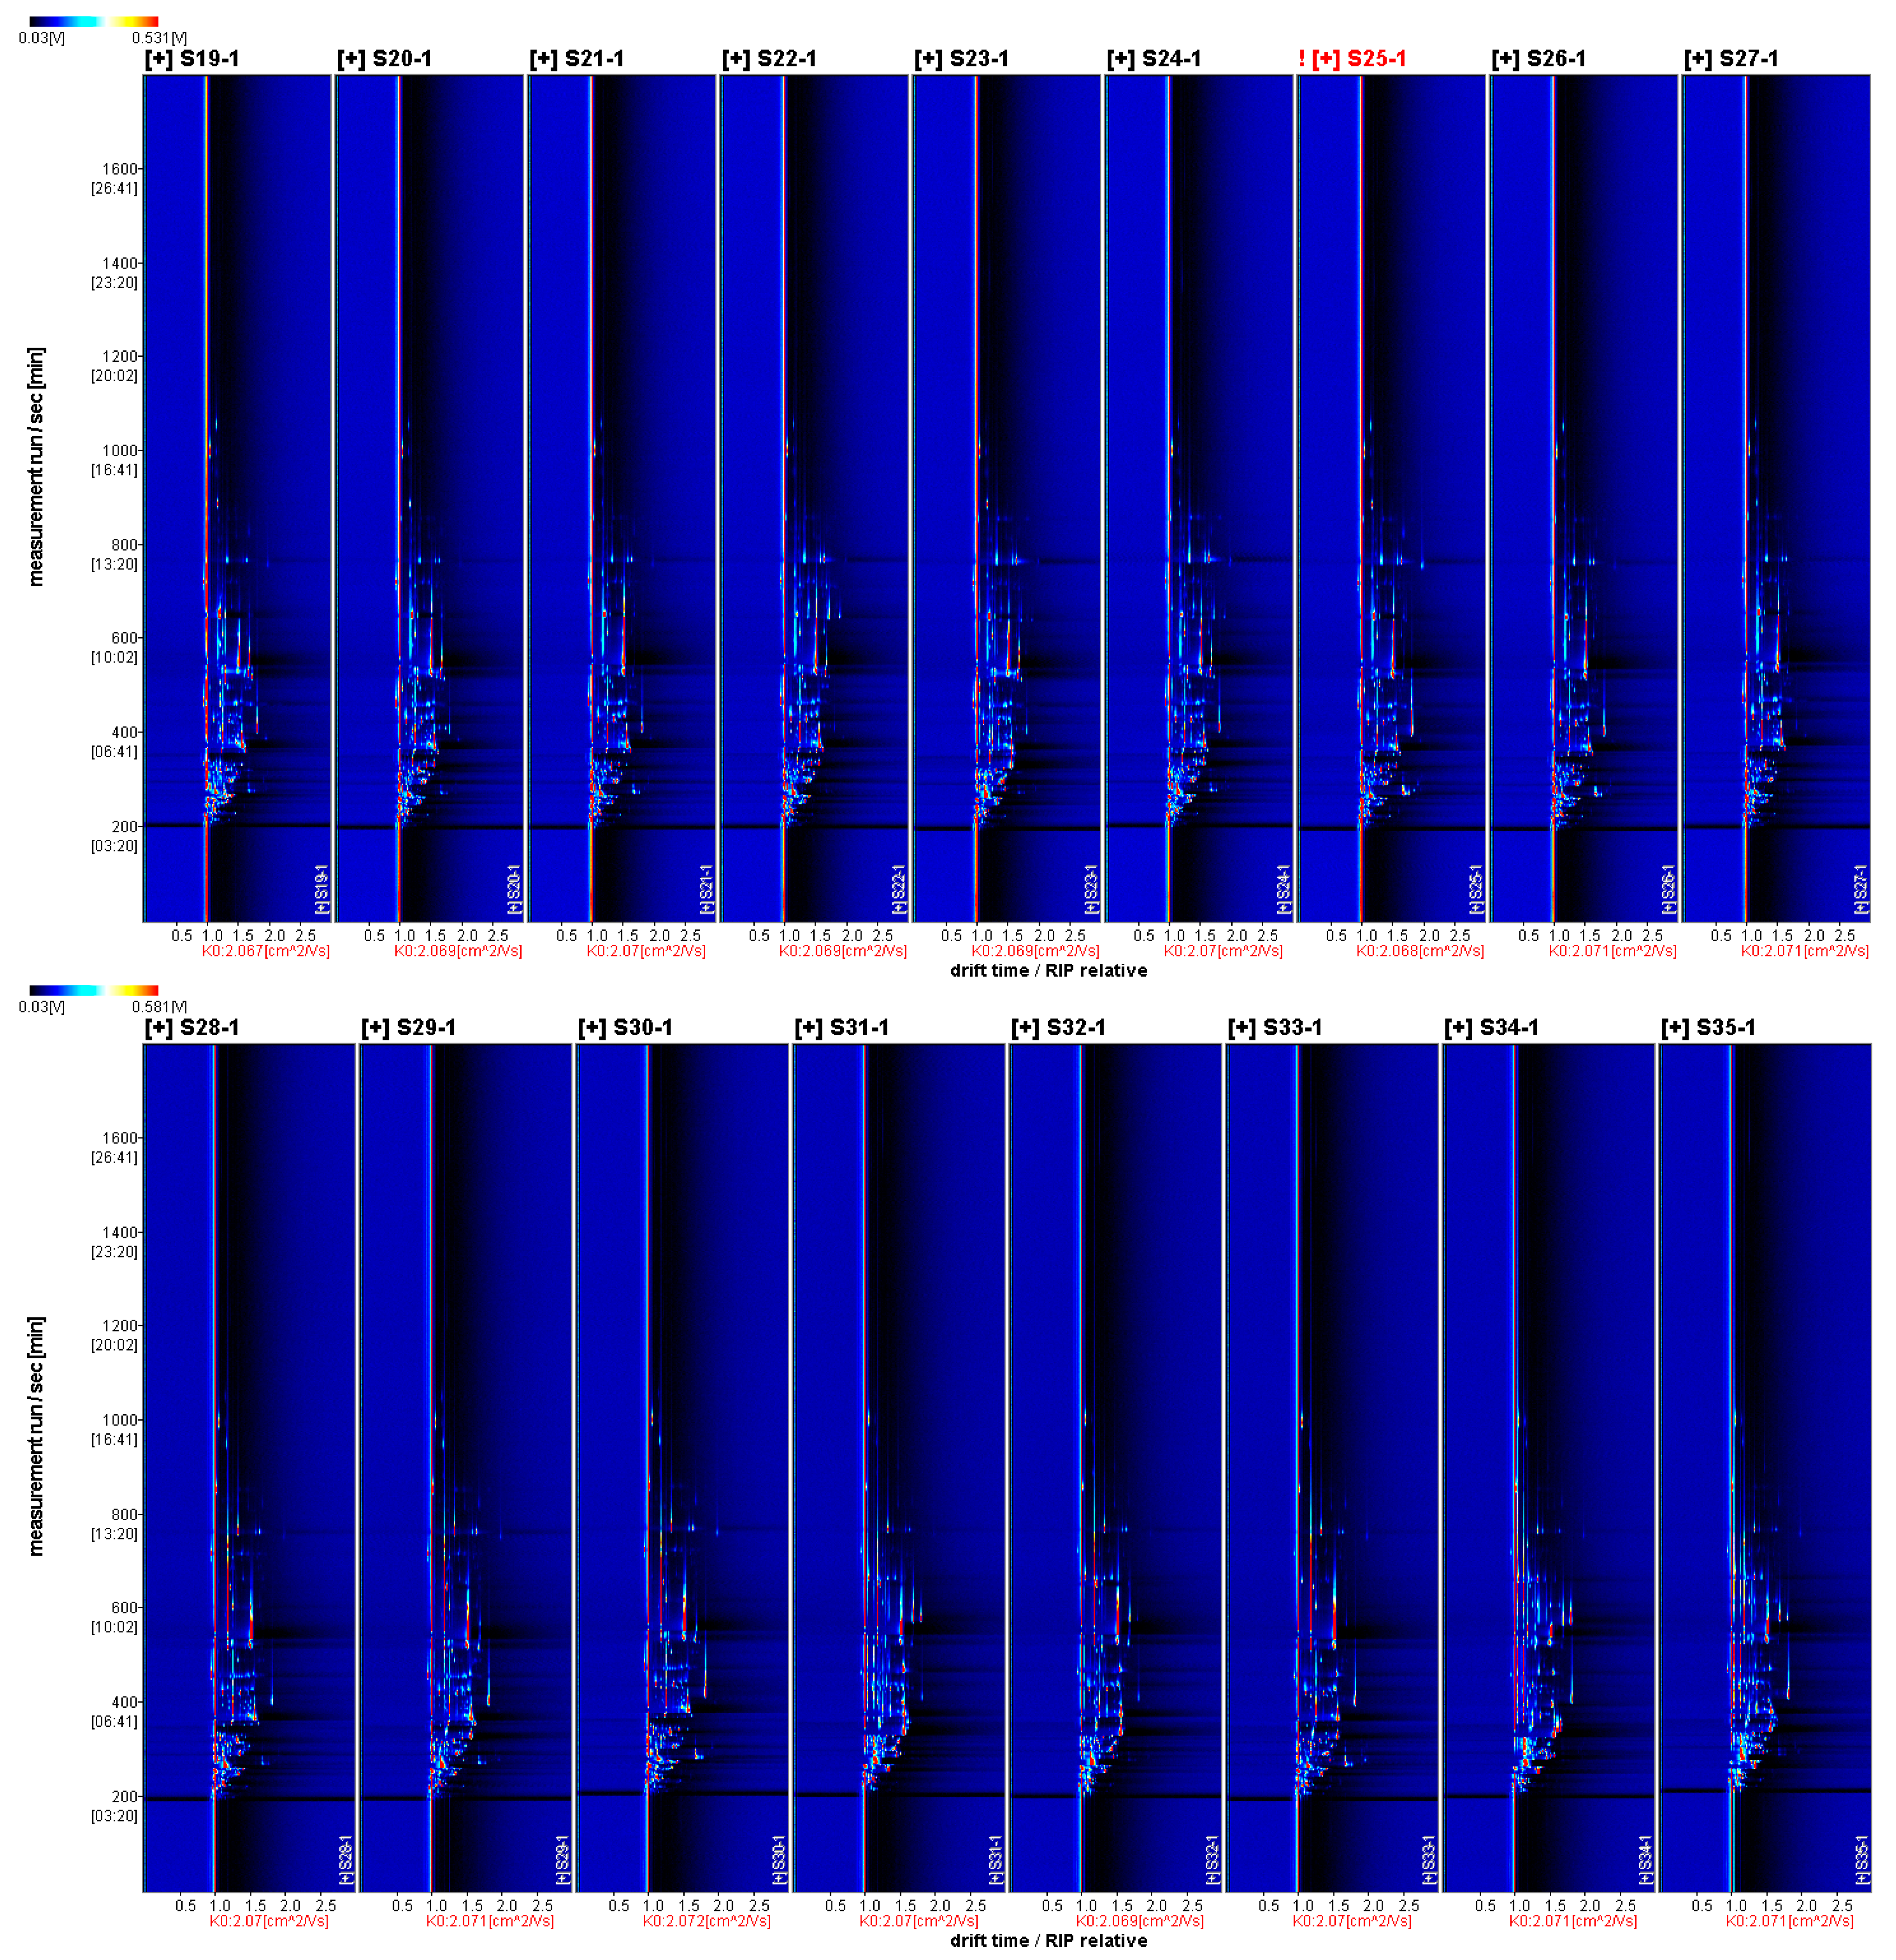
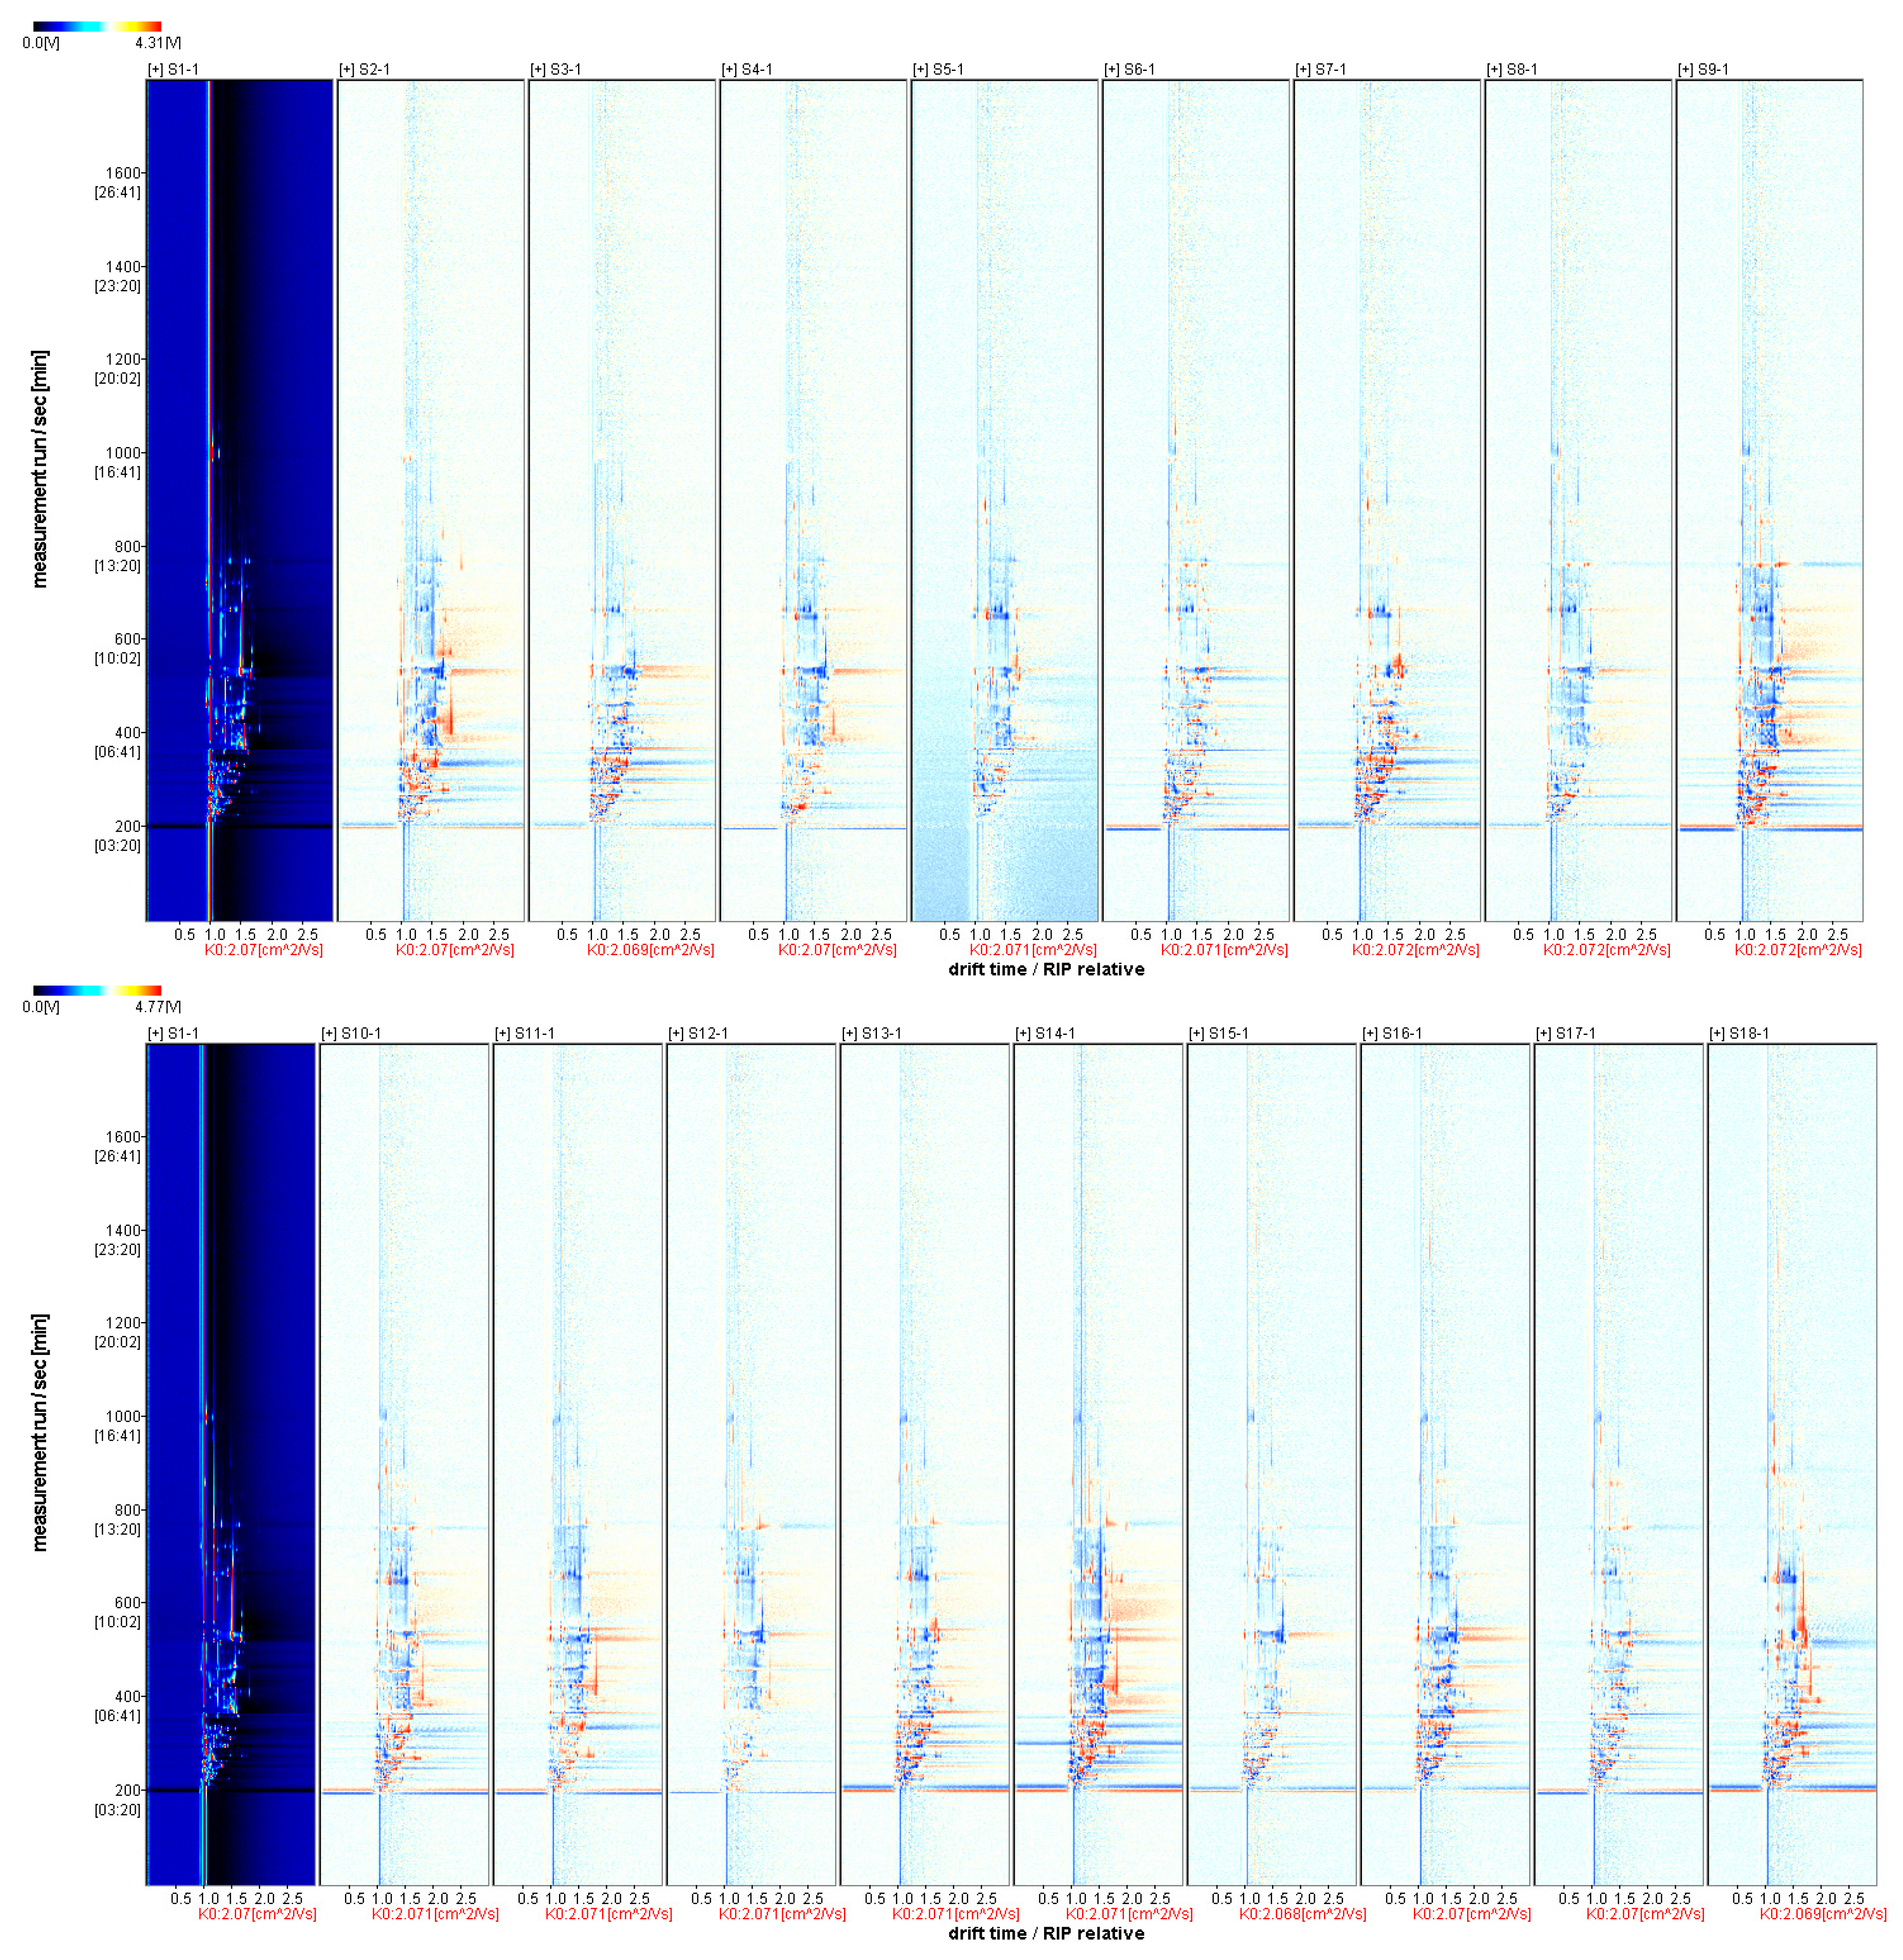
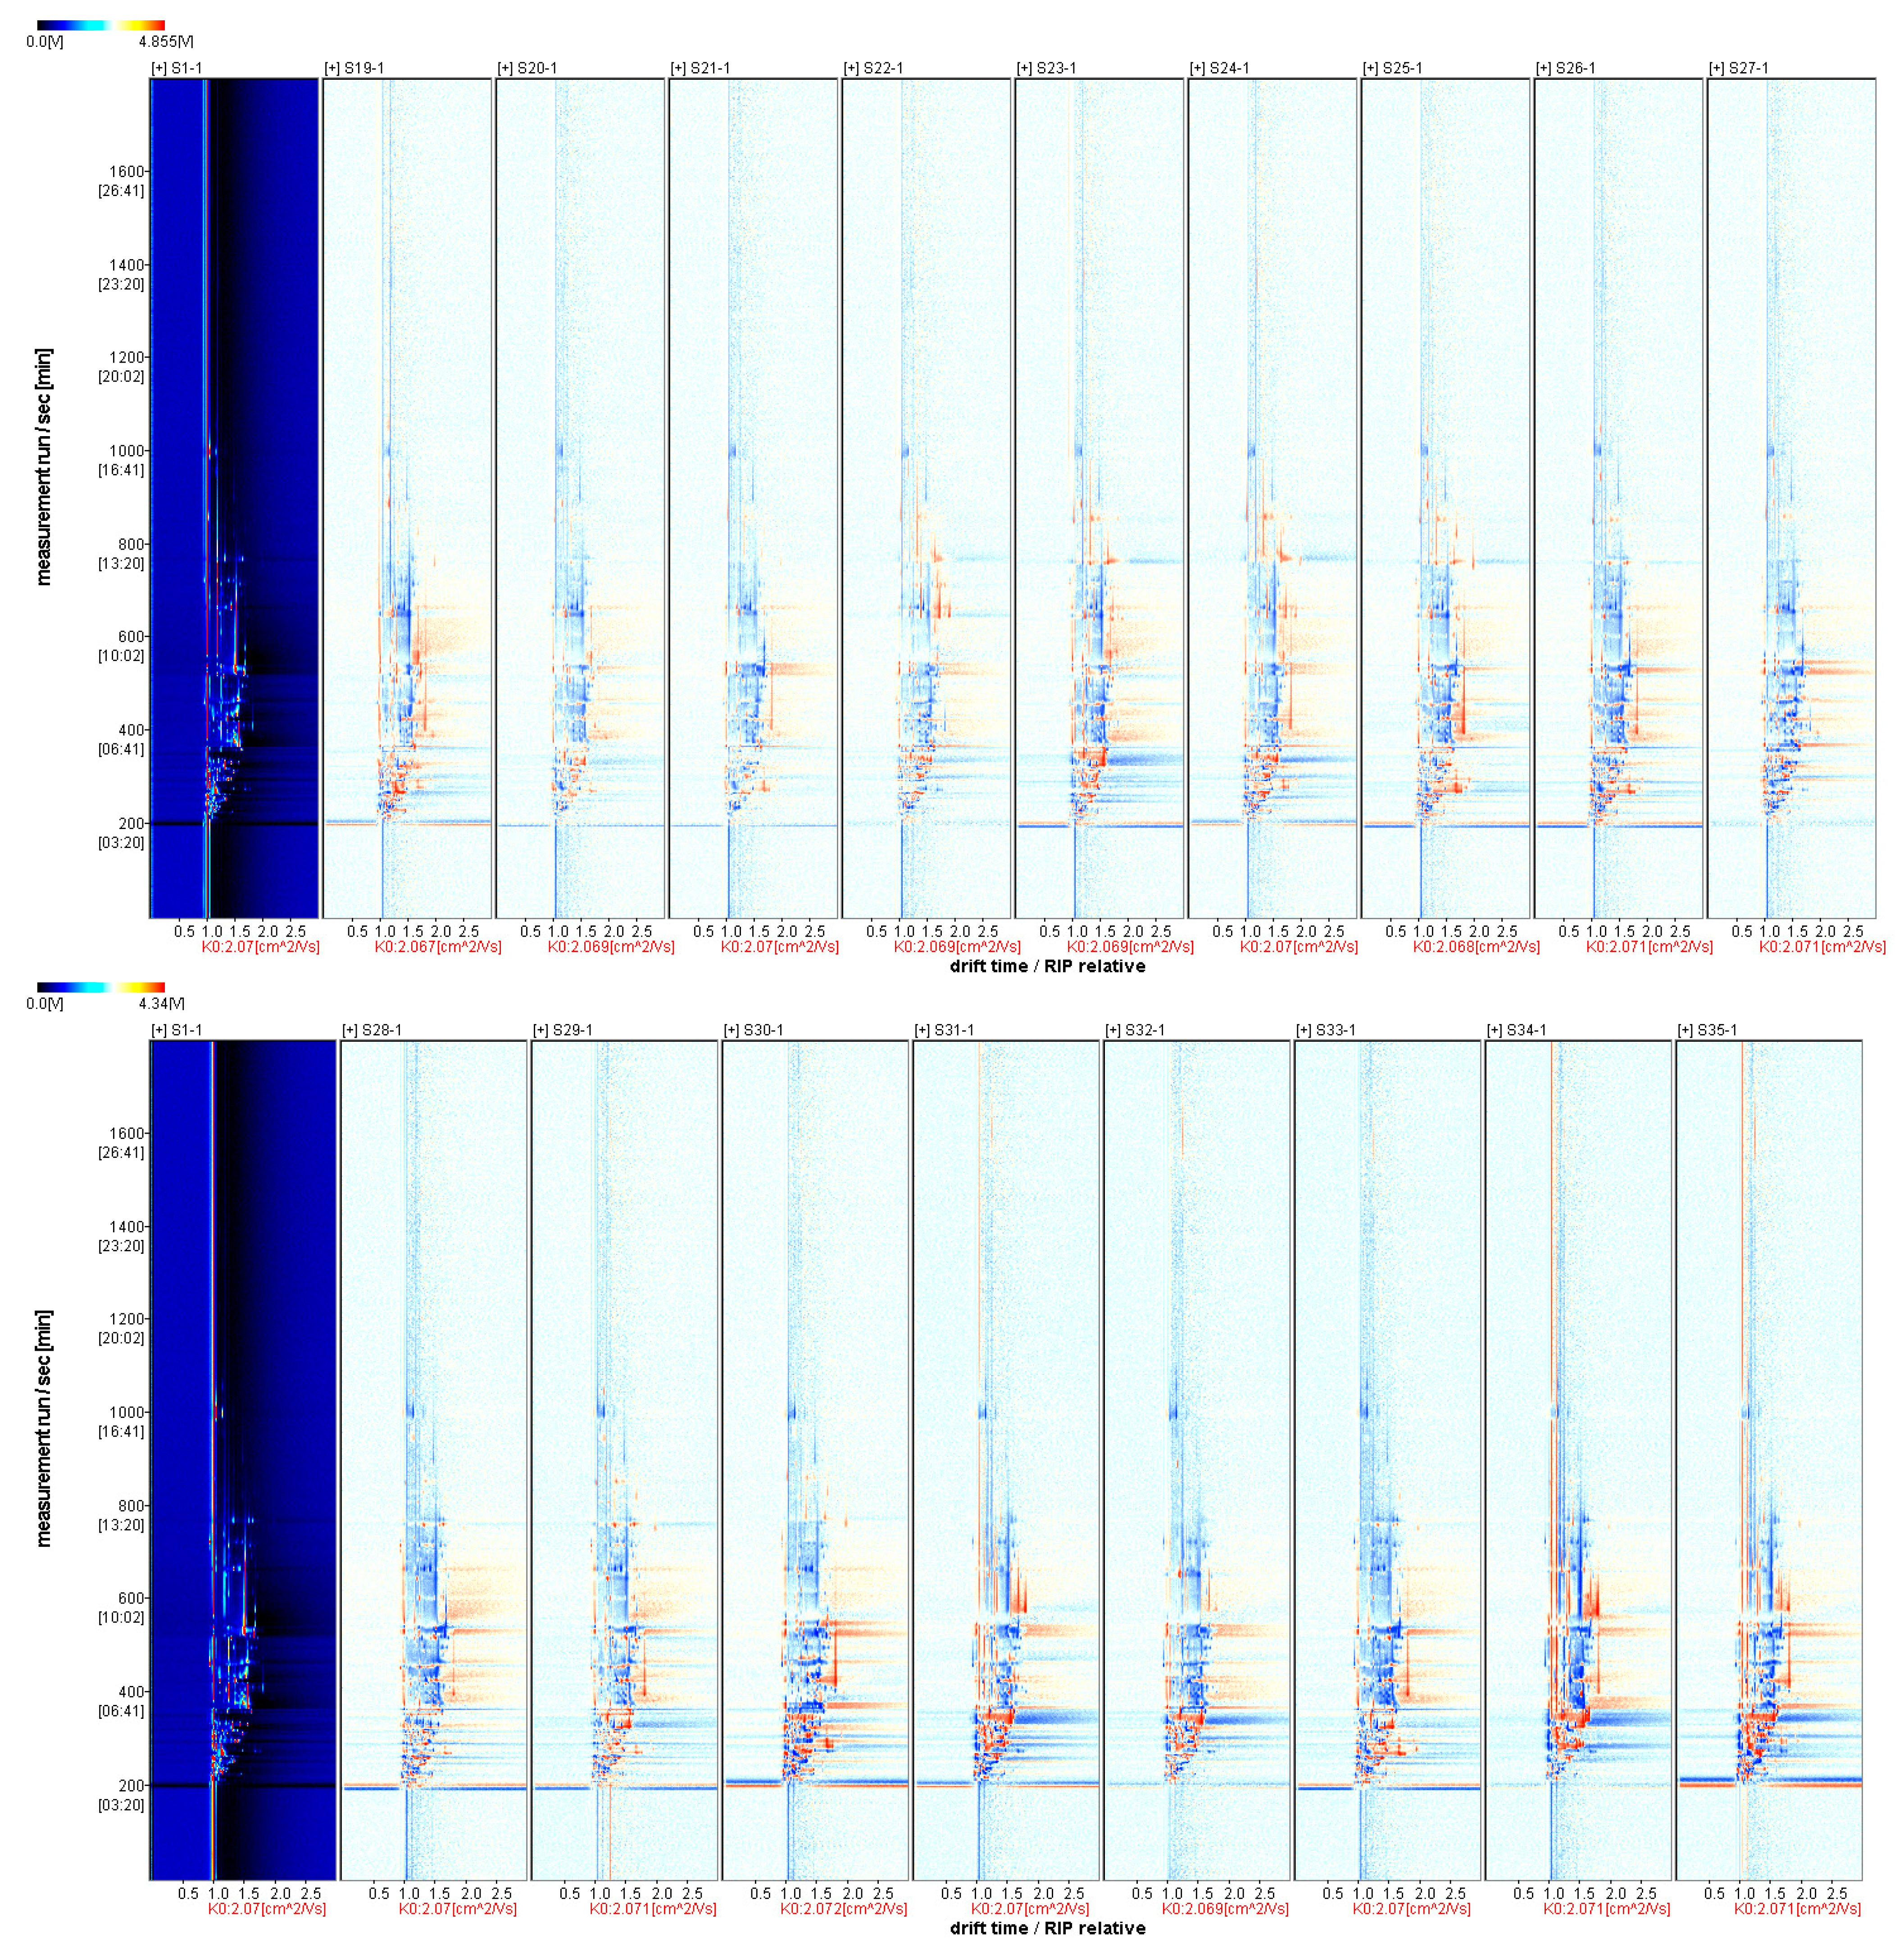
3.3.1. Two-Dimensional Mapping of Volatile Aroma Substances in Fruits of Different A. Arguta Resources
3.3.2. Comparative Pattern Spectrum of Differences in Volatile Aroma Substances of Fruits from Different A. arguta Resources
3.3.3. Identification of Substances
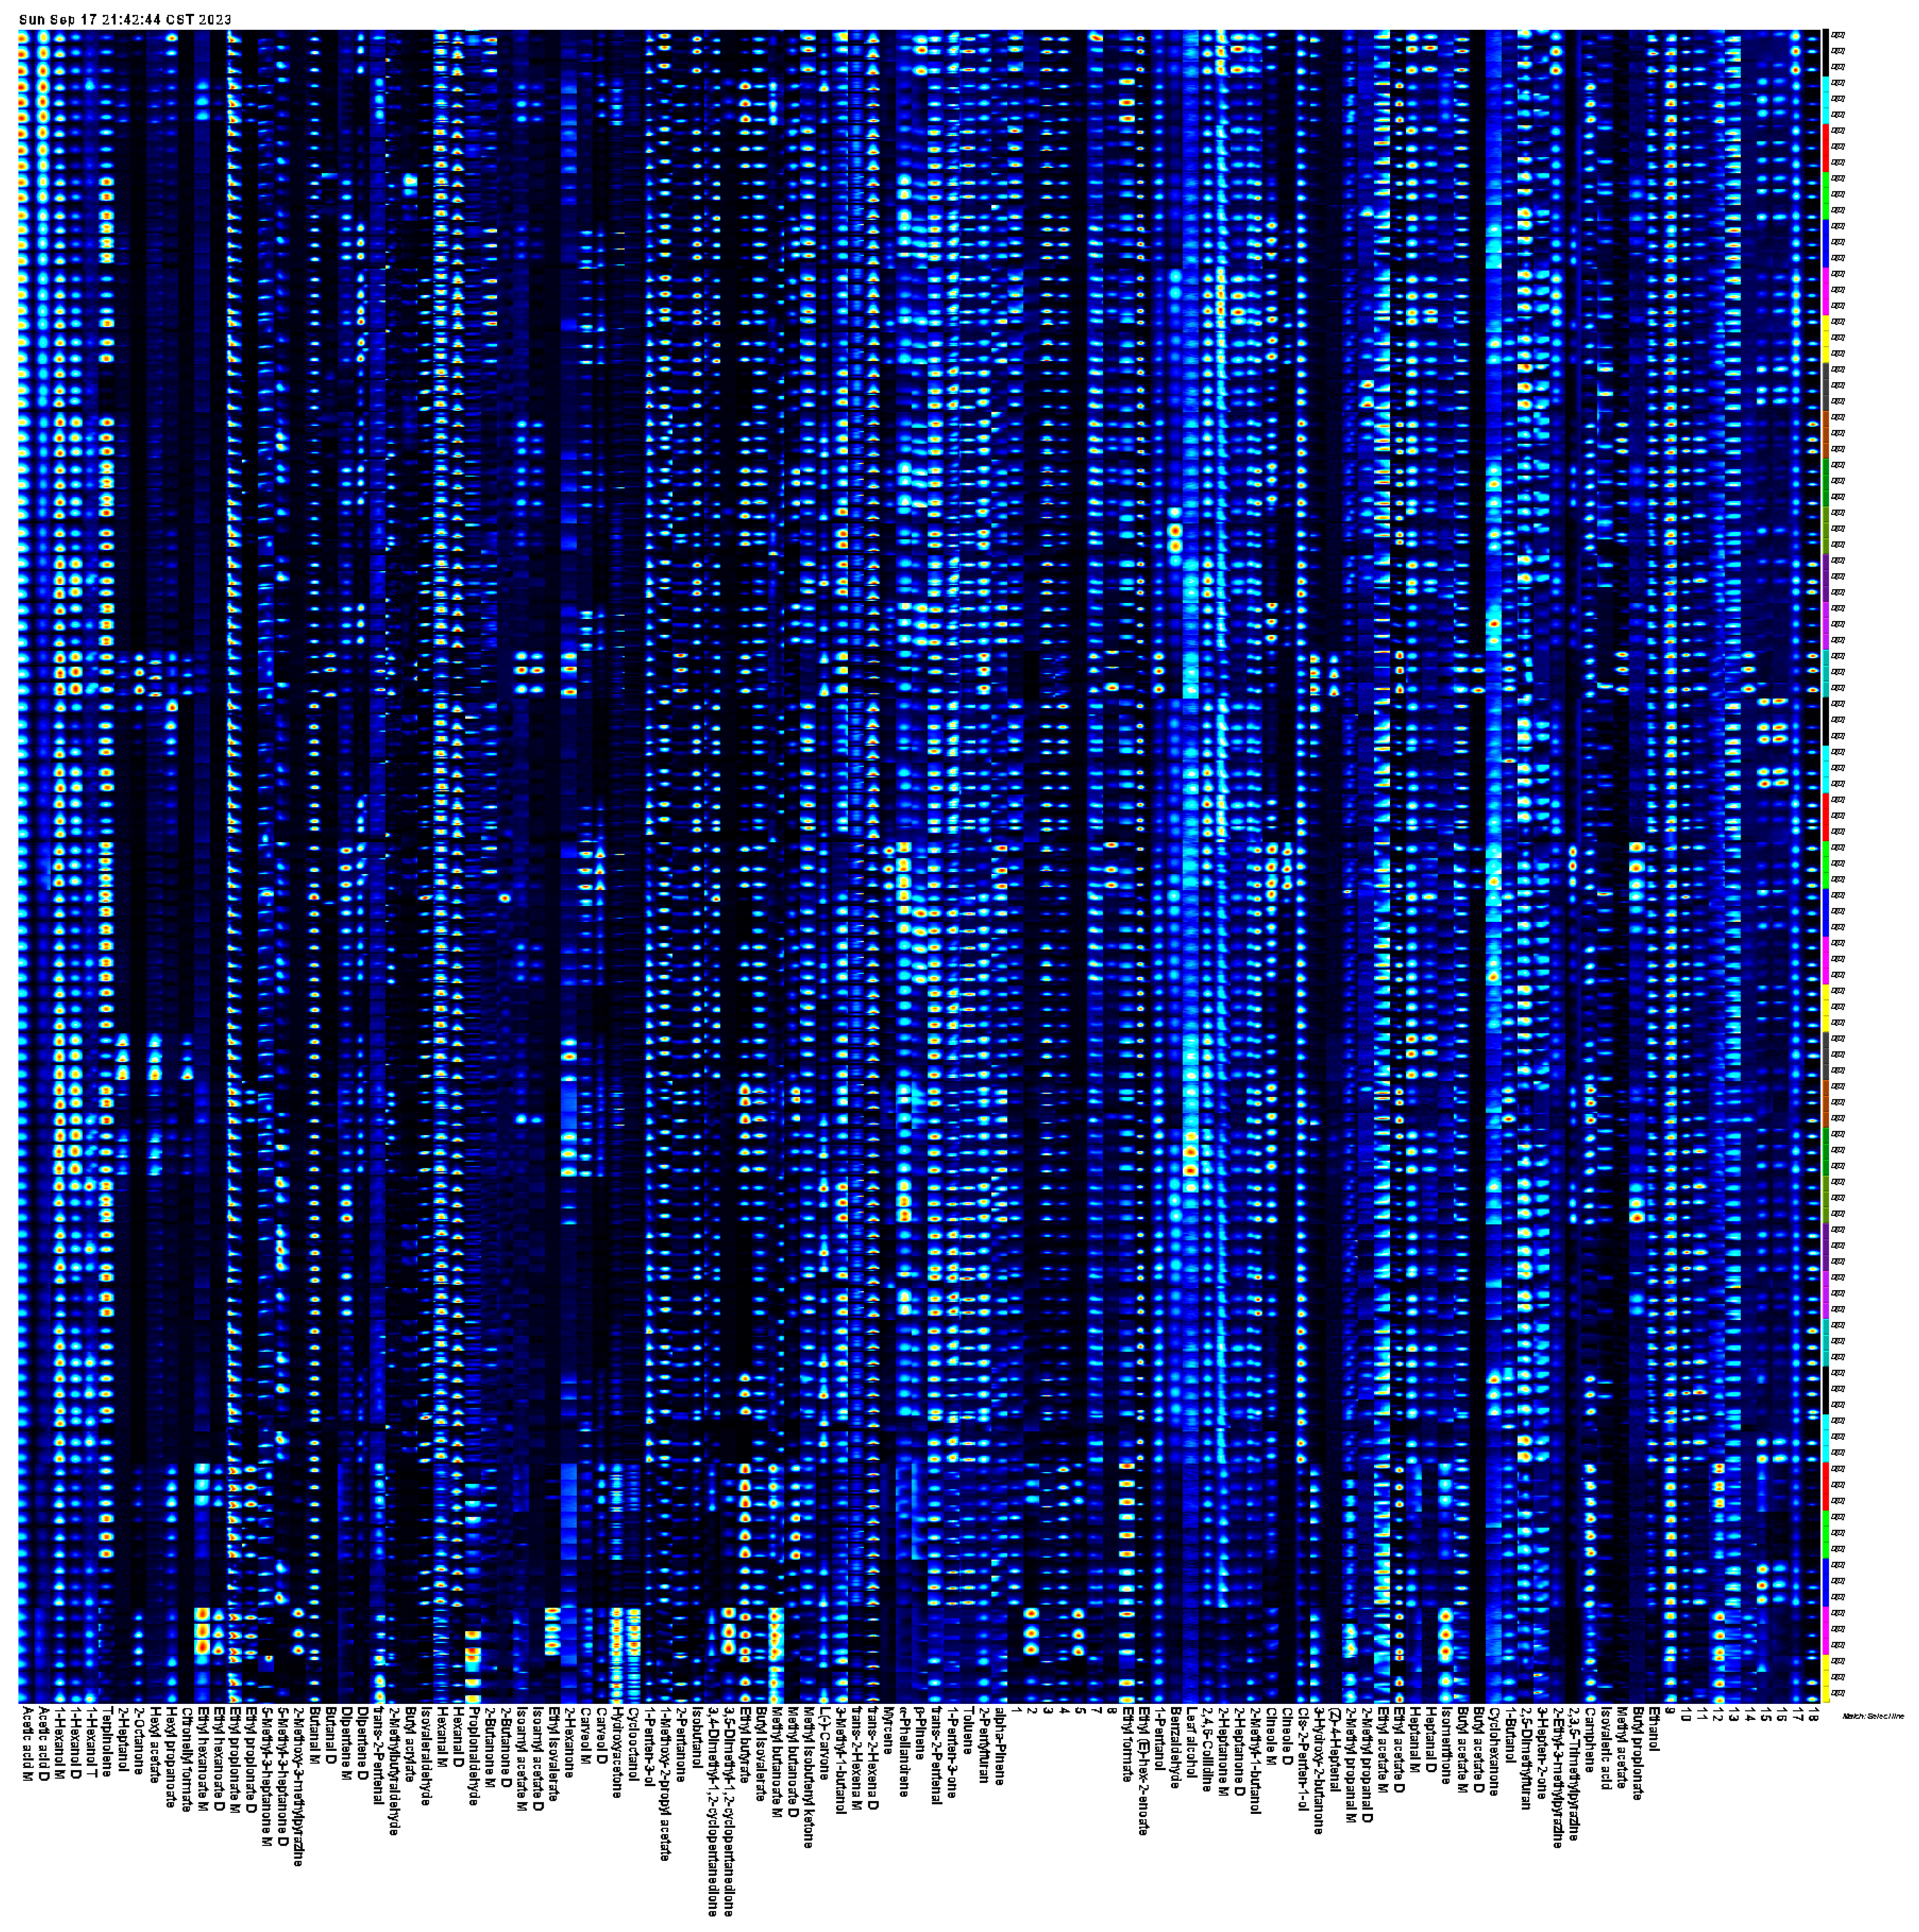
3.3.4. Fingerprint Analysis of Volatile Components of Fruits from Different A. arguta Resources
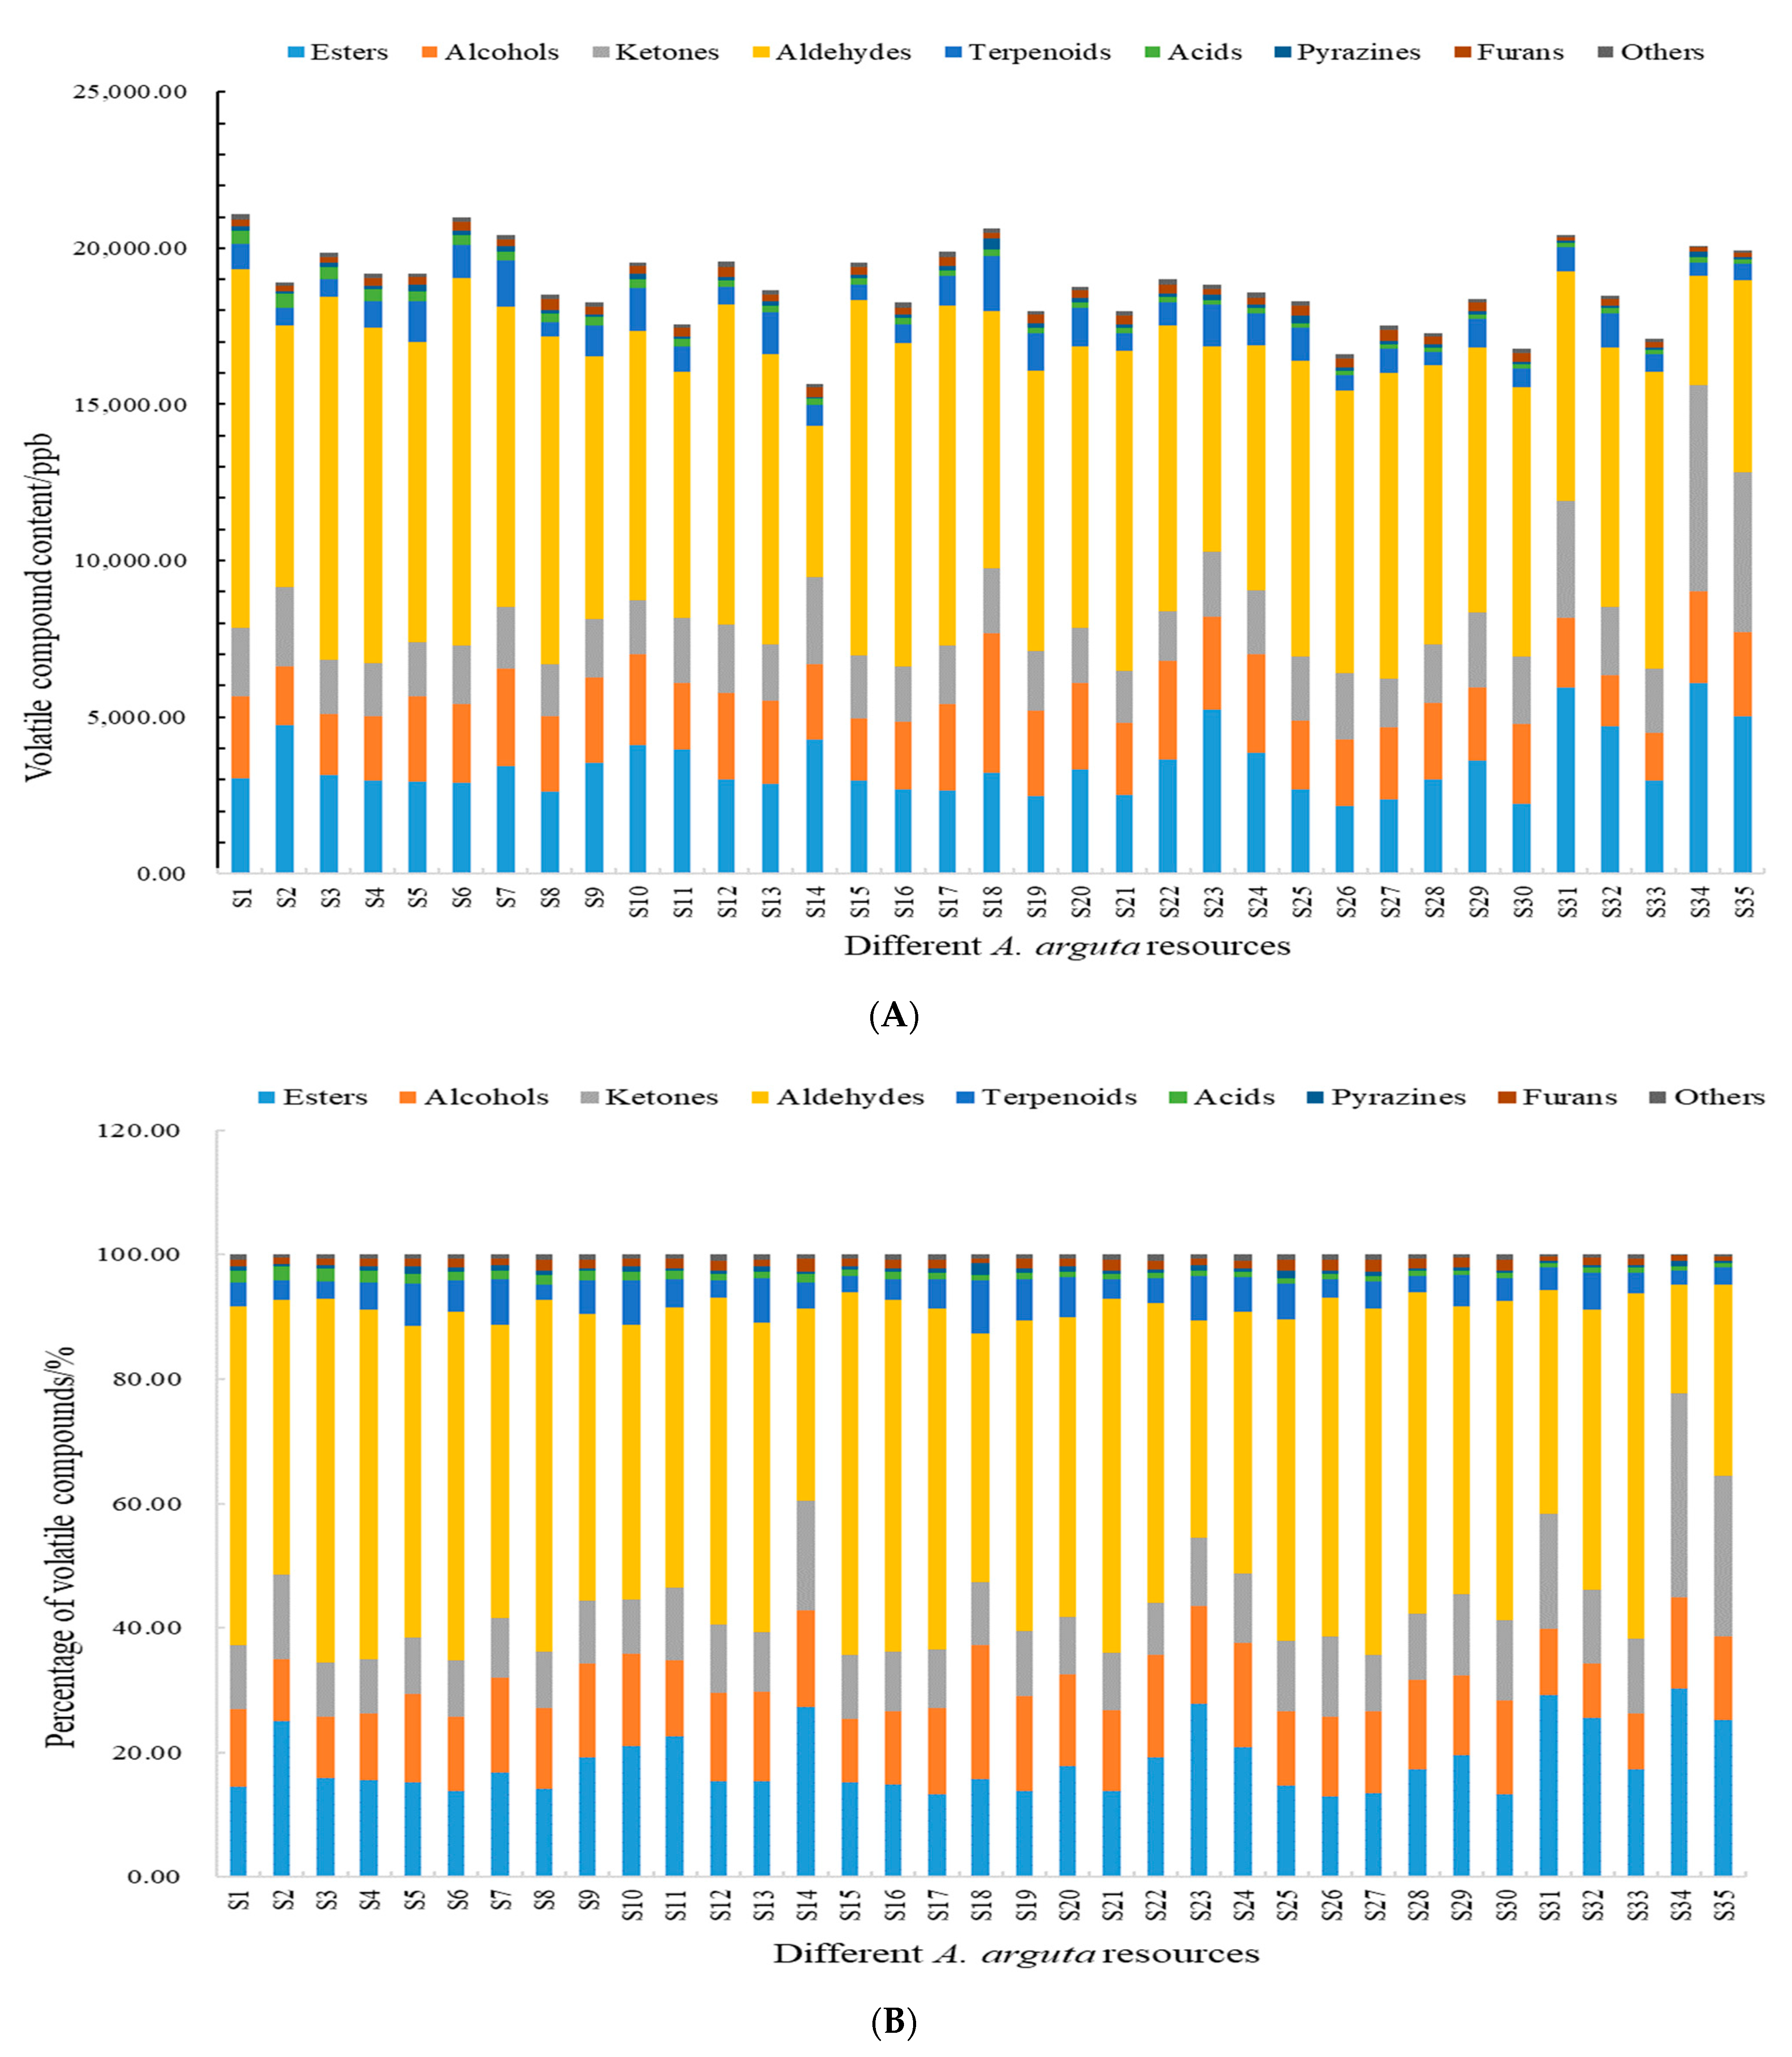
3.4. Analysis of the Relative Content of Volatile Components
3.4.1. Esters
3.4.2. Alcohols
3.4.3. Ketones
3.4.4. Aldehydes
3.4.5. Other Compounds
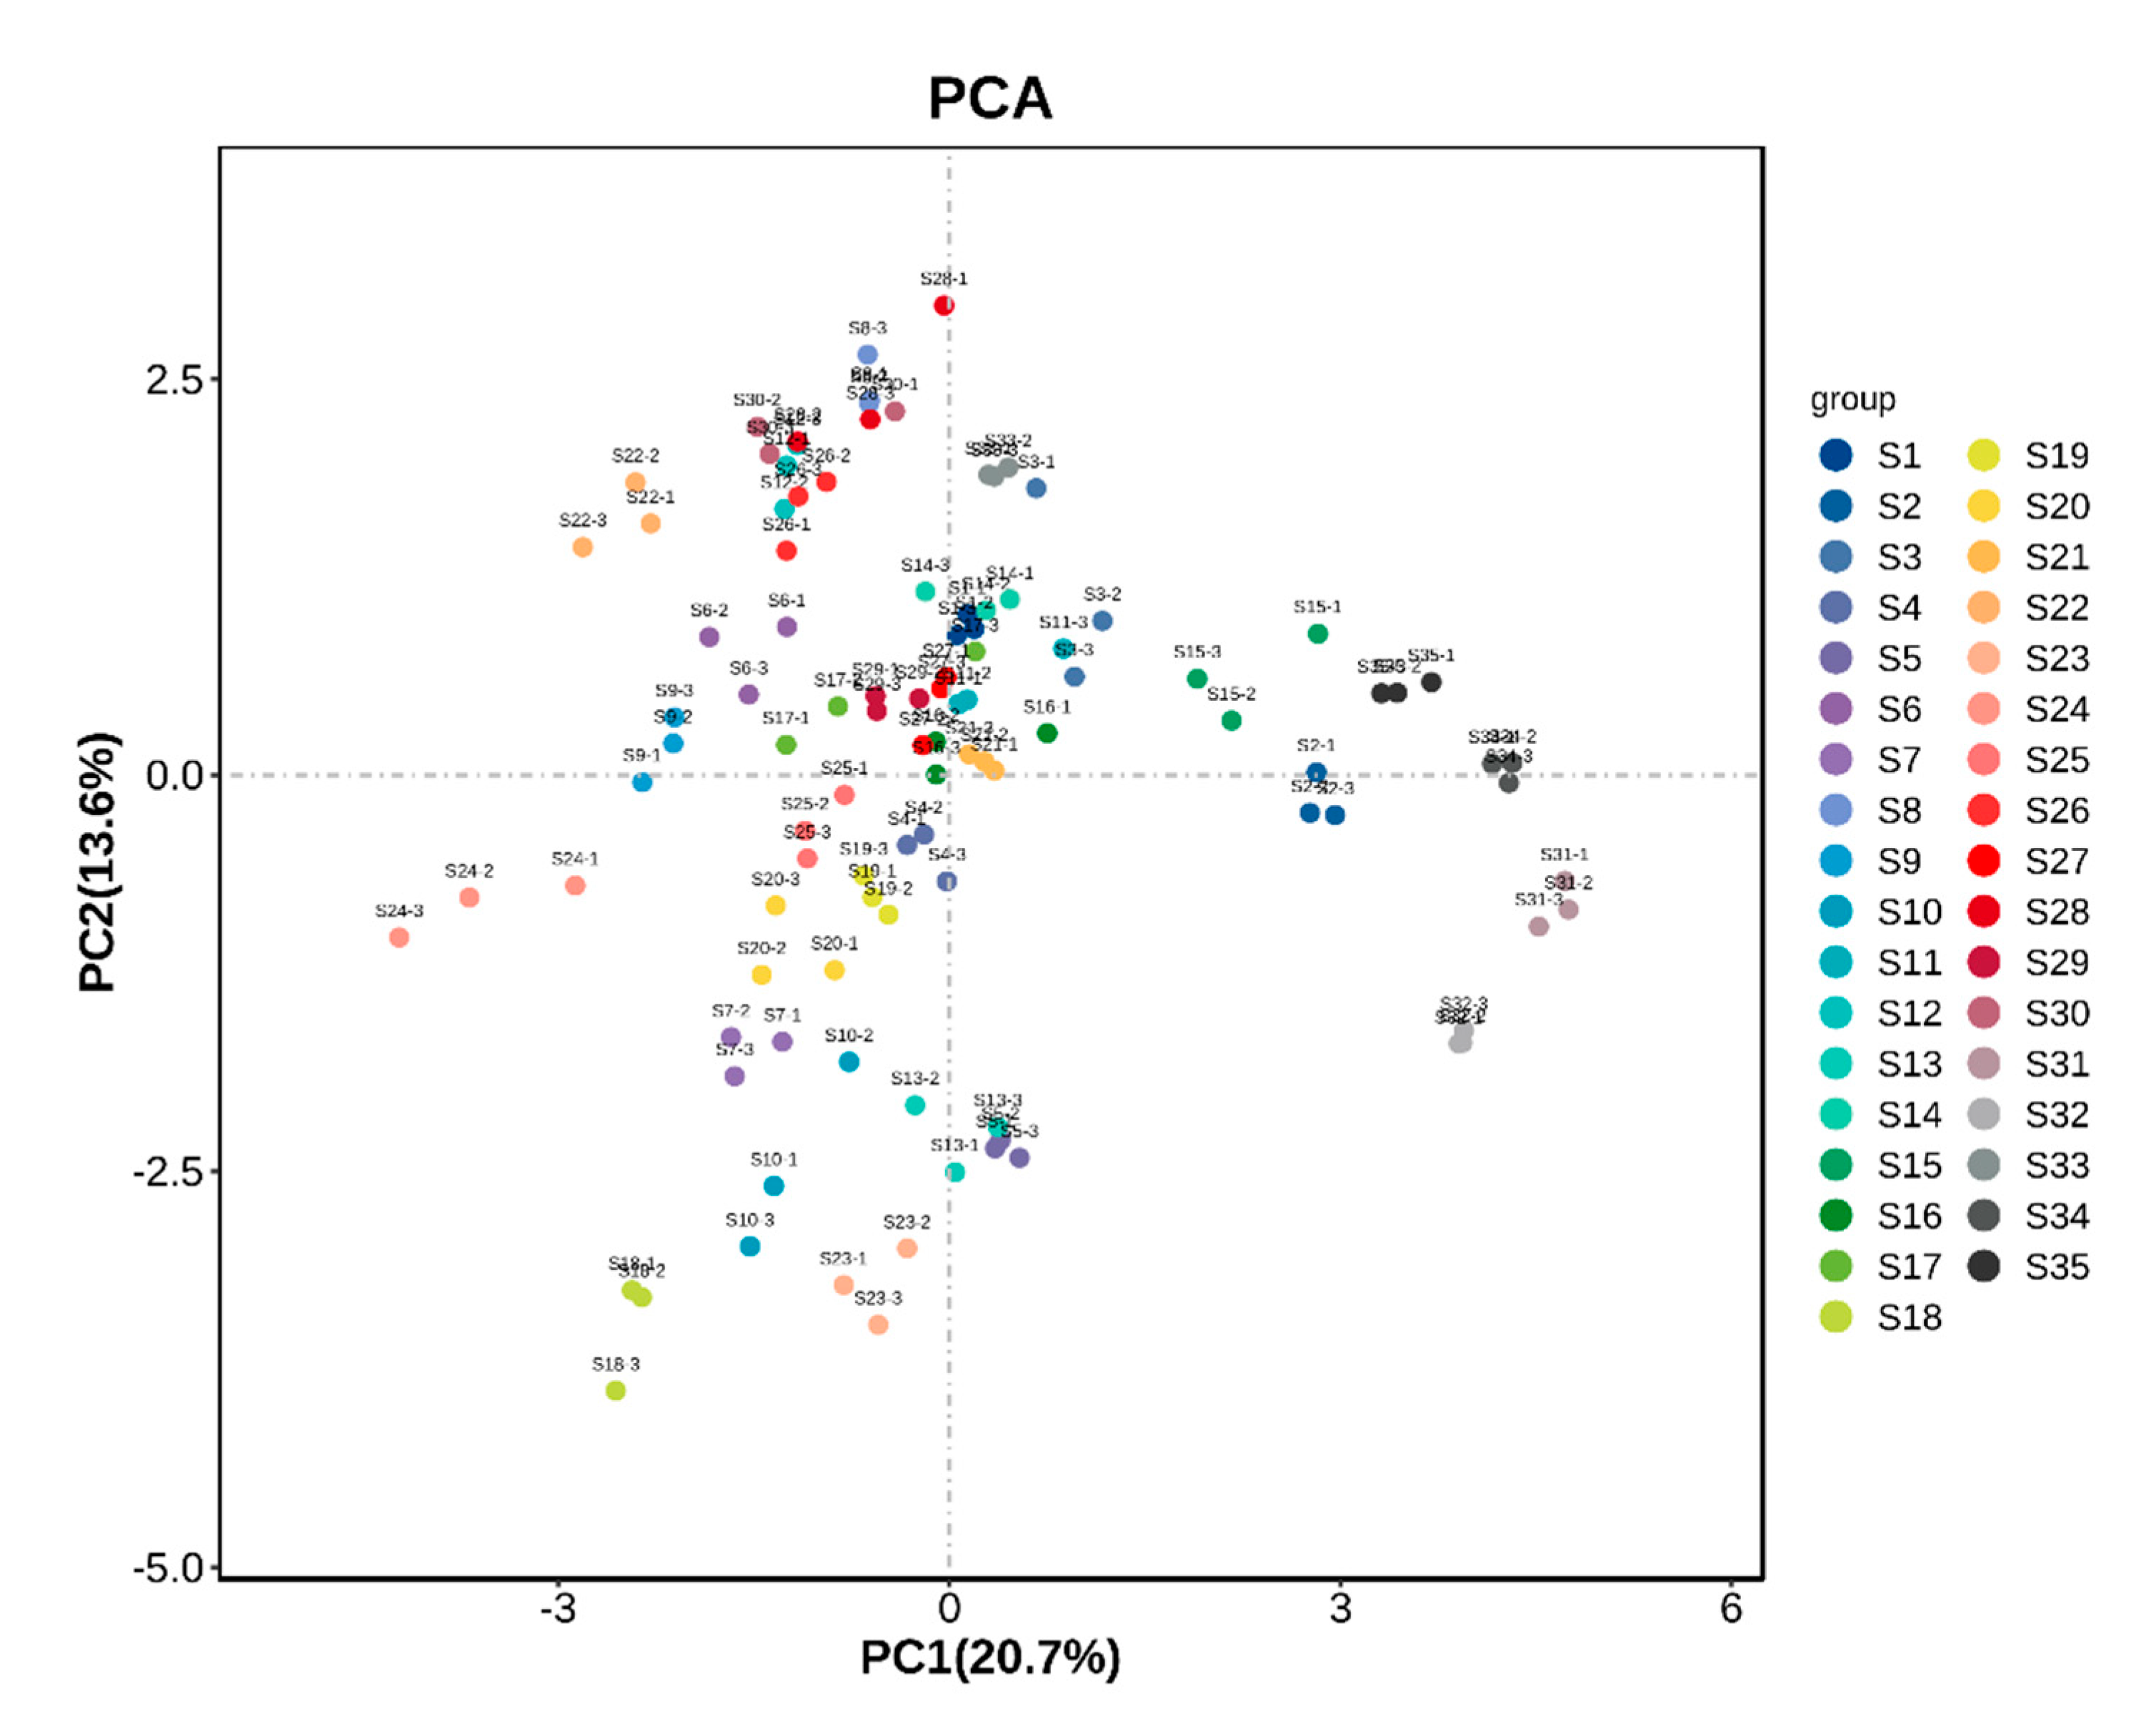
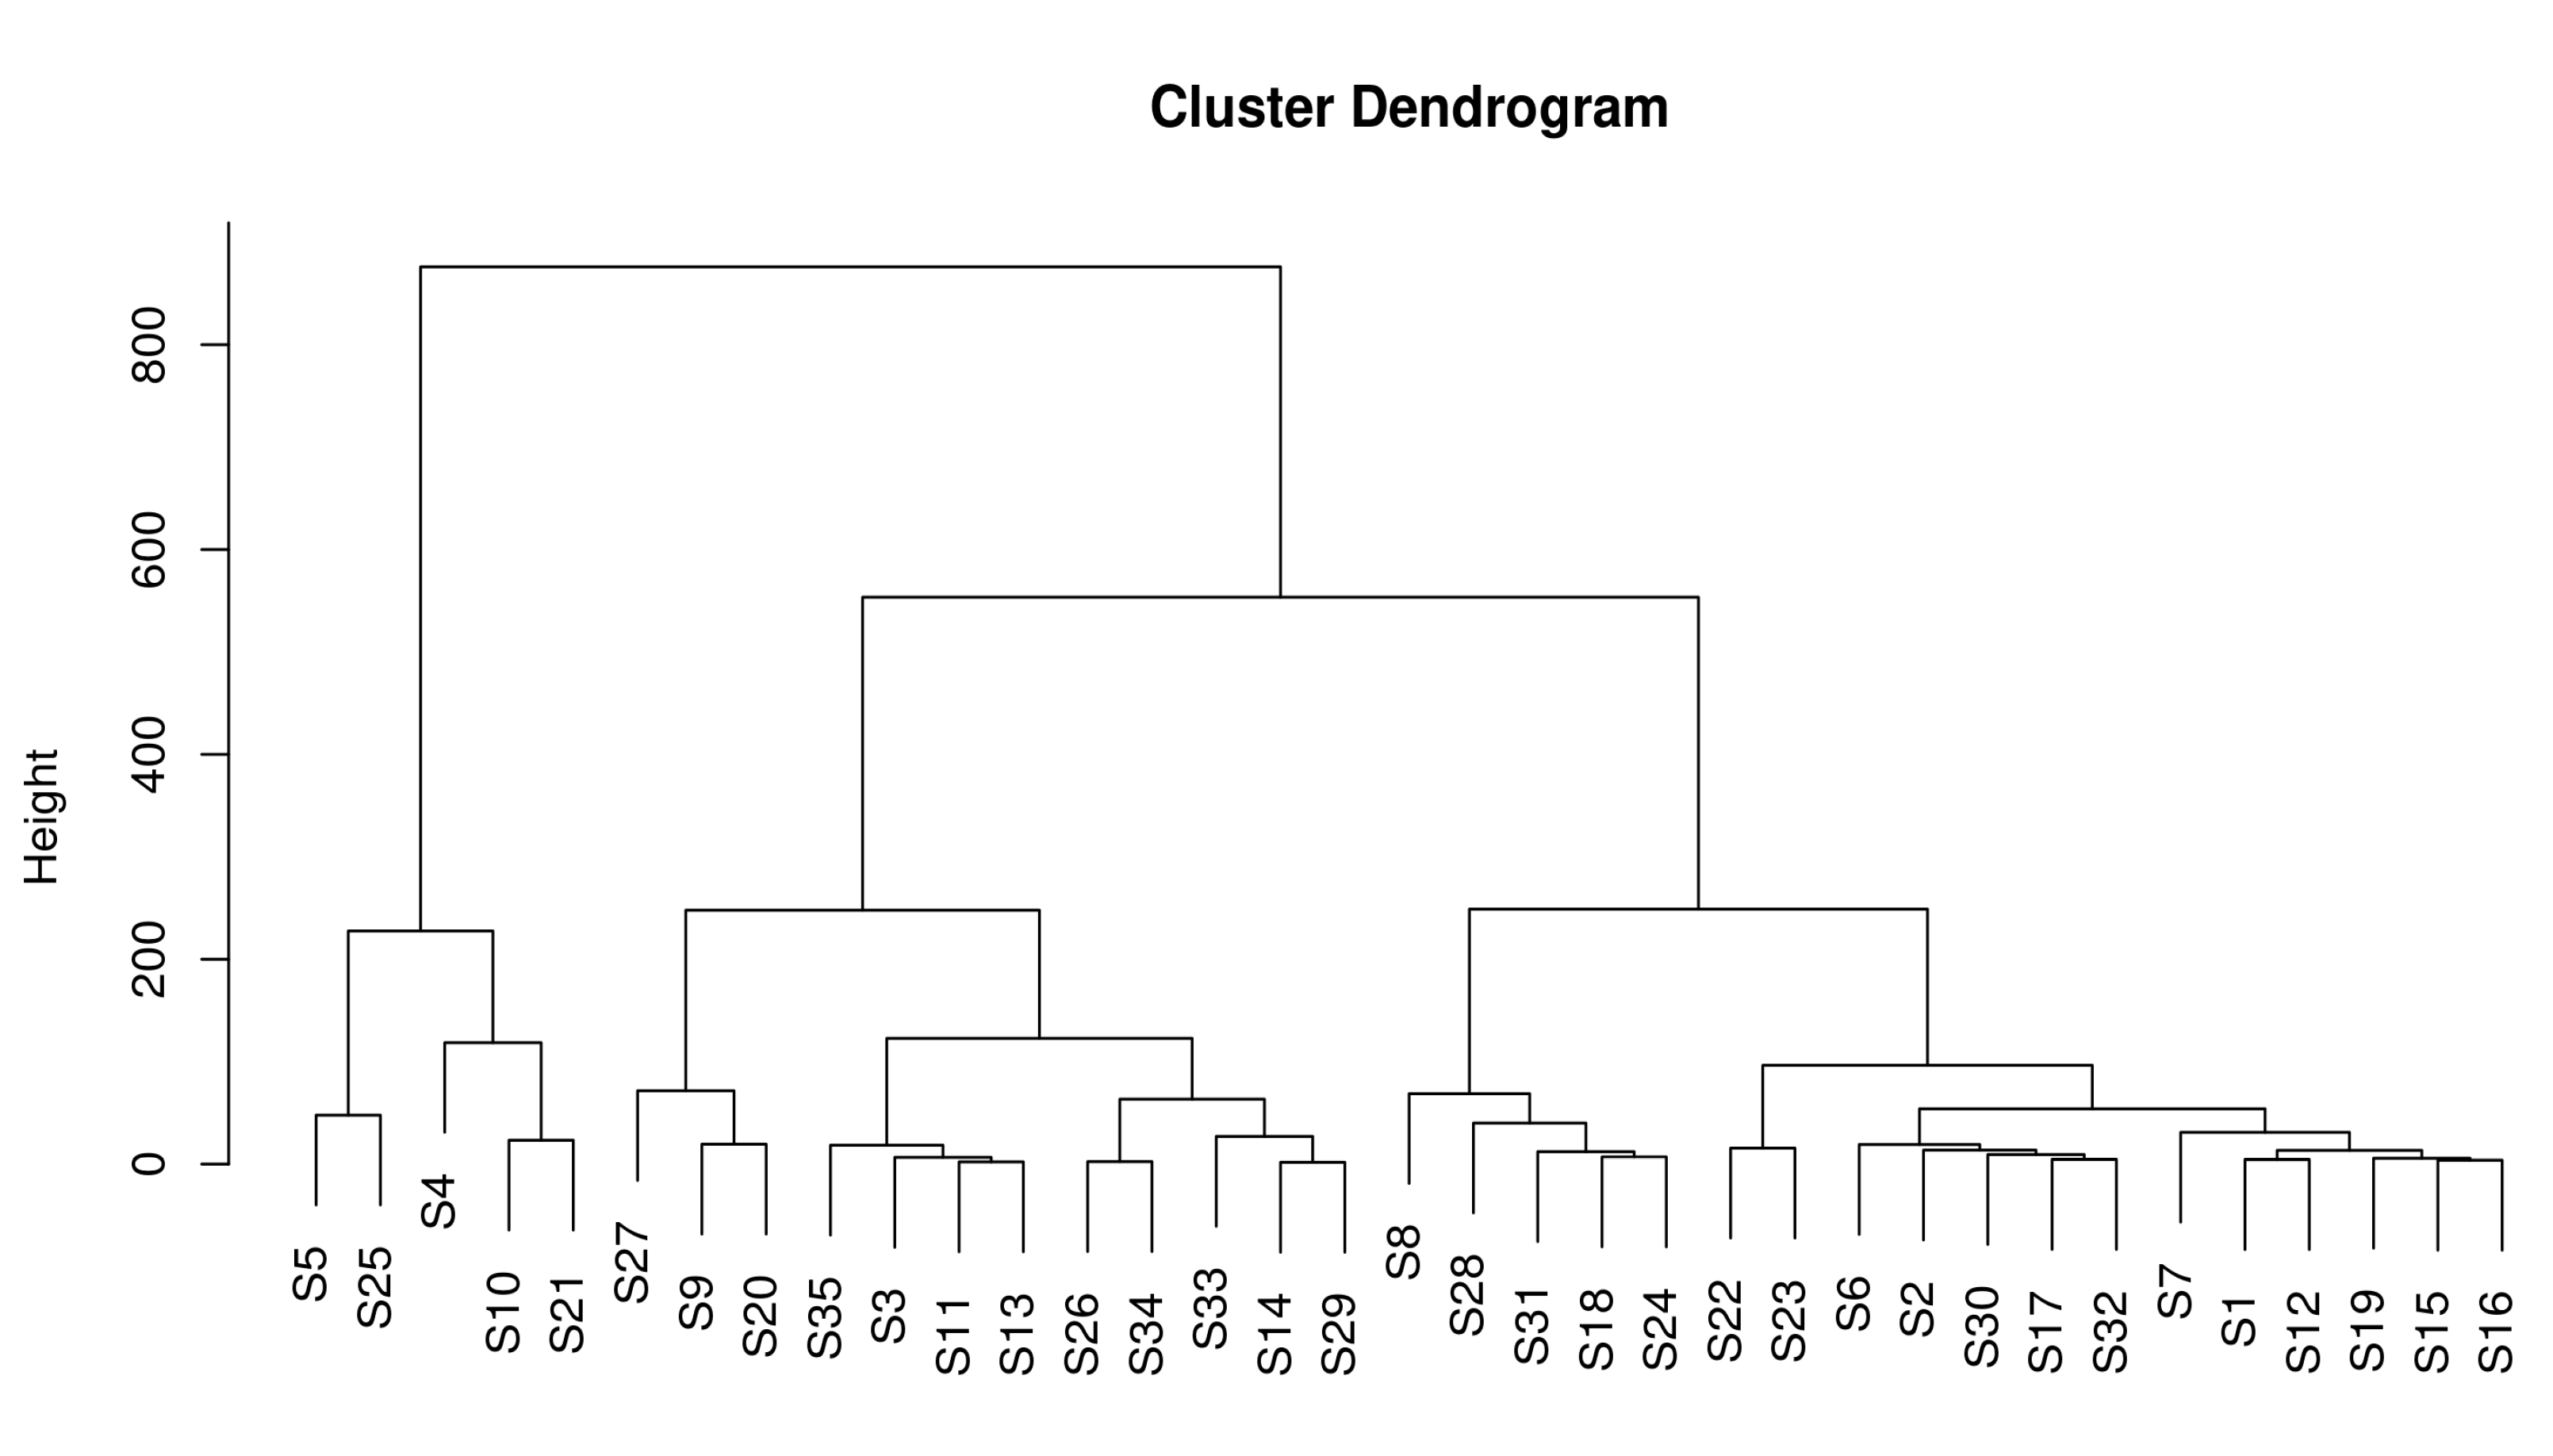
3.5. Principal Component Analysis of Fruit Samples from Different A. arguta Resources
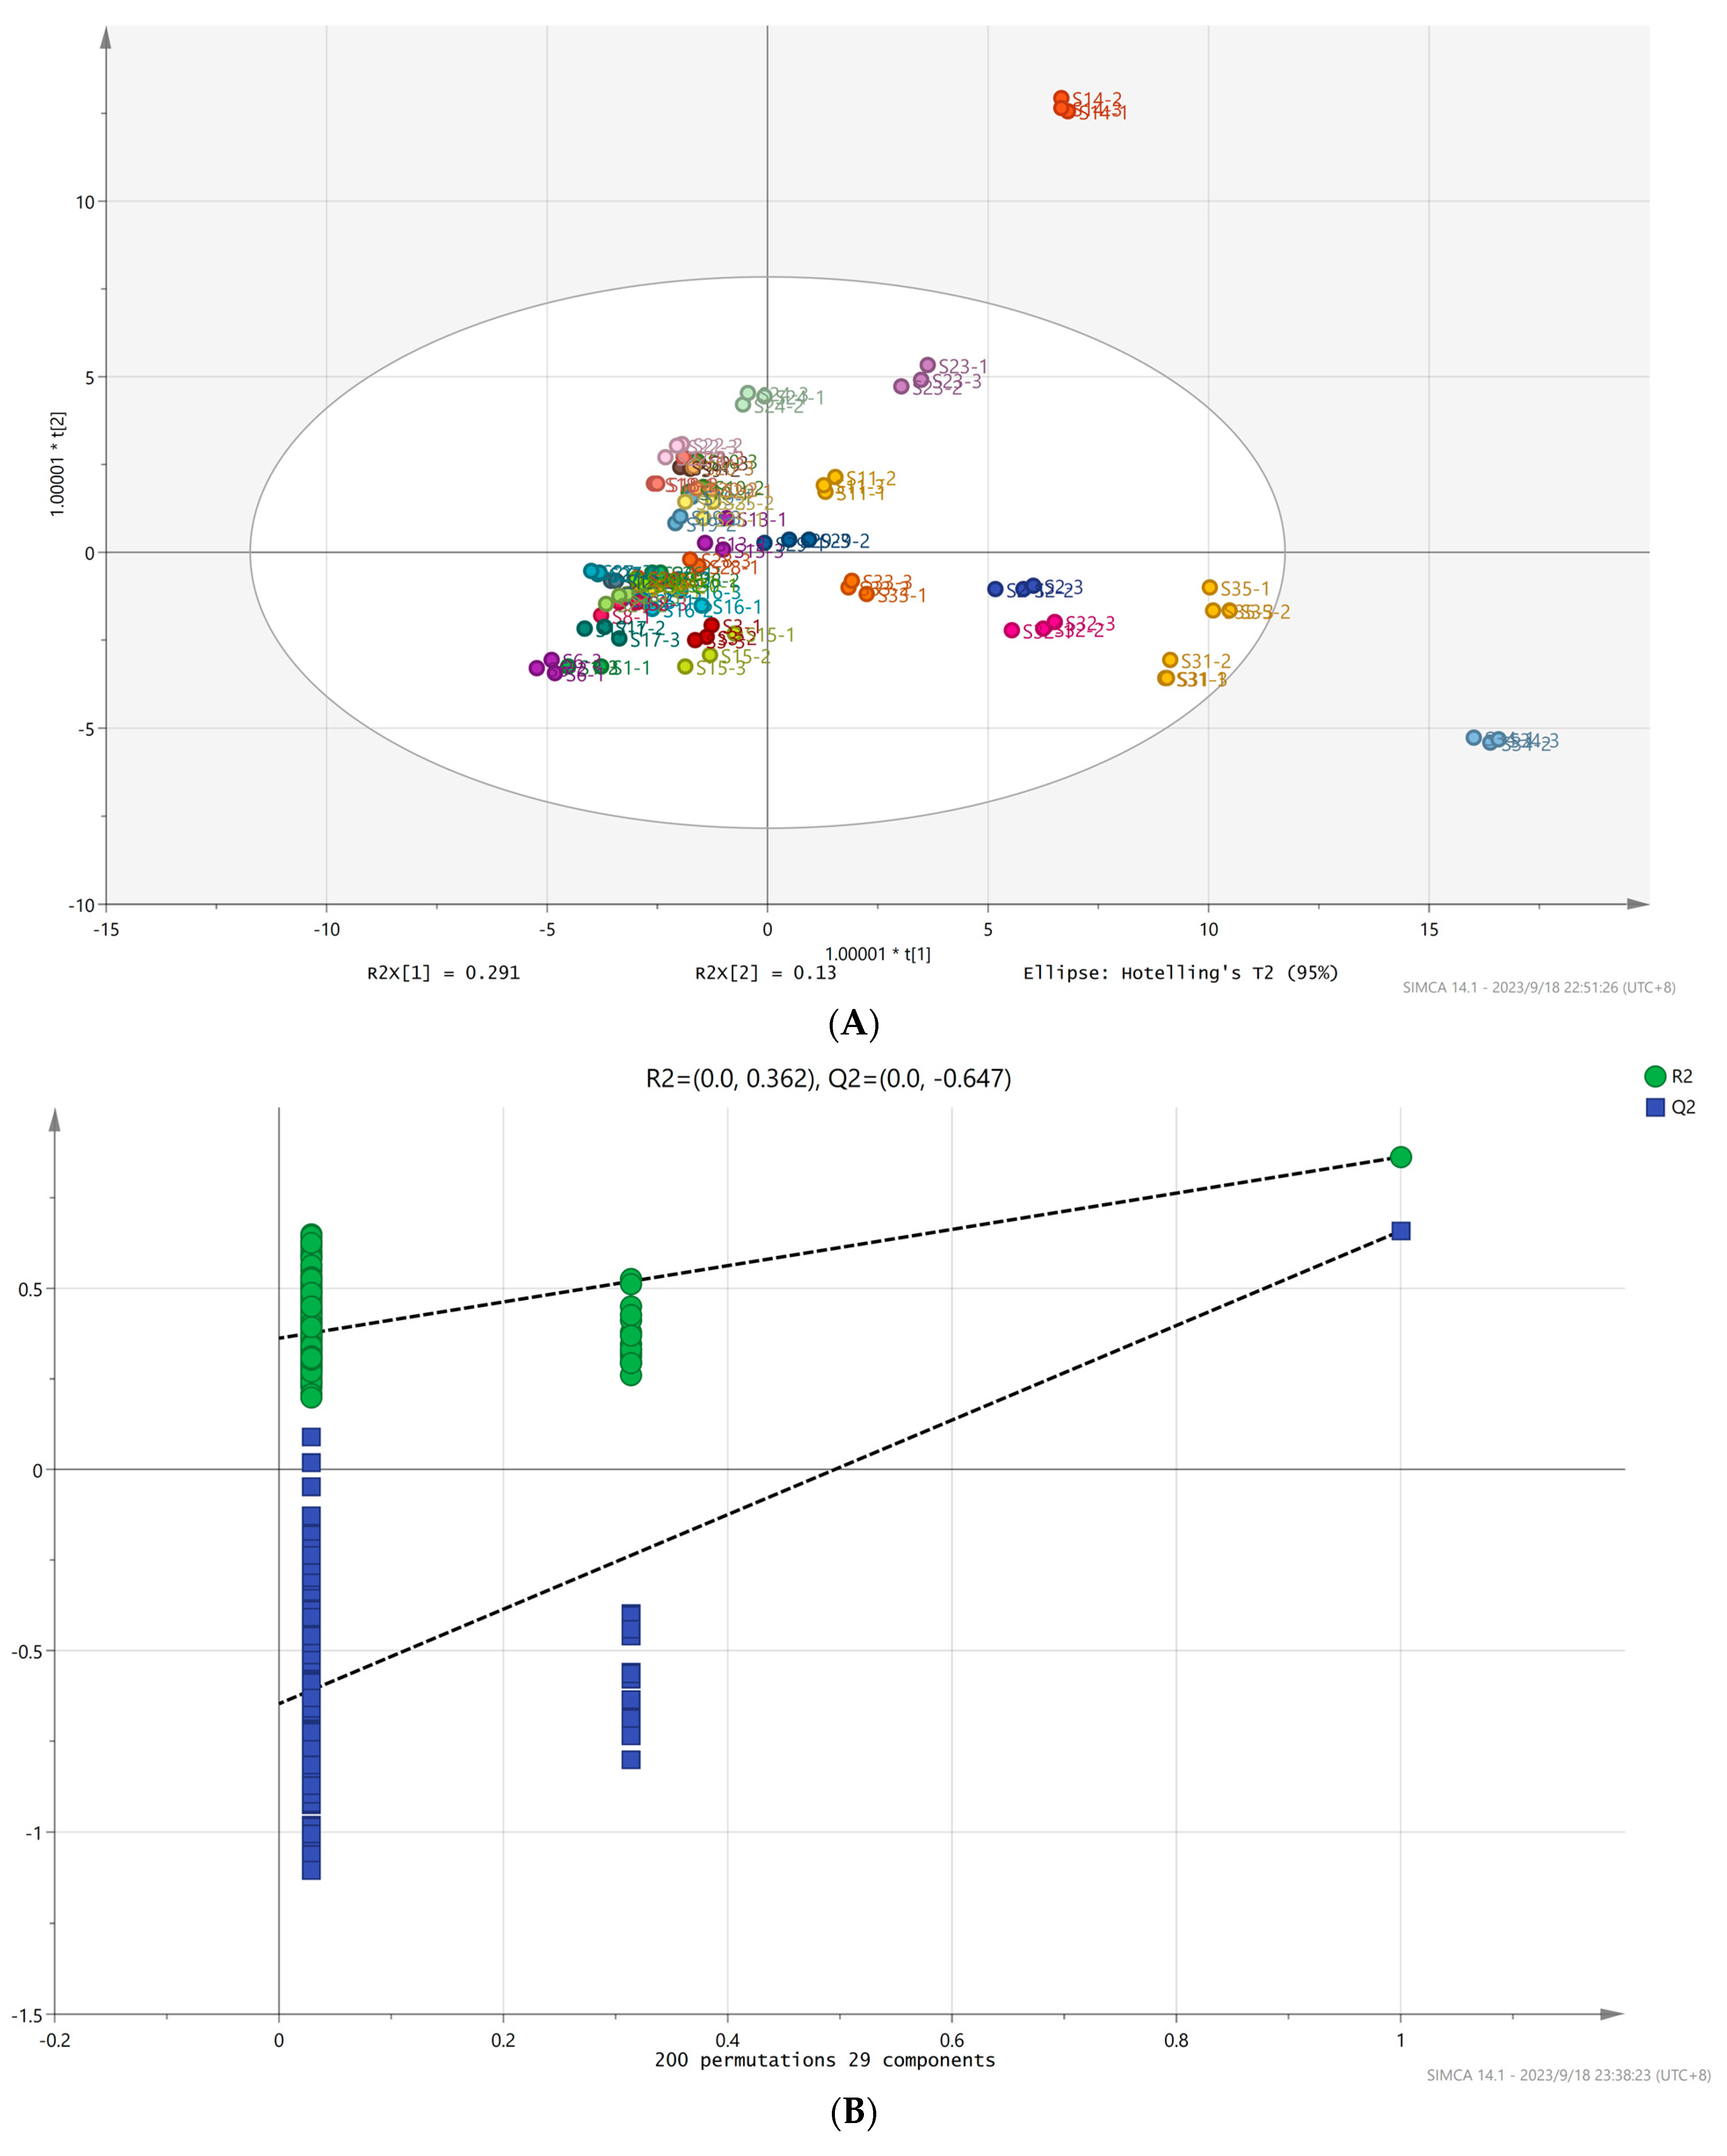
3.6. OPLS-DA Analysis and the Model Validation of Volatile Aroma Compounds of A. arguta Resource Fruits
3.7. OAV Analysis of the Main Aroma Components of Fruit Samples from Different A. arguta Resources
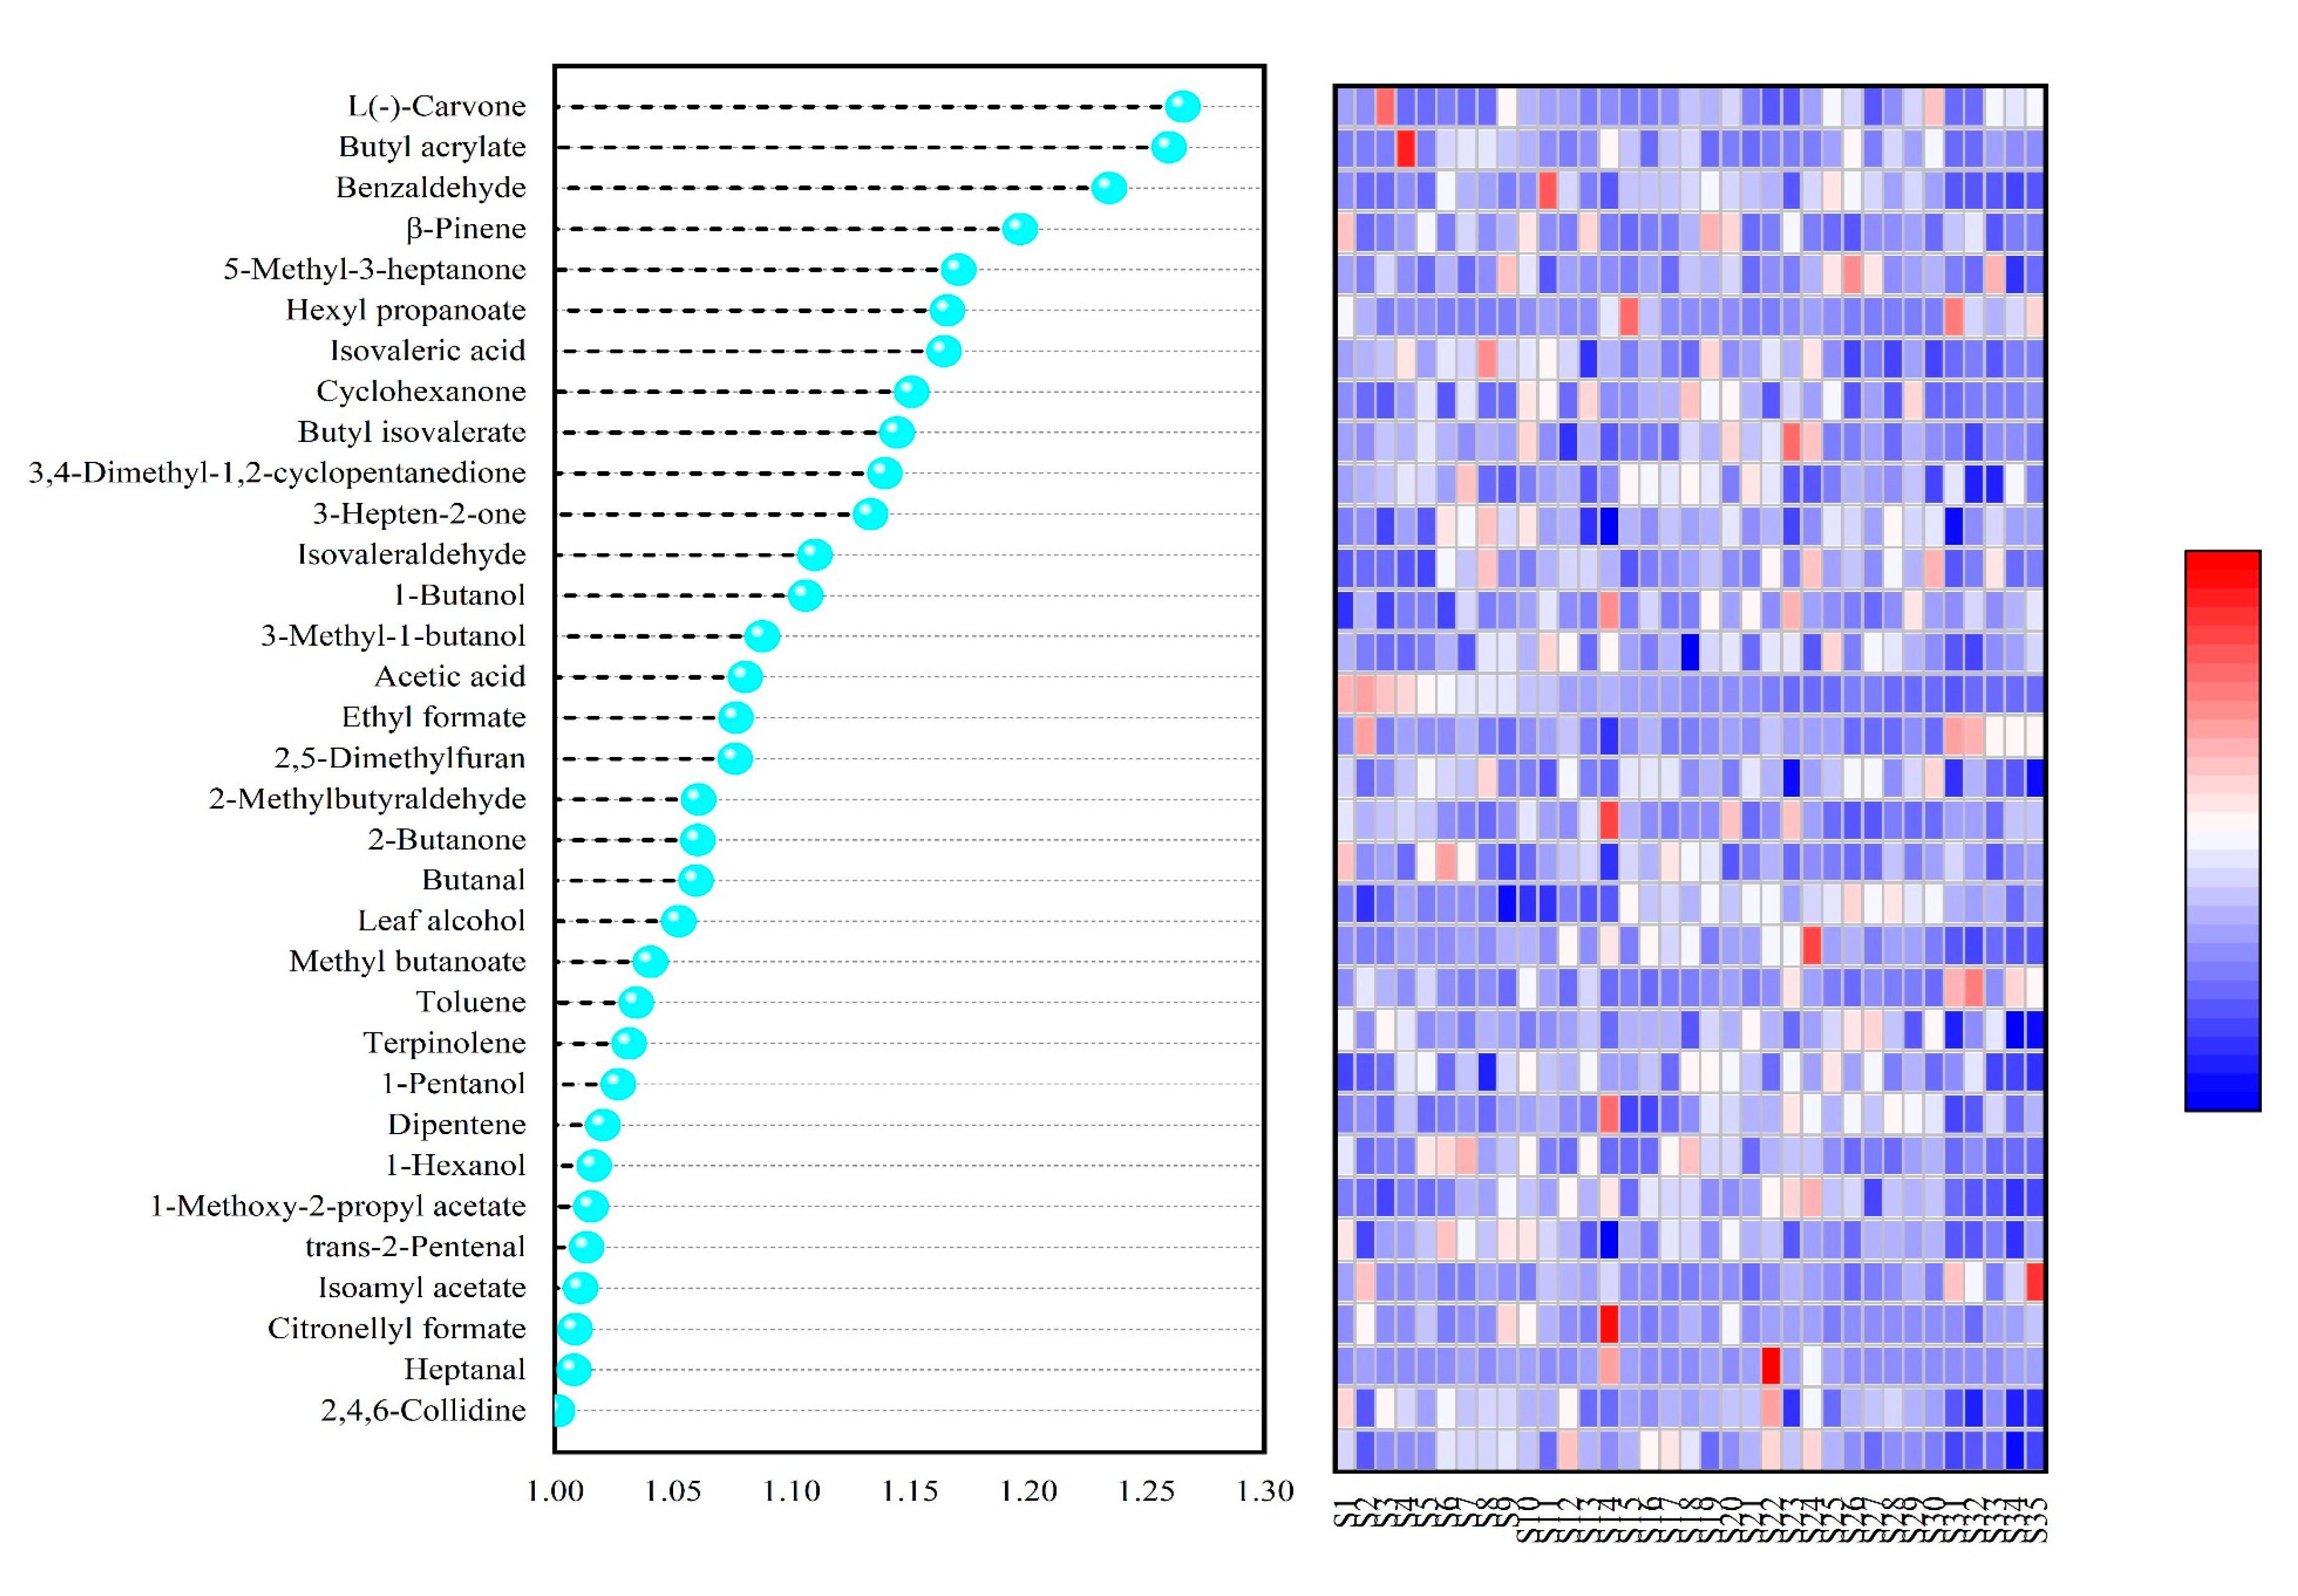
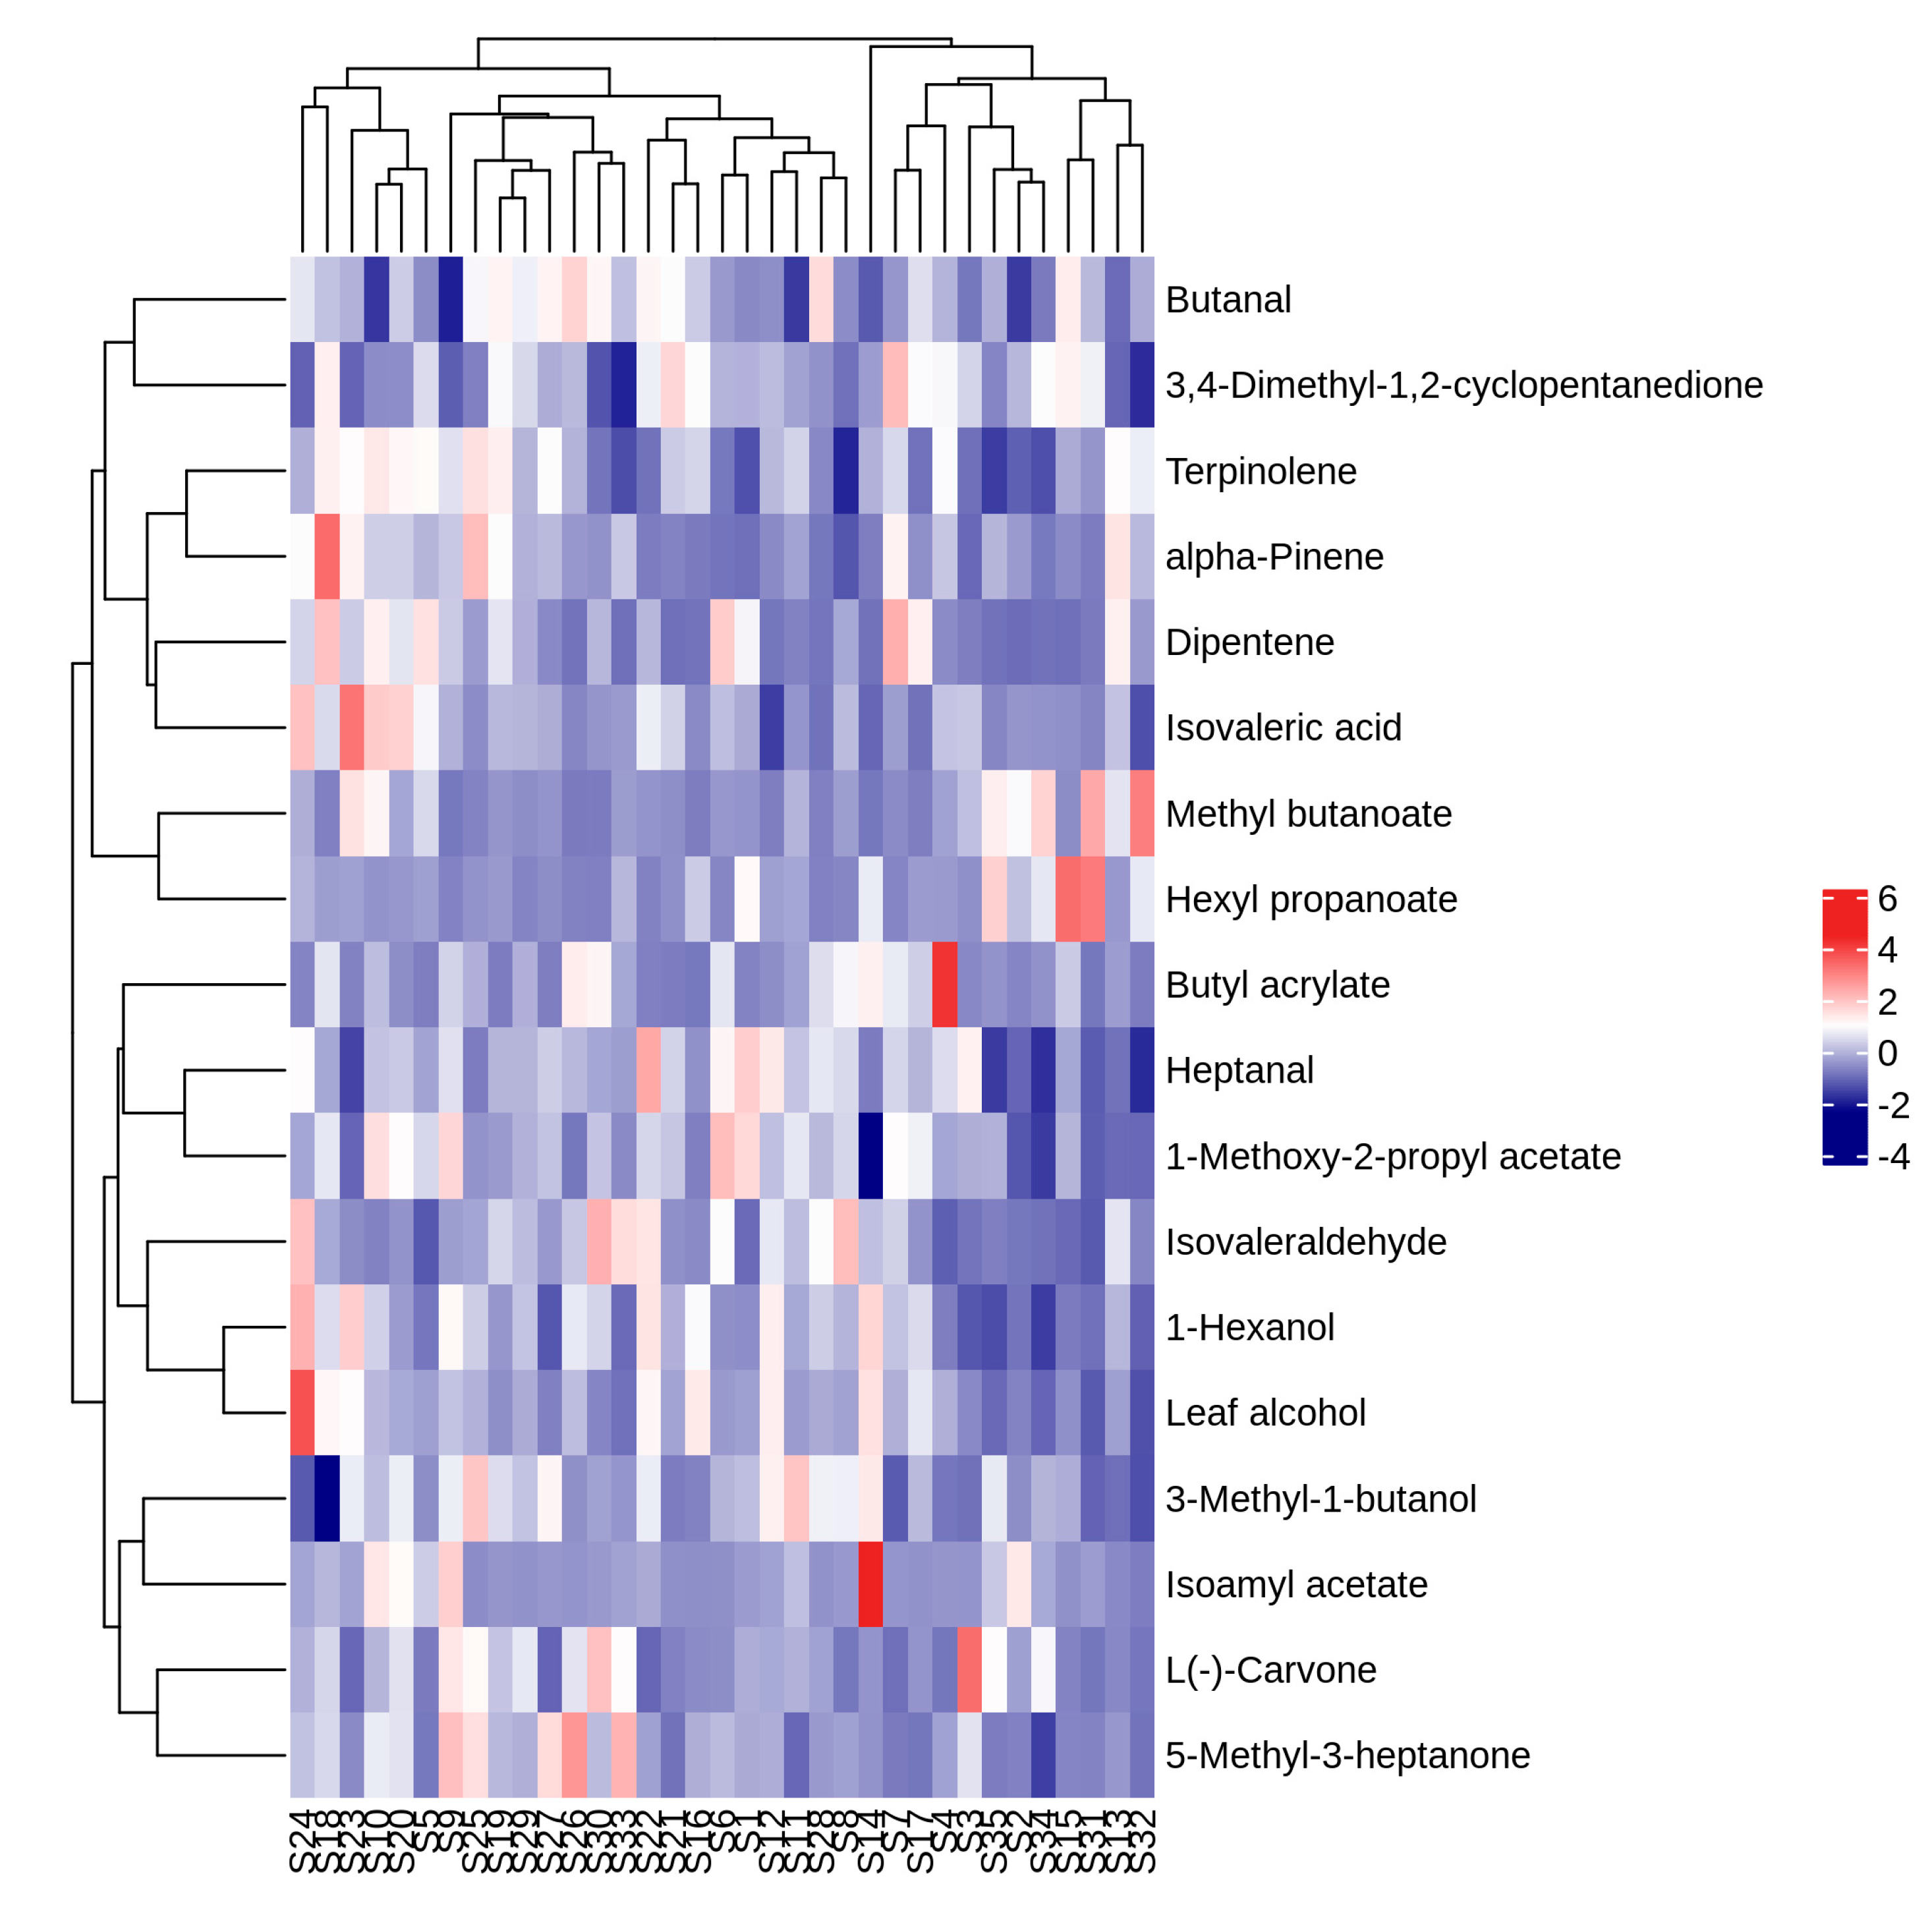
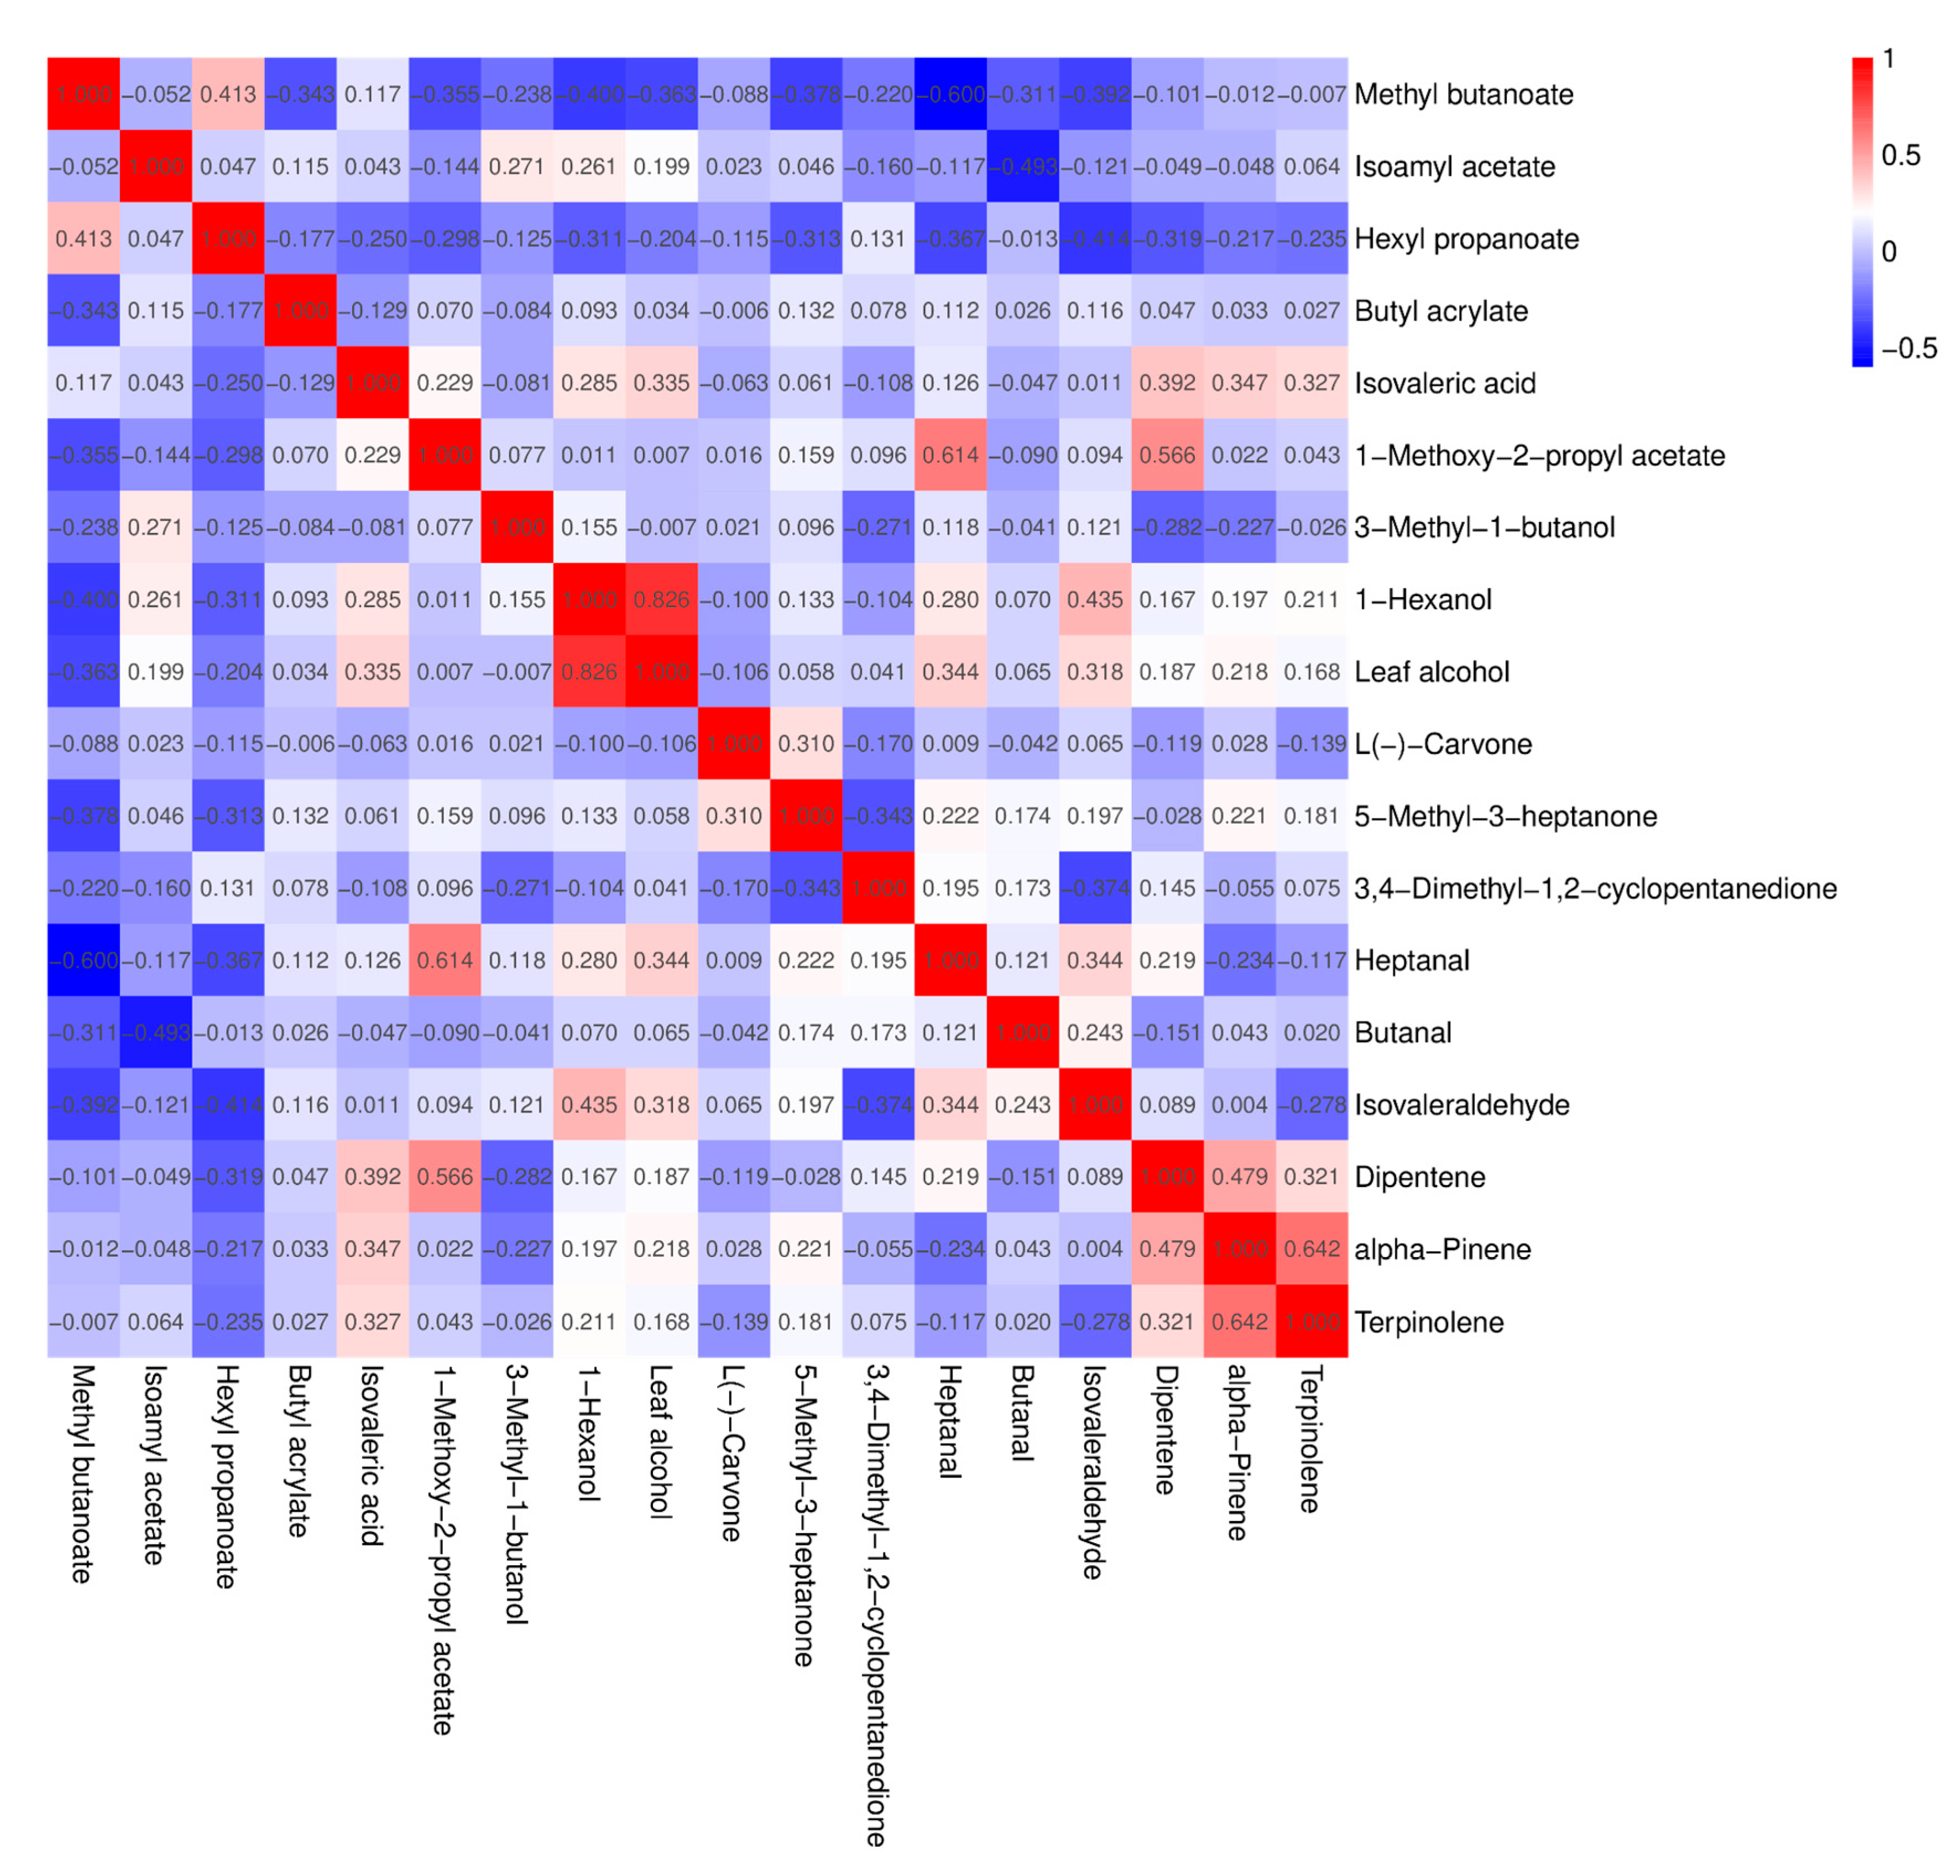
3.8. Heat Map Analysis, PCA Analysis and Correlation Analysis of Volatile Aroma Compounds with OAV > 1 in Fruits of Different A. arguta Resources
4. Conclusions
Supplementary Materials
Author Contributions
Funding
Institutional Review Board Statement
Informed Consent Statement
Data Availability Statement
Conflicts of Interest
References
- He, Y.L.; Qin, H.Y.; Wen, J.L.; Fan, S.T.; Yang, Y.M.; Zhang, B.X.; Cao, W.Y.; Lu, W.P.; Li, C.Y. Quality analysis and comprehensive evaluation of 35 Actinidia argute resources. J. Fruit. Sci. 2023, 40, 1523–1533. [Google Scholar] [CrossRef]
- Piao, Y.L.; Zhao, L.H. Research progress of Actinidia arguta. North. Horticul. 2008, 3, 76–78. Available online: https://kns.cnki.net/kcms2/article/abstract?v=3uoqIhG8C44YLTlOAiTRKgchrJ08w1e7VSL-HJEdEx0PaWcAxm13ZOvEUl25Qn4T8Qm_Vpi0vVHHXSakzk01lbGEvMVwUeUQ&uniplatform=NZKPT (accessed on 19 September 2023).
- Zhang, M.; Wang, H.X.; Lou, X.; Zhao, L.N.; Ming, D.X. The development status and breeding trend of hardy kiwifruit cultivars in the world. J. Ecol. 2017, 36, 3289–3297. [Google Scholar] [CrossRef]
- Latocha, P. The Nutritional and Health Benefits of Kiwiberry (Actinidia arguta)—A Review. Plant Food Hum. Nutr. 2017, 72, 325–334. [Google Scholar] [CrossRef] [PubMed]
- Niu, Q.; Shen, J.; Liu, Y.; Nie, C.Y.; Skripchenko, N.V.; Liu, D.J. Research progress on main active constituents and pharmacological activities of Actinidia arguta. Sci. Technol. Food Ind. 2019, 40, 333–338, 344. [Google Scholar] [CrossRef]
- Almeida, D.; Pinto, D.; Santos, J.; Vinha, A.F.; Palmeira, J.; Ferreira, H.N.; Rodrigues, F.; Oliveira, M.B.P.P. Hardy kiwifruit leaves (Actinidia arguta): An extraordinary source of value-added compounds for food industry. Food Chem. 2018, 259, 113–121. [Google Scholar] [CrossRef] [PubMed]
- Gong, D.S.; Sharma, K.; Kang, K.W.; Kim, D.W.; Oak, M.H. Endothelium-Dependent Relaxation Effects of Actinidia arguta Extracts in Coronary Artery: Involvement of eNOS/Akt Pathway. J. Nanosci Nanotechnol. 2020, 20, 5381–5384. [Google Scholar] [CrossRef] [PubMed]
- Heo, K.H.; Sun, X.; Shim, D.W.; Kim, M.K.; Koppula, S.; Yu, S.H.; Kim, H.B.; Kim, T.J.; Kang, T.B.; Lee, K.H. Actinidia arguta extract attenuates inflammasome activation: Potential involvement in NLRP3 ubiquitination. J. Ethnopharmacol. 2018, 213, 159–165. [Google Scholar] [CrossRef]
- Choi, J.J.; Park, B.; Kim, D.H.; Pyo, M.Y.; Choi, S.; Son, M.; Jin, M. Blockade of atopic dermatitis-like skin lesions by DA-9102, a natural medicine isolated from Actinidia arguta, in the Mg-deficiency induced dermatitis model of hairless rats. Exp. Biol. Med. 2008, 233, 1026–1034. [Google Scholar] [CrossRef]
- Liu, H.; An, K.; Su, S.; Yu, Y.; Wu, J.; Xiao, G.; Xu, Y. Aromatic Characterization of Mangoes (Mangifera indica L.) Using Solid Phase Extraction Coupled with Gas Chromatography-Mass Spectrometry and Olfactometry and Sensory Analyses. Foods 2020, 9, 75. [Google Scholar] [CrossRef]
- Liu, H.; Yu, Y.; Zou, B.; Yu, Y.; Yang, J.; Xu, Y.; Chen, X.; Yang, F. Evaluation of Dynamic Changes and Regularity of Volatile Flavor Compounds for Different Green Plum (Prunus mume Sieb. et Zucc) Varieties during the Ripening Process by HS-GC-IMS with PLS-DA. Foods 2023, 12, 551. [Google Scholar] [CrossRef] [PubMed]
- Xu, L.H.; Lai, J.P.; Kuo, J.Q. Research Progress on Factors Influencing Citrus Fruit Aroma and Quality. J. Gannan Normal Univ. 2019, 40, 85–88. [Google Scholar] [CrossRef]
- Huang, X.; Ni, Z.; Shi, T.; Tao, R.; Yang, Q.; Luo, C.; Li, Y.; Li, H.; Gao, H.; Zhou, X.; et al. Novel insights into the dissemination route of Japanese apricot (Prunus mume Sieb. et Zucc.) based on genomics. Plant J. 2022, 110, 1182–1197. [Google Scholar] [CrossRef] [PubMed]
- Sun, Y.; Ci, Z.J.; Liu, Z.P.; Lu, L.Y.; Liu, G.P.; Chen, X.Z.; Li, R.H.; You, W.Z. Analysis on fruit quality and aroma components of different Actinidia arguta cultivars. Chin. Fruit Trees 2021, 5, 52–55, 60. [Google Scholar] [CrossRef]
- Xin, G.; Zhang, B.; Feng, F.; Li, T.C.; Liu, C.J.; Xu, J.G. Analysis of Aromatic Constituents of Actinidia arguta Sieb. Food Sci. 2009, 30, 230–232. [Google Scholar]
- Zhang, B.X.; Qin, H.Y.; Wang, Y.L.; Li, J.Q.; Li, C.Y.; Zhao, Y.; Fan, S.T. Analysis of the aroma composition of dry wine made from different varieties of Actinidia arguta. Spec. Res. 2023, 45, 112–117, 125. [Google Scholar] [CrossRef]
- An, K.; Liu, H.; Fu, M.; Qian, M.C.; Yu, Y.; Wu, J.; Xiao, G.; Xu, Y. Identification of the cooked off-flavor in heat-sterilized lychee (Litchi chinensis Sonn.) juice by means of molecular sensory science. Food Chem. 2019, 301, 125282. [Google Scholar] [CrossRef]
- Dursun, A.; Caliskan, O.; Guler, Z.; Bayazit, S.; Turkmen, D.; Gunduz, K. Effect of harvest maturity on volatile compounds profiling and eating quality of hawthorn (Crataegus azarolus L.) fruit. Sci. Hortic-amsterdam. 2021, 288. [Google Scholar] [CrossRef]
- Tian, Z.; Zhang, M.; Wang, Y.; Liu, Y.P.; Yue, T.L.; Huo, Y.J. Aroma fingerprint characterization of different kiwifruit juices based on headspace-gas chromatography-ion mobility spectrometry. Food Ferment. Ind. 2023, 49, 279–287. [Google Scholar] [CrossRef]
- Li, C.; Xin, M.; Li, L.; He, X.; Yi, P.; Tang, Y.; Li, J.; Zheng, F.; Liu, G.; Sheng, J.; et al. Characterization of the aromatic profile of purple passion fruit (Passiflora edulis Sims) during ripening by HS-SPME-GC/MS and RNA sequencing. Food Chem. 2021, 355, 129685. [Google Scholar] [CrossRef]
- Hernandez Mesa, M.; Ropartz, D.; Garcia Campana, A.M.; Rogniaux, H.; Dervilly Pinel, G.; Le Bizec, B. Ion Mobility Spectrometry in Food Analysis: Principles, Current Applications and Future Trends. Molecules 2019, 24, 2706. [Google Scholar] [CrossRef] [PubMed]
- Zhang, L.; Shuai, Q.; Li, P.; Zhang, Q.; Ma, F.; Zhang, W.; Ding, X. Ion mobility spectrometry fingerprints: A rapid detection technology for adulteration of sesame oil. Food Chem. 2016, 192, 60–66. [Google Scholar] [CrossRef] [PubMed]
- Li, M.; Yang, R.; Zhang, H.; Wang, S.; Chen, D.; Lin, S. Development of a flavor fingerprint by HS-GC-IMS with PCA for volatile compounds of Tricholoma matsutake Singer. Food Chem. 2019, 290, 32–39. [Google Scholar] [CrossRef] [PubMed]
- Gerhardt, N.; Birkenmeier, M.; Sanders, D.; Rohn, S.; Weller, P. Resolution-optimized headspace gas chromatography-ion mobility spectrometry (HS-GC-IMS) for non-targeted olive oil profiling. Anal. Bioanal. Chem. 2017, 409, 3933–3942. [Google Scholar] [CrossRef] [PubMed]
- Arce, L.; Gallegos, J.; Garrido-Delgado, R.; Medina, L.M.; Sielemann, S.; Wortelmann, T. Ion Mobility Spectrometry a Versatile Analytical Tool for Metabolomics Applications in Food Science. Curr. Metabol. 2014, 2, 264–271. [Google Scholar] [CrossRef]
- Hernandez Mesa, M.; Escourrou, A.; Monteau, F.; Le Bizec, B.; Dervilly Pinel, G. Current applications and perspectives of ion mobility spectrometry to answer chemical food safety issues. Trac-Trends Anal. Chem. 2017, 94, 39–53. [Google Scholar] [CrossRef]
- Zheng, X.; Smith, R.D.; Baker, E.S. Recent advances in lipid separations and structural elucidation using mass spectrometry combined with ion mobility spectrometry, ion-molecule reactions and fragmentation approaches. Curr. Opin. Chem. Biol. 2018, 42, 111–118. [Google Scholar] [CrossRef]
- Sun, X.; Gu, D.; Fu, Q.; Gao, L.; Shi, C.; Zhang, R.; Qiao, X. Content variations in compositions and volatile component in jujube fruits during the blacking process. Food Sci. Nutr. 2019, 7, 1387–1395. [Google Scholar] [CrossRef]
- Wang, Q.; Chen, X.; Zhang, C.; Li, X.; Yue, N.; Shao, H.; Wang, J.; Jin, F. Discrimination and Characterization of Volatile Flavor Compounds in Fresh Oriental Melon after Forchlorfenuron Application Using Electronic Nose (E-Nose) and Headspace-Gas Chromatography-Ion Mobility Spectrometry (HS-GC-IMS). Foods 2023, 12, 1272. [Google Scholar] [CrossRef]
- Cao, W.; Shu, N.; Wen, J.; Yang, Y.; Jin, Y.; Lu, W. Characterization of the Key Aroma Volatile Compounds in Nine Different Grape Varieties Wine by Headspace Gas Chromatography-Ion Mobility Spectrometry (HS-GC-IMS), Odor Activity Values (OAV) and Sensory Analysis. Foods 2022, 11, 2767. [Google Scholar] [CrossRef]
- Cavanna, D.; Zanardi, S.; Dall’Asta, C.; Suman, M. Ion mobility spectrometry coupled to gas chromatography: A rapid tool to assess eggs freshness. Food Chem. 2019, 271, 691–696. [Google Scholar] [CrossRef] [PubMed]
- Wang, X.; Yang, S.; He, J.; Chen, L.; Zhang, J.; Jin, Y.; Zhou, J.; Zhang, Y. A green triple-locked strategy based on volatile-compound imaging, chemometrics, and markers to discriminate winter honey and sapium honey using headspace gas chromatography-ion mobility spectrometry. Food Res. Int. 2019, 119, 960–967. [Google Scholar] [CrossRef]
- Song, M.T. Evaluation of Actinidia arguta Germplasm Based on the Nutrition, Taste and Storge Quality. Master’s Thesis, Shenyang Agricultural University, Shenyang, China, 2022. (In Chinese). [Google Scholar]
- He, X.; Yangming, H.; Gorska-Horczyczak, E.; Wierzbicka, A.; Jelen, H.H. Rapid analysis of Baijiu volatile compounds fingerprint for their aroma and regional origin authenticity assessment. Food Chem. 2021, 337, 128002. [Google Scholar] [CrossRef] [PubMed]
- Song, X.; Wang, G.; Zhu, L.; Zheng, F.; Ji, J.; Sun, J.; Li, H.; Huang, M.; Zhao, Q.; Zhao, M. Comparison of two cooked vegetable aroma compounds, dimethyl disulfide and methional, in Chinese Baijiu by a sensory-guided approach and chemometrics. LWT-Food Sci. Technol. 2021, 146, 111427. [Google Scholar] [CrossRef]
- Jiao, Y.; Ye, T.; Zhang, J.J.; Guo, X.X.; Luo, G.H. Comprehensive Quality Evaluation of Nostoc commune Vauch. from Gansu Province by Principal Component Analysis and Cluster Analysis. Food Sci. 2019, 40, 130–135. [Google Scholar]
- Pollo, B.J.; Teixeira, C.A.; Belinato, J.R.; Furlan, M.F.; de Matos Cunha, I.C.; Vaz, C.R.; Volpato, G.V.; Augusto, F. Chemometrics, Comprehensive Two-Dimensional gas chromatography and "omics" sciences: Basic tools and recent applications. TrAC-Trends Anal. Chem. 2021, 134, 116111. [Google Scholar] [CrossRef]
- Rocchetti, G.; O’Callaghan, T.F. Application of metabolomics to assess milk quality and traceability. Curr. Opin. Food Sci. 2021, 40, 168–178. [Google Scholar] [CrossRef]
- Shu, N. Study on Fermentation Characteristics and Dry Red Wine Brewing Technology of New Grape New Vitis Amurensis Cultivar ‘Beiguohong’. Master’s Thesis, Chinese Academy of Agricultural Sciences, Beijing, China, 2019. (In Chinese). [Google Scholar]
- Huo, J.Y.; Liu, J.; Feng, H.; Wang, Y.G. Reviews on flavor quality of Tomato. China Veget. 2005, 2, 38–40. [Google Scholar] [CrossRef]
- Zhou, X.Y.; Zhu, C.H.; Li, J.X.; Gao, J.Y.; Gong, Q.; Shen, Z.S.2; Yue, J.Q. Advances in research on organic acid metabolism in fruits. South. China Fruits 2015, 44, 120–125, 132. [Google Scholar] [CrossRef]
- Zhang, Y.P.; Yang, Y.J.; Yang, L.; Li, Y.; Gao, B.M.; Wang, X.J.; Dong, X.M. Hazard of Oxalate in Plants and its Control Manners. Anhui Agric. Sci. Bull. 2007, 10, 34–39, 92. [Google Scholar] [CrossRef]
- Sha, S.F. Pear Organic Acid Components, Content Changes and Genetic Identification. Doctorate’s Thesis, Nanjing Agricultural University, Nanjing, China, 2012. (In Chinese). [Google Scholar]
- Rovio, S.; Siren, K.; Siren, H. Application of capillary electrophoresis to determine metal cations, anions, organic acids, and carbohydrates in some Pinot Noir red wines. Food Chem. 2011, 124, 1194–1200. [Google Scholar] [CrossRef]
- Hulme, A.C. Quinic and shikimic acids in fruits. Qual. Plant. Mater. Veget. 1958, 3/4, 468–473. [Google Scholar] [CrossRef]
- Zhao, Y.; Zhu, H.Y.; Yang, D.D.; Gong, C.S.; Liu, W.G. Research Progress of Citric Acid Metabolism in the Fruit. Acta Hortic. Sin. 2022, 49, 2579–2596. [Google Scholar] [CrossRef]
- Fan, L.J. Study on Regulating Effect and Mechanism of Asoorbic Acid on Postharvest Persimmon Fruit Softness. Master’s Thesis, Guangxi University, Nanning, China, 2016. (In Chinese). [Google Scholar]
- Li, M.; Du, H.; Lin, S. Flavor Changes of Tricholoma matsutake Singer under Different Processing Conditions by Using HS-GC-IMS. Foods 2021, 10, 531. [Google Scholar] [CrossRef]
- Zhu, Y.; Lv, H.-P.; Shao, C.-Y.; Kang, S.; Zhang, Y.; Guo, L.; Dai, W.-D.; Tan, J.-F.; Peng, Q.-H.; Lin, Z. Identification of key odorants responsible for chestnut-like aroma quality of green teas. Food Res. Int. 2018, 108, 74–82. [Google Scholar] [CrossRef] [PubMed]
- Chen, Y.; Li, P.; Liao, L.; Qin, Y.; Jiang, L.; Liu, Y. Characteristic fingerprints and volatile flavor compound variations in Liuyang Douchi during fermentation via HS-GC-IMS and HS-SPME-GC-MS. Food Chem. 2021, 361, 130055. [Google Scholar] [CrossRef] [PubMed]
- Du, X.; Rouseff, R. Aroma Active Volatiles in Four Southern Highbush Blueberry Cultivars Determined by Gas Chromatography-Olfactometry (GC-O) and Gas Chromatography-Mass Spectrometry (GC-MS). J. Agric. Food Chem. 2014, 62, 4537–4543. [Google Scholar] [CrossRef]
- Zhu, J.; Wang, L.; Xiao, Z.; Niu, Y. Characterization of the key aroma compounds in mulberry fruits by application of gas chromatography-olfactometry (GC-O), odor activity value (OAV), gas chromatography-mass spectrometry (GC-MS) and flame photometric detection (FPD). Food Chem. 2018, 245, 775–785. [Google Scholar] [CrossRef]
- Guerra Ramirez, D.; Gonzalez Garcia, K.E.; Medrano Hernandez, J.M.; Famiani, F.; Cruz Castillo, J.G. Antioxidants in processed fruit, essential oil, and seed oils of feijoa. Not. Bot. Horti Agrobot. Cluj-Napoca 2021, 49, 11988. [Google Scholar] [CrossRef]
- Wang, S.; Chen, H.; Sun, B. Recent progress in food flavor analysis using gas chromatography-ion mobility spectrometry (GC-IMS). Food Chem. 2020, 315, 126158. [Google Scholar] [CrossRef]
- Wang, J.H.; Ye, X.Y.; Mu, Y.; Ma, L.Z.; Qian, Y.; Ge, Y. Comparative analysis of characteristic aroma components of 3 kinds of representative Actinidia chinensis Planch species in Guizhou. J. Food Safe Qual. 2022, 13, 6190–6197. [Google Scholar] [CrossRef]
- Li, Y.; Zhang, Y.; Peng, Z.; Tan, B.; Lin, H. The difference of quality components of Fuzhuan tea and Qian-liang tea based on the orthogonal partial least squares discriminant analysis model. J. Food Safe Qual. 2017, 8, 4382–4387. [Google Scholar]
- Jin, W.; Zhao, P.; Liu, J.; Geng, J.; Chen., X.; Pei., J.; Jiang, P. Volatile flavor components analysis of giant salamander (Andrias davidiauns) meat during roasting process based on gas chromatography-ion mobility spectroscopy and chemometrics. Food Ferment. Ind. 2021, 47, 231–239. [Google Scholar] [CrossRef]
- Yun, J.; Cui, C.; Zhang, S.; Zhu, J.; Peng, C.; Cai, H.; Yang, X.; Hou, R. Use of headspace GC/MS combined with chemometric analysis to identify the geographic origins of black tea. Food Chem. 2021, 360, 130033. [Google Scholar] [CrossRef]
- Heting, Q.; Shenghua, D.; Zhaoping, P.; Xiang, L.; Fuhua, F. Characteristic Volatile Fingerprints and Odor Activity Values in Different Citrus-Tea by HS-GC-IMS and HS-SPME-GC-MS. Molecules 2020, 25, 6027. [Google Scholar]
- Miyazaki, T.; Plotto, A.; Baldwin, E.A.; Reyes-De-Corcuera, J.I.; Gmitter, F.G., Jr. Aroma characterization of tangerine hybrids by gas-chromatography-olfactometry and sensory evaluation. J. Sci. Food Agric. 2012, 92, 727–735. [Google Scholar] [CrossRef] [PubMed]


| No. | Name | Source | No. | Name | Source | No. | Name | Source |
|---|---|---|---|---|---|---|---|---|
| S1 | A020203 | Fusong County, Jilin Province, China | S13 | A130701 | Ji’an County, Jilin Province, China | S25 | B080401 | Ji’an County, Jilin Province, China |
| S2 | A040103 | Ji’an County, Jilin Province, China | S14 | A130801 | Ji’an County, Jilin Province, China | S26 | B080701 | Ji’an County, Jilin Province, China |
| S3 | A060902 | Zuojia Town, Jilin Province, China | S15 | A140101 | Zuojia Town, Jilin Province, China | S27 | T040501 | Fusong County, Jilin Province, China |
| S4 | A100101 | Ji’an County, Jilin Province, China | S16 | A140301 | Zuojia Town, Jilin Province, China | S28 | T060203 | Ji’an County, Jilin Province, China |
| S5 | A100703 | Ji’an County, Jilin Province, China | S17 | A140602 | Dunhua City, Jilin Province, China | S29 | T060301 | Fusong County, Jilin Province, China |
| S6 | A100801 | Ji’an County, Jilin Province, China | S18 | A160701 | Zuojia Town, Jilin Province, China | S30 | T060503 | Ji’an County, Jilin Province, China |
| S7 | A101201 | Dunhua City, Jilin Province, China | S19 | A170303 | Fusong County, Jilin Province, China | S31 | SH1 | Zuojia Town, Jilin Province, China |
| S8 | A111001 | Zuojia Town, Jilin Province, China | S20 | A180303 | Fusong County, Jilin Province, China | S32 | SH2 | Zuojia Town, Jilin Province, China |
| S9 | A120403 | Dunhua City, Jilin Province, China | S21 | A180902 | Zuojia Town, Jilin Province, China | S33 | SH3 | Zuojia Town, Jilin Province, China |
| S10 | A120601 | Dunhua City, Jilin Province, China | S22 | A191002 | Ji’an County, Jilin Province, China | S34 | SH4 | Zuojia Town, Jilin Province, China |
| S11 | A130101 | Ji’an County, Jilin Province, China | S23 | B020802 | Zuojia Town, Jilin Province, China | S35 | SH5 | Zuojia Town, Jilin Province, China |
| S12 | A130602 | Ji’an County, Jilin Province, China | S24 | B070101 | Zuojia Town, Jilin Province, China |
| Name | Concentration g/L | Standard Curves | R2 |
|---|---|---|---|
| Oxalic acid | 1.02 | y = 24763x − 735.65 | 0.9998 |
| Quinic acid | 1.01 | y = 779.46x − 18.648 | 0.9962 |
| Malic acid | 1.00 | y = 1613.5x − 7.0785 | 0.9999 |
| Shikimic acid | 1.00 | y = 45865x + 2285.4 | 0.9977 |
| Lactic acid | 1.08 | y = 1272.5x − 4.6931 | 1 |
| Citric acid | 1.02 | y = 2028.3x − 18.753 | 0.9999 |
| Ascorbic acid | 1.03 | y = 24.297x − 41.339 | 0.9998 |
| Time (min: sec) | E1 (Drift Gas) | E2 (Carrier Gas) | Recording |
|---|---|---|---|
| 00:00,000 | 150 mL/min | 2 mL/min | rec |
| 02:00,000 | 150 mL/min | 2 mL/min | - |
| 10:00,000 | 150 mL/min | 10 mL/min | - |
| 20:00,000 | 150 mL/min | 100 mL/min | - |
| 30:00,000 | 150 mL/min | 100 mL/min | stop |
| Name | Soluble Sugar % | Titratable Acid % | Sugar–Acid Ratio |
|---|---|---|---|
| S1 | 5.74 ± 0.34 opq | 0.78 ± 0.01 k | 7.39 ± 0.39 hij |
| S2 | 5.35 ± 0.08 q | 1.00 ± 0.06 ij | 5.34 ± 0.23 op |
| S3 | 6.66 ± 0.17 jkl | 0.98 ± 0.08 j | 6.80 ± 0.47 ijkl |
| S4 | 2.94 ± 0.12 u | 1.20 ± 0.04 ef | 2.45 ± 0.17 t |
| S5 | 5.84 ± 0.24 nop | 0.82 ± 0.02 k | 7.10 ± 0.38 hijk |
| S6 | 5.34 ± 0.09 q | 0.97 ± 0.07 j | 5.51 ± 0.48 nop |
| S7 | 6.49 ± 0.42 klm | 0.85 ± 0.04 k | 7.63 ± 0.21 hi |
| S8 | 7.04 ± 0.16 ij | 1.39 ± 0.09 c | 5.08 ± 0.30 pq |
| S9 | 4.14 ± 0.03 s | 0.98 ± 0.01 j | 4.24 ± 0.04 r |
| S10 | 6.65 ± 0.39 jkl | 1.00 ± 0.18 ij | 6.65 ± 0.87 jkl |
| S11 | 7.14 ± 0.33 hi | 1.04 ± 0.03 hij | 6.89 ± 0.47 ijkl |
| S12 | 9.40 ± 0.41 b | 0.77 ± 0.05 k | 12.21 ± 0.64 e |
| S13 | 4.44 ± 0.09 rs | 0.64 ± 0.01 l | 6.93 ± 0.20 ijkl |
| S14 | 6.03 ± 0.23 no | 1.05 ± 0.02 hij | 5.72 ± 0.15 mnop |
| S15 | 7.20 ± 0.48 ghi | 1.11 ± 0.08 fgh | 6.47 ± 0.86 klm |
| S16 | 6.05 ± 0.21 mno | 0.95 ± 0.08 j | 6.35 ± 0.71 klm |
| S17 | 4.85 ± 0.33 r | 0.84 ± 0.04 k | 5.73 ± 0.62 mnop |
| S18 | 8.25 ± 0.10 cd | 1.17 ± 0.02 efg | 7.05 ± 0.06 ijk |
| S19 | 3.48 ± 0.10 t | 1.02 ± 0.03 hij | 3.43 ± 0.20 s |
| S20 | 6.84 ± 0.32 ijk | 1.02 ± 0.01 hij | 6.71 ± 0.39 jkl |
| S21 | 6.82 ± 0.27 ijk | 1.26 ± 0.02 de | 5.42 ± 0.23 op |
| S22 | 8.31 ± 0.30 cd | 1.05 ± 0.03 hij | 7.92 ± 0.34 h |
| S23 | 5.71 ± 0.09 opq | 1.09 ± 0.04 ghi | 5.24 ± 0.17 o |
| S24 | 8.70 ± 0.40 c | 1.59 ± 0.06 a | 5.48 ± 0.15 op |
| S25 | 9.36 ± 0.54 b | 1.47 ± 0.01 b | 6.35 ± 0.34 klmn |
| S26 | 13.97 ± 0.10 a | 1.51 ± 0.05 ab | 9.0.26 g |
| S27 | 5.43 ± 0.29 pq | 1.23 ± 0.02 e | 4.40 ± 0.24 qr |
| S28 | 7.79 ± 0.17 ef | 1.04 ± 0.09 hij | 7.47 ± 0.60 hij |
| S29 | 8.18 ± 0.36 de | 1.33 ± 0.04 cd | 6.15 ± 0.41 lmno |
| S30 | 7.54 ± 0.06 fgh | 1.17 ± 0.04 efg | 6.46 ± 0.23 klm |
| S31 | 8.30 ± 0.06 cd | 0.47 ± 0.03 mn | 17.78 ± 1.06 b |
| S32 | 6.22 ± 0.06 lmn | 0.40 ± 0.02 no | 15.67 ± 0.39 c |
| S33 | 7.62 ± 0.14 fg | 0.53 ± 0.02 m | 14.47 ± 0.38 d |
| S34 | 3.68 ± 0.09 t | 0.37 ± 0.01 o | 10.04 ± 0.26 f |
| S35 | 9.23 ± 0.07 b | 0.32 ± 0.01 o | 28.50 ± 1.04 a |
| CV(%) | 30.74 | 32.03 | 61.25 |
| Name | Oxalic Acid g/L | Quinic Acid g/L | Malic Acid g/L | Shikimic Acid g/L | Lactic Acid g/L | Citric Acid g/L | Ascorbic Acid g/L |
|---|---|---|---|---|---|---|---|
| S1 | 0.030 ± 0.003 p | 7.714 ± 0.318 c | 0.765 ± 0.040 st | 0.51 ± 0.002 g | 0.329 ± 0.0.014 a | 8.113 ± 0.051 f | 59.617 ± 0.067 x |
| S2 | 0.026 ± 0.003 pq | 11.426 ± 0.109 a | 2.753 ± 0.066 b | 0.026 ± 0.002 n | 0.208 ± 0.010 b | 10.823 ± 0.149 a | 67.872 ± 0.063 w |
| S3 | 0.133 ± 0.014 efghij | 6.085 ± 0.051 g | 1.666 ± 0.017 i | 0.043 ± 0.004 hi | N.A. | 7.890 ± 0.042 g | 334.402 ± 15.919 m |
| S4 | 0.154 ± 0.014 bcd | 5.764 ± 0.039 i | 1.591 ± 0.024 j | 0.019 ± 0.002 p | 0.102 ± 0.003 g | 8.642 ± 0.067 d | 677.253 ± 0.273 e |
| S5 | 0.105 ± 0.011 no | 2.872 ± 0.017 v | 0.212 ± 0.017 y | 0.046 ± 0.002 hi | N.A. | 3.479 ± 0.018 x | 904.739 ± 0.215 a |
| S6 | 0.141 ± 0.013 cedfg | 6.682 ± 0.026 e | 1.184 ± 0.023 n | 0.062 ± 0.002 de | 0.046 ± 0.003 m | 8.266 ± 0.017 e | 82.676 ± 0.195 u |
| S7 | 0.156 ± 0.008 bc | 5.432 ± 0.018 k | 0.684 ± 0.010 u | 0.081 ± 0.002 b | 0.083 ± 0.002 i | 7.267 ± 0.024 j | 28.740 ± 0.341 z |
| S8 | 0.016 ± 0.001 pq | 8.544 ± 0.016 b | 2.868 ± 0.014 a | 0.073 ± 0.003 c | N.A. | 10.547 ± 0.030 b | 209.252 ± 0.094 r |
| S9 | 0.020 ± 0.001 pq | 5.447 ± 0.014 k | 1.000 ± 0.011 p | 0.043 ± 0.003 hi | 0.015 ± 0.002 o | 6.735 ± 0.014 l | 530.055 ± 0.125 g |
| S10 | 0.165 ± 0.010 b | 6.378 ± 0.018 f | 1.338 ± 0.010 l | 0.041 ± 0.004 ij | N.A. | 6.793 ± 0.013 k | 772.682 ± 0.173 d |
| S11 | 0.136 ± 0.017 efghi | 4.047 ± 0.014 st | 2.174 ± 0.013 e | 0.047 ± 0.003 hi | 0.060 ± 0.003 kl | 5.014 ± 0.019 u | 338.561 ± 0.316 m |
| S12 | 0.182 ± 0.010 a | 5.486 ± 0.013 k | 1.924 ± 0.021 f | 0.026 ± 0.003 no | 0.147 ± 0.008 d | 6.837 ± 0.009 k | 56.312 ± 0.166 x |
| S13 | 0.139 ± 0.013 defgh | 5.001 ± 0.013 m | 1.697 ± 0.012 hi | 0.064 ± 0.002 d | N.A. | 3.153 ± 0.012 y | 338.813 ± 0.188 m |
| S14 | 0.156 ± 0.017 cdef | 3.976 ± 0.014 tu | 2.428 ± 0.016 c | 0.018 ± 0.002 p | N.A. | 6.624 ± 0.010 m | 393.866 ± 0.133 k |
| S15 | 0.020 ± 0.002 pq | 6.983 ± 0.009 d | 1.744 ± 0.021 g | 0.061 ± 0.002 de | 0.113 ± 0.004 f | 8.076 ± 0.020 f | 48.530 ± 0.132 y |
| S16 | 0.150 ± 0.015 bcde | 4.838 ± 0.010 no | 1.230 ± 0.015 m | 0.057 ± 0.002 fg | N.A. | 5.680 ± 0.024 r | 46.768 ± 0.093 y |
| S17 | 0.092 ± 0.011 o | 1.641 ± 0.013 w | 0.302 ± 0.014 x | 0.091 ± 0.002 a | 0.072 ± 0.002 j | 1.987 ± 0.007 z | 65.416 ± 0.071 w |
| S18 | 0.122 ± 0.008 hijklm | 2.871 ± 0.014 v | 0.514 ± 0.031 v | 0.084 ± 0.003 b | N.A. | 3.136 ± 0.021 y | 244.467 ± 0.093 p |
| S19 | 0.018 ± 0.001 pq | 4.615 ± 0.011 q | 2.227 ± 0.014 d | 0.034 ± 0.003 kl | 0.137 ± 0.005 e | 8.832 ± 0.022 c | 51.441 ± 0.078 y |
| S20 | 0.115 ± 0.100 bc | 5.901 ± 0.018 h | 0.982 ± 0.009 p | 0.061 ± 0.005 ef | N.A. | 6.486 ± 0.012 n | 510.680 ± 0.105 h |
| S21 | 0.106 ± 0.007 mno | 3.902 ± 0.036 uv | 0.920 ± 0.007 q | 0.018 ± 0.002 p | 0.070 ± 0.003 j | 4.362 ± 0.014 w | 795.696 ± 0.217 c |
| S22 | 0.138 ± 0.027 ijklm | 5.828 ± 0.011 hi | 1.706 ± 0.013 h | 0.035 ± 0.003 kl | N.A. | 6.138 ± 0.027 p | 125.166 ± 0.182 s |
| S23 | 0.016 ± 0.002 pq | 7.082 ± 0.005 d | 0.903 ± 0.010 q | 0.075 ± 0.003 c | N.A. | 5.215 ± 0.011 t | 109.725 ± 0.074 t |
| S24 | 0.142 ± 0.008 cdefg | 6.447 ± 0.014 f | 0.776 ± 0.010 st | 0.054 ± 0.003 fg | 0.094 ± 0.003 h | 6.291 ± 0.017 o | 249.555 ± 0.096 o |
| S25 | 0.118 ± 0.010 jklnm | 5.647 ± 0.008 j | 1.180 ± 0.031 n | 0.028 ± 0.002 mn | N.A. | 7.695 ± 0.014 i | 857.254 ± 0.061 b |
| S26 | 0.096 ± 0.010 o | 5.312 ± 0.040 l | 1.522 ± 0.008 k | 0.067 ± 0.003 d | 0.054 ± 0.004 l | 7.761 ± 0.009 h | 457.152 ± 0.089 i |
| S27 | 0.173 ± 0.006 pq | 4.560 ± 0.007 q | 1.500 ± 0.007 k | 0.035 ± 0.002 jk | 0.061 ± 0.003 k | 7.945 ± 0.022 g | 582.221 ± 0.123 f |
| S28 | 0.146 ± 0.027 fghijk | 5.665 ± 0.013 j | 0.850 ± 0.012 r | 0.049 ± 0.004 h | N.A. | 5.176 ± 0.012 t | 277.654 ± 0.143 n |
| S29 | 0.119 ± 0.007 ijklmn | 4.292 ± 0.013 r | 1.099 ± 0.027 o | 0.046 ± 0.002 hi | 0.161 ± 0.002 c | 5.595 ± 0.014 s | 393.842 ± 0.131 k |
| S30 | 0.113 ± 0.007 lmn | 4.092 ± 0.009 s | 0.744 ± 0.012 t | 0.043 ± 0.006 hi | N.A. | 3.034 ± 0.013 y | 74.301 ± 0.137 v |
| S31 | 0.013 ± 0.002 q | 4.748 ± 0.024 op | 0.295 ± 0.010 x | 0.037 ± 0.003 kl | 0.027 ± 0.002 n | 5.231 ± 0.023 t | 237.644 ± 0.058 q |
| S32 | 0.115 ± 0.010 klmn | 4.602 ± 0.021 q | 0.289 ± 0.010 x | 0.027 ± 0.002 n | 0.033 ± 0.002 n | 5.218 ± 0.027 t | 66.265 ± 0.064 w |
| S33 | 0.128 ± 0.011 ghijkl | 4.667 ± 0.040 pq | 0.795 ± 0.017 s | 0.038 ± 0.003 jk | N.A. | 5.619 ± 0.019 s | 420.748 ± 0.110 j |
| S34 | 0.140 ± 0.013 fghijkl | 4.925 ± 0.027 mn | 0.463 ± 0.017 w | 0.032 ± 0.002 lm | 0.083 ± 0.003 i | 5.842 ± 0.009 q | 456.249 ± 0.090 i |
| S35 | 0.142 ± 0.010 defgh | 4.560 ± 0.013 q | 0.669 ± 0.017 u | 0.021 ± 0.002 op | 0.044 ± 0.003 m | 4.932 ± 0.017 v | 352.468 ± 0.095 l |
| CV(%) | 51.7 | 31.95 | 62.09 | 43.17 | 131.07 | 32.11 | 79.72 |
| Number | Count | Compound | CAS# | Formula | MW | RI | Rt [sec] | Dt [a.u.] | Comment |
|---|---|---|---|---|---|---|---|---|---|
| 1 | Esters | Methyl butanoate M | 623-42-7 | C5H10O2 | 102.1 | 1018.9 | 306.187 | 1.14902 | Monomer |
| 2 | Methyl butanoate D | 623-42-7 | C5H10O2 | 102.1 | 1010.8 | 300.593 | 1.43148 | Dimer | |
| 3 | Methyl acetate | 79-20-9 | C3H6O2 | 74.1 | 890 | 242.237 | 1.19625 | ||
| 4 | Isoamyl acetate M | 123-92-2 | C7H14O2 | 130.2 | 1146.5 | 422.748 | 1.31005 | Monomer | |
| 5 | Isoamyl acetate D | 123-92-2 | C7H14O2 | 130.2 | 1141.9 | 417.108 | 1.75368 | Dimer | |
| 6 | Hexyl propanoate | 2445-76-3 | C9H18O2 | 158.2 | 1300.6 | 663.746 | 1.42868 | ||
| 7 | Hexyl acetate | 142-92-7 | C8H16O2 | 144.2 | 1298.1 | 660.409 | 1.38933 | ||
| 8 | Ethyl (E)-hex-2-enoate | 27829-72-7 | C8H14O2 | 142.2 | 1044.1 | 324.256 | 1.31395 | ||
| 9 | Ethyl propionate M | 105-37-3 | C5H10O2 | 102.1 | 966.4 | 276.19 | 1.14517 | Monomer | |
| 10 | Ethyl propionate D | 105-37-3 | C5H10O2 | 102.1 | 984.3 | 284.817 | 1.45669 | Dimer | |
| 11 | Ethyl hexanoate M | 123-66-0 | C8H16O2 | 144.2 | 1256.9 | 585.898 | 1.34038 | Monomer | |
| 12 | Ethyl hexanoate D | 123-66-0 | C8H16O2 | 144.2 | 1248.9 | 571.997 | 1.80357 | Dimer | |
| 13 | Ethyl formate | 109-94-4 | C3H6O2 | 74.1 | 854.4 | 227.914 | 1.0705 | ||
| 14 | Ethyl butyrate | 105-54-4 | C6H12O2 | 116.2 | 1053.1 | 331.029 | 1.55657 | ||
| 15 | Ethyl acetate M | 141-78-6 | C4H8O2 | 88.1 | 919.2 | 254.721 | 1.10585 | Monomer | |
| 16 | Ethyl acetate D | 141-78-6 | C4H8O2 | 88.1 | 918 | 254.194 | 1.33838 | Dimer | |
| 17 | Ethyl isovalerate | 108-64-5 | C7H14O2 | 130.2 | 1077 | 349.558 | 1.65689 | ||
| 18 | Butyl propionate | 590-01-2 | C7H14O2 | 130.2 | 1174.4 | 458.567 | 1.71886 | ||
| 19 | Butyl acetate M | 123-86-4 | C6H12O2 | 116.2 | 1034.3 | 317.103 | 1.23496 | Monomer | |
| 20 | Butyl acetate D | 123-86-4 | C6H12O2 | 116.2 | 1035.3 | 317.832 | 1.61627 | Dimer | |
| 21 | Butyl acrylate | 141-32-2 | C7H12O2 | 128.2 | 887 | 240.999 | 1.26357 | ||
| 22 | Butyl isovalerate | 109-19-3 | C9H18O2 | 158.2 | 1011.2 | 300.863 | 1.3947 | ||
| 23 | 1-Methoxy-2-propyl acetate | 108-65-6 | C6H12O3 | 132.2 | 857.5 | 229.122 | 1.14191 | ||
| 24 | Citronellyl formate | 105-85-1 | C11H20O2 | 184.3 | 1288.5 | 643.76 | 1.8982 | ||
| 25 | Alcohols | Ethanol | 64-17-5 | C2H6O | 46.1 | 984.1 | 284.691 | 1.04754 | |
| 26 | Cis-2-Penten-1-ol | 1576-95-0 | C5H10O | 86.1 | 1342.4 | 721.899 | 0.94816 | ||
| 27 | 1-Penten-3-ol | 616-25-1 | C5H10O | 86.1 | 1176.3 | 461.09 | 0.94578 | ||
| 28 | Isobutanol | 78-83-1 | C4H10O | 74.1 | 1149.3 | 426.234 | 1.36406 | ||
| 29 | Carveol M | 99-48-9 | C10H16O | 152.2 | 1242.2 | 560.754 | 1.29522 | Monomer | |
| 30 | Carveol D | 99-48-9 | C10H16O | 152.2 | 1237.4 | 552.68 | 1.68177 | Dimer | |
| 31 | 3-Methyl-1-butanol | 123-51-3 | C5H12O | 88.1 | 1223.3 | 529.961 | 1.49475 | ||
| 32 | 1-Butanol | 71-36-3 | C4H10O | 74.1 | 1160.7 | 440.596 | 1.18265 | ||
| 33 | Cyclooctanol | 696-71-9 | C8H16O | 128.2 | 1164.6 | 445.668 | 1.12941 | ||
| 34 | 2-Methyl-1-butanol | 137-32-6 | C5H12O | 88.1 | 1180.1 | 466.173 | 1.47668 | ||
| 35 | 1-Pentanol | 71-41-0 | C5H12O | 88.1 | 1272.9 | 614.561 | 1.25548 | ||
| 36 | 1-Hexanol M | 111-27-3 | C6H14O | 102.2 | 1375.3 | 771.107 | 1.32787 | Monomer | |
| 37 | 1-Hexanol D | 111-27-3 | C6H14O | 102.2 | 1373 | 767.501 | 1.64025 | Dimer | |
| 38 | 1-Hexanol T | 111-27-3 | C6H14O | 102.2 | 1367.9 | 759.689 | 1.98315 | Trimer | |
| 39 | Cineole M | 470-82-6 | C10H18O | 154.3 | 1216.4 | 519.23 | 1.29225 | Monomer | |
| 40 | Cineole D | 470-82-6 | C10H18O | 154.3 | 1216.7 | 519.575 | 1.72287 | Dimer | |
| 41 | Leaf alcohol | 928-96-1 | C6H12O | 100.2 | 1383.9 | 784.497 | 1.23283 | ||
| 42 | 2-Heptanol | 543-49-7 | C7H16O | 116.2 | 1292.5 | 651.413 | 1.71865 | ||
| 43 | Ketones | 2-Octanone | 111-13-7 | C8H16O | 128.2 | 1304.1 | 668.411 | 1.33533 | |
| 44 | L(-)-Carvone | 6485-40-1 | C10H14O | 150.2 | 1137 | 411.188 | 1.81159 | ||
| 45 | Isomenthone | 491-07-6 | C10H18O | 154.3 | 1178.9 | 464.569 | 1.34028 | ||
| 46 | 2-Hexanone | 591-78-6 | C6H12O | 100.2 | 1064.4 | 339.629 | 1.50148 | ||
| 47 | 2-Heptanone M | 110-43-0 | C7H14O | 114.2 | 1194.2 | 485.826 | 1.25783 | Monomer | |
| 48 | 2-Heptanone D | 110-43-0 | C7H14O | 114.2 | 1201.1 | 495.975 | 1.63226 | Dimer | |
| 49 | Cyclohexanone | 108-94-1 | C6H10O | 98.1 | 1300.3 | 663.412 | 1.15313 | ||
| 50 | 2-Butanone M | 78-93-3 | C4H8O | 72.1 | 894.9 | 244.296 | 1.06226 | Monomer | |
| 51 | 2-Butanone D | 78-93-3 | C4H8O | 72.1 | 937.1 | 262.631 | 1.2478 | Dimer | |
| 52 | 5-Methyl-3-heptanone M | 541-85-5 | C8H16O | 128.2 | 942.3 | 265.002 | 1.27861 | Monomer | |
| 53 | 5-Methyl-3-heptanone D | 541-85-5 | C8H16O | 128.2 | 961.6 | 273.911 | 1.68433 | Dimer | |
| 54 | Methyl isobutenyl ketone | 141-79-7 | C6H10O | 98.1 | 1155.1 | 433.411 | 1.44875 | ||
| 55 | 3-Hydroxy-2-butanone | 513-86-0 | C4H8O2 | 88.1 | 1307.8 | 673.432 | 1.05977 | ||
| 56 | 3-Hepten-2-one | 1119-44-4 | C7H12O | 112.2 | 932.2 | 260.463 | 1.2265 | ||
| 57 | 3,5-Dimethyl-1,2-cyclopentanedione | 13494-07-0 | C7H10O2 | 126.2 | 1066.3 | 341.109 | 1.61079 | ||
| 58 | 3,4-Dimethyl-1,2-cyclopentanedione | 13494-06-9 | C7H10O2 | 126.2 | 1093.2 | 362.744 | 1.62262 | ||
| 59 | 1-Penten-3-one | 1629-58-9 | C5H8O | 84.1 | 1058.9 | 335.428 | 1.0793 | ||
| 60 | Hydroxyacetone | 116-09-6 | C3H6O2 | 74.1 | 1277.9 | 623.753 | 1.04359 | ||
| 61 | 2-Pentanone | 107-87-9 | C5H10O | 86.1 | 951.4 | 269.186 | 1.37493 | ||
| 62 | Aldehydes | Hexanal M | 66-25-1 | C6H12O | 100.2 | 1118.7 | 389.828 | 1.25902 | Monomer |
| 63 | Hexanal D | 66-25-1 | C6H12O | 100.2 | 1094.5 | 363.792 | 1.56769 | Dimer | |
| 64 | Heptanal M | 111-71-7 | C7H14O | 114.2 | 1202.9 | 498.672 | 1.33033 | Monomer | |
| 65 | Heptanal D | 111-71-7 | C7H14O | 114.2 | 1202.9 | 498.672 | 1.69473 | Dimer | |
| 66 | Butanal M | 123-72-8 | C4H8O | 72.1 | 878.1 | 237.336 | 1.11738 | Monomer | |
| 67 | Butanal D | 123-72-8 | C4H8O | 72.1 | 867 | 232.889 | 1.2832 | Dimer | |
| 68 | Benzaldehyde | 100-52-7 | C7H6O | 106.1 | 1531.1 | 1053.979 | 1.15444 | ||
| 69 | Isovaleraldehyde | 590-86-3 | C5H10O | 86.1 | 938.6 | 263.336 | 1.40951 | ||
| 70 | trans-2-Pentenal | 1576-87-0 | C5H8O | 84.1 | 1150 | 427.068 | 1.10704 | ||
| 71 | 2-Methylbutyraldehyde | 96-17-3 | C5H10O | 86.1 | 875.4 | 236.261 | 1.1511 | ||
| 72 | Isobutyraldehyde M | 78-84-2 | C4H8O | 72.1 | 817.6 | 213.951 | 1.09932 | Monomer | |
| 73 | Isobutyraldehyde D | 78-84-2 | C4H8O | 72.1 | 852.8 | 227.247 | 1.28367 | Dimer | |
| 74 | (Z)-4-Heptenal | 6728-31-0 | C7H12O | 112.2 | 1300.2 | 663.227 | 1.61962 | ||
| 75 | trans-2-Pentenal | 1576-87-0 | C5H8O | 84.1 | 1112 | 382.209 | 1.36162 | ||
| 76 | trans-2-Hexena M | 6728-26-3 | C6H10O | 98.1 | 1251.7 | 576.747 | 1.1827 | Monomer | |
| 77 | trans-2-Hexenal D | 6728-26-3 | C6H10O | 98.1 | 1224.3 | 531.583 | 1.51357 | Dimer | |
| 78 | Propionaldehyde | 123-38-6 | C3H6O | 58.1 | 826.2 | 217.111 | 1.04325 | ||
| 79 | Terpenes | Dipentene M | 138-86-3 | C10H16 | 136.2 | 1210.7 | 510.409 | 1.21981 | Monomer |
| 80 | Dipentene D | 138-86-3 | C10H16 | 136.2 | 1215.6 | 517.85 | 1.72287 | Dimer | |
| 81 | Camphene | 79-92-5 | C10H16 | 136.2 | 1080.1 | 352.008 | 1.20989 | ||
| 82 | β-Pinene | 127-91-3 | C10H16 | 136.2 | 1134.7 | 408.475 | 1.21824 | ||
| 83 | Myrcene | 123-35-3 | C10H16 | 136.2 | 1190.1 | 480.08 | 1.21772 | ||
| 84 | alpha-Pinene | 80-56-8 | C10H16 | 136.2 | 1033.8 | 316.769 | 1.22179 | ||
| 85 | α-Phellandrene | 99-83-2 | C10H16 | 136.2 | 1174.6 | 458.757 | 1.21952 | ||
| 86 | Terpinolene | 586-62-9 | C10H16 | 136.2 | 1292.5 | 651.428 | 1.21948 | ||
| 87 | Acids | Acetic acid M | 64-19-7 | C2H4O2 | 60.1 | 1504.8 | 999.756 | 1.05441 | Monomer |
| 88 | Acetic acid D | 64-19-7 | C2H4O2 | 60.1 | 1505 | 1000.243 | 1.15277 | Dimer | |
| 89 | Isovaleric acid | 503-74-2 | C5H10O2 | 102.1 | 863.4 | 231.439 | 1.21454 | ||
| 90 | Pyrazines | 2-Methoxy-3-methylpyrazine | 2847-30-5 | C6H8N2O | 124.1 | 985 | 285.138 | 1.57071 | |
| 91 | 2,3,5-Trimethylpyrazine | 14667-55-1 | C7H10N2 | 122.2 | 1445.7 | 887.951 | 1.17114 | ||
| 92 | 2-Ethyl-3-methylpyrazine | 15707-23-0 | C7H10N2 | 122.2 | 1337.9 | 715.399 | 1.59816 | ||
| 93 | Furans | 2,5-Dimethylfuran | 625-86-5 | C6H8O | 96.1 | 930.2 | 259.546 | 1.02742 | |
| 94 | 2-Pentylfuran | 3777-69-3 | C9H14O | 138.2 | 1228.3 | 537.902 | 1.24624 | ||
| 95 | Other compounds | Toluene | 108-88-3 | C7H8 | 92.1 | 1033.1 | 316.26 | 1.02501 | |
| 96 | 2,4,6-Collidine | 108-75-8 | C8H11N | 121.2 | 1374.1 | 769.181 | 1.5841 |
Disclaimer/Publisher’s Note: The statements, opinions and data contained in all publications are solely those of the individual author(s) and contributor(s) and not of MDPI and/or the editor(s). MDPI and/or the editor(s) disclaim responsibility for any injury to people or property resulting from any ideas, methods, instructions or products referred to in the content. |
© 2023 by the authors. Licensee MDPI, Basel, Switzerland. This article is an open access article distributed under the terms and conditions of the Creative Commons Attribution (CC BY) license (https://creativecommons.org/licenses/by/4.0/).
Share and Cite
He, Y.; Qin, H.; Wen, J.; Cao, W.; Yan, Y.; Sun, Y.; Yuan, P.; Sun, B.; Fan, S.; Lu, W.; et al. Characterization of Key Compounds of Organic Acids and Aroma Volatiles in Fruits of Different Actinidia argute Resources Based on High-Performance Liquid Chromatography (HPLC) and Headspace Gas Chromatography–Ion Mobility Spectrometry (HS-GC-IMS). Foods 2023, 12, 3615. https://doi.org/10.3390/foods12193615
He Y, Qin H, Wen J, Cao W, Yan Y, Sun Y, Yuan P, Sun B, Fan S, Lu W, et al. Characterization of Key Compounds of Organic Acids and Aroma Volatiles in Fruits of Different Actinidia argute Resources Based on High-Performance Liquid Chromatography (HPLC) and Headspace Gas Chromatography–Ion Mobility Spectrometry (HS-GC-IMS). Foods. 2023; 12(19):3615. https://doi.org/10.3390/foods12193615
Chicago/Turabian StyleHe, Yanli, Hongyan Qin, Jinli Wen, Weiyu Cao, Yiping Yan, Yining Sun, Pengqiang Yuan, Bowei Sun, Shutian Fan, Wenpeng Lu, and et al. 2023. "Characterization of Key Compounds of Organic Acids and Aroma Volatiles in Fruits of Different Actinidia argute Resources Based on High-Performance Liquid Chromatography (HPLC) and Headspace Gas Chromatography–Ion Mobility Spectrometry (HS-GC-IMS)" Foods 12, no. 19: 3615. https://doi.org/10.3390/foods12193615
APA StyleHe, Y., Qin, H., Wen, J., Cao, W., Yan, Y., Sun, Y., Yuan, P., Sun, B., Fan, S., Lu, W., & Li, C. (2023). Characterization of Key Compounds of Organic Acids and Aroma Volatiles in Fruits of Different Actinidia argute Resources Based on High-Performance Liquid Chromatography (HPLC) and Headspace Gas Chromatography–Ion Mobility Spectrometry (HS-GC-IMS). Foods, 12(19), 3615. https://doi.org/10.3390/foods12193615