
Impact of Circular Brewer’s Spent Grain Flour after In Vitro Gastrointestinal Digestion on Human Gut Microbiota


 ,
,  ,
, 
 ,
,  and
and 
Abstract
:1. Introduction
2. Materials and Methods
2.1. Raw Material
2.2. Extraction Procedure
2.3. Simulated In Vitro Gastrointestinal Tract
2.3.1. Oral Digestion
2.3.2. Gastric Digestion
2.3.3. Intestinal Digestion
2.3.4. Antioxidant Activity
ABTS Radical Cation Assay
Oxygen Radical Absorbance Capacity (ORAC)
Total Phenolic Content
Determination of Polyphenolic Profile and Composition
Bioaccesibility Index
2.4. Prebiotic Activity
2.5. In Vitro Fermentation Assays
2.6. Gut Microbiota Evaluation
2.6.1. DNA Extraction
2.6.2. Real-Time PCR for Microbial Analysis at Stool
2.6.3. Determination of Organic Acids
2.7. Statistical Analysis
3. Results and Discussion
3.1. Bioaccessibility under Gastrointestinal Conditions
3.1.1. Content and Profile of Phenolic Compounds
Total Phenolic Content
Individual Phenolic Compounds
3.2. Antioxidant Activity
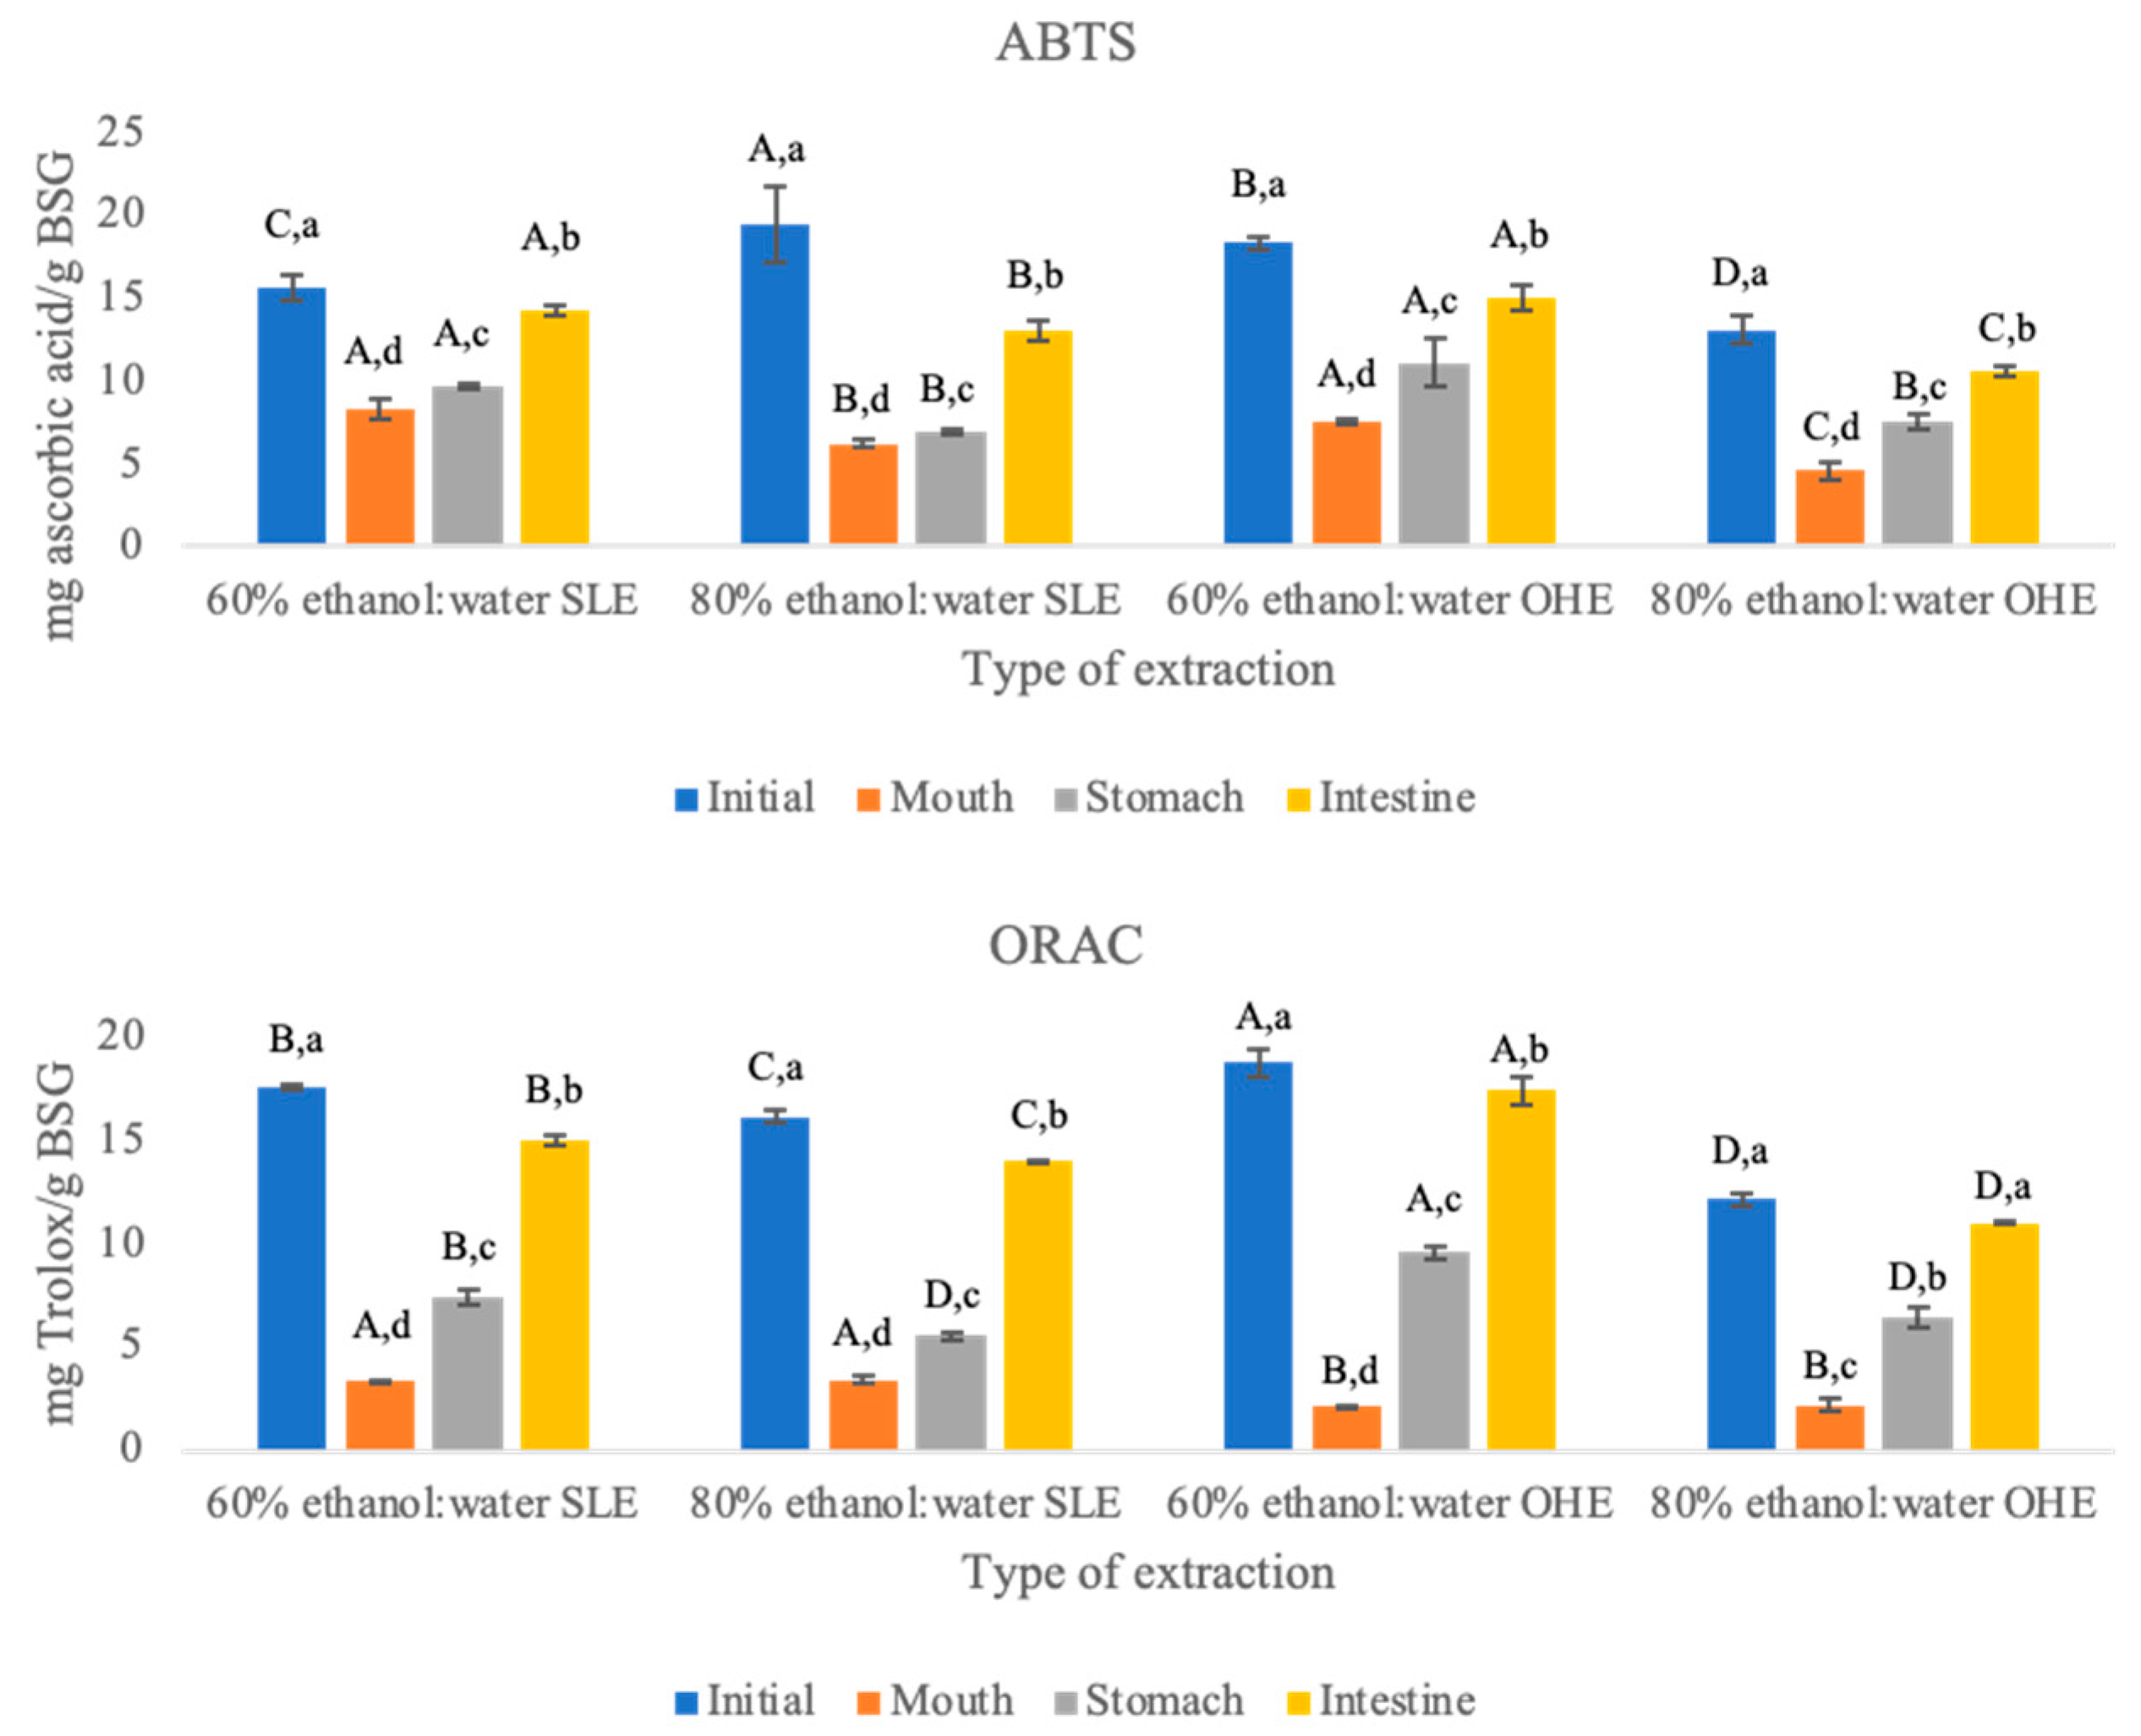
ABTS and ORAC
3.3. Prebiotic Activity
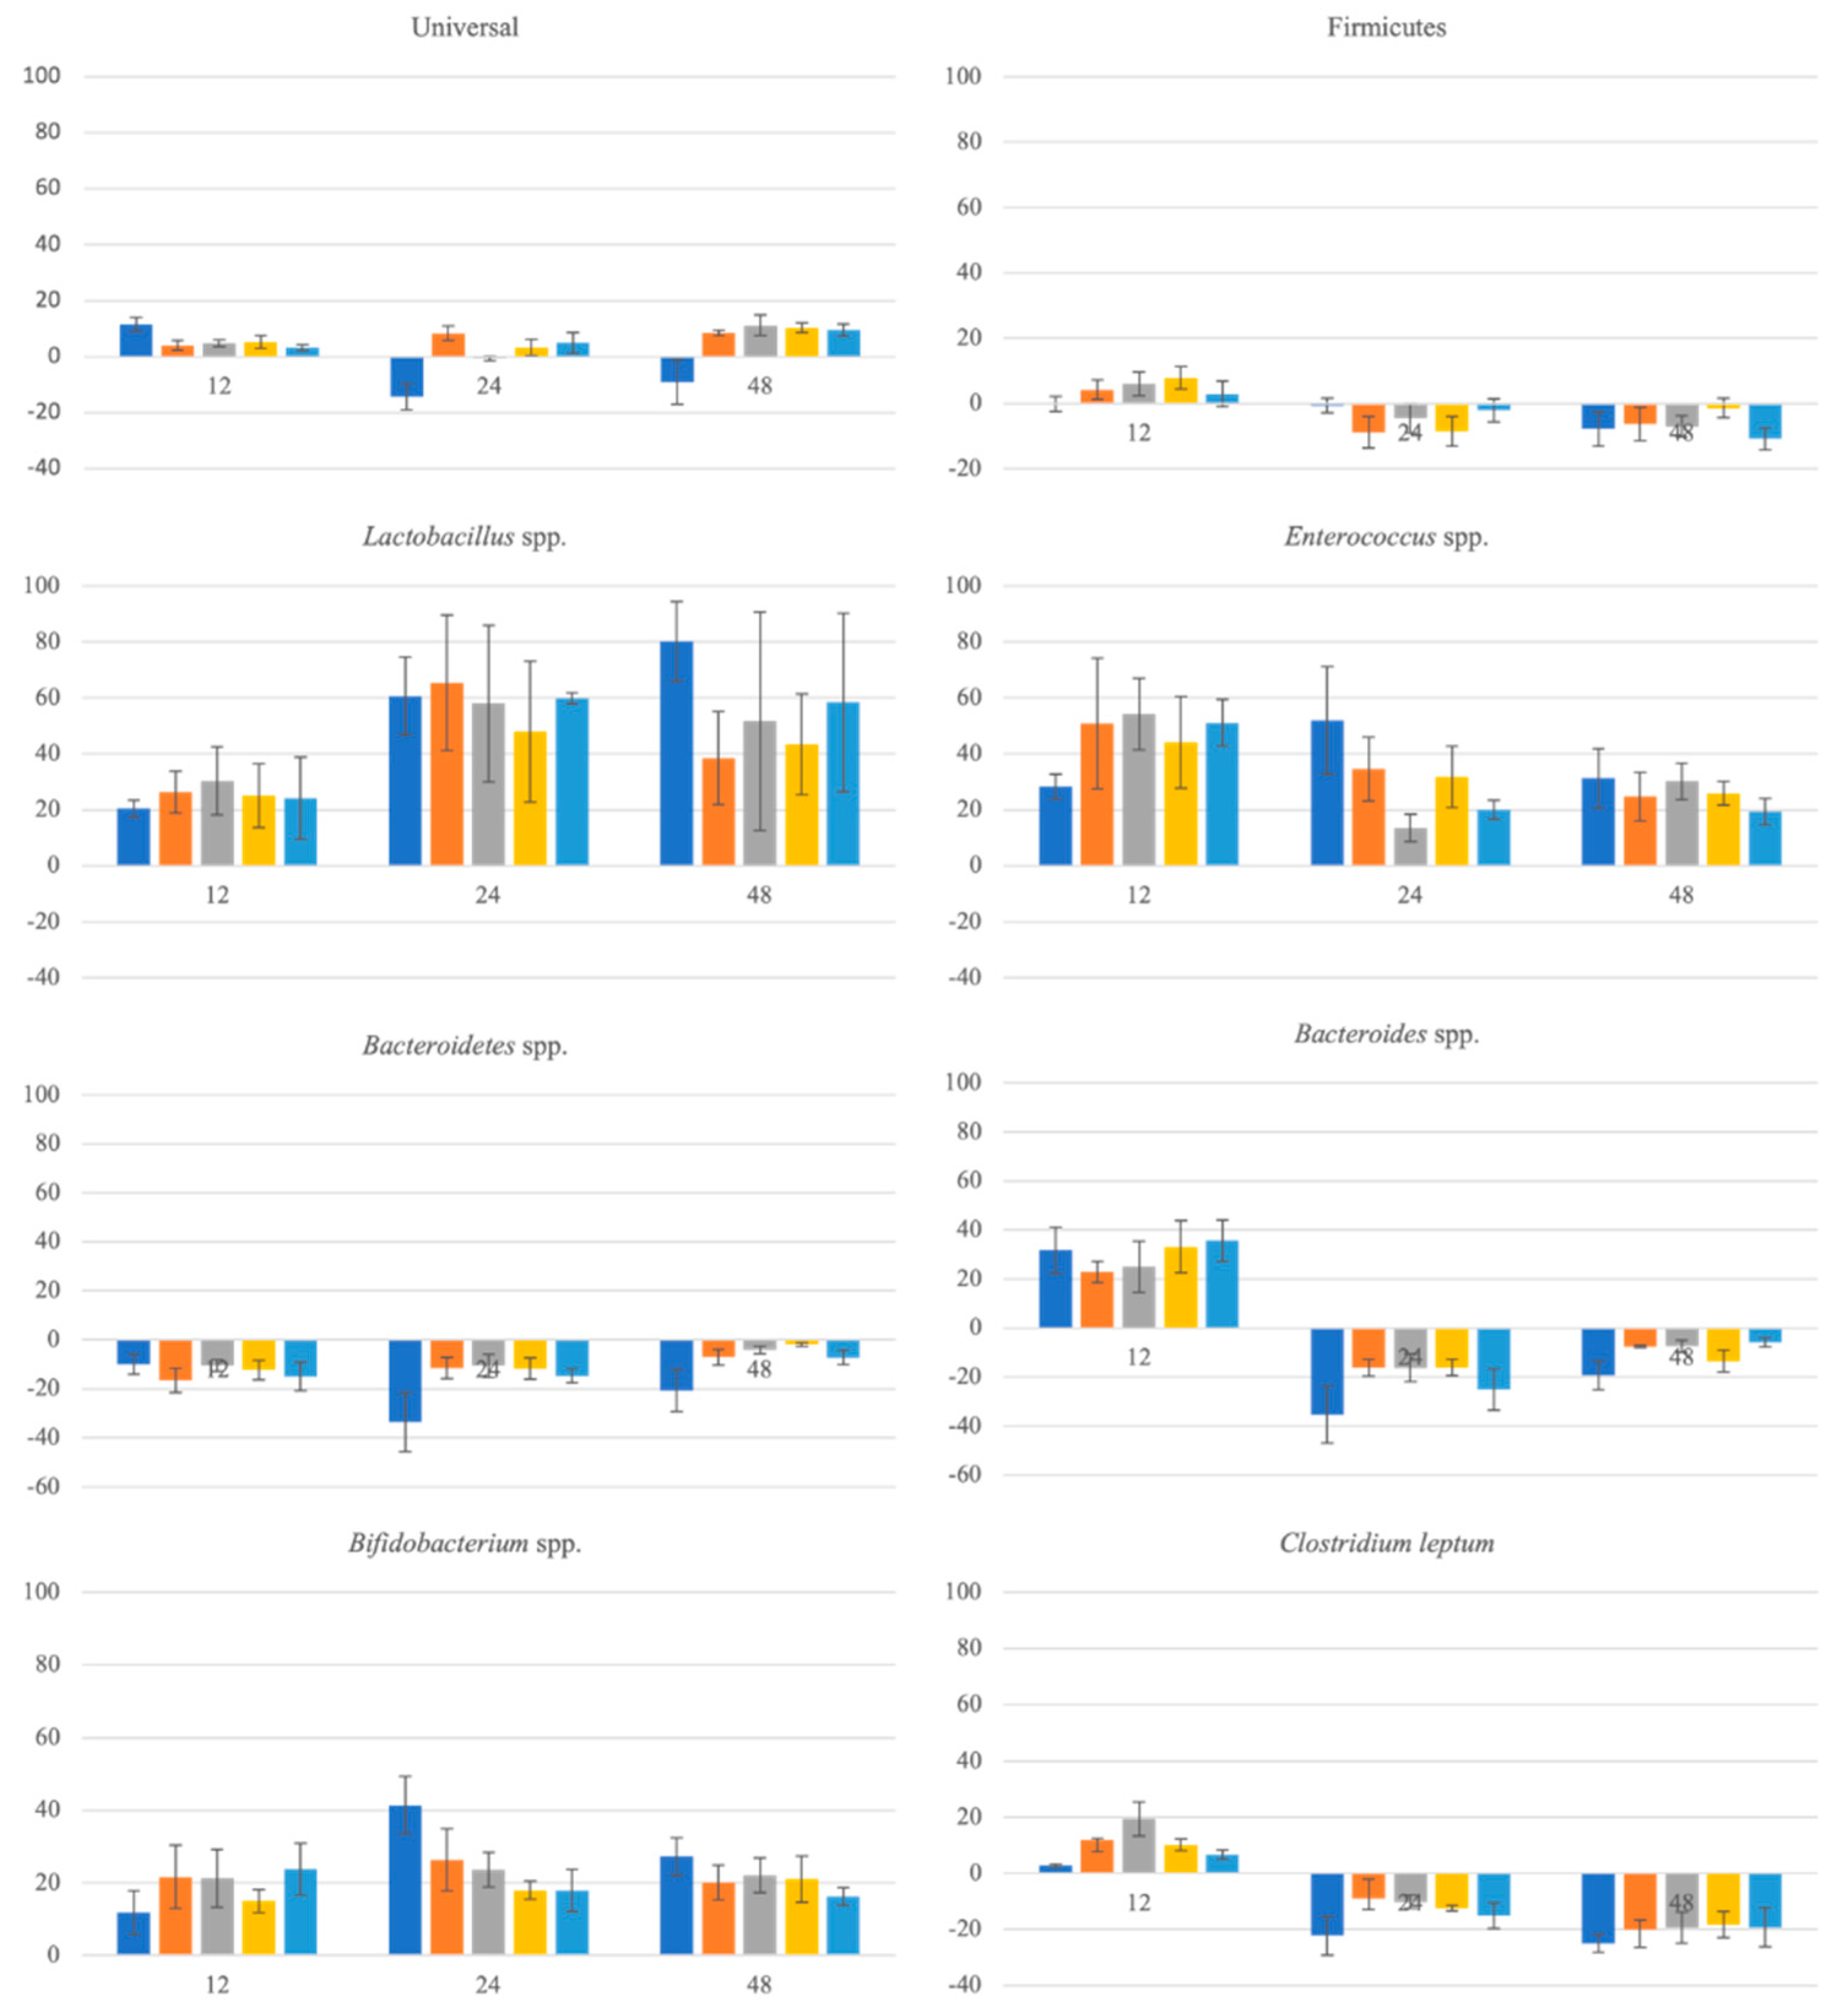
3.4. Evolution of the Gut Microbiota Profile Groups
3.5. Organic Acids and Sugar Profiles during Gut Microbiota Fermentation
3.6. Polyphenols Profile during Gut Microbiota Fermentation
4. Conclusions
Author Contributions
Funding
Institutional Review Board Statement
Informed Consent Statement
Data Availability Statement
Acknowledgments
Conflicts of Interest
References
- Mussatto, S.I.; Dragone, G.; Roberto, I.C. Brewers’ spent grain: Generation, characteristics and potential applications. J. Cereal Sci. 2006, 43, 1–14. [Google Scholar] [CrossRef]
- Bonifácio-Lopes, T.; Teixeira, J.A.; Pintado, M. Current extraction techniques towards bioactive compounds from brewer’s spent grain––A review. Crit. Rev. Food Sci. Nutr. 2019, 60, 2730–2741. [Google Scholar] [CrossRef] [PubMed]
- Bonifácio-Lopes, T.; Boas, A.A.V.; Coscueta, E.R.; Costa, E.M.; Silva, S.; Campos, D.; Teixeira, J.A.; Pintado, M. Bioactive extracts from brewer’s spent grain. Food Funct. 2020, 11, 8963–8977. [Google Scholar] [CrossRef]
- Steiner, J.; Procopio, S.; Becker, T. Brewer’s spent grain: Source of value-added polysaccharides for the food industry in reference to the health claims. Eur. Food Res. Technol. 2015, 241, 303–315. [Google Scholar] [CrossRef]
- Vieira, E.; Rocha, M.A.M.; Coelho, E.; Pinho, O.; Saraiva, J.A.; Ferreira, I.M.; Coimbra, M.A. Valuation of brewer’s spent grain using a fully recyclable integrated process for extraction of proteins and arabinoxylans. Ind. Crop. Prod. 2013, 52, 136–143. [Google Scholar] [CrossRef]
- Carvalheiro, F.; Garrote, G.; Parajó, J.C.; Pereira, H.; Gírio, F.M. Kinetic Modeling of Breweryapos;s Spent Grain Autohydrolysis. Biotechnol. Prog. 2008, 21, 233–243. [Google Scholar] [CrossRef] [PubMed]
- Meneses, N.G.T.; Sampaio, A.R.M.; Teixeira, J.A.; Mussatto, S.I. Extraction of aroma compounds by autohydrolysis of brewers ’ spent grains. In Proceedings of the 11th International Chemical and Biological Engineering Conference, Lisbon, Portugal, 11 September 2011; pp. 370–371. [Google Scholar]
- Ruiz, H.A.; Rodríguez-Jasso, R.M.; Fernandes, B.D.; Vicente, A.A.; Teixeira, J.A. Hydrothermal processing, as an alternative for upgrading agriculture residues and marine biomass according to the biorefinery concept: A review. Renew. Sustain. Energy Rev. 2013, 21, 35–51. [Google Scholar] [CrossRef] [Green Version]
- Pereira, R.N.; Teixeira, J.A.; Vicente, A.A. Exploring the Denaturation of Whey Proteins upon Application of Moderate Electric Fields: A Kinetic and Thermodynamic Study. J. Agric. Food Chem. 2011, 59, 11589–11597. [Google Scholar] [CrossRef] [Green Version]
- Jesus, M.S.; Ballesteros, L.F.; Pereira, R.N.; Genisheva, Z.; Carvalho, A.C.; Pereira-Wilson, C.; Teixeira, J.A.; Domingues, L. Ohmic heating polyphenolic extracts from vine pruning residue with enhanced biological activity. Food Chem. 2020, 316, 126298. [Google Scholar] [CrossRef] [PubMed] [Green Version]
- Coelho, M.; Pereira, R.; Rodrigues, A.S.; Teixeira, J.A.; Pintado, M.E. Extraction of tomato by-products’ bioactive compounds using ohmic technology. Food Bioprod. Process. 2019, 117, 329–359. [Google Scholar] [CrossRef] [Green Version]
- Galanakis, C.M. Index. In Polyphenols: Properties, Recovery, and Applications, 1st ed.; Ball, M.R., Ed.; Elsevier: Amsterdam, The Netherlands, 2018; pp. 429–438. [Google Scholar] [CrossRef]
- Kaur, N.; Singh, A.K. Ohmic Heating: Concept and Applications—A Review. Crit Rev. Food Sci Nutr. 2016, 56, 2338–2351. [Google Scholar] [CrossRef] [PubMed]
- Kumar, T. A Review on Ohmic Heating Technology: Principle, Applications and Scope. Int. J. Agric. Environ. Biotechnol. 2018, 11, 679–687. [Google Scholar] [CrossRef]
- Campos, D.A.; Coscueta, E.R.; Vilas-Boas, A.A.; Silva, S.; Teixeira, J.A.; Pastrana, L.M.; Pintado, M.M. Impact of functional flours from pineapple by-products on human intestinal microbiota. J. Funct. Foods 2020, 67, 103830. [Google Scholar] [CrossRef]
- Ribeiro, T.B.; Oliveira, A.; Campos, D.; Nunes, J.; Vicente, A.A.; Pintado, M. Simulated digestion of an olive pomace water-soluble ingredient: Relationship between the bioaccessibility of compounds and their potential health benefits. Food Funct. 2020, 11, 2238–2254. [Google Scholar] [CrossRef] [PubMed]
- Minekus, M.; Alminger, M.; Alvito, P.; Ballance, S.; Bohn, T.; Bourlieu, C.; Carrière, F.; Boutrou, R.; Corredig, M.; Dupont, D.; et al. A standardised static in vitro digestion method suitable for food––an international consensus. Food Funct. 2014, 5, 1113–1124. [Google Scholar] [CrossRef] [PubMed] [Green Version]
- Ribeiro, T.B.; Campos, D.; Oliveira, A.; Nunes, J.; Vicente, A.A.; Pintado, M. Study of olive pomace antioxidant dietary fibre powder throughout gastrointestinal tract as multisource of phenolics, fatty acids and dietary fibre. Food Res. Int. 2020, 142, 110032. [Google Scholar] [CrossRef] [PubMed]
- Reis, S.F.; Gullón, B.; Gullón, P.; Ferreira, S.; Maia, C.J.; Alonso, J.L.; Domingues, F.; Abu-Ghannam, N.; Reis, S.F.; Gullón, B.; et al. Evaluation of the prebiotic potential of arabinoxylans from brewer’s spent grain. Appl. Microbiol. Biotechnol. 2014, 98, 9365–9373. [Google Scholar] [CrossRef] [PubMed]
- Gibson, G.R.; Hutkins, R.; Sanders, M.E.; Prescott, S.L.; Reimer, R.A.; Salminen, S.J.; Scott, K.; Stanton, C.; Swanson, K.S.; Cani, P.D.; et al. Expert consensus document: The International Scientific Association for Probiotics and Prebiotics (ISAPP) consensus statement on the definition and scope of prebiotics. Nat. Rev. Gastroenterol. Hepatol. 2017, 14, 491–502. [Google Scholar] [CrossRef] [Green Version]
- Ribeiro, T.; Costa, C.M.; Lopes, T.B.; Silva, S.; Veiga, M.; Monforte, A.R.; Nunes, J.; Vicente, A.A.; Pintado, M. Prebiotic effects of olive pomace powders in the gut: In vitro evaluation of the inhibition of adhesion of pathogens, prebiotic and antioxidant effects. Food Hydrocoll. 2020, 112, 106312. [Google Scholar] [CrossRef]
- Le Bourvellec, C.; Renard, C. Interactions between Polyphenols and Macromolecules: Quantification Methods and Mechanisms. Crit. Rev. Food Sci. Nutr. 2012, 52, 213–248. [Google Scholar] [CrossRef]
- Jakobek, L.; Matić, P. Non-covalent dietary fiber––Polyphenol interactions and their influence on polyphenol bioaccessibility. Trends Food Sci. Technol. 2018, 83, 235–247. [Google Scholar] [CrossRef]
- Bonifácio-Lopes, T.; Vilas-Boas, A.; Machado, M.; Costa, E.M.; Silva, S.; Pereira, R.N.; Campos, D.; Teixeira, J.A.; Pintado, M. Exploring the bioactive potential of brewers spent grain ohmic extracts. Innov. Food Sci. Emerg. Technol. 2022, 76, 102943. [Google Scholar] [CrossRef]
- Gião, M.S.; González-Sanjosé, M.L.; Rivero-Pérez, M.D.; Pereira, C.I.; Pintado, M.E.; Malcata, F.X. Infusions of Portuguese medicinal plants: Dependence of final antioxidant capacity and phenol contente on extraction features. J. Sci Food Agric. 2007, 87, 2638–2647. [Google Scholar] [CrossRef] [PubMed]
- Vilas-Boas, A.A.; Oliveira, A.; Jesus, D.; Rodrigues, C.; Figueira, C.; Gomes, A.; Pintado, M. Chlorogenic acids composition and the impact of in vitro gastrointestinal digestion on espresso coffee from single-dose capsule. Food Res. Int. 2020, 134, 109223. [Google Scholar] [CrossRef] [PubMed]
- Contreras, M.d.M.; Hernández-Ledesma, B.; Amigo, L.; Martín-Álvarez, P.J.; Recio, I. Production of antioxidant hydrolyzates from a whey protein concentrate with thermolysin: Optimization by response surface methodology. LWT-Food Sci. Technol. 2011, 44, 9–15. [Google Scholar] [CrossRef]
- Gao, X.; Ohlander, M.; Jeppsson, N.; Björk, L.; Trajkovski, V. Changes in antioxidant effects and their relationship to phytonutrients in fruits of sea buckthorn (Hippophae rhamnoides L.) during maturation. J. Agric. Food Chem 2000, 48, 1485–1490. [Google Scholar] [CrossRef] [PubMed]
- Madureira, A.R.; Campos, D.; Gullon, B.; Marques, C.; Rodríguez-Alcalá, L.M.; Calhau, C.; Alonso, J.S.; Sarmento, B.; Gomez, A.M.; Pintado, M. Fermentation of bioactive solid lipid nanoparticules by human gut microflora. Food Funct. 2016, 7, 516–529. [Google Scholar] [CrossRef]
- Chan, K.W.; Khong, N.M.H.; Iqbal, S.; Ismail, M. Simulated gastrointestinal pH condition improves antioxidant properties of wheat and rice flours. Int. J. Mol. Sci. 2012, 13, 7496–7509. [Google Scholar] [CrossRef] [Green Version]
- Fardet, A.; Rock, E.; Rémésy, C. Is the in vitro antioxidant potential of whole-grain cereals and cereal products well reflected in vivo? J. Cereal Sci. 2008, 48, 258–276. [Google Scholar] [CrossRef]
- Liyana-Pathirana, C.M.; Shahidi, F. Antioxidant Activity of Commercial Soft and Hard Wheat (Triticum aestivum L.) as Affected by Gastric pH Conditions. J. Agric. Food Chem. 2005, 53, 2433–2440. [Google Scholar] [CrossRef]
- Nagah, A.M.; Seal, C.J. In vitro procedure to predict apparent antioxidant release from wholegrain foods measured using three different analytical methods. J. Sci. Food Agric. 2005, 85, 1177–1185. [Google Scholar] [CrossRef]
- Pérez-Jiménez, J.; Saura-Calixto, F. Literature Data May Underestimate the Actual Antioxidant Capacity of Cereals. J. Agric. Food Chem. 2005, 53, 5036–5040. [Google Scholar] [CrossRef] [PubMed] [Green Version]
- Gouw, V.P.; Jung, J.; Zhao, Y. Functional properties, bioactive compounds, and in vitro gastrointestinal digestion study of dried fruit pomace powders as functional food ingredients. LWT Food Sci. Technol. 2017, 80, 136–144. [Google Scholar] [CrossRef]
- Ikram, S.; Huang, L.; Zhang, H.; Wang, J.; Yin, M. Composition and Nutrient Value Proposition of Brewers Spent Grain. J. Food Sci. 2017, 82, 2232–2242. [Google Scholar] [CrossRef] [PubMed] [Green Version]
- Ktenioudaki, A.; Alvarez-Jubete, L.; Smyth, T.J.; Kilcawley, K.; Rai, D.K.; Gallagher, E. Application of bioprocessing techniques (sourdough fermentation and technological aids) for brewer’s spent grain breads. Food Res. Int. 2015, 73, 107–116. [Google Scholar] [CrossRef]
- Mussatto, S.; Dragone, G.; Roberto, I. Ferulic and p-coumaric acids extraction by alkaline hydrolysis of brewer’s spent grain. Ind. Crop. Prod. 2007, 25, 231–237. [Google Scholar] [CrossRef]
- Blancas-Benitez, F.J.; Mercado-Mercado, G.; Quirós-Sauceda, A.E.; Montalvo-González, E.; González-Aguilar, G.A.; Sáyago-Ayerdi, S.G. Bioaccessibility of polyphenols associated with dietary fiber and in vitro kinetics release of polyphenols in Mexican ‘Ataulfo’ mango (Mangifera indica L.) by-products. Food Funct. 2015, 6, 859–868. [Google Scholar] [CrossRef]
- Gorinstein, S.; Poovarodom, S.; Leontowicz, H.; Leontowicz, M.; Namiesnik, J.; Vearasilp, S.; Haruenkit, R.; Ruamsuke, P.; Katrich, E.; Tashma, Z. Antioxidant properties and bioactive constituents of some rare exotic Thai fruits and comparison with conventional fruits. Food Res. Int. 2011, 44, 2222–2232. [Google Scholar] [CrossRef]
- Bermúdez-Soto, M.J.; Tomas-Barberan, F.-A.; García-Conesa, M.T. Stability of polyphenols in chokeberry (Aronia melanocarpa) subjected to in vitro gastric and pancreatic digestion. Food Chem. 2007, 102, 865–874. [Google Scholar] [CrossRef]
- Celep, E.; Charehsaz, M.; Akyüz, S.; Acar, E.T.; Yesilada, E. Effect of in vitro gastrointestinal digestion on the bioavailability of phenolic components and the antioxidant potentials of some Turkish fruit wines. Food Res. Int. 2015, 78, 209–215. [Google Scholar] [CrossRef]
- Chiang, Y.C.; Chen, C.L.; Jeng, T.L.; Lin, T.C.; Sung, J.M. Bioavailability of cranberry bean hydroalcoholic extract and its inhibitory effect against starch hydrolysis following in vitro gastrointestinal digestion. Food Res. Int. 2014, 64, 939–945. [Google Scholar] [CrossRef] [PubMed]
- Siracusa, L.; Kulisic-Bilusic, T.; Politeo, O.; Krause, I.; Dejanovic, B.; Ruberto, G. Phenolic Composition and Antioxidant Activity of Aqueous Infusions from Capparis spinosa L. and Crithmum maritimum L. before and after Submission to a Two-Step in Vitro Digestion Model. J. Agric. Food Chem. 2011, 59, 12453–12459. [Google Scholar] [CrossRef] [PubMed]
- Gayoso, L.; Claerbout, A.-S.; Calvo, M.I.; Cavero, R.Y.; Astiasarán, I.; Ansorena, D. Bioaccessibility of rutin, caffeic acid and rosmarinic acid: Influence of the in vitro gastrointestinal digestion models. J. Funct. Foods 2016, 26, 428–438. [Google Scholar] [CrossRef]
- Gil-Izquierdo, A.; Zafrilla, P.; Tomas-Barberan, F.A. An in vitro method to simulate phenolic compound release from the food matrix in the gastrointestinal tract. Eur. Food Res. Technol. 2002, 214, 155–159. [Google Scholar] [CrossRef]
- Kamiloglu, S.; Capanoglu, E.; Bilen, F.D.; Gonzales, G.B.; Grootaert, C.; Van de Wiele, T.; Van Camp, J. Bioaccessibility of Polyphenols from Plant-Processing Byproducts of Black Carrot (Daucus carota L.). J. Agric. Food Chem. 2015, 64, 2450–2458. [Google Scholar] [CrossRef]
- Tagliazucchi, D.; Verzelloni, E.; Bertolini, D.; Conte, A. In vitro bio-accessibility and antioxidant activity of grape polyphenols. Food Chem. 2010, 120, 599–606. [Google Scholar] [CrossRef]
- Galanakis, C.M. Polyphenols: Properties, Recovery and Applications, 1st ed.; Ball, M.R., Ed.; Elsevier: Amsterdam, The Netherlands, 2018; 456p. [Google Scholar]
- Xia, X.; Xing, Y.; Kan, J. Antioxidant activity of Qingke (highland hull-less barley) after extraction/hydrolysis and in vitro simulated digestion. J. Food Process. Preserv. 2020, 44, 1–8. [Google Scholar] [CrossRef]
- Pineda-Vallido, C.; Nau, F.; Dubiard, C.G.; Cheynier, V.; Meudec, E.; Sanz-Buenhombre, M.; Guadarrama, A.; Tóth, T.; Csavjda, É.; Hingyi, H.; et al. In vitro digestion of dairy and egg products enriched with grape extracts: Effect of the food matrix on polyphenol bioaccesibility and antioxidant activity. Food Res Int. 2016, 88, 284–292. [Google Scholar] [CrossRef]
- Prior, R.L.; Hoang, H.A.; Gu, L.; Wu, X.; Bacchiocca, M.; Howard, L.; Hampsch-Woodill, M.; Huang, D.; Ou, B.; Jacob, R. Assays for hydrophilic and lipophilic antioxidant capacity (oxygen radical absorbance capacity (ORACFL)) of plasma and other biological and food samples. J. Agric. Food Chem. 2003, 53, 3273–3279. [Google Scholar] [CrossRef]
- Spigno, G.; Tramelli, L.; de Faveri, D.M. Effects of extraction time, temperature and solvent on concentration and antioxidant activity of grape marc phenolics. J. Food Eng. 2007, 81, 200–208. [Google Scholar] [CrossRef]
- Veličković, D.T.; Milenović, D.M.; Ristić, M.S.; Veljković, V.B. Ultrasonic extraction of waste solid residues from Salvia sp. essential oil hydrodistillation. Biochem Eng J. 2008, 4, 97–104. [Google Scholar] [CrossRef]
- Tarko, T.; Duda-Chodak, A.; Sroka, P.; Satora, P.; Michalik, J. Transformations of phenolic compounds in an in vitro model simulating the human alimentary tract. Food Technol Biotechnol. 2009, 47, 456–463. [Google Scholar]
- Carbonell-Capella, J.M.; Buniowska, M.; Esteve, M.J.; Frígola, A. Effect of Stevia rebaudiana addition on bioaccesibility of bioactive compounds and antioxidant activity of beverages based on exotic fruits mixed with oat following simulated human digestion. Food Chem. 2015, 184, 122–130. [Google Scholar] [CrossRef] [PubMed]
- Rodríguez-Roque, M.J.; Rojas-Graü, M.A.; Elez-Martínez, P.; Martín-Belloso, O. Soymill phenolic compounds, isoflavones and antioxidant activity as affected by in vitro gastrointestinal digestion. Food Chem. 2013, 136, 206–212. [Google Scholar] [CrossRef] [PubMed]
- Rodríguez-Roque, M.J.; Rojas-Graü, M.A.; Elez-Martínez, P.; Martín-Belloso, O. In vitro bioaccesibility of health-related compounds as affected by the formulation of fruit juice- and milk-based beverages. Food Res Int. 2014, 62, 771–778. [Google Scholar] [CrossRef]
- Oliveira, A.; Pintado, M. Stability of polyphenols and carotenoids in strawberry and peach yoghurt throughout in vitro gastrointestinal digestion. Food Funct. 2015, 6, 1611–1619. [Google Scholar] [CrossRef]
- Gómez, B.; Míguez, B.; Veiga, A.; Parajó, J.C.; Alonso, B.M. Production, Purification, and in Vitro Evaluation of the Prebiotic Potential of Arabinoxylooligosaccharides from Brewer’s Spent Grain. J. Agric. Food Chem. 2015, 63, 8429–8438. [Google Scholar] [CrossRef]
- Sajib, M.; Falck, P.; Sardari, R.R.; Mathew, S.; Grey, C.; Karlsson, E.N.; Adlercreutz, P. Valorization of Brewer’s spent grain to prebiotic oligosaccharide: Production, xylanase catalyzed hydrolysis, in-vitro evaluation with probiotic strains and in a batch human fecal fermentation model. J. Biotechnol. 2018, 268, 61–70. [Google Scholar] [CrossRef] [PubMed]
- Arena, M.P.; Caggianiello, G.; Fiocco, D.; Russo, P.; Torelli, M.; Spano, G.; Capozzi, V. Barley β-Glucans-Containing Food Enhances Probiotic Performances of Beneficial Bacteria. Int. J. Mol. Sci. 2014, 15, 3025–3039. [Google Scholar] [CrossRef] [PubMed] [Green Version]
- Charalampopoulos, D.; Pandiella, S.; Webb, C. Evaluation of the effect of malt, wheat and barley extracts on the viability of potentially probiotic lactic acid bacteria under acidic conditions. Int. J. Food Microbiol. 2003, 82, 133–141. [Google Scholar] [CrossRef]
- Abenavoli, L.; Scarpellini, E.; Colica, C.; Boccuto, L.; Salehi, B.; Sharifi-Rad, J.; Aiello, V.; Romano, B.; De Lorenzo, A.; Izzo, A.A.; et al. Gut Microbiota and Obesity: A Role for Probiotics. Nutrients 2019, 11, 2690. [Google Scholar] [CrossRef] [PubMed] [Green Version]
- Guarner, F.; Malagelada, J.-R. Gut flora in health and disease. Lancet 2003, 361, 512–519. [Google Scholar] [CrossRef]
- Allen, S.J.; Martinez, E.G.; Gregorio, G.V.; Dans, L.F. Probiotics for treating acute infectious diarrhoea. Cochrane Database Syst. Rev. 2010, 11, CD003048. [Google Scholar] [CrossRef]
- Dubin, K.; Pamer, E.G. Enterococci and Their Interactions with the Intestinal Microbiome. Microbiol. Spectr. 2017, 5, 1–19. [Google Scholar] [CrossRef] [PubMed] [Green Version]
- Gerritsen, J.; Smidt, H.; Rijkers, G.T.; de Vos, W.M. Intestinal microbiota in human health and disease: The impact of probiotics. Genes Nutr. 2011, 6, 209–240. [Google Scholar] [CrossRef] [PubMed] [Green Version]
- Wang, C.; Zhao, J.; Zhang, H.; Lee, Y.-K.; Zhai, Q.; Chen, W. Roles of intestinal bacteroides in human health and diseases. Crit. Rev. Food Sci. Nutr. 2020, 61, 3518–3536. [Google Scholar] [CrossRef] [PubMed]
- Cockburn, D.W.; Koropatkin, N.M. Polysaccharide Degradation by the Intestinal Microbiota and Its Influence on Human Health and Disease. J. Mol. Biol. 2016, 428, 3230–3252. [Google Scholar] [CrossRef]
- Koliada, A.; Syzenko, G.; Moseiko, V.; Budovska, L.; Puchkov, K.; Perederiy, V.; Gavalko, Y.; Dorofeyev, A.; Romanenko, M.; Tkach, S.; et al. Association between body mass index and Firmicutes/Bacteroidetes ration in adult Ukranian population. BMC Microbiol. 2017, 17, 4–9. [Google Scholar] [CrossRef] [Green Version]
- Larsen, N.; Vogensen, F.K.; van den Berg, F.W.J.; Nielsen, D.S.; Andreasen, A.S.; Pedersen, B.K.; Al-Soud, W.A.; Sørensen, S.J.; Hansen, L.H.; Jakobsen, M. Gut microbiota in human adults typw 2 diabetes differs from non-diabetic adults. PLoS ONE 2010, 5, e9085. [Google Scholar] [CrossRef]
- Niemi, P.; Aura, A.-M.; Maukonen, J.; Smeds, A.I.; Mattila, I.; Niemelä, K.; Tamminen, T.; Faulds, C.B.; Buchert, J.; Poutanen, K. Interactions of a Lignin-Rich Fraction from Brewer’s Spent Grain with Gut Microbiota in Vitro. J. Agric. Food Chem. 2013, 61, 6754–6762. [Google Scholar] [CrossRef]
- Belenguer, A.; Duncan, S.H.; Holtrop, G.; Anderson, S.E.; Lobley, G.E.; Flint, H.J. Impact of pH on Lactate Formation and Utilization by Human Fecal Microbial Communities. Appl. Environ. Microbiol. 2007, 73, 6526–6533. [Google Scholar] [CrossRef] [PubMed] [Green Version]
- Catarino, M.; Marçal, C.; Bonifácio-Lopes, T.; Campos, D.; Mateus, N.; Silva, A.; Pintado, M.; Cardoso, S. Impact of Phlorotannin Extracts from Fucus vesiculosus on Human Gut Microbiota. Mar. Drugs 2021, 19, 375. [Google Scholar] [CrossRef] [PubMed]
- Gullón, P.; Gullón, B.; Cobas, A.C.; Alonso, J.L.; Pintado, M.; Gomes, A.M. Effects of hemicellulose-derived saccharides on behavior of Lactobacilli under simulated gastrointestinal conditions. Food Res. Int. 2014, 64, 880–888. [Google Scholar] [CrossRef] [PubMed]
- Wong, J.M.W.; de Souza, R.; Kendall, C.W.C.; Emam, A.; Jenkins, D.J.A. Colonic Health: Fermentation and Short Chain Fatty Acids. J. Clin. Gastroenterol. 2006, 40, 235–243. [Google Scholar] [CrossRef] [PubMed]
- Chambers, E.S.; Preston, T.; Frost, G.; Morrison, D.J. Role of Gut Microbiota-Generated Short-Chain Fatty Acids in Metabolic and Cardiovascular Health. Curr. Nutr. Rep. 2018, 7, 198–206. [Google Scholar] [CrossRef] [PubMed] [Green Version]
- Parada Venegas, D.; De La Fuente, M.K.; Landskron, G.; González, M.J.; Quera, R.; Dijkstra, G.; Harmsen, H.J.M.; Faber, K.N.; Hermoso, M.A. Short Chain Fatty Acids (SCFAs)-Mediated Gut Epithelial and Immune Regulation and Its Relevance for Inflammatory Bowel Diseases. Front. Immunol. 2019, 10, 277. [Google Scholar] [CrossRef] [Green Version]
- Fernández-Veledo, S.; Vendrell, J. Gut microbiota-derived succinate: Friend or foe in human metabolic diseases? Rev. Endocr. Metab. Disord. 2019, 20, 439–447. [Google Scholar] [CrossRef] [PubMed] [Green Version]
- Hosseini, E.; Grootaert, C.; Verstraete, W.; Van De Wiele, T. Propionate as a health-promoting microbial metabolite in the human gut. Nutr. Rev. 2011, 69, 245–258. [Google Scholar] [CrossRef]
- Shahidi, F.; Yeo, J.-D. Insoluble-Bound Phenolics in Food. Molecules 2016, 21, 1216. [Google Scholar] [CrossRef]
- Quirós-Sauceda, A.E.; Palafox-Carlos, H.; Sáyago-Ayerdi, S.G.; Ayala-Zavala, J.F.; Bello-Perez, L.A.; Álvarez-Parrilla, E.; de la Rosa, L.A.; González-Córdova, A.F.; González-Aguilar, G.A. Dietary fiber and phenolic compounds as functional ingredients: Interaction and possible effect after ingestion. Food Funct. 2014, 5, 1063–1072. [Google Scholar] [CrossRef]
- Knasmüller, S.; DeMarini, D.M.; Johnson, I.T.; Gerhäuser, C. Antioxidants and Cancer: Fact and Fiction. In Chemoprevention of Cancer and DNA Damage by Dietary Factors; John Wiley & Sons, Ltd.: Hoboken, NJ, USA, 2009; pp. 153–162. [Google Scholar] [CrossRef]
- Saura-Calixto, F. Dietary Fiber as a Carrier of Dietary Antioxidants: An Essential Physiological Function. J. Agric. Food Chem. 2010, 59, 43–49. [Google Scholar] [CrossRef] [PubMed]
 80% ethanol:water SLE or OHE_1.5% (v/w); ● 80% ethanol:water SLE or OHE_1% (v/w).
80% ethanol:water SLE or OHE_1.5% (v/w); ● 80% ethanol:water SLE or OHE_1% (v/w).
80% ethanol:water SLE or OHE_1.5% (v/w); ● 80% ethanol:water SLE or OHE_1% (v/w).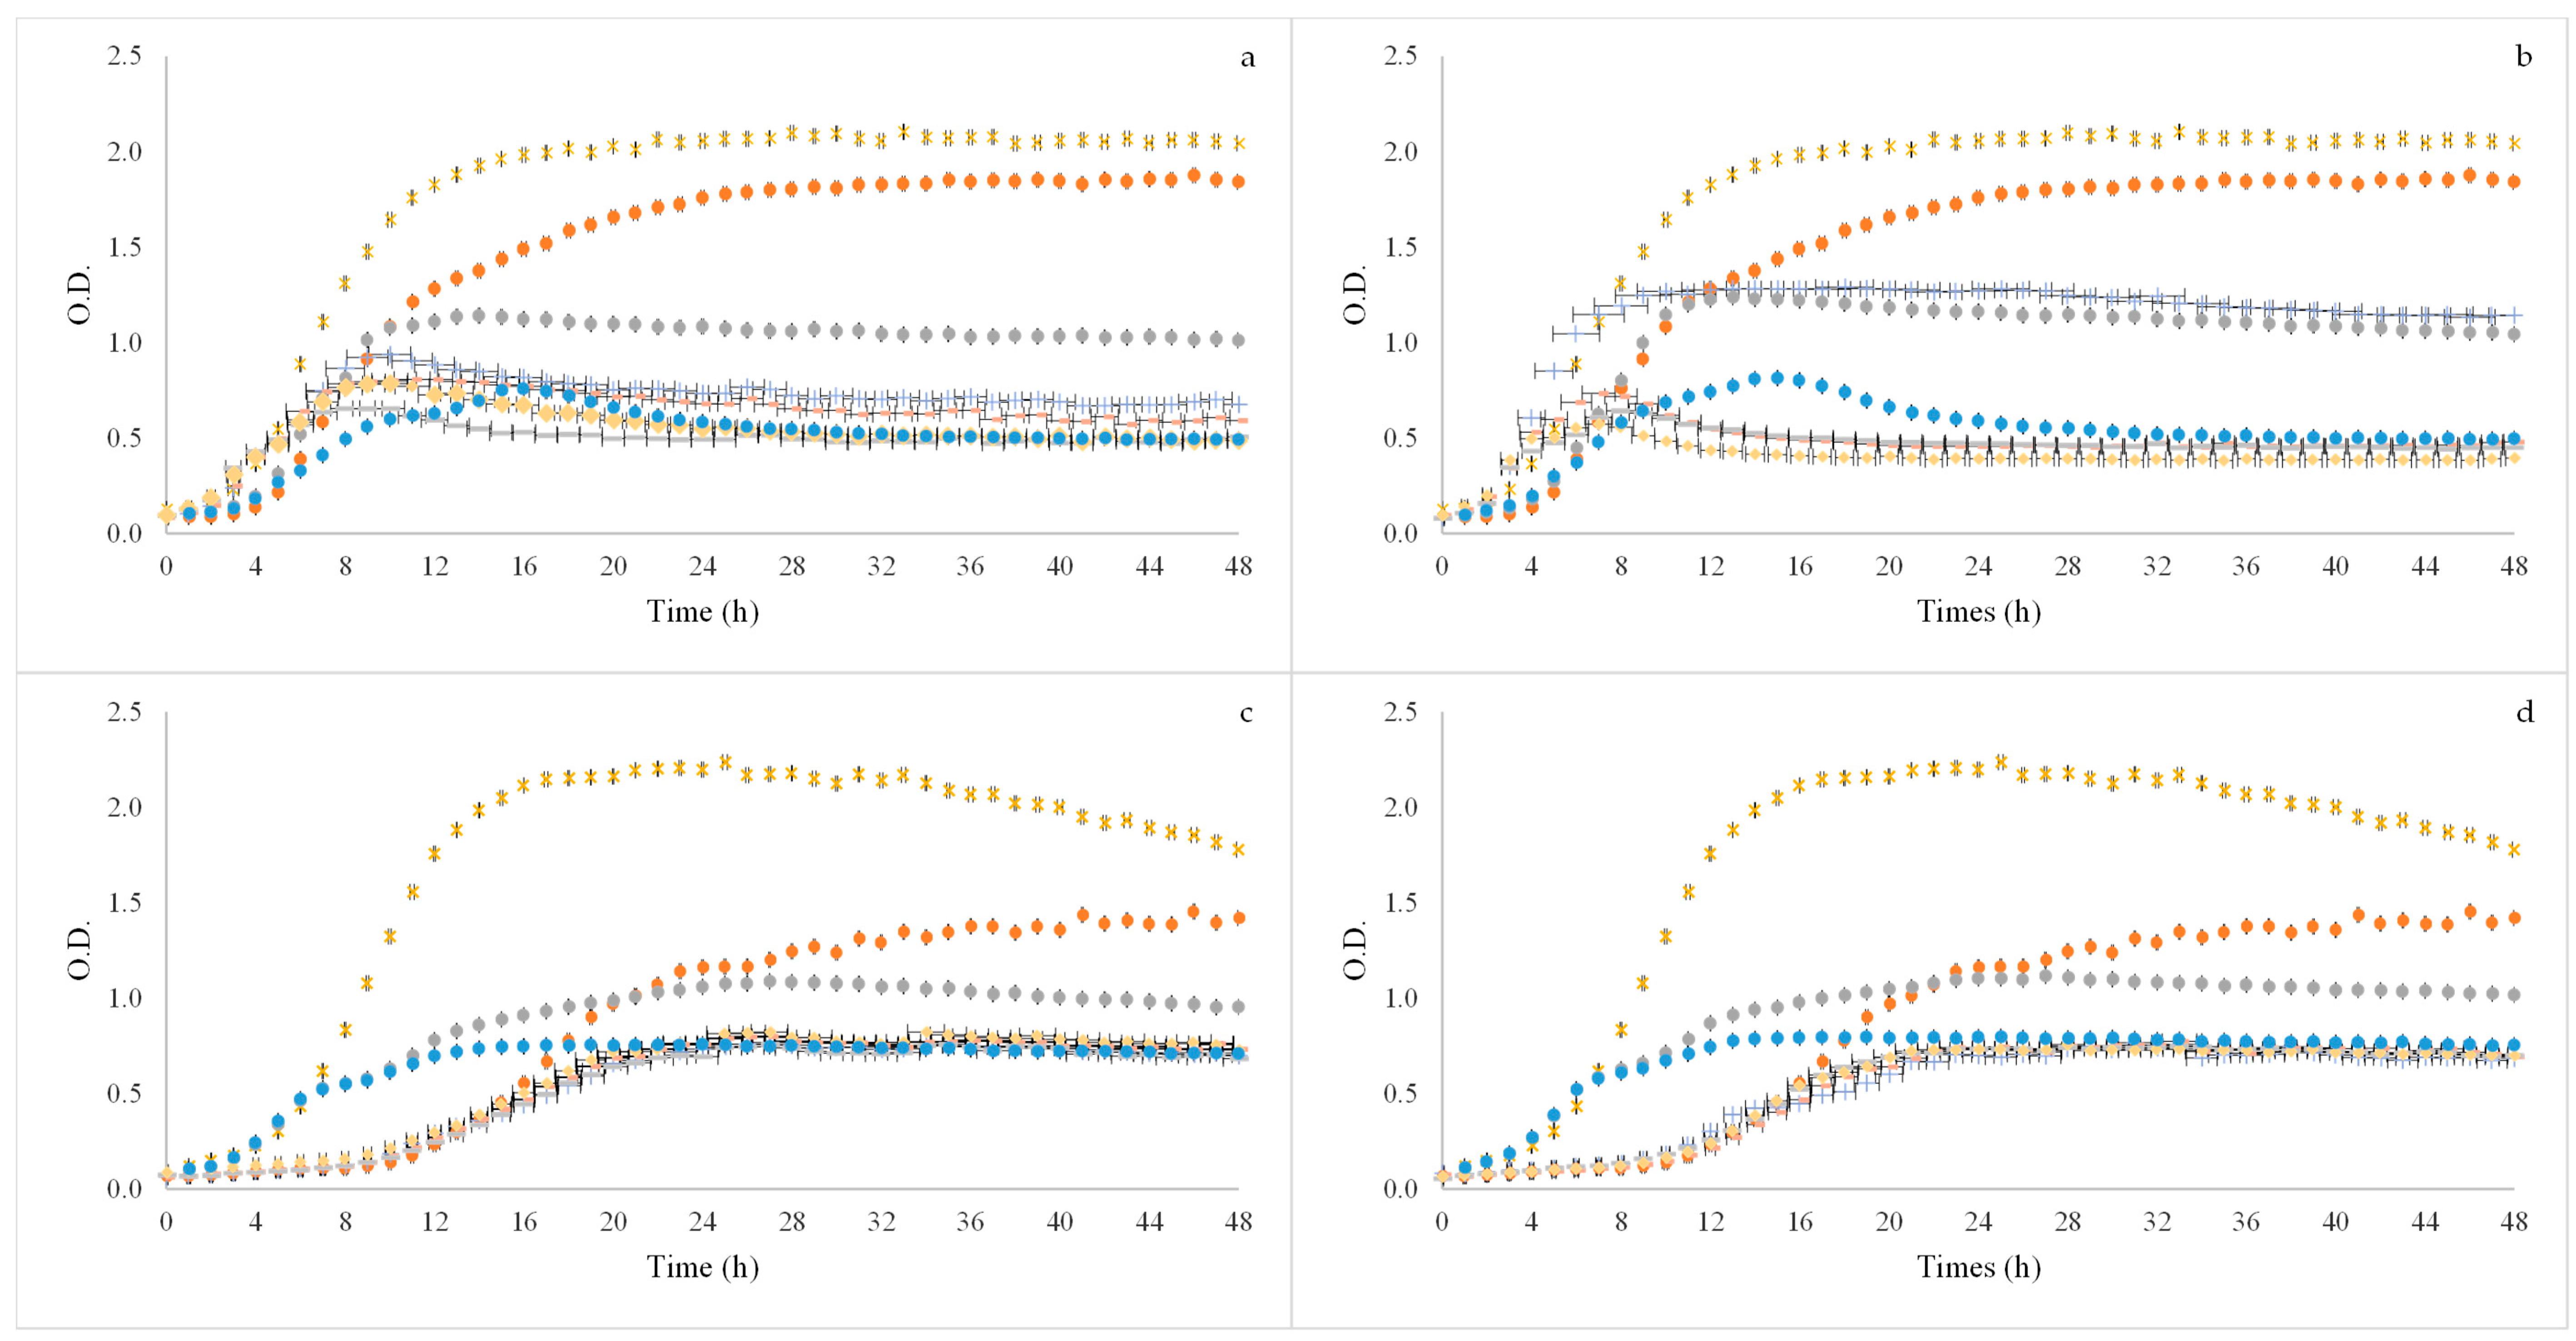 80% ethanol:water SLE or OHE_1.5% (v/w); ● 80% ethanol:water SLE or OHE_1% (v/w).
80% ethanol:water SLE or OHE_1.5% (v/w); ● 80% ethanol:water SLE or OHE_1% (v/w).
80% ethanol:water SLE or OHE_1.5% (v/w); ● 80% ethanol:water SLE or OHE_1% (v/w).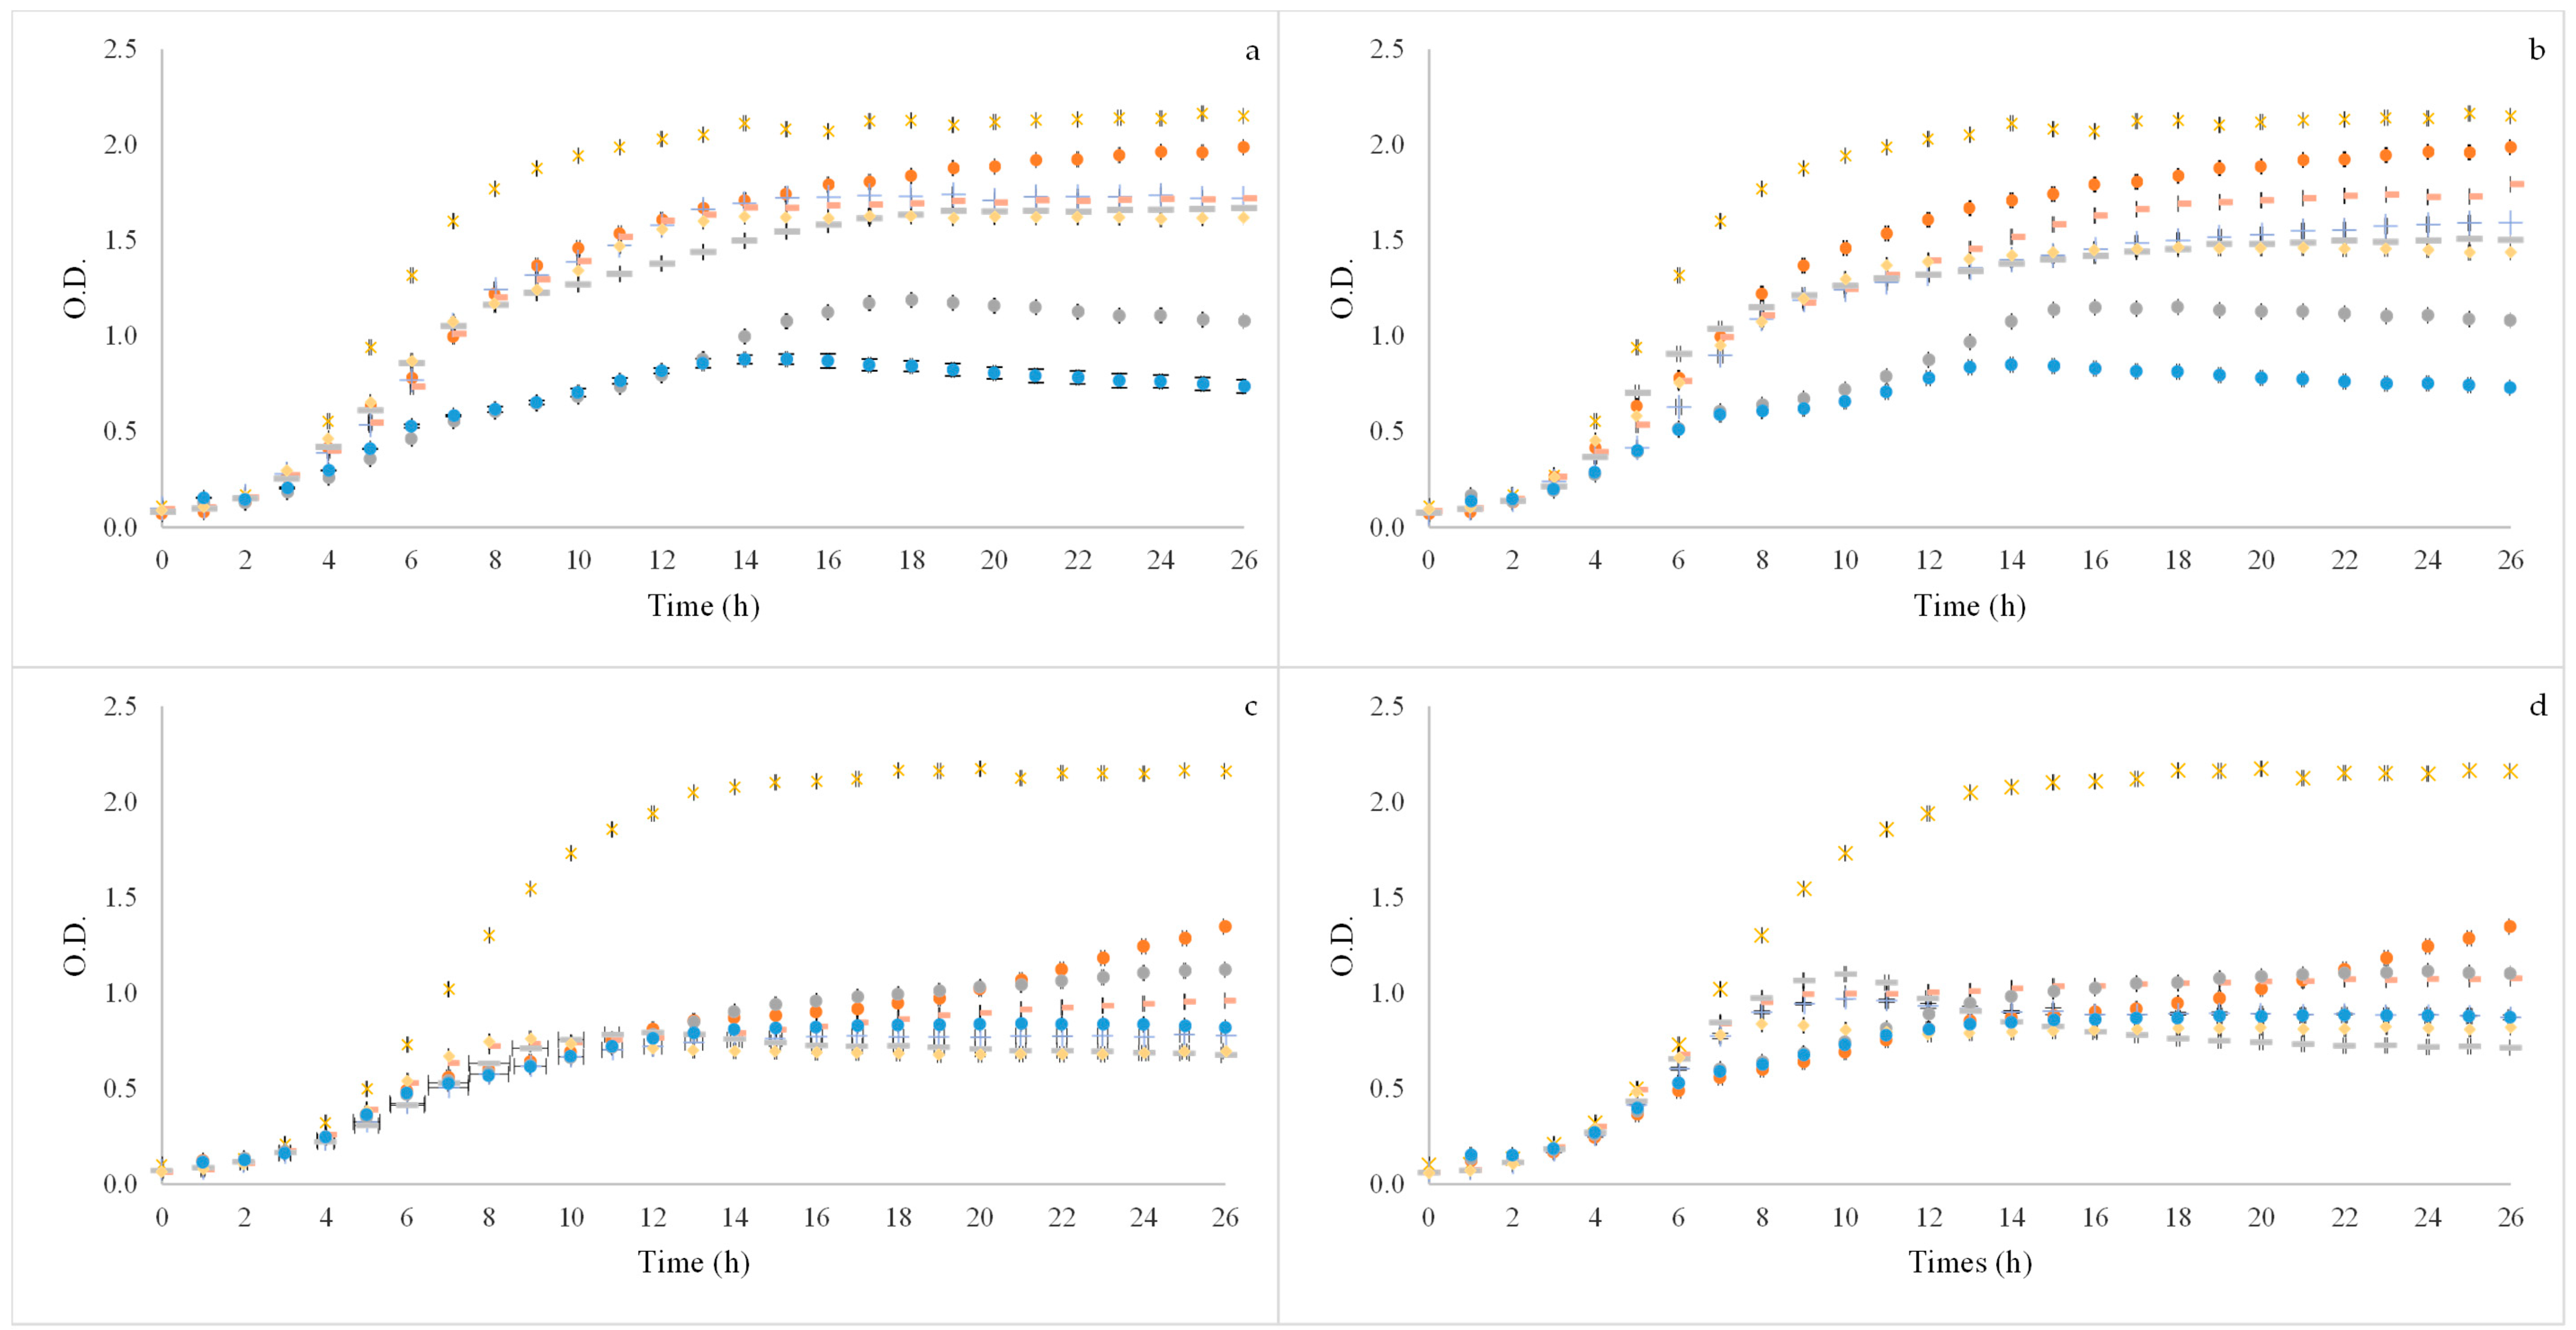


| Target Group | Maximum Growth Rate (µmax.h−1) | |||
|---|---|---|---|---|
| Primer Sequence (5′-3′) | Genomic DNA Standard | PCR Product Size (bp) | AT (°C) | |
| Universal | AAA CTC AAA GGA ATT GAC GG ACR RCA CGA GCT GAC | Bacteroides vulgatus ATCC 8482 (DSMZ 1447) | 180 | 45 |
| Firmicutes | ATG TGG TTT AAT TCG AAG CA AGC TGA CGA CAA CCA TGC AC | Lactobacillus gasseri ATCC 33,323 (DSMZ 20243) | 126 | 45 |
| Enterococcus spp. | CCC TTA TTG TTA GTT GCC ATC ATT ACT CGT TGT ACT TCC CT TGT | Enterococcus gilvus ATCC BAA-350 (DSMZ 15689) | 144 | 45 |
| Lacctobacillus spp. | GAG GCA GCA GTA GGG AAT CTT C GGC CAG TTA CTA CCT CTA TCC TTC TTC | Lactobacillus gasseri ATCC 33,323 (DSMZ 20243) | 126 | 55 |
| Bacteroidetes | CAT GTG GTT TAA TTC GAT GAT AGC TGA CGA CAA CCA TGC AG | Bacteroides vulgatus ATCC 8482 (DSMZ 1447) | 126 | 45 |
| Bacteroides spp. | ATA GCC TTT CGA AAG RAA GAT CCA GTA TCA ACT GCA ATT TTA | Bacteroides vulgatus ATCC 8482 (DSMZ 1447) | 495 | 45 |
| Bifidobacterium spp. | CGC GTC YGG TGT GAA AG CCC CAC ATC CAG CAT CCA | Bifidobacterium longum subsp. Infantis ATCC 15,697 (DSMZ 20088) | 244 | 50 |
| Clostridium leptum | GCA CAA GCA GTG GAG T CTT CCT CCG TTT TGT CAA | Clostridium leptum ATCC 29,065 (DSMZ 753) | 239 | 45 |
| Type of Extraction mg/100g BSG | Stage | Total Phenolic Compounds (mg Gallic Acid/g BSG) | Vanillic Acid | % B | Ferulic Acid | % B | p-Coumaric Acid | % B | 4-Hydroxybenzoic Acid | % B | Catechin | % B | Vanillin | % B |
|---|---|---|---|---|---|---|---|---|---|---|---|---|---|---|
| 60% ethanol:water (SLE) | Initial | 15.66 ± 2.08 A,a | 2.22 ± 0.00 A,a | - | 1.89 ± 0.06 D,a | - | 1.80 ± 0.05 B,a | - | 3.47 ± 0.08 A,a | - | 10.38 ± 0.14 A,a | - | 2.30 ± 0.01 B,a | |
| Mouth | 2.77 ± 0.07 A,d | N.D. | - | 0.66 ± 0.00 C,b | 35.00 | N.D. | - | 0.92 ± 0.00 b | 26.60 | 4.38 ± 0.10 B,b | 41.18 | N.D. | ||
| Stomach | 3.84 ± 0.16 C,c | N.D. | - | N.D. | - | N.D. | - | 0.06 ± 0.00 c | 1.86 | 3.68 ± 0.33 A,c | 35.50 | N.D. | ||
| Intestine | 7,20 ± 0.29 B,b | N.D. | - | N.D. | - | N.D. | - | N.D. | - | 0.81 ± 0.12 A,d | 7.80 | N.D. | - | |
| 80% ethanol:water (SLE) | Initial | 13.77 ± 0.39 A,a | 2.06 ± 0.20 AB,a | - | 1.75 ± 0.06 C,a | - | 3.08 ± 0.05 A,a | - | 3.39 ± 0.06 AB,a | - | 8.03 ± 0.70 B,a | - | 2.45 ± 0.03 A,a | |
| Mouth | 2.31 ± 0.00 B,d | N.D. | - | 0.97 ± 0.01 B,b | 55.45 | 0.28 ± 0.01 A,b | 9.09 | N.D. | - | 6.00 ± 0.34 A,b | 74.78 | N.D. | ||
| Stomach | 5.74 ± 0.03 A,c | N.D. | - | N.D. | - | N.D. | - | N.D. | - | 2.08 ± 0.00 B,c | 25.93 | N.D. | ||
| Intestine | 6.27 ± 0.45 D,b | N.D. | - | N.D. | - | N.D. | - | N.D. | - | 0.26 ± 0.01 C,d | 3.28 | N.D. | - | |
| 60% ethanol:water (OHE) | Initial | 10.91 ± 0.19 B,a | 1.85 ± 0.27 BC,a | - | 1.98 ± 0.02 B,a | - | 0.17 ± 0.02 D,b | - | 3.33 ± 0.00 B,a | - | 7.21 ± 0.51 B,a | - | 2.29 ± 0.00 B,a | |
| Mouth | 2.23 ± 0.07 AB,d | N.D. | - | 0.97 ± 0.24 AB,b | 48.86 | 0.28 ± 0.00 A,a | 170.64 | N.D. | - | 1.96 ± 0.02 C,b | 27.21 | 0.97 ± 0.00 A,d | 42.57 | |
| Stomach | 5.66 ± 0.09 A,c | N.D. | - | N.D. | - | N.D. | - | N.D. | - | 0.94 ± 0.01 C,c | 13.03 | 1.06 ± 0.00 B,c | 46.25 | |
| Intestine | 7.39 ± 0.03 C,b | N.D. | - | N.D. | - | N.D. | - | N.D. | - | 0.29 ± 0.01 B,d | 4.06 | 1.37 ± 0.00 B,b | 59.92 | |
| 80% ethanol:water (OHE) | Initial | 11.51 ± 0.59 B,a | 1.62 ± 0.02 C,a | - | 2.30 ± 0.30 A,a | - | 0.92 ± 0.08 C,a | - | 3.34 ± 0.01 B,a | - | 6.62 ± 0.04 C,a | - | 2.27 ± 0.01 C,a | |
| Mouth | 2.23 ± 0.03 B,d | N.D. | - | 1.08 ± 0.11 AB,b | 47.21 | 0.25 ± 0.01 B,b | 27.03 | N.D. | - | 4.26 ± 0.02 B,b | 64.37 | 0.97 ± 0.00 A,d | 42.81 | |
| Stomach | 4.16 ± 0.67 B,c | N.D. | - | 0.96 ± 0.15 A,b | 88.62 | 0.22 ± 0.00 A,b | 24.11 | N.D. | - | 2.06 ± 0.02 B,c | 31.13 | 1.61 ± 0.00 A,b | 71.15 | |
| Intestine | 8.36 ± 0.05 A,b | N.D. | - | N.D. | - | 0.05 ± 0.01 A,c | 5.41 | N.D. | - | 0.26 ± 0.01 C,d | 4.00 | 1.52 ± 0.00 A,c | 66.90 |
| Phases of the GID | Type of Extraction | ABTS (%) | ORAC (%) | Folin-Ciocalteu (%) |
|---|---|---|---|---|
| Initial/Oral | 60% ethanol:water SLE | 47.04 | 81.15 | 81.04 |
| 80% ethanol:water SLE | 67.95 | 79.03 | 83.80 | |
| 60% ethanol:water OHE | 58.70 | 88.65 | 79.60 | |
| 80% ethanol:water OHE | 64.97 | 81.90 | 80.63 | |
| Oral/Gastric | 60% ethanol:water SLE | −16.70 | −122.13 | −29.34 |
| 80% ethanol:water SLE | −11.50 | −63.12 | −157.46 | |
| 60% ethanol:water OHE | −46.58 | −348.47 | −154.47 | |
| 80% ethanol:water OHE | −63.46 | −193.37 | −86.58 | |
| Gastric/Duodenal | 60% ethanol:water SLE | −47.30 | −102.98 | −87.46 |
| 80% ethanol:water SLE | −87.38 | −153.09 | −9.12 | |
| 60% ethanol:water OHE | −35.95 | −81.97 | −30.53 | |
| 80% ethanol:water OHE | −40.97 | −70.94 | −101.01 |
| Division (Genus) | Number of Copies (n = 5) a |
|---|---|
| Universal | 7.55 ± 0.37 |
| Firmicutes | 4.76 ± 0.19 |
| Enterococcus spp. | 1.76 ± 0.82 |
| Lactobacillus spp. | 2.93± 0.93 |
| Bacteroidetes spp. | 5.05 ± 0.98 |
| Bacteroides spp. | 3.73 ± 0.42 |
| Bifidobacterium spp. | 4.24 ± 0.57 |
| Clostridium leptum | 4.97 ± 0.25 |
| F:B ratio | 0.98 ± 0.21 |
| Organic Acids/Sugars (w/v) | Time (h) | Ctrl | FOS | 60% Ethanol:Water (SLE) | 80% Ethanol:Water (SLE) | 60% Ethanol:Water (OHE) | 80% Ethanol:Water (OHE) |
|---|---|---|---|---|---|---|---|
| Succinic acid | 0 | 0.45 ± 0.26 A,b | 0.45 ± 0.26 A,b | 0.45 ± 0.26 A,c | 0.45 ± 0.26 A,c | 0.45 ± 0.26 A,c | 0.45 ± 0.26 A,c |
| 12 | 1.93 ± 1.18 A,a | 1.85 ± 0.92 A,a | 1.32 ± 0.07 A,b | 1.29 ± 0.10 A,b | 1.40 ± 0.07 A,a | 1.48 ± 0.29 A,b | |
| 24 | 1.18 ± 0.56 B,a | 1.87 ± 0.62 B,a | 1.97 ± 0.22 B,a | 2.04 ± 0.15 B,a | 1.77 ± 0.71 AB.a | 2.07 ± 0.09 B,a | |
| 48 | 0.74 ± 0.71 B,b | 2.03 ± 0.85 A,a | 1.27 ± 0.08 B,b | 1.19 ± 0.09 B,b | 1.18 ± 0.06 B,b | 1.20 ± 0.04 B,b | |
| Lactic acid | 0 | ND | ND | ND | ND | ND | ND |
| 12 | 1.21 ± 0.93 B,a | 4.04 ± 2.74 A,a | 0.23 ± 0.03 C,a | 0.25 ± 0.03 C,a | 0.28 ± 0.06 C,a | 0.30 ± 0.15 C,a | |
| 24 | 0.34 ± 0.14 B,b | 5.19 ± 1.40 A,a | 0.34 ± 0.04 B,a | 0.33 ± 0.06 B,a | 0.33 ± 0.09 B,a | 0.36 ± 0.14 B,a | |
| 48 | ND | 5.49 ± 2.14 A,a | 0.24 ± 0.06 B,a | 0.28 ± 0.11 B,a | 0.27 ± 0.04 B,a | 0.27 ± 0.06 B,a | |
| Acetic acid | 0 | 0.16 ± 0.04 A,b | 0.16 ± 0.04 A,b | 0.16 ± 0.04 A,c | 0.16 ± 0.04 A,c | 0.16 ± 0.04 A,b | 0.16 ± 0.04 A,c |
| 12 | 0.65 ± 0.27 B,a | 1.64 ± 0.65 A,a | 0.97 ± 0.15 B,b | 0.80 ± 0.12 B,b | 0.94 ± 0.12 B,ab | 0.96 ± 0.05 B,b | |
| 24 | 0.74 ± 0.23 C,a | 1.48 ± 0.59 A,a | 1.12 ± 0.10 AB,ab | 1.13 ± 0.14 AB,a | 1.10 ± 0.12 BC,ab | 1.12 ± 0.11 AB,ab | |
| 48 | 0.69 ± 0.25 B,a | 2.29 ± 1.26 A,a | 1.22 ± 0.08 B,a | 1.24 ± 0.08 B,a | 1.38 ± 0.20 B,a | 1.30 ± 0.14 B,a | |
| Propionic acid | 0 | 0.34 ± 0.09 A,c | 0.34 ± 0.09 A,b | 0.34 ± 0.09 A,c | 0.34 ± 0.09 A,b | 0.34 ± 0.09 A,c | 0.34 ± 0.09 A,c |
| 12 | 1.59 ± 0.32 A,a | 1.47 ± 0.60 A,a | 1.06 ± 0.36 A,b | 0.97 ± 0.61 A,a | 1.01 ± 0.13 A,b | 1.00 ± 0.41 A,b | |
| 24 | 0.81 ± 0.27 A,b | 1.95 ± 0.88 A,a | 1.31 ± 0.17 A,a | 1.24 ± 0.09 A,a | 1.26 ± 0.09 A,a | 1.38 ± 0.16 A,a | |
| 48 | 0.49 ± 0.18 C,c | 1.86 ± 0.79 A,a | 1.29 ± 0.14 AB,a | 1.23 ± 0.10 ABC,a | 1.25 ± 0.10 ABC,a | 1.22 ± 0.06 ABC,a | |
| Butyric acid | 0 | 1.41 ± 0.25 A,b | 1.41 ± 0.25A,b | 1.41 ± 0.25 A,b | 1.41 ± 0.25 A,a | 1.41 ± 0.25 A,b | 1.41 ± 0.25 A,b |
| 12 | 1.55 ± 0.63 A,ab | 2.29 ± 0.99 A,a | 1.63 ± 0.27 A,b | 1.48 ± 0.27 A,a | 1.51 ± 0.40 A,ab | 1.54 ± 0.27 A,b | |
| 24 | 2.24 ± 0.67 A,a | 2.23 ± 0.66 AB,a | 2.21 ± 0.36 AB,a | 1.99 ± 0.34 B,a | 1.85 ± 0.16 B,a | 1.87 ± 0.42 B,a | |
| 48 | 1.83 ± 0.94 A,a | 2.70 ± 1.43 AB,a | 2.07 ± 0.18 B,a | 1.97 ± 0.62 AB,a | 2.08 ± 0.60 AB,a | 2.01 ± 0.25 AB,a | |
| Total organic acids | 0 | 2.37 ± 0.64 | 2.37 ± 0.64 | 2.37 ± 0.64 | 2.37 ± 0.64 | 2.37 ± 0.64 | 2.37 ± 0.64 |
| 12 | 5.92 ± 3.34 | 11.29 ± 5.89 | 5.21 ± 0.78 | 4.79 ± 1.03 | 5.14 ± 0.72 | 5.18 ± 1.22 | |
| 24 | 5.31 ± 1.87 | 12.72 ± 4.35 | 6.95 ± 0.89 | 6.73 ± 0.79 | 6.32 ± 1.16 | 6.81 ± 0.91 | |
| 48 | 3.75 ± 2.08 | 14.32 ± 6.46 | 5.99 ± 0.61 | 5.82 ± 1.05 | 5.91 ± 0.98 | 5.75 ± 0.58 | |
| Saccharose | 0 | 1.02 ± 0.07 A,a | 1.02 ± 0.07 A,c | 1.02 ± 0.07 A,b | 1.02 ± 0.07 A,b | 1.02 ± 0.07 A,b | 1.02 ± 0.07 A,b |
| 12 | 0.19 ± 0.14 D,b | 1.04 ± 0.03 C,c | 1.67 ± 0.10 B,a | 1.55 ± 0.07 B,a | 1.51 ± 0.09 B,a | 1.53 ± 0.11 Ba, | |
| 24 | 0.07 ± 0.01 C,c | 1.51 ± 0.09 B,a | 1.61 ± 0.12 A,a | 1.53 ± 0.05 B,a | 1.61 ± 0.07 A,a | 1.58 ± 0.11 AB,a | |
| 48 | 0.05 ± 0.01 C,c | 1.28 ± 0.05 A,b | 1.09 ± 0.04 B,b | 1.06 ± 0.06 B,b | 1.07 ± 0.03 B,b | 1.13 ± 0.25 AB,b | |
| Glucose | 0 | 0.51 ± 0.09 A,a | 0.51 ± 0.09 A,c | 0.51 ± 0.09 A,a | 0.51 ± 0.09 A,a | 0.51 ± 0.09 A,a | 0.51 ± 0.09 A,a |
| 12 | 0.06 ± 0.00 C,b | 2.06 ± 0.88 A,b | 0.37 ± 0.04 B,b | 0.38 ± 0.04 B,b | 0.34 ± 0.02 B,b | 0.38 ± 0.03 B,c | |
| 24 | 0.06 ± 0.01 C,b | 2.51 ± 0.08 A,a | 0.49 ± 0.03 B,a | 0.45 ± 0.05 B,a | 0.47 ± 0.04 B,a | 0.43 ± 0.05 B,b | |
| 48 | 0.03 ± 0.01 D,c | 2.01 ± 0.09 A,b | 0.34 ± 0.06 B,b | 0.19 ± 0.05 C,c | 0.31 ± 0.07 BC,b | 0.17 ± 0.05 C,d |
| Type of Extraction (mg/100 g BSG) | Stage | Vanillic Acid | Ferulic Acid | 4-Hydroxybenzoic Acid | Catechin | p-Coumaric | Vanillin |
|---|---|---|---|---|---|---|---|
| 60% ethanol:water (SLE) | 0 | N.D. | N.D. | N.D. | N.D. | N.D. | N.D. |
| 12 | 1.36 ± 0.75 A,a | 3.01 ± 0.51 A,a | 1.98 ± 0.02 A,b | 21.07 ± 1.61 AB,a | N.D. | N.D. | |
| 24 | 1.03 ± 0.58 A,a | 1.03 ± 0.44 A,c | 6.14 ± 1.16 A,a | 17.57 ± 2.51 ab | N.D. | N.D. | |
| 48 | 0.82 ± 0.46 A,a | 2.28 ± 0.35 A,b | 0.82 ± 0.34 A,c | 12.31 ± 3.64 b | N.D. | N.D. | |
| 80% ethanol:water (SLE) | 0 | N.D. | N.D. | N.D. | N.D. | N.D. | N.D. |
| 12 | 1.50 ± 0.81 A,a | 2.43 ± 0.19 AB,a | 1.88 ± 0.26 A,b | 16.61 ± 2.80 B,a | N.D. | N.D. | |
| 24 | 1.20 ± 0.68 A,a | 0.93 ± 0.32 A,b | 6.01 ± 1.37 A,a | 19.93 ± 4.01 a | N.D. | N.D. | |
| 48 | 0.75 ± 0.41 A,a | 2.44 ± 0.28 A,a | 1.39 ± 1.17 A,b | 14.89 ± 4.97 a | N.D. | N.D. | |
| 60% ethanol:water (OHE) | 0 | N.D. | N.D. | N.D. | N.D. | N.D. | N.D. |
| 12 | 1.43 ± 0.78 A,a | 2.29 ± 0.22 AB,a | 1.80 ± 0.26 A,b | 23.72 ± 3.27 AB,a | N.D. | 1.72 ± 1.40 A,a | |
| 24 | 1.06 ± 0.61 A,a | 1.00 ± 0.45 A,b | 8.00 ± 1.27 A,a | 18.66 ± 2.27 ab | N.D. | 0.14 ± 0.08 A,b | |
| 48 | 0.91 ± 0.57 A,a | 2.17 ± 0.45 AB,a | 0.89 ± 0.37 A,b | 13.52 ± 4.90 b | N.D. | N.D. | |
| 80% ethanol:water (OHE) | 0 | N.D. | N.D. | N.D. | N.D. | N.D. | N.D. |
| 12 | 1.44 ± 0.77 A,a | 2.14 ± 0.21 B,a | 1.88 ± 0.54 A,b | 16.26 ± 5.39 B,a | 0.27 ± 0.13 A,a | 2.20 ± 0.78 A,a | |
| 24 | 1.03 ± 0.57 A,a | 1.07 ± 0.35 A,c | 7.68 ± 0.92 A,a | 22.01 ± 4.91 a | N.D. | 0.18 ± 0.07 A,b | |
| 48 | 0.91 ± 0.50 A,a | 1.60 ± 0.14 B,b | 0.67 ± 0.14 A,c | 11.23 ± 1.53 b | N.D. | N.D. |
Publisher’s Note: MDPI stays neutral with regard to jurisdictional claims in published maps and institutional affiliations. |
© 2022 by the authors. Licensee MDPI, Basel, Switzerland. This article is an open access article distributed under the terms and conditions of the Creative Commons Attribution (CC BY) license (https://creativecommons.org/licenses/by/4.0/).
Share and Cite
Bonifácio-Lopes, T.; Catarino, M.D.; Vilas-Boas, A.A.; Ribeiro, T.B.; Campos, D.A.; Teixeira, J.A.; Pintado, M. Impact of Circular Brewer’s Spent Grain Flour after In Vitro Gastrointestinal Digestion on Human Gut Microbiota. Foods 2022, 11, 2279. https://doi.org/10.3390/foods11152279
Bonifácio-Lopes T, Catarino MD, Vilas-Boas AA, Ribeiro TB, Campos DA, Teixeira JA, Pintado M. Impact of Circular Brewer’s Spent Grain Flour after In Vitro Gastrointestinal Digestion on Human Gut Microbiota. Foods. 2022; 11(15):2279. https://doi.org/10.3390/foods11152279
Chicago/Turabian StyleBonifácio-Lopes, Teresa, Marcelo D. Catarino, Ana A. Vilas-Boas, Tânia B. Ribeiro, Débora A. Campos, José A. Teixeira, and Manuela Pintado. 2022. "Impact of Circular Brewer’s Spent Grain Flour after In Vitro Gastrointestinal Digestion on Human Gut Microbiota" Foods 11, no. 15: 2279. https://doi.org/10.3390/foods11152279
APA StyleBonifácio-Lopes, T., Catarino, M. D., Vilas-Boas, A. A., Ribeiro, T. B., Campos, D. A., Teixeira, J. A., & Pintado, M. (2022). Impact of Circular Brewer’s Spent Grain Flour after In Vitro Gastrointestinal Digestion on Human Gut Microbiota. Foods, 11(15), 2279. https://doi.org/10.3390/foods11152279