Abstract
Zijuan tea (Camellia sinensis var. assamica cv. Zijuan) is a unique purple tea. Recently, purple tea has drawn much attention for its special flavor and health benefits. However, the characteristic compounds of purple tea compared with green tea have not been reported yet. The present study employed a non-targeted metabolomics approach based on ultra-high performance liquid chromatography (UHPLC)-Orbitrap-tandem mass spectrometry (MS/MS) for comprehensive analysis of characteristic metabolites between Zijuan purple tea (ZJT) and Yunkang green tea (YKT). Partial least squares-discriminant analysis (PLS-DA) indicated that there are significant differences in chemical profiles between ZJT and YKT. A total of 66 major differential metabolites included catechins, proanthocyanins, flavonol and flavone glycosides, phenolic acids, amino acids and alkaloids were identified in ZJT. Among them, anthocyanins are the most characteristic metabolites. Nine glycosides of anthocyanins and six glycosides of proanthocyanins were found to be significantly higher in ZJT than that in YKT. Subsequently, pathway analysis revealed that ZJT might generate anthocyanins and proanthocyanins through the flavonol and flavone glycosides. Furthermore, quantitative analysis showed absolutely higher concentrations of total anthocyanins in ZJT, which correlated with the metabolomics results. This study presented the comprehensive chemical profiling and the characterized metabolites of ZJT. These results also provided chemical evidence for potential health functions of ZJT.
1. Introduction
Tea plants (Camellia sinensis (L.) O. Kuntze) are widely distributed in southwestern China and have been used to manufacture various tea types [1]. Because of beneficial effects for human health, tea has become a worldwide consumed beverage [2,3]. During long-term natural hybridization and under human selection pressure, the leaf color of tea plants has greatly diversified. The selection of specific colors of tea leaves has been applied in recent breeding programs. Zijuan (C. sinensis var. assamica cv. Zijuan) is the first registered purple tea cultivar with outstanding purple buds, stems and leaves. During recent years, the leaves of Zijuan cultivar have been used to produce purple tea, which are very popular for purple colors and unique flavors.
It is worth noting that Zijuan and Yunkang tea cultivar (C. sinensis var. assamica cv. Yunkang) are both classified as the same taxonomic variant of C. sinensis var. assamica, and both originated from the Yunnan province of China. Following a standard procedure of fixation, rolling and drying, the leaves and buds of Zijun and Yunkan are processed into green teas. Green tea is an unoxidated tea type conserved highest amount of original chemical compounds in the leaves and buds of tea plants. Accumulating evidence showed that green tea extract (GTE) has many health benefits, such as antibacterial, anti-obesity, anti-hyperglycemic, antioxidant and anticancer activity. Zijun purple tea (ZJT) presents a special aroma and purple color compared with Yunkang green tea (YKT). Some research reported that ZJT contains abundant anthocyanins, which are naturally occurring pigments accounting for the purple, red and blue colors of many plant organs. Jiang et al. successfully identified four unique anthocyanins from ZJT. Among them, delphinidin-3-O-beta-D-galactoside and cyanidin-3-O-beta-D-galactoside were confirmed by liquid chromatography−electrospray ionization mass spectrometry (LC-ESI-MS) [4]. Wang et al. also reported some new compounds from ZJT, which are delphinidin-3-O-beta-D-(6-(E)-p-coumaroyl) galactopyranoside and cyanidin-3-O-beta-D-(6-(E)-p-coumaroyl) galactopyranoside identified by the high-resolution time-of-flight-mass spectrometry (TOF-MS) and nuclear magnetic resonance (NMR) techniques [5,6]. Published papers reported that ZJT has pharmacological activities [7,8], and the large molecular polymeric pigments isolated from ZJT significantly reduce blood lipids in high-fat diet feeding rats. Additionally, ZJT executes antihypertensive effect for its rich in flavonoids, zinc and anthocyanins [6,9]. However, the metabolite profiling and characteristic chemical composition compared with green tea has not been reported yet.
Non-targeted metabolomics, aiming at comprehensive chemical profiling, has been playing a pivotal role in quality control, species differentiation and processing mechanistic investigation [10,11,12,13]. It has been widely used in tea classification [14], tea processing [15,16], tea origins [17], and picking time [2,18,19]. Comparing with various profiling techniques in plant metabolomics, the ultra-high performance liquid chromatography–tandem mass spectrometry (UHPLC-MS/MS) technique offers remarkable advantages in resolution, sensitivity, and analysis speed. Orbitrap is one of widely used mass spectrometry technique in metabolomics research given its capacity for a non-targeted search and fragmentation [20]. In this study, a non-targeted metabolomics approach utilizing UHPLC-Orbitrap-MS/MS was established for comparatively analyzing ZJT and YKT, with metabolite profiling and chemometrics. Our results will provide the first set of data for better understand chemical profiles and characteristic compounds between ZJT and YKT, and also provide chemical information for potential health benefits of ZJT.
2. Materials and Methods
2.1. Chemicals and Tea Samples
LC-MS-grade water, acetonitrile and methanol were bought from CNW Technologies GmbH (Düsseldorf, Germany). Formic acid of LC-MS grade was provided by General Electric Company ((Fairfield, CT, USA). Ammonium hydrogen carbonate was obtained from Thermo Fisher Scientific (Sunnyvale, CA, USA). Catechin (C, purity ≥ 98%), epicatechin (EC, purity ≥ 98%), gallocatechin (GC, purity ≥ 98%), epigallocatechin (EGC, purity ≥ 98%), epicatechin gallate (ECG, purity ≥ 98%), catechin gallate (CG, purity ≥ 98%), epigallocatechin gallate (EGCG, purity ≥ 99%) and caffeine (purity ≥ 98%) were obtained from Chengdu MUST Bio-technology Co., Ltd. (MUST, Chengdu, China). The steamed tea Zijuan purple tea (ZJT) and Yunkang green tea (YKT) were produced in 2017 by Yunnan Tea Science Research Institute. The fresh leaves of Zijuan cultivar (C. sinensis var. assamica cv. Zijuan) and Yunkang cultivar (C. sinensis var. assamica cv. Yunkang) were picked at the same time from the tea garden of the Institute of Tea Science, Yunnan Province Academy of Agricultural Sciences (Menghai, China), respectively. They were processed into green tea using typical manufacturing approached. Briefly, the leaves were fist steamed at 220 °C, then rolled for 30 min, and finally dried by electrical heaters into green tea. The vouchers of the Zijuan and Yunkang plants were preserved in the Institute of Tea Science, Yunnan Province Academy of Agricultural Sciences.
2.2. Sample Preparation
Each powdered sample (80 mg) was extracted with 1.0 mL of methanol/water (70:30, v/v) for 10 min at 4 °C under 100 Hz ultrasonic extraction. After centrifuging at 14,000 rpm for 10 min, the supernatants were diluted 40-fold with methanol/water (70:30, v/v) and then filtered through 0.22 μm nylon filter for MS analysis. A 5 μL aliquot of the extract was injected into UHPLC-Orbitrap-MS/MS. Quality control samples were obtained by mixing equal volumes of each sample analyzed in the present investigation to monitor system stability in non-targeted metabolomics.
2.3. Ultra-High Performance Liquid Chromatography Combined with Orbitrap Mass Spectrometry (UHPLC-Orbitrap-MS/MS) Analysis
Chromatographic analysis was carried out on an Ultimate HPLC system (Thermo Fisher Scientific, Waltham, MA, USA). In a positive ion mode, a small volume of 5 μL sample was separated on an ACQUITY BEH C18 column (100 mm × 2.1 mm, 1.7 μm; Waters, Milford, MA, USA), which temperature was held at 35 °C. A (0.1% formic acid in water) and B (0.1% formic acid in acetonitrile) were used as mobile phase. And the flow rate was set at 0.35 mL/min under gradient elution conditions: 0–1 min, 95% A; 1–24 min, 95% A; 24–28 min, 0% A. Then the column re-equilibration step was performed at initial composition in 1 min and held for another 3 min. In a negative ion mode, samples were separated with an ACQUITY HSS T3 column (100 mm × 2.1 mm, 1.8 μm; Waters, Milford, MA, USA). The elution system comprised A (6.5 mM ammonium acetate in water) and B (6.5 mM ammonium acetate in 95% acetonitrile), and the solvent gradient was set as follows: 0–1 min, 95% A; 1–18 min, 95–0% A; 18–22 min, 0% A; 22.1–25 min, 0–95% A; 25–28 min, 95% A.
MS detection was executed on a Q Exactive Focus Oribitrap MS system (Thermo Fisher Scientific, USA) supplied with a heated electrosprayer for ionization (HESI). Mass spectra were acquired separately with positive and negative ionization mode in a full mass operation with a mass range of 100–1000 m/z by the spray voltage of 3.5 and 3 kV respectively. The temperature of capillary and source were maintained at 350 and 360 °C. The pressure of 50 psi and 10 psi was set for sheath gas (N2) and auxiliary gas (N2), respectively. Sodium trifluoroacetate was used for accurate mass calibration. Mass spectra and chromatograms were acquired and processed with Xcalibur (Thermo Fisher Scientific, Waltham, MA, USA). Chemical formula for precursor and product ions was determined by software of Compound Discoverer (version 2.0).
2.4. Catechins and Caffeine Analysis by HPLC
The concentration of catechins and caffeine was analyzed by HPLC (Waters, Milford, MA, USA). The protocol for chromatographic performance were slightly modified from a previous publication [21]. Briefly, chromatographic separation was executed on a Phenomenex Gemini C18 column (100 mm × 4.6 mm, 5 μm; Torrance, CA, USA). A small volume of 5 µL sample was loaded on the column, which maintained at 25 °C. Then, the sample was eluted at the rate of 1 mL/min, and was detected at the wavelength of 278 nm, respectively. The mobile phase A (deionized water with 0.17% acetic acid) and mobile phase B (100% acetonitrile) were used for the linear gradient, which was set as follows: mobile phase B from 8–28.4% (v/v) in 30 min was initiated, from 28.4–100% (v/v) for 8 min, and from 100–8% (v/v) for another 10 min at a flow rate of 1.0 mL/min.
2.5. Total Content of Anthocyanins by Acid-Alcohol Method
Total content of anthocyanins was determined following the method of Jiang et al. [22] with slight modification. Briefly, two gram of tea powdered sample was extracted with 40 mL boiling water for 30 min. The obtained extracts were centrifuged at 3500 rpm for 10 min, and were further diluted with 1% acidic ethanol to a final volume of 50 mL. The absorbance value of the extracts was measured at 535 nm.
2.6. Data Analysis for Untargeted Metabolomics
The raw UHPLC-Orbitrap-MS/MS data were progressed by XCMS Online (http://xcmsonline.scripps.edu/, accessed on 16 December 2020) [23] for peak deconvolution and alignment. The primary parameters were set as follows: 100,000 for ion intensity threshold, 20 ppm for ion m/z tolerance, 0–30 min for retention time range, and 0.5 min for ion retention time tolerance. Other parameters were set as default. Area method was used to normalize the data. Finally, with the established methods [24,25], a data matrix was obtained and exported to an Excel table, including retention time (RT), m/z value and normalized ion intensity (variables).
The preprocessed data sets from positive and negative models were imported into SIMCA-P software (version 13.0) (Umetrics, Umeå, Sweden) to perform unsupervised principal component analysis (PCA) and supervised partial least squares discriminant analysis (PLS-DA). The variable importance in the projection (VIP) value was calculated in the PLS-DA model, p-value was determined in non-parametric tests (Mann–Whitney test), and fold change (FC, ZJT/YKT) was compared between ZJT and YKT. The variables with VIP > 1.0, p-value < 0.05 and |log2−FC| > log2 1.5 were chosen as potential differential metabolites [26].
The structure annotation of the potential differential metabolites was determined by comparing RT, m/z with that from published literature [14,17,27,28,29], such as OSI/SMMS (jointly developed by Dalian Institute of Chemistry and Physics and Dalian Dashuo Information Technology Co., Ltd., Dalian, China), HMDB (http://www.hmdb.ca/, accessed on 12 February 2021) [30], PubChem (http://www.ncbi.nlm.nih.gov/pccompound/, accessed on 20 January 2021) [31], METLIN (http://metlin.scripps.edu/, accessed on 20 January 2021) [32], and Tea Metabolism Database (TMDB, http://pcsb.ahau.edu.cn:8080/TMDB/teaAction_search.action, accessed on 20 January 2021) [33]. The KEGG Pathway Database (http://www.genome.jp/kegg/pathway.html, accessed on 20 January 2021) [34] was employed for pathway analysis.
3. Results
3.1. Significant Differentiation of Zijuan Purple Tea (ZJT) and Yunkang Green Tea (YKT) Metabolite Profiling by UHPLC-Orbitrap-MS/MS
The metabolites in the ZJT and control green tea (YKT) were analyzed with the UHPLC-Orbitrap-MS/MS system. The typical total ion current chromatograms of tea samples were analyzed in positive and negative ion modes (Figure S1), which yielded 1635 and 1587 metabolite ion features, respectively, for statistical analyses. At first, to identify intra- and inter-class differences between ZJT and YKT, we conducted an unsupervised PCA analysis. Our results showed that the samples were closely clustered as ZJT and YKT groups, and the quality control (QC) samples gathered together, reflecting the stability and reliability of the metabolomics analysis. Furthermore, the ZJT and YKT samples were clearly separated, indicating a significant difference in chemical profiles between ZJT and YKT in positive and negative ion mode (Figure 1A,D).
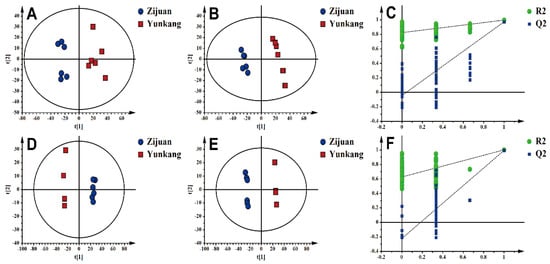
Figure 1.
Multivariate statistical analysis of the differences in metabolites between Zijuan purple tea (ZJT) and Yunkang green tea (YKT). (A) Principal component analysis (PCA)-X score in positive ion mode (R2X = 0.73; Q2 = 0.47); (B) partial least squares-discriminant analysis (PLS-DA) score in positive ion mode (R2X = 0.519; R2Y = 0.996; Q2 = 0.972); (C) PLS-DA model validation in positive ion mode (R2 = 0.818; Q2 = −0.0476); (D) PCA-X score in negative ion mode (R2X = 0.638; Q2 = 0.506); (E) PLS-DA score in negative ion mode (R2X = 0.656; R2Y = 0.999; Q2 = 0.991); (F) PLS-DA model validation in negative ion mode (R2 = 0.626; Q2 = −0.226).
The supervised PLS-DA model, which produced analogous results, was applied to examine the metabolites with the greatest differences. The ZJT samples were clustered within II and III quadrants, and the YKT samples were separated with ZJT samples in I and IV quadrants. These results further confirmed that ZJT and YKT have distinct chemical profiles (Figure 1B,E). Furthermore, R2X, R2Y and Q2 were calculated as 0.519, 0.996 and 0.972 in positive and 0.519, 0.996, 0.991 in negative, respectively, which indicated that the models were established successfully without over-fitting [35]. Permutation had the same results (Figure 1C,F).
3.2. Characteristic Metabolites of ZJT
Variables with VIP > 1, p < 0.05, fold change > 1.5 were selected as potential differential metabolites, which were identified by comparing RT, m/z value with corresponding published data in literature or databases. A total for 66 metabolites was tentatively identified, which including 8 flavan-3-ols, 6 proanthocyanins, 28 flavonol and flavone glycosides, 8 phenolic acids, 8 amino acids and 8 alkaloids summarized in Table 1. A heat map based on the 66 differentially abundant metabolites (Figure 2) provided a comprehensive overview of the differences in the metabolite contents between ZJT and YKT.

Table 1.
Differential metabolites in ZJT and YKT samples by metabolomics analysis based on ultra-high performance liquid chromatography combined with Orbitrap mass spectrometry (UHPLC-Orbitrap-MS/MS).
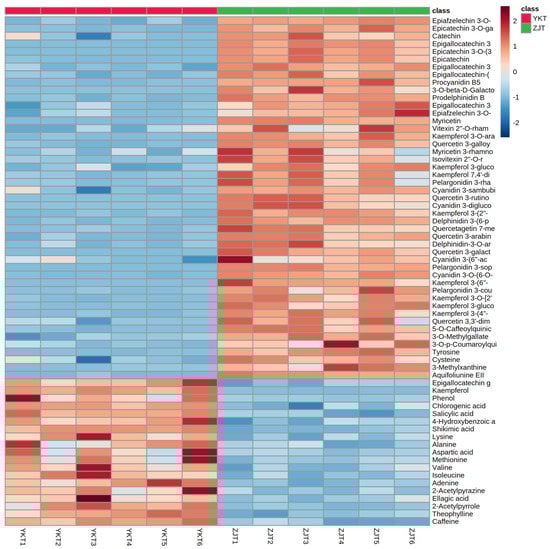
Figure 2.
Heat map representing metabolites levels in ZJT and YKT. Red and blue boxes represent values that were higher and lower than the mean value, respectively.
3.2.1. Flavan-3-Ols
Flavan-3-ols are considered the main compounds that account for the antioxidant activity of tea [36]. Total catechins had almost same content in both ZJT and YKT teas (Table S1) which agreed with Yang et al. [15]. Wang et al. isolated and identified some catechins such as epigallocatechin 3-O-p-coumaroate, epigallocatechin-3-O-ferulate, (-)-epicatechin (EC), (-)-epigallocatechin (EGC), (-)-epicatechin-3-O-gallate (ECG), (-)-epigallocatechin-3-O-gallate (EGCG), (-)-epigallocatechin-3-O-(3′-O-methylgallate), (-)-epicatechin-3-O-(3′-O-methylgallate) in ZJT [5]. Catechins including catechin (C), EC, ECG, epicatechin 3-O-(3-O-methylgallate), epigallocatechin 3-(3”-methylgallate) (EGCG 3”Me), epigallocatechin 3-p-coumaroate and epiafzelechin 3-O-gallate in ZJT are significantly higher in ZJT than that in YKT (Table 1). While epigallocatechin gallate (EGCG) is low in ZJT compared with YKT.
3.2.2. Proanthocyanins
Proanthocyanins are important flavonoids, which are dimers or polymers in the two or more different types of flavan-3-ol derivatives. Our data revealed that there were significantly differences in proanthocyanins contents between these two type teas, and ZJT contained much higher levels of proanthocyanins, such as procyanidin B5, prodelphinidin B and 3-O-beta-D-galactopyranosylproanthocyanidin A5′ compared with YKT (Table 1). C and EC were mainly precursors for proanthocyanin synthesis in some plants [7], which are both higher levels in ZJT than YKT (Table 1). Additionally, epigallocatechin 3-O-gallate-(4β->6)-epicatechin and epiafzelechin 3-O-gallate-(4beta->6)-epigallocatechin, the metabolites of epigallocatechin-(4beta->8)-epicatechin 3-O-gallate, also exhibit the two- to nine-fold increase in ZJT than that in YKT (Figure 3).
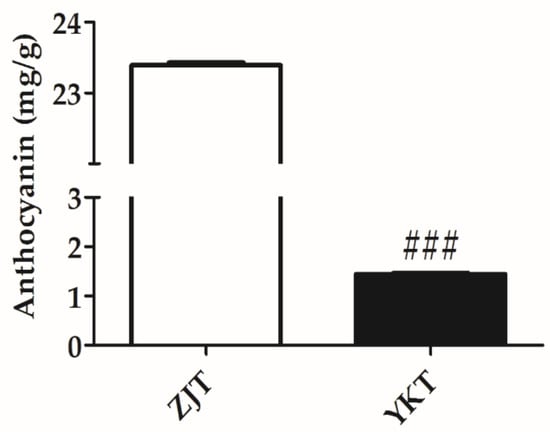
Figure 3.
Concentration of anthocyanin in ZJT and YKT (mg/g) (n = 3, mean ± standard error of the mean (SEM)), ### p < 0.001, compared to ZJT.
3.2.3. Flavonol and Flavone Glycosides
Flavonol and flavone glycosides are a large family of compounds that possess bioactive properties. ZJT has 27 metabolites of flavonol and flavone glycosides exhibiting richer abundance than that in YKT, including myricetin, kaempferol glycosides (kaempferol 3-glucoside-7-xyloside, kaempferol 3-(2″-hydroxypropionylglucoside)-4′-glucoside, kaempferol 3-O-arabinoside, kaempferol 3-(4″-acetyl-6″-p-coumarylglucoside), kaempferol 7,4′-dirhamnoside, kaempferol 3-(6″-ferulylglucoside), kaempferol 3-O-[2″-(4‴-acetylrhamnosyl)-6″-glucosyl], kaempferol 3-glucoside), quercetin glycosides (quercetin 3-galloylglucosyl-arabinofuranoside, quercetin 3-rutinoside-4′-glucoside, quercetagetin 7-methylether 6-glucoside, quercetin 3-arabinoside, quercetin 3-galactoside, quercetin 3,3′-dimethylether 4′-glucoside), myricetin, vitexin glycosides (vitexin 2″-O-rhamnoside-4‴-acetate) and isovitexin glycosides (isovitexin 2″-O-rhamnoside) (Table 1). Only one metabolite kaempferol is lower in ZJT than YKT (Figure 2).
Anthocyanins are water-soluble natural pigments widely distributed in terrestrial plants [37]. As shown in Table 1, nine anthocyanins were identified in the ZJT, and their relative abundance were found significantly richer than that in YKT. These were putatively identified as cyanidin 3-diglucoside 5-glucoside, cyanidin 3-O-(6-O-p-coumaroyl) glucoside, cyanidin 3-sambubioside, cyanidin 3-(6″-acetylglucoside)-5-glucoside, delphinidin 3-(6-p-coumaroyl) galactoside, delphinidin-3-O-arabinoside, pelargonidin 3-sophoroside 5-glucoside, pelargonidin 3-coumarylglucoside-5-acetylglucoside, pelargonidin 3-rhamnoside 5-glucoside (Table 1) [38]. In terms of MS intensities, cyanidin 3-diglucoside 5-glucoside and pelargonidin 3-sophoroside 5-glucoside exhibited the 2579 and 63-fold higher in ZJT than that in YKT. Quantitative analysis using acid-alcohol method showed absolutely higher concentrations of total anthocyanins in ZJT (Figure 3), which was similar to the metabolomics results. Our results indicated that most of the anthocyanins were not synthesized at all in the YKT.
3.2.4. Amino Acids and Phenolic Acids
Regarding free amino acids, our results indicated that ZJT possessed relatively higher amounts of tyrosine and cysteine (Table 1). Lysine, alanine, aspartic acid, methionine, valine and isoleucine have lower levels in ZJT than YKT (Figure 2) in this study.
Additionally, phenolic acids in ZJT and YKT extracts differed greatly. Higher levels of caffeoylquinic acid, methyl gallate and coumaroylquinic acid were observed in ZJT (Table 1) and phenol, chlorogenic acid, ellagic acid, salicylic acid, 4-hydroxybenzoic acid and shikimic acid were found in lower contents in ZJT than YKT (Figure 2).
3.2.5. Alkaloids
Alkaloids, mainly caffeine and theobromine, has been extensively investigated in tea plants [13,39]. In this study, 3-methylxanthine and aquifoliunine EII were higher levels in ZJT than YKT (Table 1), while adenine, 2-acetylpyrazine, 2-acetylpyrrole, theophylline and caffeine were lower in ZJT than YKT (Figure 2). It was reported that genotypic factors had many effects on the caffeine content of tea which might be the reason why ZJT and YKT had different caffeine content [40].
3.3. Metabolic Pathway Analysis of ZJT
Pathway analysis of differential metabolites helps us to understand the mechanism of metabolic pathway changes in differential groups. Figure 4 showed the enrichment analysis of the metabolic pathway of ZJT. Data in the enrichment metabolic pathway were plotted with the significance of the pathway (−log (p-value)) as the ordinate, using the metabolic pathway impact as abscissa. Our data showed that the differential metabolites in ZJT were mainly enriched in the two pathways, flavonoid biosynthesis and flavone/flavonol biosynthesis when compared against YKT. The most influential metabolic pathway had a pathway impact > 0.35 and −log (p-value) > 2.
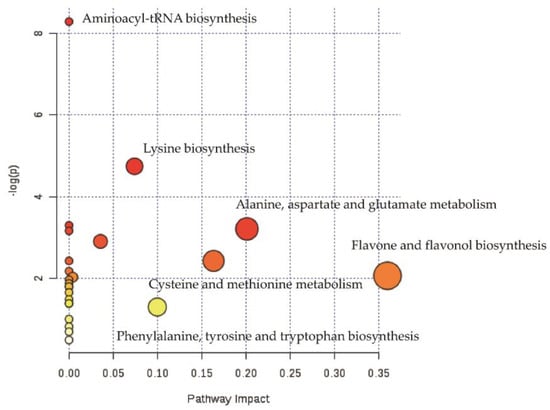
Figure 4.
Pathway analysis of ZJT and YKT. The y-axis (−log (p-value)) and x-axis represents the significance of the pathway and pathway impact between ZJT and YKT, respectively.
The pathways of flavone and flavonol biosynthesis and amino acid biosynthesis are further analyzed and mapped in Figure 5. It showed that a set of the metabolites in the biosynthesis of flavone and flavonol were higher in ZJT than YKT except for kaempferol and EGCG. As shown in the Figure 5, ZJT has significantly higher proanthocyanins, which including epigallocatechin-(4beta->8)-epicatechin 3-O-gallate, procyanidin B5, epigallocatechin 3-O-gallate-(4beta->6)-epicatechin, 3-O-beta-D-galactopyranosylproanthocyanidin A5′, prodelphinidin B and epiafzelechin 3-O-gallate-(4beta->6)-epigallocatechin. Furthermore, in the flavone and flavonol biosynthesis pathway, the production of kaempferol glycosides, quercetin glycosides, myricetin glycosides and anthocyanins was also increased on a large scale (Figure 5). Free amino acids play important roles in the determination of tea testers and are also involved in the formation of tea aroma. Amino acid contents in tea are considered to be closely correlated to tea varieties [41,42]. Our results showed that metabolites in the amino acid biosynthesis pathway, such as shikimic acid, alanine, valine, and aspartic acid, are all abundant in YKT. Our data indicated that these rich amino acid may contribute to specific aroma and tester formation in ZJT.
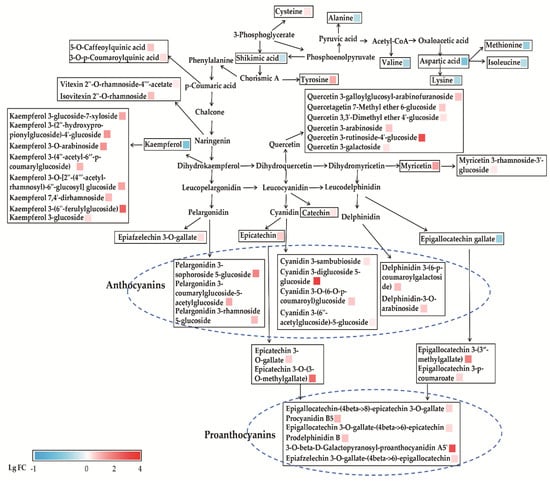
Figure 5.
Metabolic pathways of flavone and flavonol biosynthesis and amino acid biosynthesis in ZJT and YKT. Red (LgFC > 0) and blue (LgFC < 0) boxes represent values that were higher and lower than the mean value, respectively.
4. Discussion
ZJT is a representative purple tea. In this study, a UHPLC-Orbitrap-MS/MS based non-targeted metabolomics approach combined with a chemometrics analysis was used to investigate the metabolite profiling and to identify characteristic compounds of ZJT against green tea YKT. A total of 66 metabolites were characterized, including 8 flavan-3-ols, 6 proanthocyanins, 28 flavonol and flavone glycosides, 8 phenolic acids, 8 amino acids and 8 alkaloids.
In our study, total catechins had almost same content in both teas by HPLC analysis (Table S1) which agreed with Yang et al. [15]. While Yan et al. reported that ZJT had lower total catechins than YKT [43]. This difference might be due to the different harvest season of ZJT and YKT in Yan’s work. A previous paper reported that the total catechin concentrations were significantly higher in tea plants harvested in autumn than in those harvested in spring [44]. However, the ZJT and YKT of this study were collected in the same tea garden and manufactured at the same time. Our data revealed that the concentrations of 6 types of catechin showed similar levels in trends between ZJT and YKT. It is worth noting that relative abundance of 3” methylated EGCG (EGCG 3”Me) in ZJT has approximate 66-folde higher than that in YKT by comparing mass intensity (Table 1). Epigallocatechin gallate (EGCG) is low in ZJT compared with YKT. This might be due to some parts of EGCG being modified to form EGCG 3”Me in the ZJT tea tree. It was reported that the content of EGCG 3”Me in fresh ZJT leaves was as high as 1.05% [45]. Other Yunnan large-leaf teas (Camellia sinensis var. assamica) including YKT tree leaves do not generally contain EGCG 3”Me. Kurita et al. reported that EGCG 3”Me exhibited significant hypotensive effects in clinical trials [46]. In addition, a paper reported that the bioavailability of EGCG 3”Me is superior to EGCG [47]. Our data suggested that high concentration of EGCG 3”Me may have potential benefits in ZJT.
Anthocyanins are generally responsible for the red, blue, and purple pigments in plant leaves. The sufficient of anthocyanins could dominate the green color of chlorophylls, leaf coloration then depends mainly on anthocyanins [48]. In this study, ZJT has more flavonol and flavone glycosides than YKT. Similar results have also been reported by Yang et al. [15]. The relative abundance of 9 anthocyanins identified in the ZJT was found to be significantly richer than that in YKT. The total amount of anthocyanins in ZJT was also significantly higher than that of YKT (Figure 3). Therefore, anthocyanins might overlap with the chlorophyll to form the more purple color in ZJT.
The flavone and flavonol biosynthesis and amino acid biosynthesis pathway are further mapped in Figure 5. As shown, chorismic acid is a key intermediate for p-coumaric acid and tyrosine synthesis. Tyrosine is the precursor of coumaroyl CoA, which promote the production of flavonoids [49]. In this pathway, the downstream metabolites caffeoylquinic acid, coumaroylquinic acid and tyrosine were significantly higher in ZJT. Phenylalanine is catalyzed by a series of enzymes such as chalcone synthase (CHS), chalcone isomerase (CHI), dihydroflavonol 4-reductase (DFR), anthocyanin synthetase (ANS), UDP-glucosyl transferase (UGT) to produce dihydrokaempferol, and it is also the common precursor for favan-3-ols, proanthocyanins, flavonol and flavone glycosides [43,50,51]. It was reported that the abundances of anthocyanin synthesis-related enzymes, such as CHS, CHI, DFR, ANS and UGT in the purple leaves were all significantly higher than those in the green leaves. The increase expression of anthocyanin synthesis-related enzymes contributes to anthocyanin accumulation [43,52,53]. Furthermore, dihydrokaempferol is catalyzed by ANS to form colorless leucopelargonidin, which is the precursor of pelargonidin, and the pelargonidin combines with glycosides under the catalysis of UGT to form stable pelargonidin glycosides (pelargonidin 3-sophoroside 5-glucoside, pelargonidin 3-coumarylglucoside-5-acetylglucoside, pelargonidin 3-rhamnoside 5-glucoside). Our results showed that pelargonidin glycosides were higher in ZJT than YKT. In addition, dihydrokaempferol produces kaempferol, which in combination with glycosides forms kaempferol glycosides (kaempferol 3-glucoside-7-xyloside, kaempferol 3-(2″-hydroxypropionylglucoside)-4′-glucoside, kaempferol 3-O-arabinoside, kaempferol 3-(4″-acetyl-6″-p-coumarylglucoside), kaempferol 7,4′-dirhamnoside, kaempferol 3-(6″-ferulylglucoside), kaempferol 3-O-[2″-(4‴-acetylrhamnosyl)-6″-glucosyl], kaempferol 3-glucoside). Thus, leucopelargonidin forms anthocyanins in the flavonoid biosynthesis pathway in ZJT. In the study of Li et al., increased acetyl-CoA may contribute to anthocyanin accumulation through the increase of cytosolic acetyl-coenzyme A carboxylase activity in the purple leaves of ZJT, indicating that glycolysis may provide more intermediates as substrates for promoting anthocyanin accumulation [50]. In particular, dihydroquercetin is a common direct precursor for both quercetin and leucocyanidin. Consequently, it is reasonable that large amounts of quercetin-based flavonol glycosides accumulated in ZJT should enhance the production of cyanidin-based anthocyanins. The extensively enhanced flavonoid pathway affirmatively provides more available precursors for flavanol biosynthesis in ZJT. Consequently, the polycondensation of proanthocyanin monomers might be further promoted in ZJT.
The other two pathways catalyze the formation of dihydroquercetin and dihydromyricetin under a series of enzymes’ action to produce flavonoid glycosides and anthocyanins, whereas most catechins, quercetin glycosides, myricetin glycosides, cyanidin glycosides and delphinidin glycosides are produced by the similar enzymatic reaction. A previous paper reported that transcription levels of anthocyanin synthesis-related genes, including PAL, CHS, CHI, DFR and ANS in ZJT, were high due to activation of the transcription factors bHLH and HY5 which resulted in enhanced anthocyanin synthesis in purple leaves of ZJT [43]. Furthermore, the amino acids biosynthesis pathway analysis showed that shikimic acid, alanine, valine, and aspartic acid were all abundance in YKT (Figure 5). Those two pathways all contribute to the special flavor and color of ZJT [43,50,51].
The chemical profiles and characteristic metabolites between Zijuan purple tea and Yunkang green tea were obtained in specific conditions. One is that Zijuan and Yunkang cultivars were cultivated in the same tea garden of Institute of Tea Science, Yunnan Province Academy of Agricultural Sciences. The other is that ZJT and YKT were produced by standard steamed green tea protocol. Therefore, the present results cannot be generalized to other purple or green varieties of tea apart from the anthocyanin content.
5. Conclusions
The UHPLC-Orbitrap-MS/MS technique and chemometrics methods are powerful tools to comparatively analyze chemical profiles and characteristic metabolites between Zijuan purple tea and Yunkang green tea. Based on chemical profiles, ZJT and YKT are greatly differentiated even if they are made from leaves and buds collected from the same variety (Camellia sinensis var. assamica). Catechins, proanthocyanins, flavonol and flavone glycosides, phenolic acids, amino acids and alkaloids are major differential metabolites between ZJT and YKT. In addition, pathway analysis revealed that ZJT might generate anthocyanins and proanthocyanins through the flavonol and flavone glycosides. The increase of a set of anthocyanins and proanthocyanins all contribute to the specific purple color of ZJT. This study presented the comprehensive chemical profiling and the characterized metabolites of ZJT. These results also provided chemical evidence for the potential health functions of ZJT.
Supplementary Materials
The following are available online at https://www.mdpi.com/article/10.3390/foods10051070/s1, Figure S1: The representative total ion chromatogram (TIC) of UHPLC-Orbitrap-MS/MS in ZJT. (A): positive ion mode, (B): negative ion mode. Table S1: Contents of catechins and amino acids in ZJT and YKT (%) (n = 3, mean ± SEM).
Author Contributions
The Conceptualization, D.L., H.G. and Z.X.; data curation, M.L., Y.S., H.G. and Z.X.; investigation, M.L., Y.S., H.G.; formal analysis. M.L., Y.S., H.G.,and Z.X.; writing-original draft, M.L., Y.S., writing-review & editing, T.L., C.-T.H., D.L., H.G. and Z.X.; and Supervision, D.L., Z.X. and C.-T.H. All authors approved the submission. All authors have read and agreed to the published version of the manuscript.
Funding
This research was funded by a key joint grant for regional innovation from the National Natural Science Foundation of China to Z.X. (Grant Number U19A2034), a key grant for University Synergy Innovation Program of Anhui Province to Z.X. (Grant Number GXXT-2019-49), a grant for Natural Science Foundation of Anhui Province to H.G. (Grant Number 1908085QC147) and a grant for supporting animal core facility in Anhui Agricultural University from the Department of Sciences and Technology of Anhui Province.
Institutional Review Board Statement
Not applicable.
Informed Consent Statement
Not applicable.
Data Availability Statement
No new data were created or analyzed in this study. Data sharing is not applicable to this article.
Conflicts of Interest
The authors declare no conflict of interest.
References
- Meng, X.-H.; Li, N.; Zhu, H.-T.; Wang, D.; Yang, C.-R.; Zhang, Y.-J. Plant Resources, Chemical Constituents, and Bioactivities of Tea Plants from the Genus Camellia Section Thea. J. Agric. Food Chem. 2018, 67, 5318–5349. [Google Scholar] [CrossRef]
- Fraser, K.; Harrison, S.J.; Lane, G.A.; Otter, D.E.; Hemar, Y.; Quek, S.-Y.; Rasmussen, S. Analysis of Low Molecular Weight Metabolites in Tea Using Mass Spectrometry-Based Analytical Methods. Crit. Rev. Food Sci. Nutr. 2014, 54, 924–937. [Google Scholar] [CrossRef] [PubMed]
- Zhou, P.; Hu, O.; Fu, H.; Ouyang, L.; Gong, X.; Meng, P.; Wang, Z.; Dai, M.; Guo, X.; Wang, Y. UPLC–Q-TOF/MS-based untargeted metabolomics coupled with chemometrics approach for Tieguanyin tea with seasonal and year variations. Food Chem. 2019, 283, 73–82. [Google Scholar] [CrossRef] [PubMed]
- Du, F.; Zhou, L.; Jiao, Y.; Bai, S.; Wang, L.; Ma, J.; Fu, X. Ingredients in Zijuan Pu’er Tea Extract Alleviate β-Amyloid Peptide Toxicity in a Caenorhabditis elegans Model of Alzheimer’s Disease Likely through DAF-16. Molecules 2019, 24, 729. [Google Scholar] [CrossRef] [PubMed]
- Bao, Y.; Xia, L.; Li, Y.; Liang, M. A new tea tree cultivar ‘Zijuan’. Acta Hortic. Sin. 2008, 35, 934. [Google Scholar] [CrossRef]
- Jiang, L.; Shen, X.; Shoji, T.; Kanda, T.; Zhou, J.; Zhao, L. Characterization and Activity of Anthocyanins in Zijuan Tea (Camellia sinensis var. kitamura). J. Agric. Food Chem. 2013, 61, 3306–3310. [Google Scholar] [CrossRef] [PubMed]
- Yang, X.R.; Bao, Y.X.; Huang, M. The botanical and quality characteristics of the tea cultivar “zi-Juan” in Yunnan province. J. Tea 2009, 35, 17–18. [Google Scholar] [CrossRef]
- Gao, X.; Ho, C.-T.; Li, X.; Lin, X.; Zhang, Y.; Chen, Z.; Li, B. Phytochemicals, Anti-Inflammatory, Antiproliferative, and Methylglyoxal Trapping Properties of Zijuan Tea. J. Food Sci. 2018, 83, 517–524. [Google Scholar] [CrossRef]
- Wang, Q.-P.; Peng, C.-X.; Gao, B.; Gong, J.-S. Influence of large molecular polymeric pigments isolated from fermented Zijuan tea on the activity of key enzymes involved in lipid metabolism in rat. Exp. Gerontol. 2012, 47, 672–679. [Google Scholar] [CrossRef]
- Gong, J.; Zhang, Q.; Peng, C.; Fan, J.; Dong, W. Curie-point pyrolysis–gas chromatography–mass spectroscopic analysis of theabrownins from fermented Zijuan tea. J. Anal. Appl. Pyrolysis 2012, 97, 171–180. [Google Scholar] [CrossRef]
- Jing, J.; Shi, Y.; Zhang, Q.; Wang, J.; Ruan, J. Prediction of Chinese green tea ranking by metabolite profiling using ultra-performance liquid chromatography–quadrupole time-of-flight mass spectrometry (UPLC–Q-TOF/MS). Food Chem. 2017, 221, 311–316. [Google Scholar] [CrossRef] [PubMed]
- Zhu, M.; Li, N.; Zhao, M.; Yu, W.; Wu, J.-L. Metabolomic profiling delineate taste qualities of tea leaf pubescence. Food Res. Int. 2017, 94, 36–44. [Google Scholar] [CrossRef]
- Xu, J.; Hu, F.-L.; Wang, W.; Wan, X.-C.; Bao, G.-H. Investigation on biochemical compositional changes during the microbial fermentation process of Fu brick tea by LC–MS based metabolomics. Food Chem. 2015, 186, 176–184. [Google Scholar] [CrossRef] [PubMed]
- Tan, J.; Dai, W.; Lu, M.; Lv, H.; Guo, L.; Zhang, Y.; Zhu, Y.; Peng, Q.; Lin, Z. Study of the dynamic changes in the non-volatile chemical constituents of black tea during fermentation processing by a non-targeted metabolomics approach. Food Res. Int. 2016, 79, 106–113. [Google Scholar] [CrossRef]
- Dai, W.; Xie, D.; Lu, M.; Li, P.; Lv, H.; Yang, C.; Peng, Q.; Zhu, Y.; Guo, L.; Zhang, Y.; et al. Characterization of white tea metabolome: Comparison against green and black tea by a nontargeted metabolomics approach. Food Res. Int. 2017, 96, 40–45. [Google Scholar] [CrossRef]
- Chen, S.; Liu, H.; Zhao, X.; Li, X.; Shan, W.; Wang, X.; Wang, S.; Yu, W.; Yang, Z.; Yu, X. Non-targeted metabolomics analysis reveals dynamic changes of volatile and non-volatile metabolites during oolong tea manufacture. Food Res. Int. 2020, 128, 108778. [Google Scholar] [CrossRef]
- Long, P.; Wen, M.; Granato, D.; Zhou, J.; Wu, Y.; Hou, Y.; Zhang, L. Untargeted and targeted metabolomics reveal the chemical characteristic of pu-erh tea (Camellia assamica) during pile-fermentation. Food Chem. 2020, 311, 125895. [Google Scholar] [CrossRef]
- Xin, Z.; Ma, S.; Ren, D.; Liu, W.; Han, B.; Zhang, Y.; Xiao, J.; Yi, L.; Deng, B. UPLC–Orbitrap–MS/MS combined with chemometrics establishes variations in chemical components in green tea from Yunnan and Hunan origins. Food Chem. 2018, 266, 534–544. [Google Scholar] [CrossRef]
- Zhang, Q.; Hu, J.; Liu, M.; Shi, Y.; De Vos, R.C.H.; Ruan, J. Stimulated biosynthesis of delphinidin-related anthocyanins in tea shoots reducing the quality of green tea in summer. J. Sci. Food Agric. 2019, 100, 1505–1514. [Google Scholar] [CrossRef]
- Zeng, C.; Lin, H.; Liu, Z.; Liu, Z. Metabolomics analysis of Camellia sinensis with respect to harvesting time. Food Res. Int. 2020, 128, 108814. [Google Scholar] [CrossRef]
- Ghaste, M.; Mistrik, R.; Shulaev, V. Applications of Fourier Transform Ion Cyclotron Resonance (FT-ICR) and Orbitrap Based High Resolution Mass Spectrometry in Metabolomics and Lipidomics. Int. J. Mol. Sci. 2016, 17, 816. [Google Scholar] [CrossRef]
- Wang, W.; Fu, X.-W.; Dai, X.-L.; Hua, F.; Chu, G.-X.; Chu, M.-J.; Hu, F.-L.; Ling, T.-J.; Gao, L.-P.; Xie, Z.-W.; et al. Novel acetylcholinesterase inhibitors from Zijuan tea and biosynthetic pathway of caffeoylated catechin in tea plant. Food Chem. 2017, 237, 1172–1178. [Google Scholar] [CrossRef]
- Available online: http://xcmsonline.scripps.edu/ (accessed on 16 December 2020).
- Teng, Y.; Li, D.; Guruvaiah, P.; Xu, N.; Xie, Z. Dietary Supplement of Large Yellow Tea Ameliorates Metabolic Syndrome and Attenuates Hepatic Steatosis in db/db Mice. Nutrients 2018, 10, 75. [Google Scholar] [CrossRef]
- Patti, G.J.; Tautenhahn, R.; Siuzdak, G. Meta-analysis of untargeted metabolomic data from multiple profiling experiments. Nat. Protoc. 2012, 7, 508–516. [Google Scholar] [CrossRef]
- Zeng, C.; Lin, H.; Liu, Z.; Liu, Z. Analysis of Young Shoots of ‘Anji Baicha’ (Camellia sinensis) at Three Developmental Stages Using Nontargeted LC-MS-Based Metabolomics. J. Food Sci. 2019, 84, 1746–1757. [Google Scholar] [CrossRef]
- De Vos, R.C.H.; Moco, S.; Lommen, A.; Keurentjes, J.J.B.; Bino, R.J.; Hall, R.D. Untargeted large-scale plant metabolomics using liquid chromatography coupled to mass spectrometry. Nat. Protoc. 2007, 2, 778–791. [Google Scholar] [CrossRef]
- Qin, D.; Wang, Q.; Li, H.; Jiang, X.; Fang, K.; Wang, Q.; Li, B.; Pan, C.; Wu, H. Identification of key metabolites based on non-targeted metabolomics and chemometrics analyses provides insights into bitterness in Kucha [Camellia kucha (Chang et Wang) Chang]. Food Res. Int. 2020, 138, 109789. [Google Scholar] [CrossRef]
- Ji, H.-G.; Lee, Y.-R.; Lee, M.-S.; Hwang, K.H.; Park, C.Y.; Kim, E.-H.; Park, J.S.; Hong, Y.-S. Diverse Metabolite Variations in Tea (Camellia sinensis L.) Leaves Grown Under Various Shade Conditions Revisited: A Metabolomics Study. J. Agric. Food Chem. 2018, 66, 1889–1897. [Google Scholar] [CrossRef] [PubMed]
- Available online: http://www.hmdb.ca/ (accessed on 12 February 2021).
- Available online: http://www.ncbi.nlm.nih.gov/pccompound/ (accessed on 20 January 2021).
- Available online: http://metlin.scripps.edu (accessed on 20 January 2021).
- Yue, W.; Sun, W.; Rao, R.S.P.; Ye, N.; Yang, Z.; Chen, M. Non-targeted metabolomics reveals distinct chemical compositions among different grades of Bai Mudan white tea. Food Chem. 2019, 277, 289–297. [Google Scholar] [CrossRef]
- Available online: http://www.genome.jp/kegg/pathway.html (accessed on 20 January 2021).
- Yue, Y.; Chu, G.-X.; Liu, X.-S.; Tang, X.; Wang, W.; Liu, G.-J.; Yang, T.; Ling, T.-J.; Wang, X.-G.; Zhang, Z.-Z.; et al. TMDB: A literature-curated database for small molecular compounds found from tea. BMC Plant Biol. 2014, 14, 243. [Google Scholar] [CrossRef] [PubMed]
- Tarachiwin, L.; Ute, K.; Kobayashi, A.; Fukusaki, E. 1H NMR Based Metabolic Profiling in the Evaluation of Japanese Green Tea Quality. J. Agric. Food Chem. 2007, 55, 9330–9336. [Google Scholar] [CrossRef]
- Dixon, R.A.; Xie, D.; Sharma, S.B. Proanthocyanidins—A final frontier in flavonoid research? New Phytol. 2005, 165, 9–28. [Google Scholar] [CrossRef]
- Khoo, H.E.; Azlan, A.; Tang, S.T.; Lim, S.M. Anthocyanidins and anthocyanins: Colored pigments as food, pharmaceutical ingredients, and the potential health benefits. Food Nutr. Res. 2017, 61, 1361779. [Google Scholar] [CrossRef]
- Cheng, S.; Fu, X.; Wang, X.; Liao, Y.; Zeng, L.; Dong, F.; Yang, Z. Studies on the Biochemical Formation Pathway of the Amino Acidl-Theanine in Tea (Camellia sinensis) and Other Plants. J. Agric. Food Chem. 2017, 65, 7210–7216. [Google Scholar] [CrossRef]
- Chen, S.; Li, M.; Zheng, G.; Wang, T.; Lin, J.; Wang, S.; Wang, X.; Chao, Q.; Cao, S.; Yang, Z.; et al. Metabolite Profiling of 14 Wuyi Rock Tea Cultivars Using UPLC-QTOF MS and UPLC-QqQ MS Combined with Chemometrics. Molecules 2018, 23, 104. [Google Scholar] [CrossRef]
- Willstätter, R.; Everest, A.E. Untersuchungen über die Anthocyane. I. Über den Farbstoff der Kornblume. Eur. J. Org. Chem. 1913, 401, 189–232. [Google Scholar] [CrossRef]
- Yu, Z.; Yang, Z. Understanding different regulatory mechanisms of proteinaceous and non-proteinaceous amino acid formation in tea (Camellia sinensis) provides new insights into the safe and effective alteration of tea flavor and function. Crit. Rev. Food Sci. Nutr. 2020, 60, 844–858. [Google Scholar] [CrossRef]
- Wei, K.; Wang, L.-Y.; Zhou, J.; He, W.; Zeng, J.-M.; Jiang, Y.-W.; Cheng, H. Comparison of catechins and purine alkaloids in albino and normal green tea cultivars (Camellia sinensis L.) by HPLC. Food Chem. 2012, 130, 720–724. [Google Scholar] [CrossRef]
- Yan, X.; Wang, Z.; Mei, Y.; Wang, L.; Wang, X.; Xu, Q.; Peng, S.; Zhou, Y.; Wei, C. Isolation, Diversity, and Growth-Promoting Activities of Endophytic Bacteria From Tea Cultivars of Zijuan and Yunkang-10. Front. Microbiol. 2018, 9, 1848. [Google Scholar] [CrossRef]
- Liu, M.; Tian, H.-L.; Wu, J.-H.; Cao, R.-R.; Wang, R.-X.; Qi, X.-H.; Xu, Q.; Chen, X.-H. Relationship between gene expression and the accumulation of catechin during spring and autumn in tea plants (Camellia sinensis L.). Hortic. Res. 2015, 2, 15023. [Google Scholar] [CrossRef] [PubMed]
- Lv, H.P.; Yang, T.; Liang, M.Z.; Wang, L.B.; Lin, Z. Study of EGCG3″Me content in Zijuan tea. Mod. Food Sci. Technol. 2014, 30, 286–289. [Google Scholar] [CrossRef]
- Kurita, I.; Maeda-Yamamoto, M.; Tachibana, H.; Kamei, M. Antihypertensive Effect of Benifuuki Tea ContainingO-Methylated EGCG. J. Agric. Food Chem. 2010, 58, 1903–1908. [Google Scholar] [CrossRef] [PubMed]
- Oritani, Y.; Setoguchi, Y.; Ito, R.; Maruki-Uchida, H.; Ichiyanagi, T.; Ito, T. Comparison of (−)-Epigallocatechin-3-O-gallate (EGCG) and O-Methyl EGCG Bioavailability in Rats. Biol. Pharm. Bull. 2013, 36, 1577–1582. [Google Scholar] [CrossRef] [PubMed]
- Shen, J.; Zou, Z.; Zhang, X.; Zhou, L.; Wang, Y.; Fang, W.; Zhu, X. Metabolic analyses reveal different mechanisms of leaf color change in two purple-leaf tea plant (Camellia sinensis L.) cultivars. Hortic. Res. 2018, 5, 7. [Google Scholar] [CrossRef]
- Pollastri, S.; Tattini, M. Flavonols: Old compounds for old roles. Ann. Bot. 2011, 108, 1225–1233. [Google Scholar] [CrossRef]
- Wang, L.; Pan, D.; Liang, M.; Abubakar, Y.S.; Li, J.; Lin, J.; Chen, S.; Chen, W. Regulation of Anthocyanin Biosynthesis in Purple Leaves of Zijuan Tea (Camellia sinensis var. kitamura). Int. J. Mol. Sci. 2017, 18, 833. [Google Scholar] [CrossRef] [PubMed]
- Zhang, Q.; Liu, M.; Ruan, J. Metabolomics analysis reveals the metabolic and functional roles of flavonoids in light-sensitive tea leaves. BMC Plant Biol. 2017, 17, 64. [Google Scholar] [CrossRef]
- Mei, Y.; Xie, H.; Liu, S.; Zhu, J.; Zhao, S.; Wei, C. Metabolites and Transcriptional Profiling Analysis Reveal the Molecular Mechanisms of the Anthocyanin Metabolism in the “Zijuan” Tea Plant (Camellia sinensis var. assamica). J. Agric. Food Chem. 2021, 69, 414–427. [Google Scholar] [CrossRef]
Publisher’s Note: MDPI stays neutral with regard to jurisdictional claims in published maps and institutional affiliations. |
© 2021 by the authors. Licensee MDPI, Basel, Switzerland. This article is an open access article distributed under the terms and conditions of the Creative Commons Attribution (CC BY) license (https://creativecommons.org/licenses/by/4.0/).