Ex Vivo Determination of Broadband Absorption and Effective Scattering Coefficients of Porcine Tissue


Abstract
:1. Introduction
2. Materials and Methods
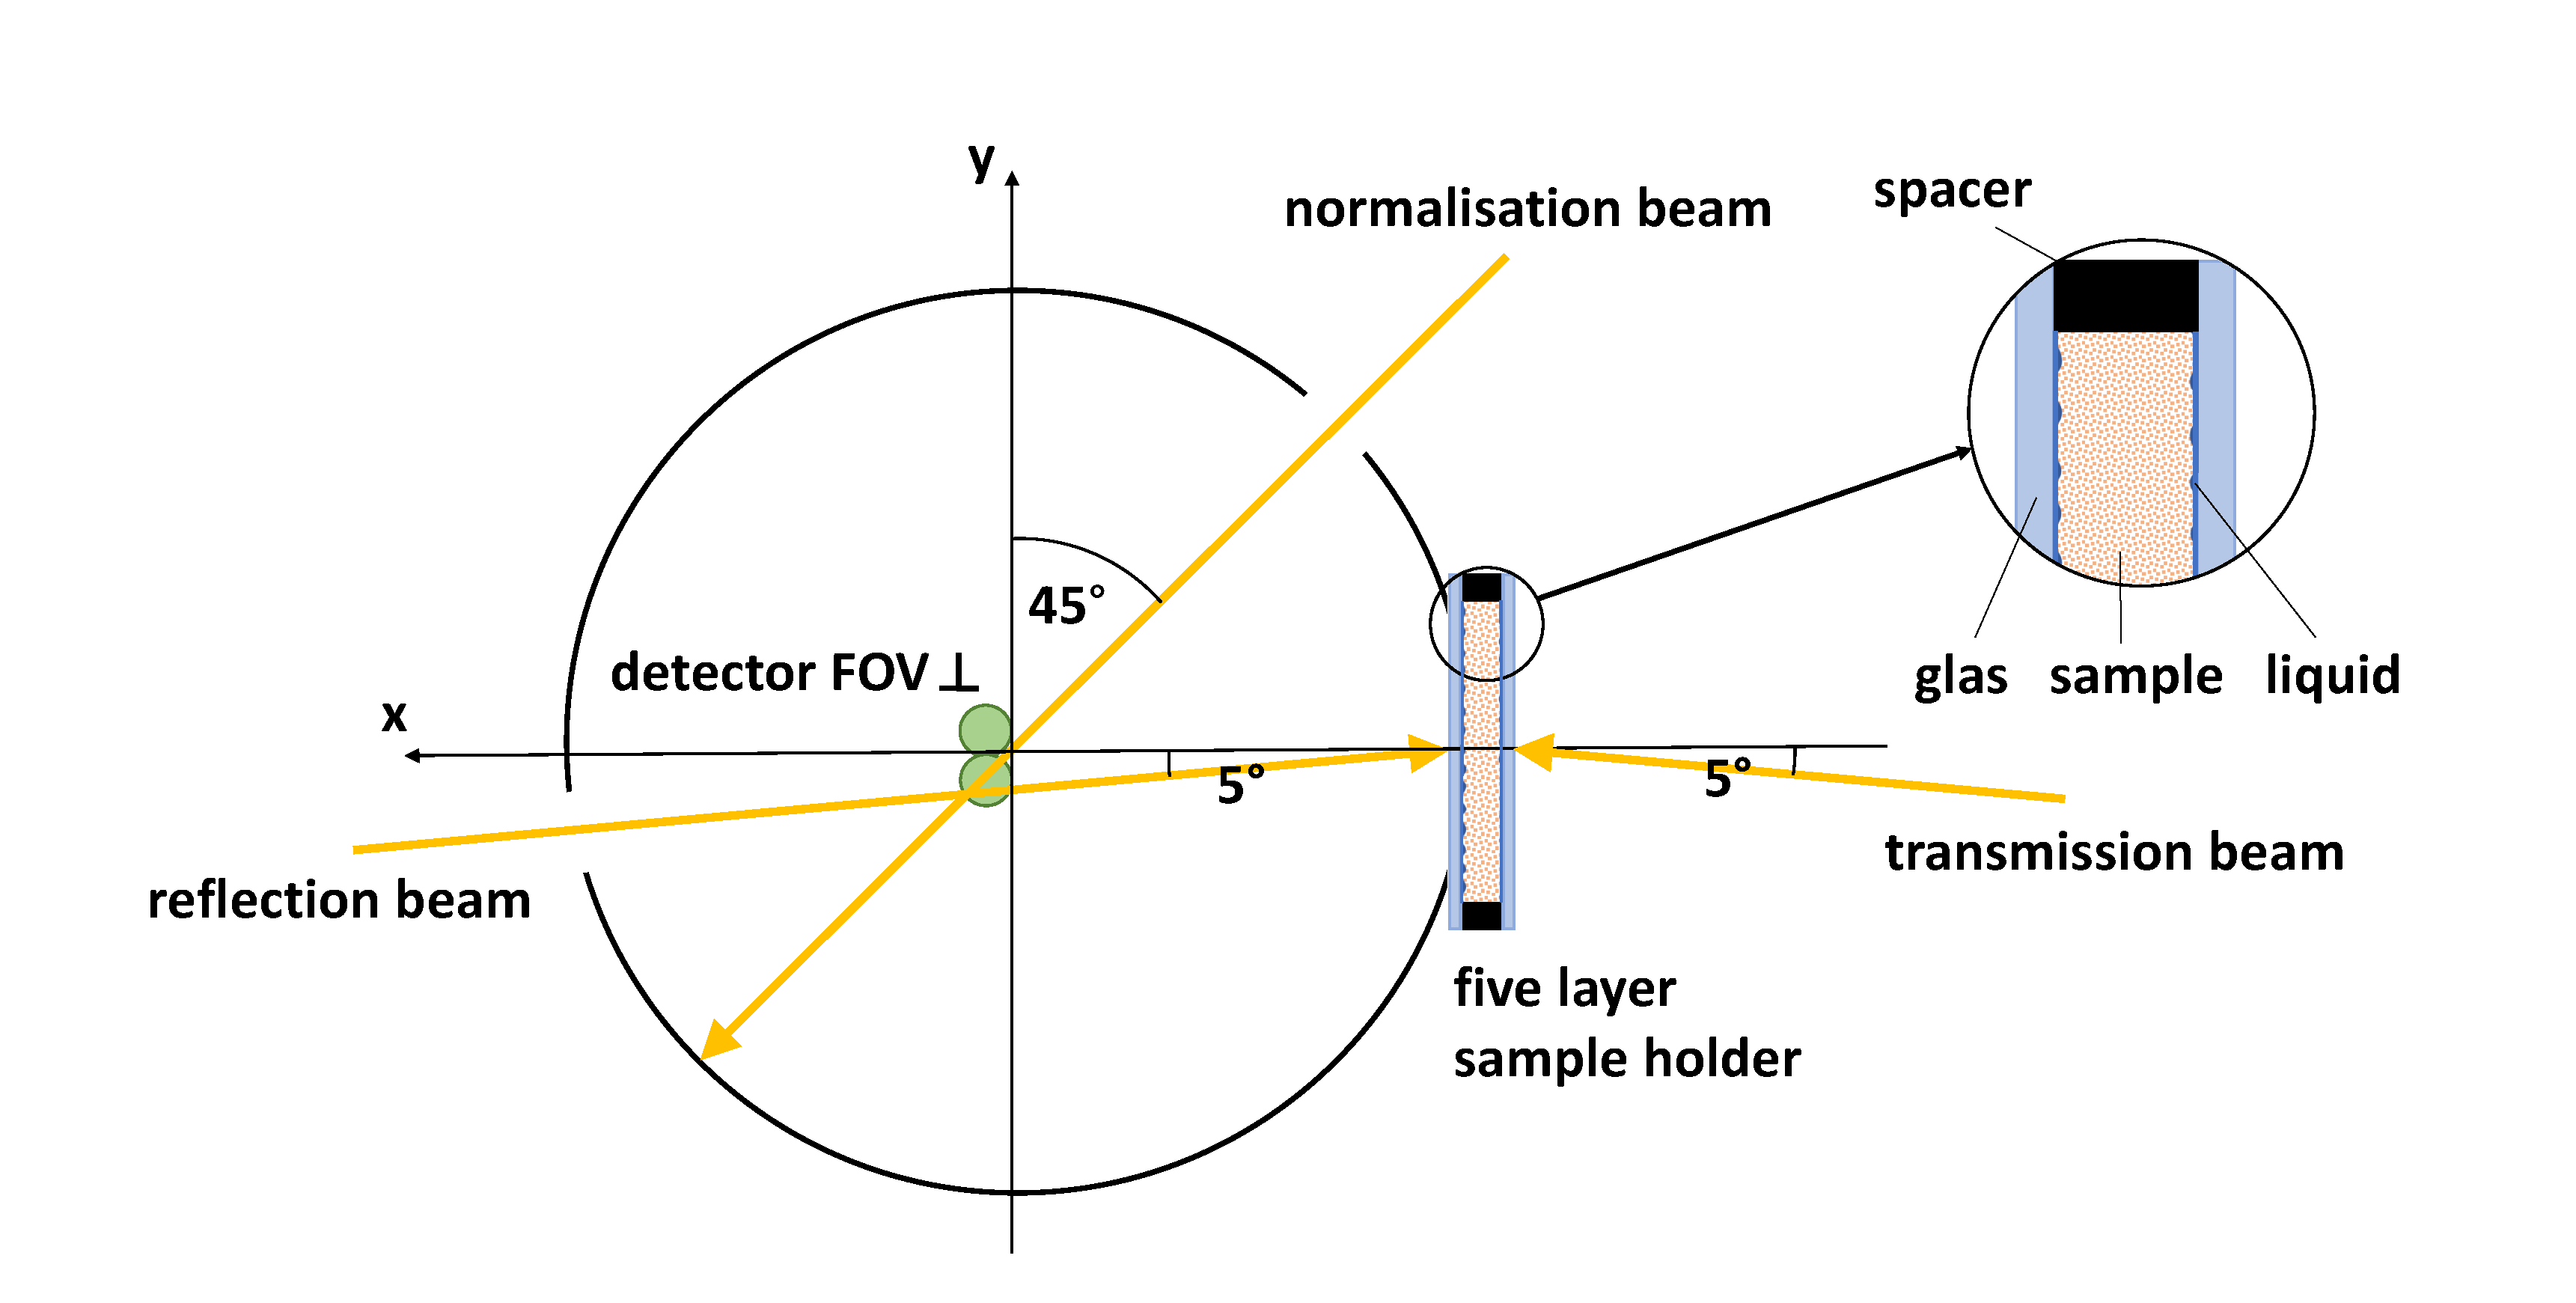
2.1. Experimental Setup and Evaluation Process
2.2. Sample Preparation
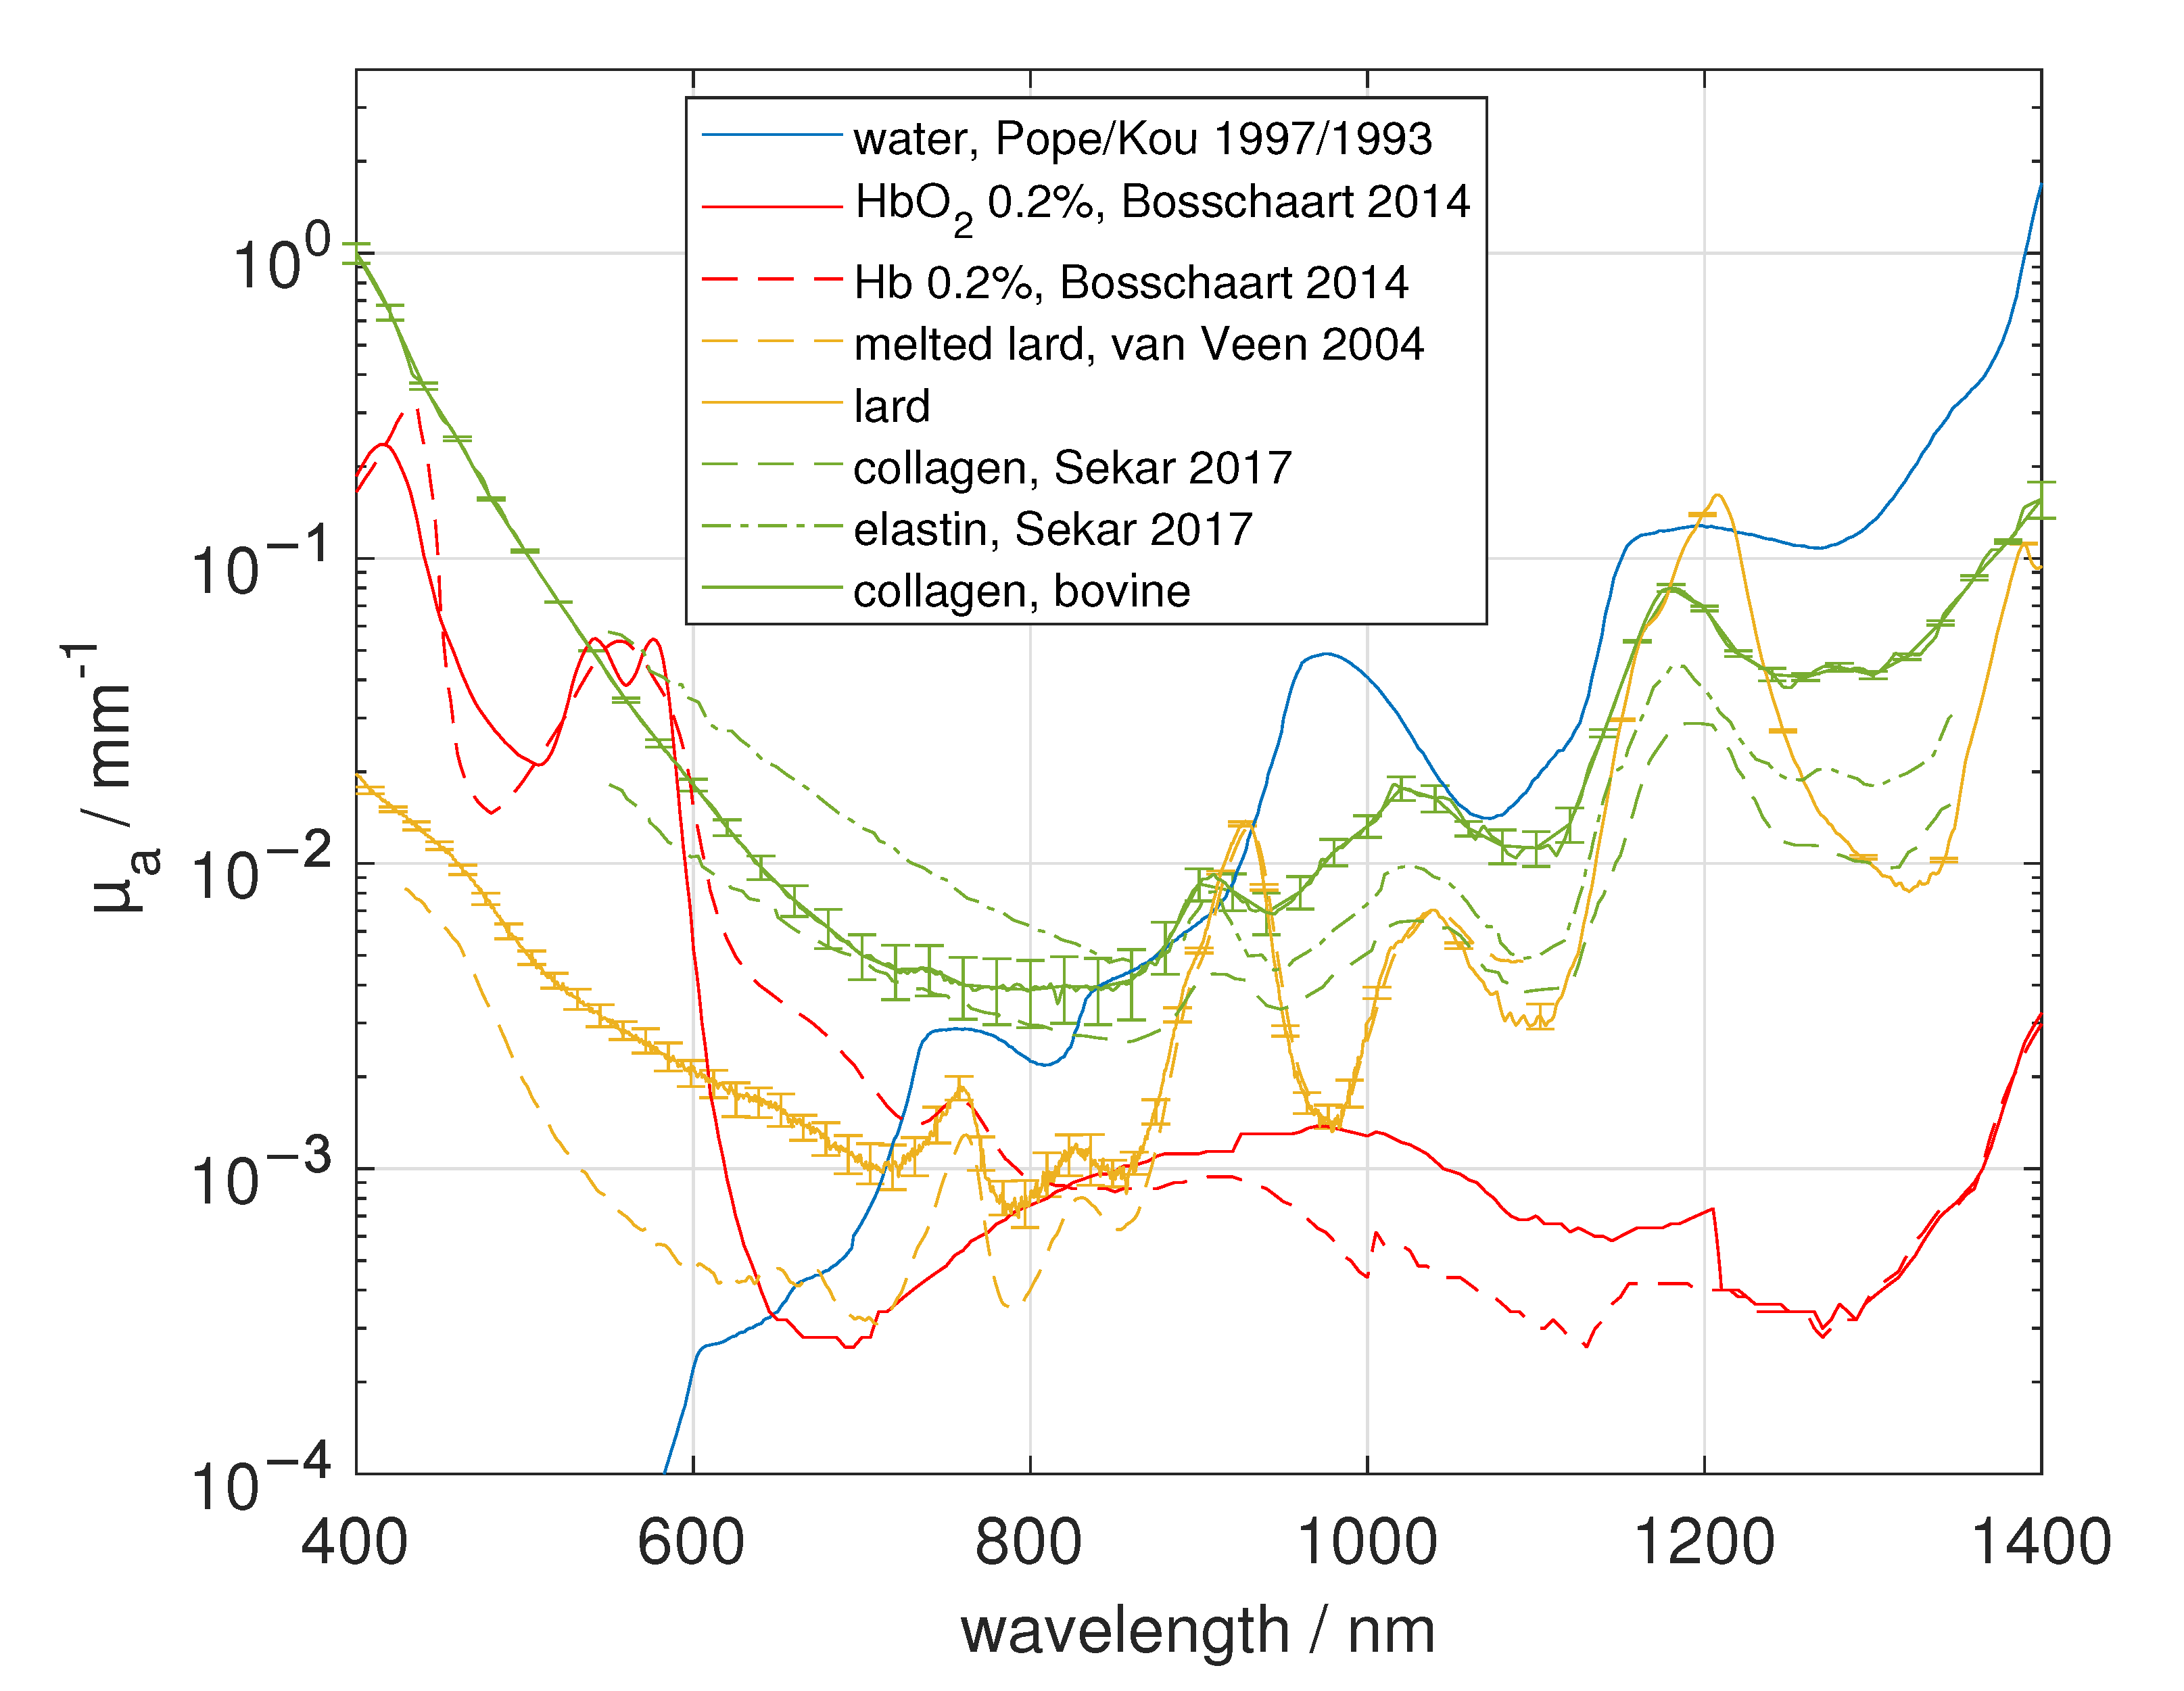
2.3. Main Tissue Constituents and Analysis
3. Results
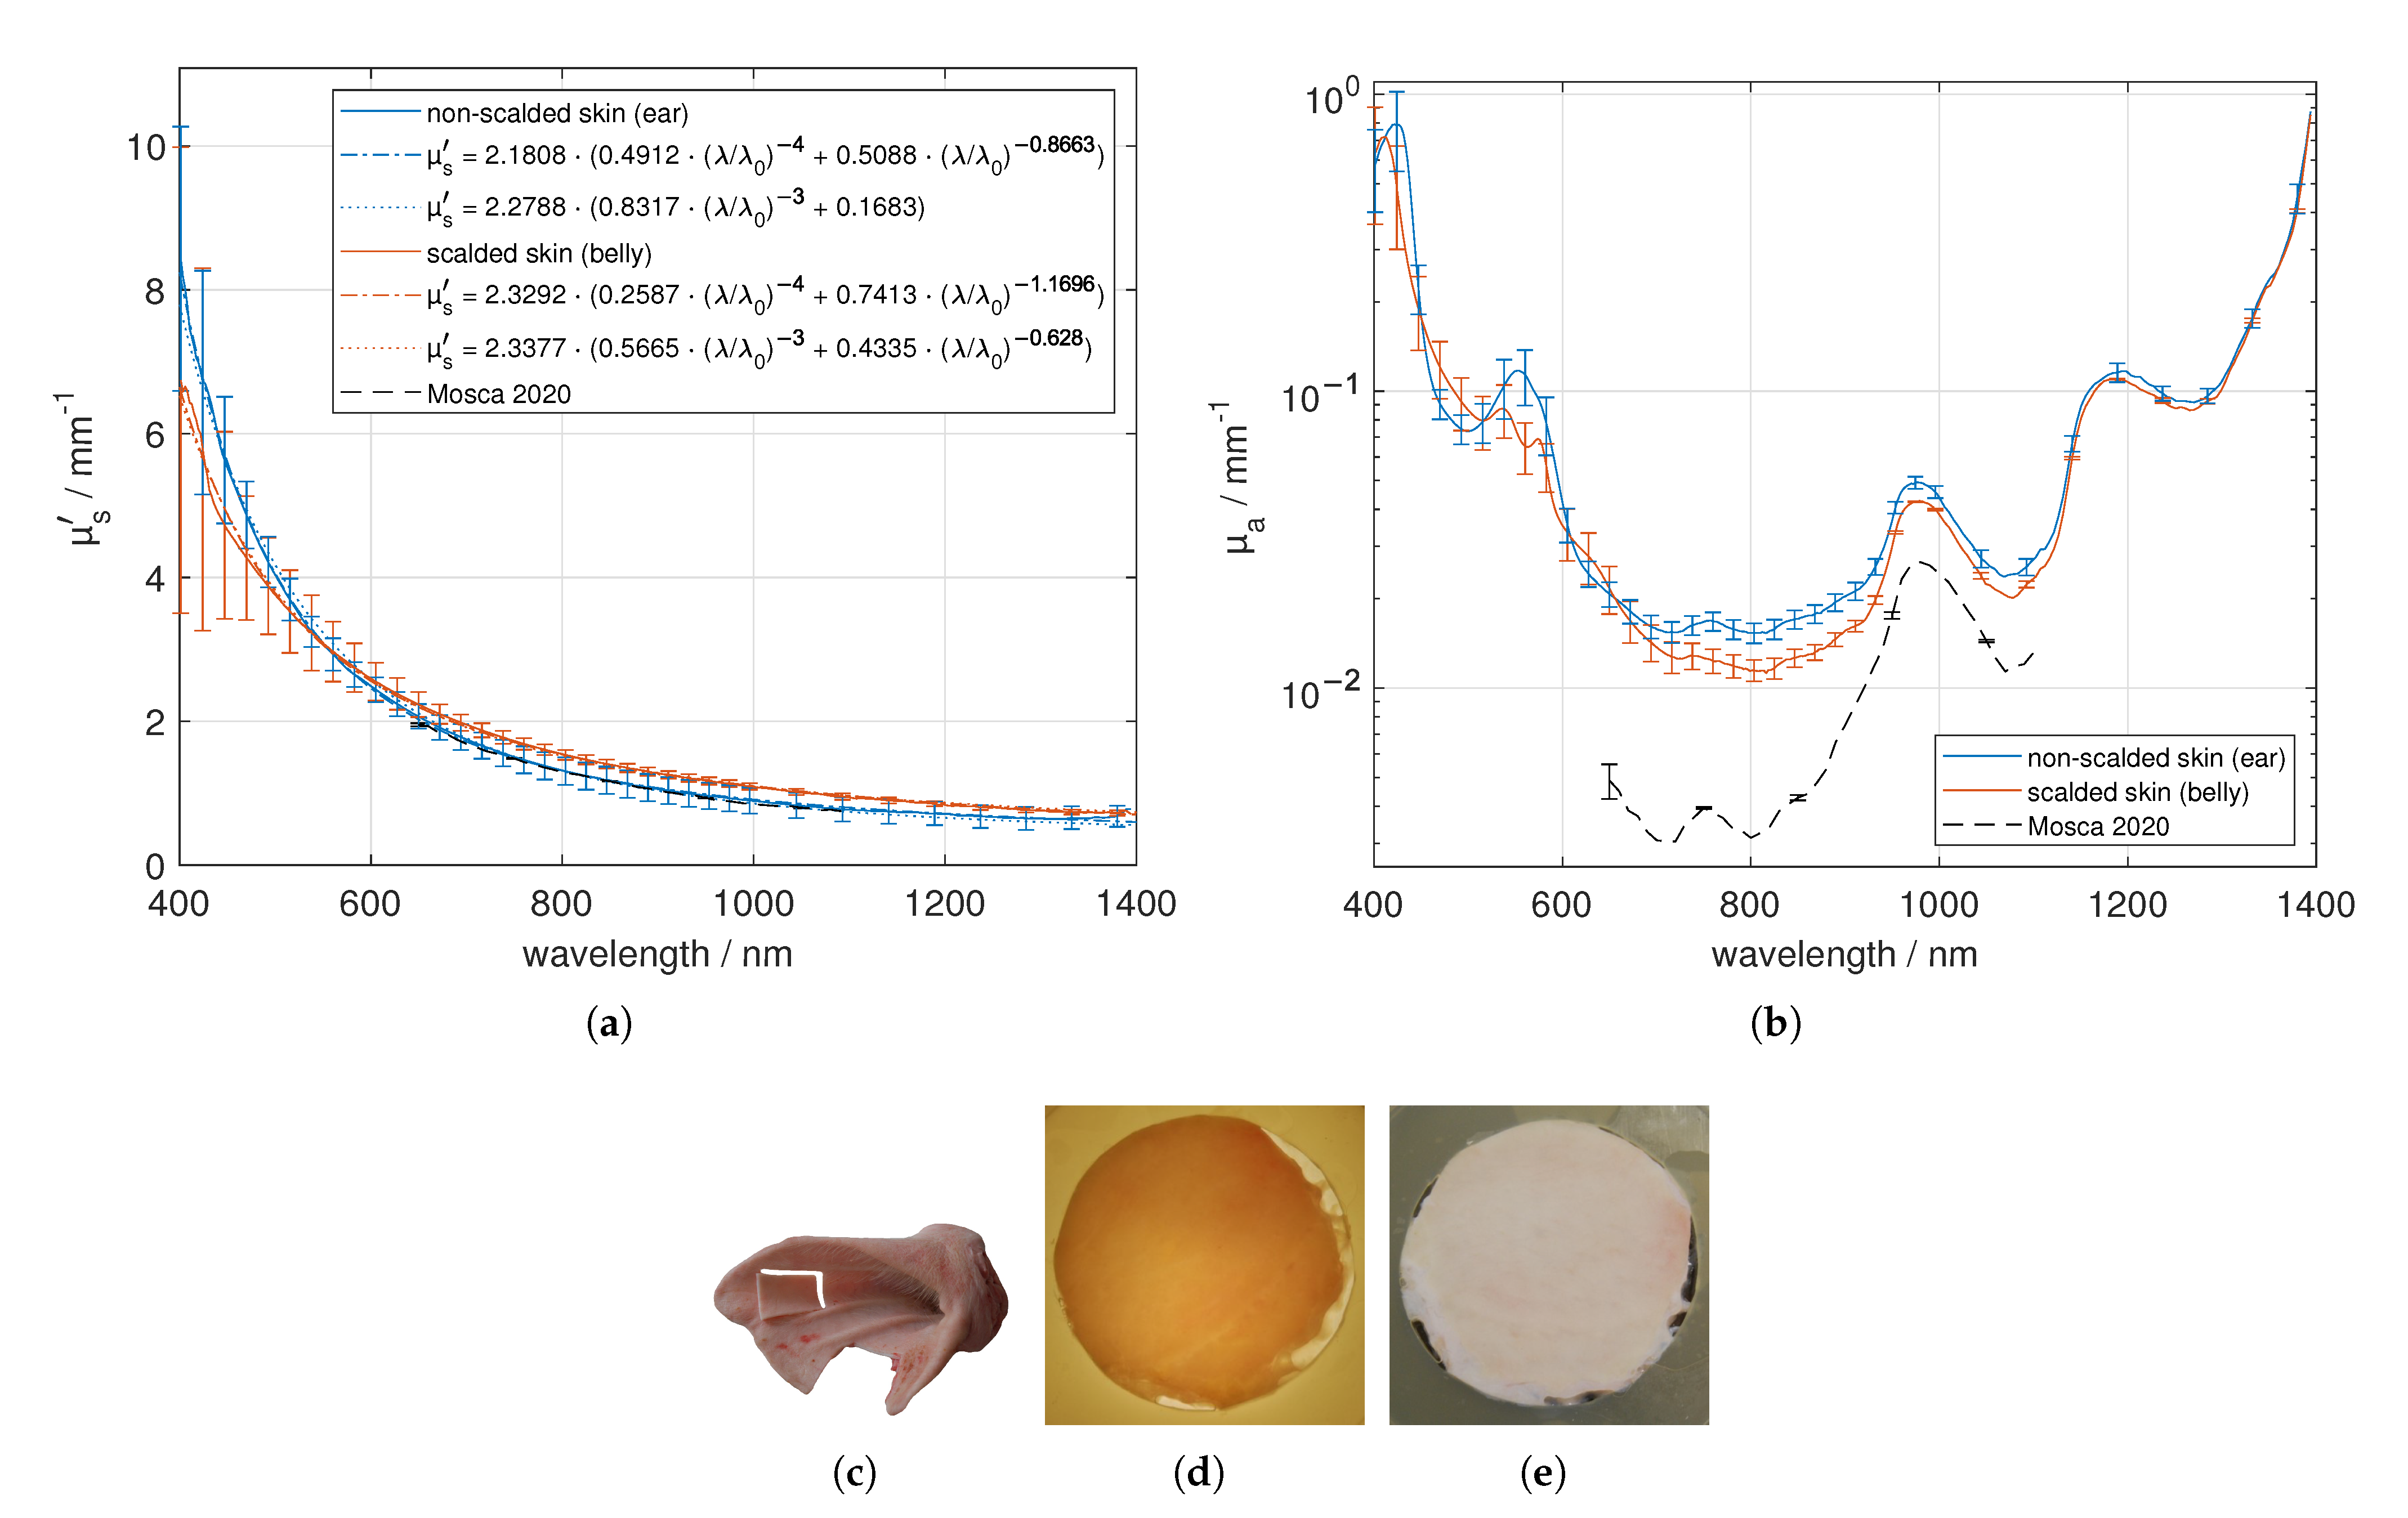
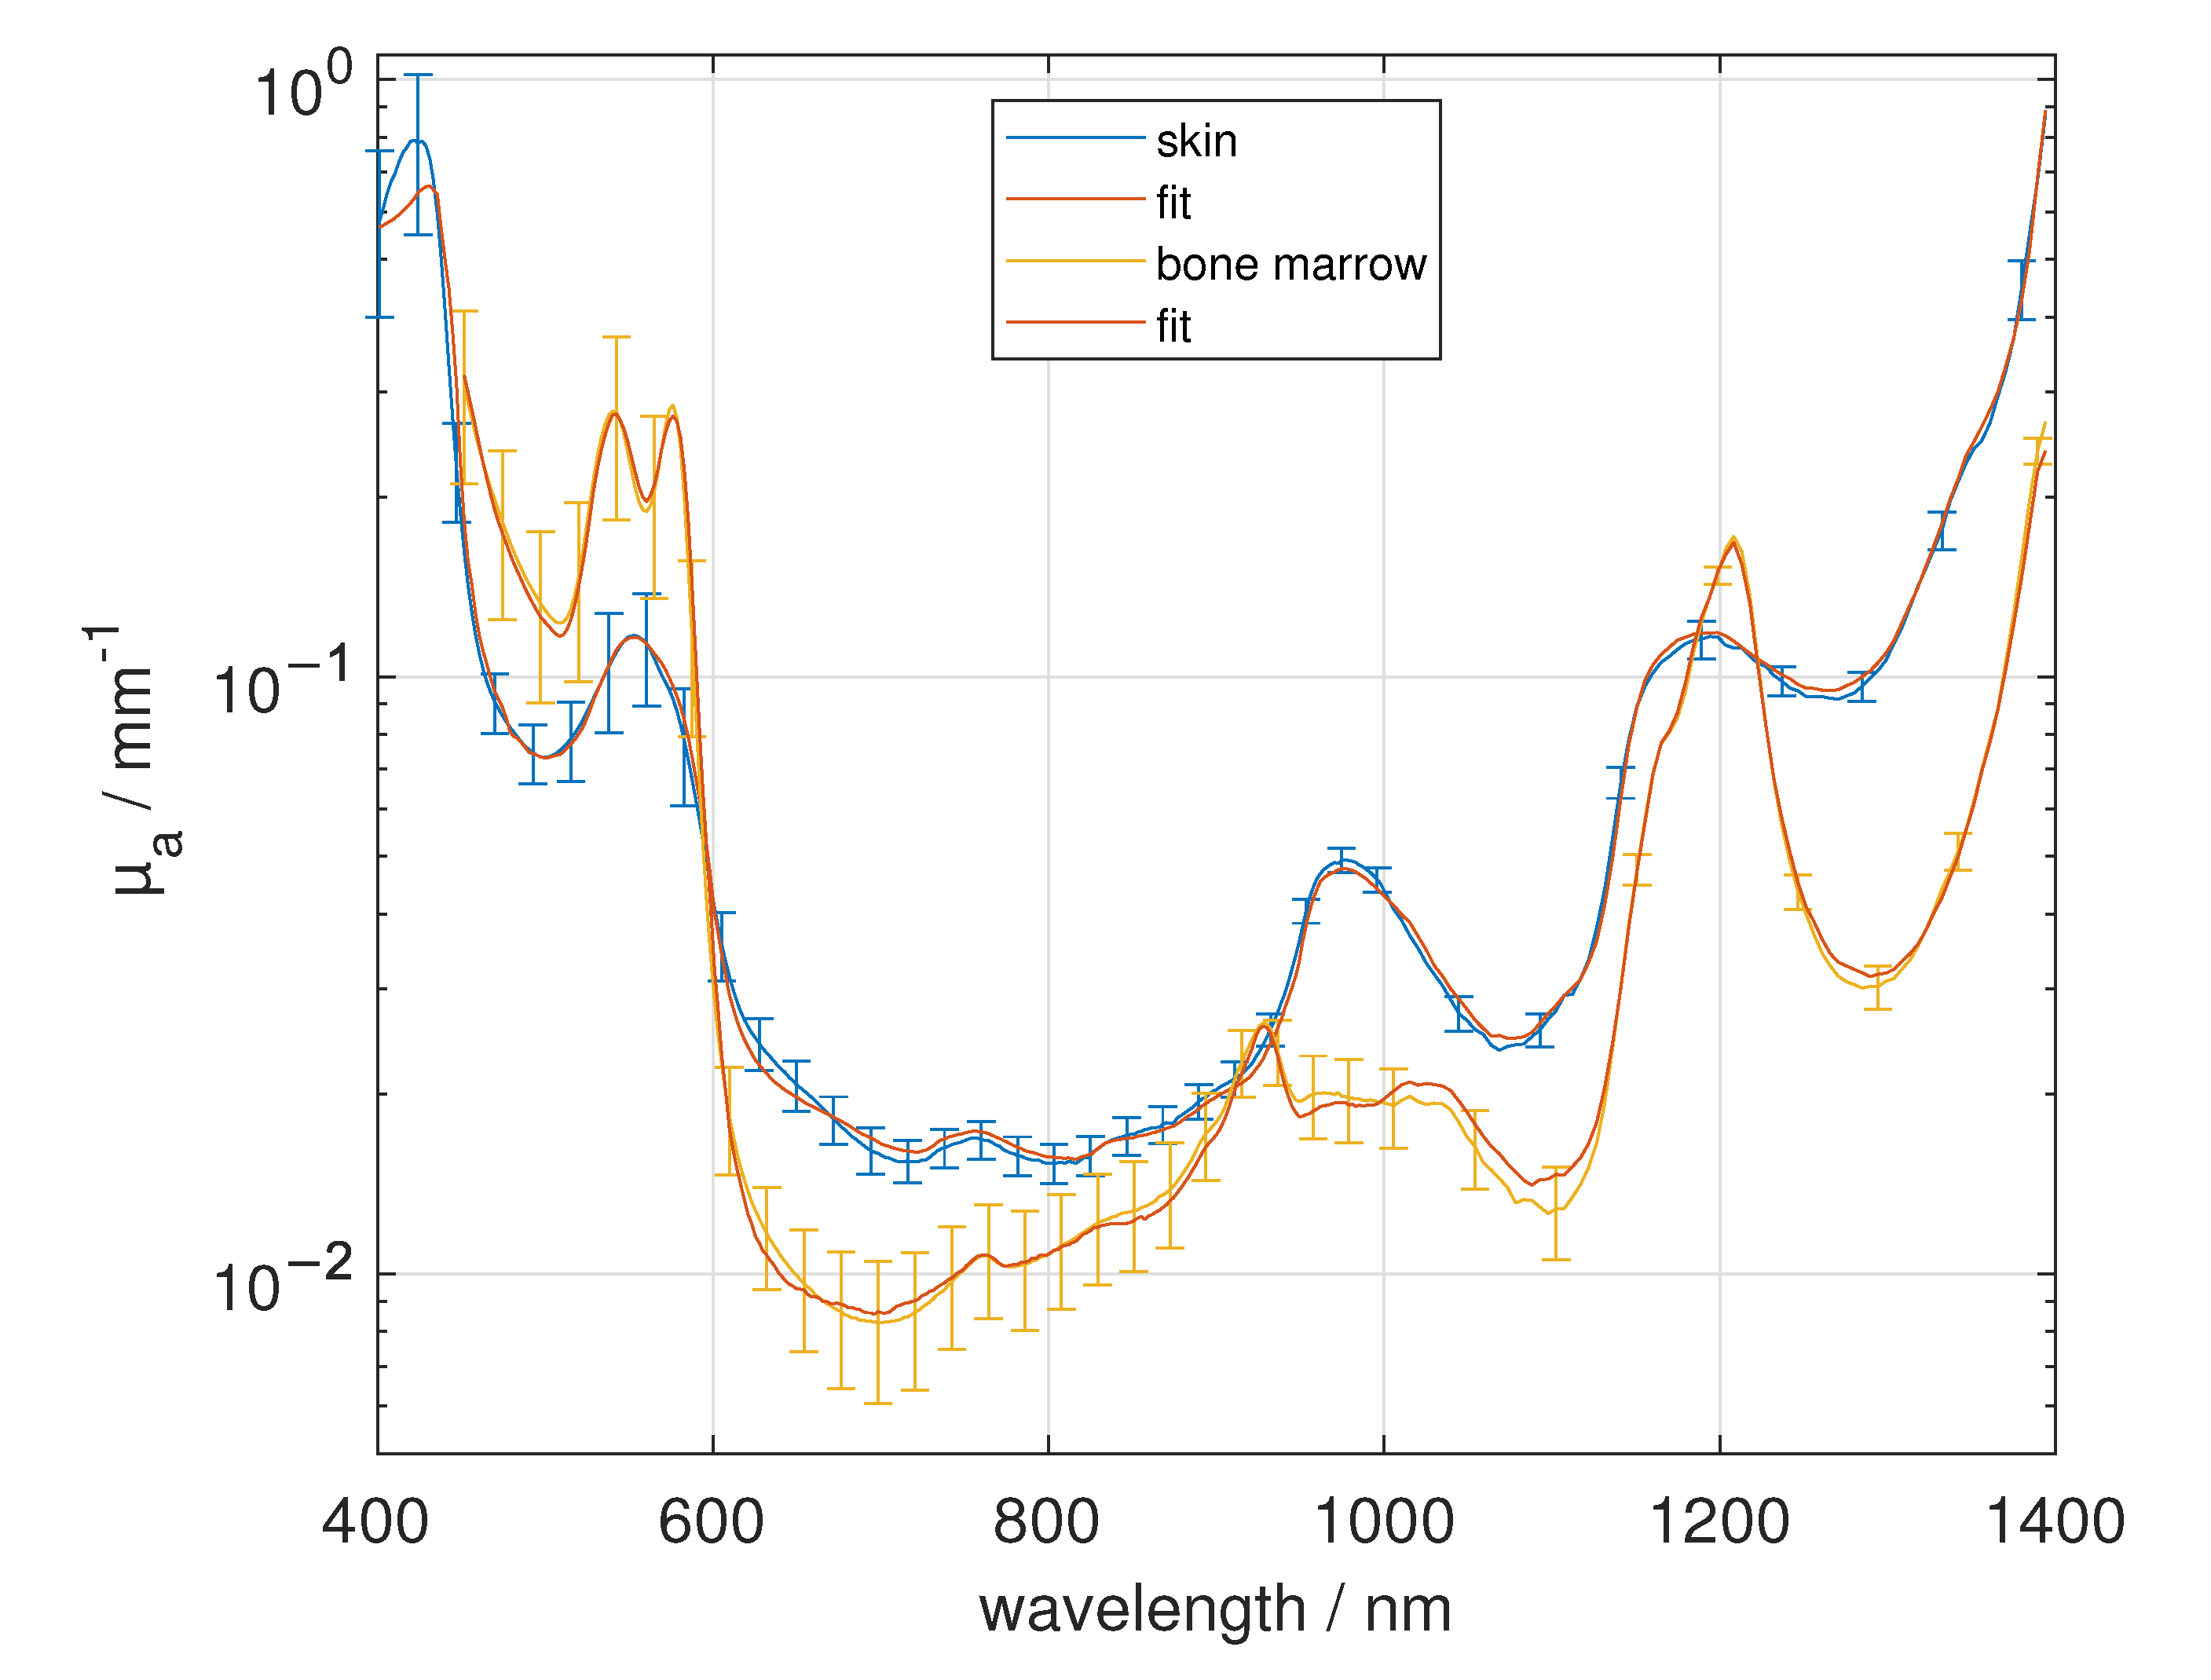
3.1. Skin
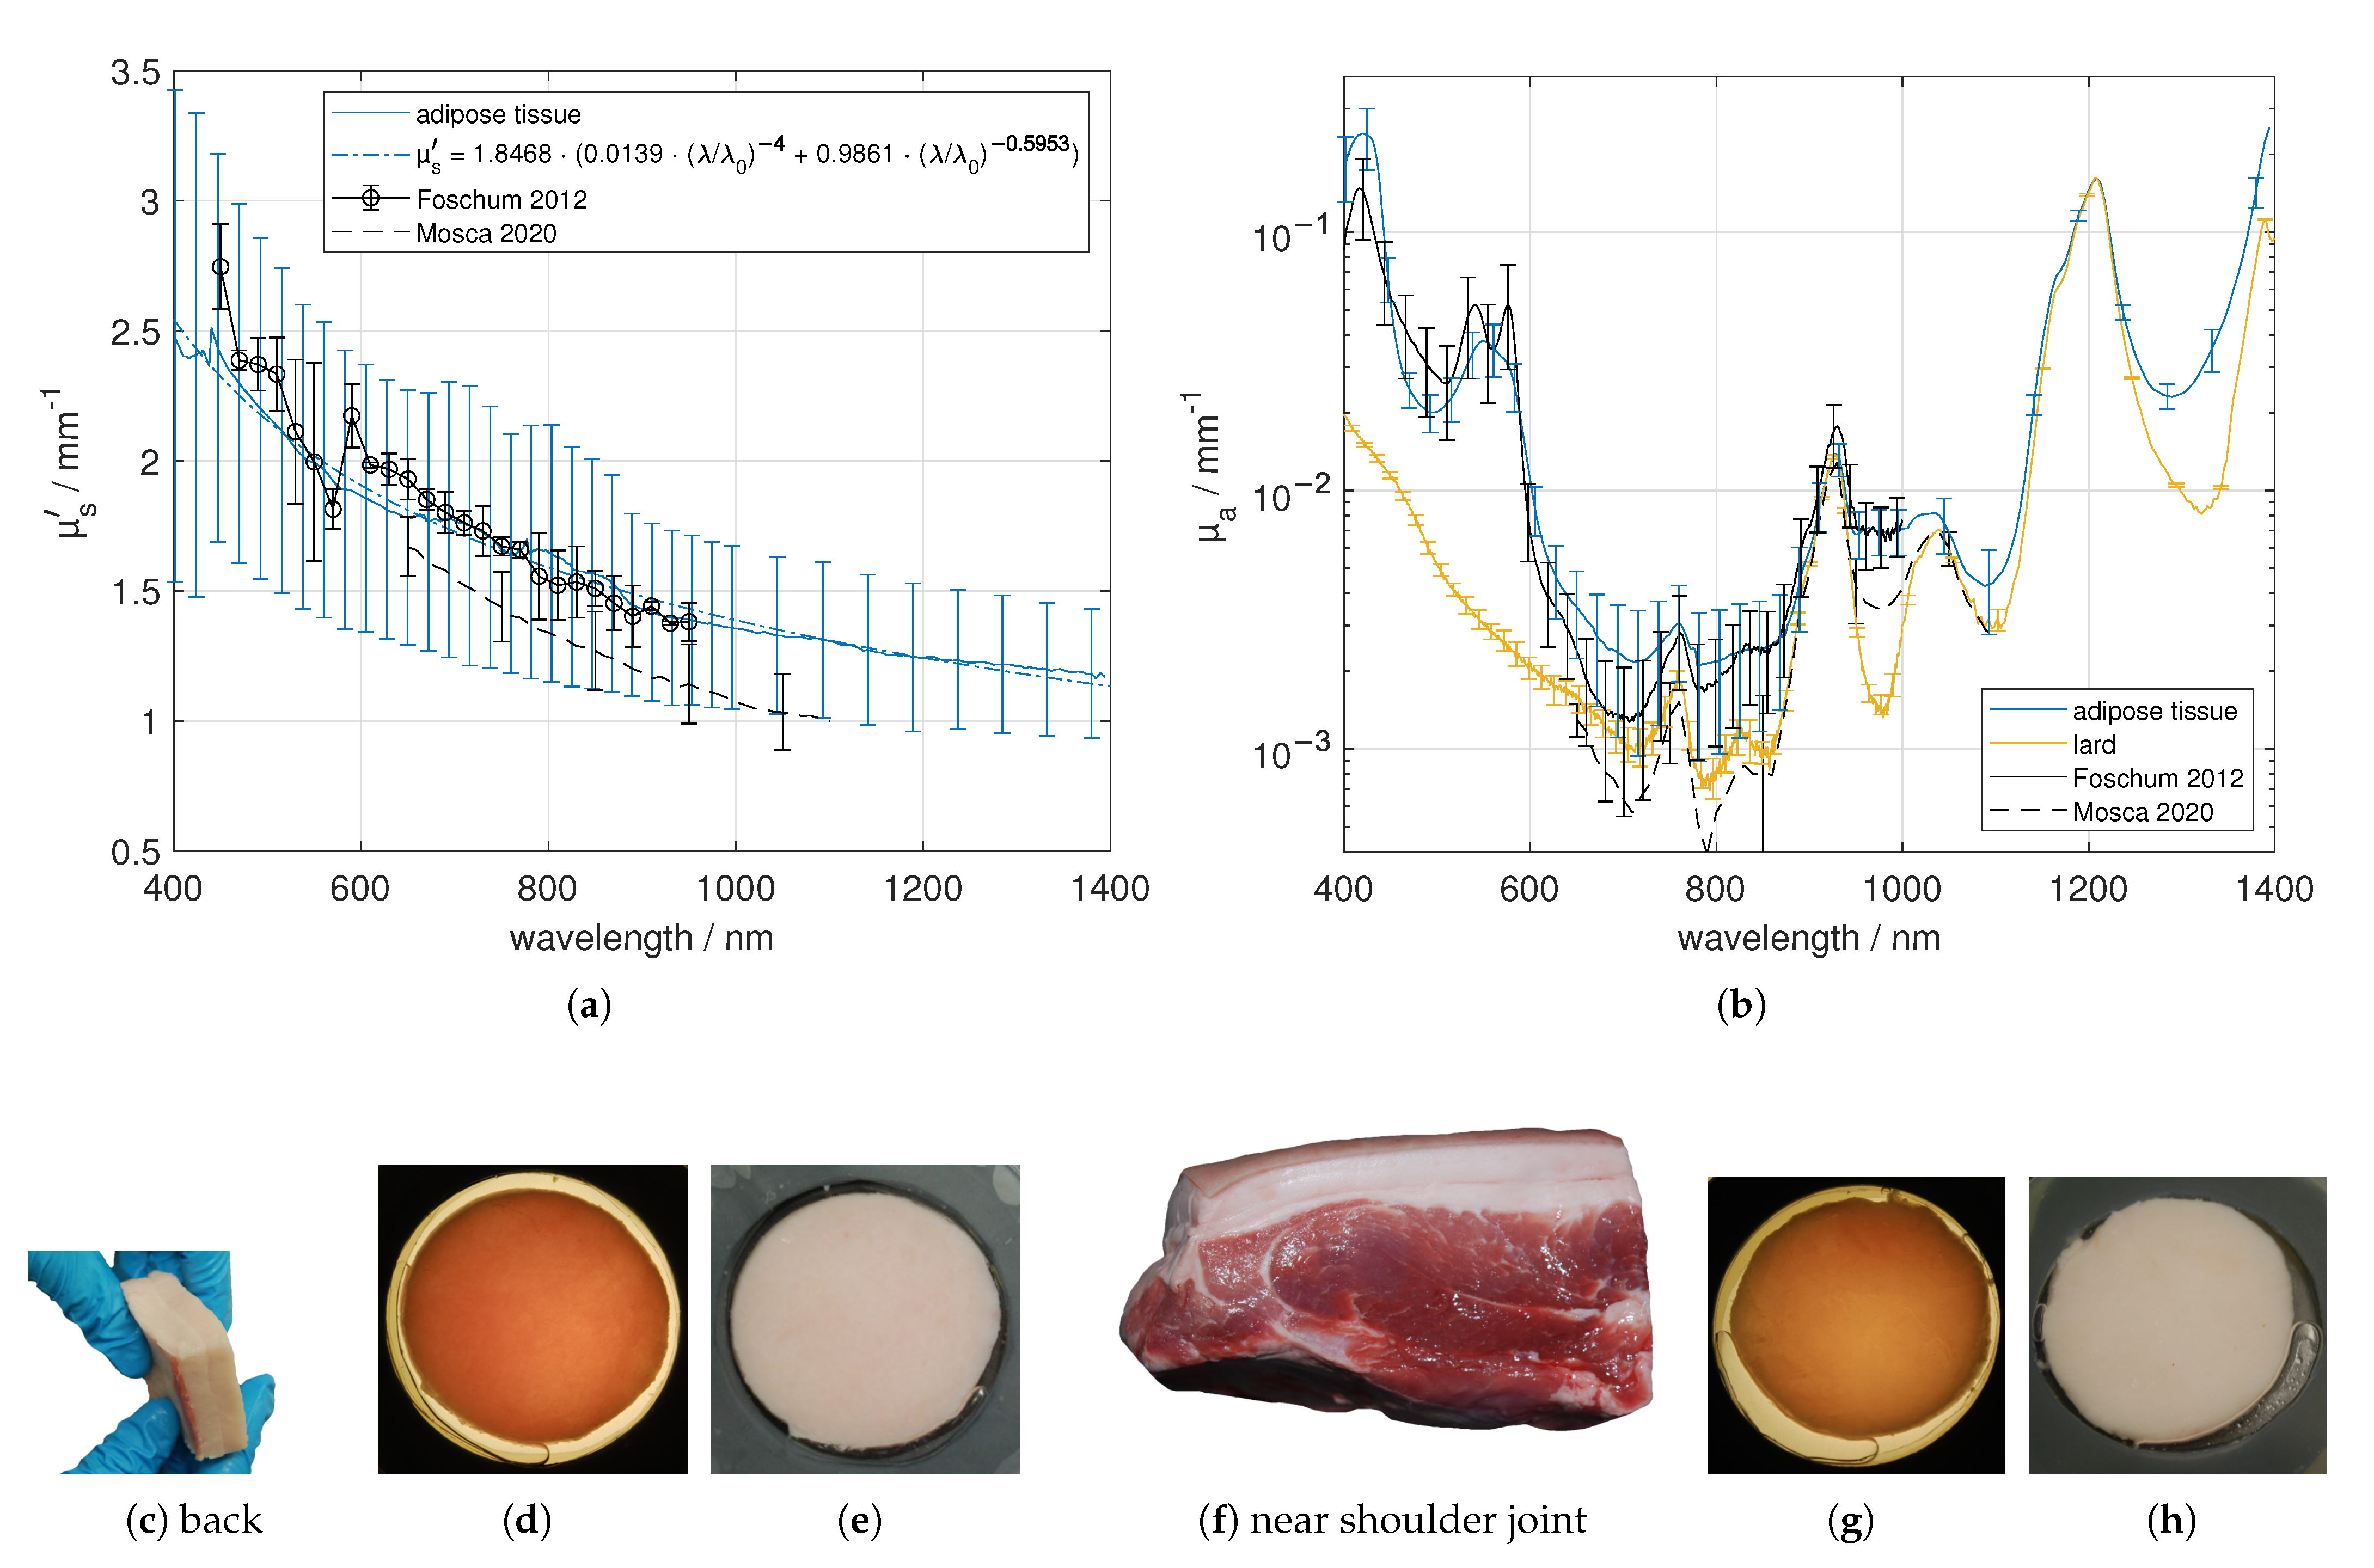
3.2. Adipose Tissue
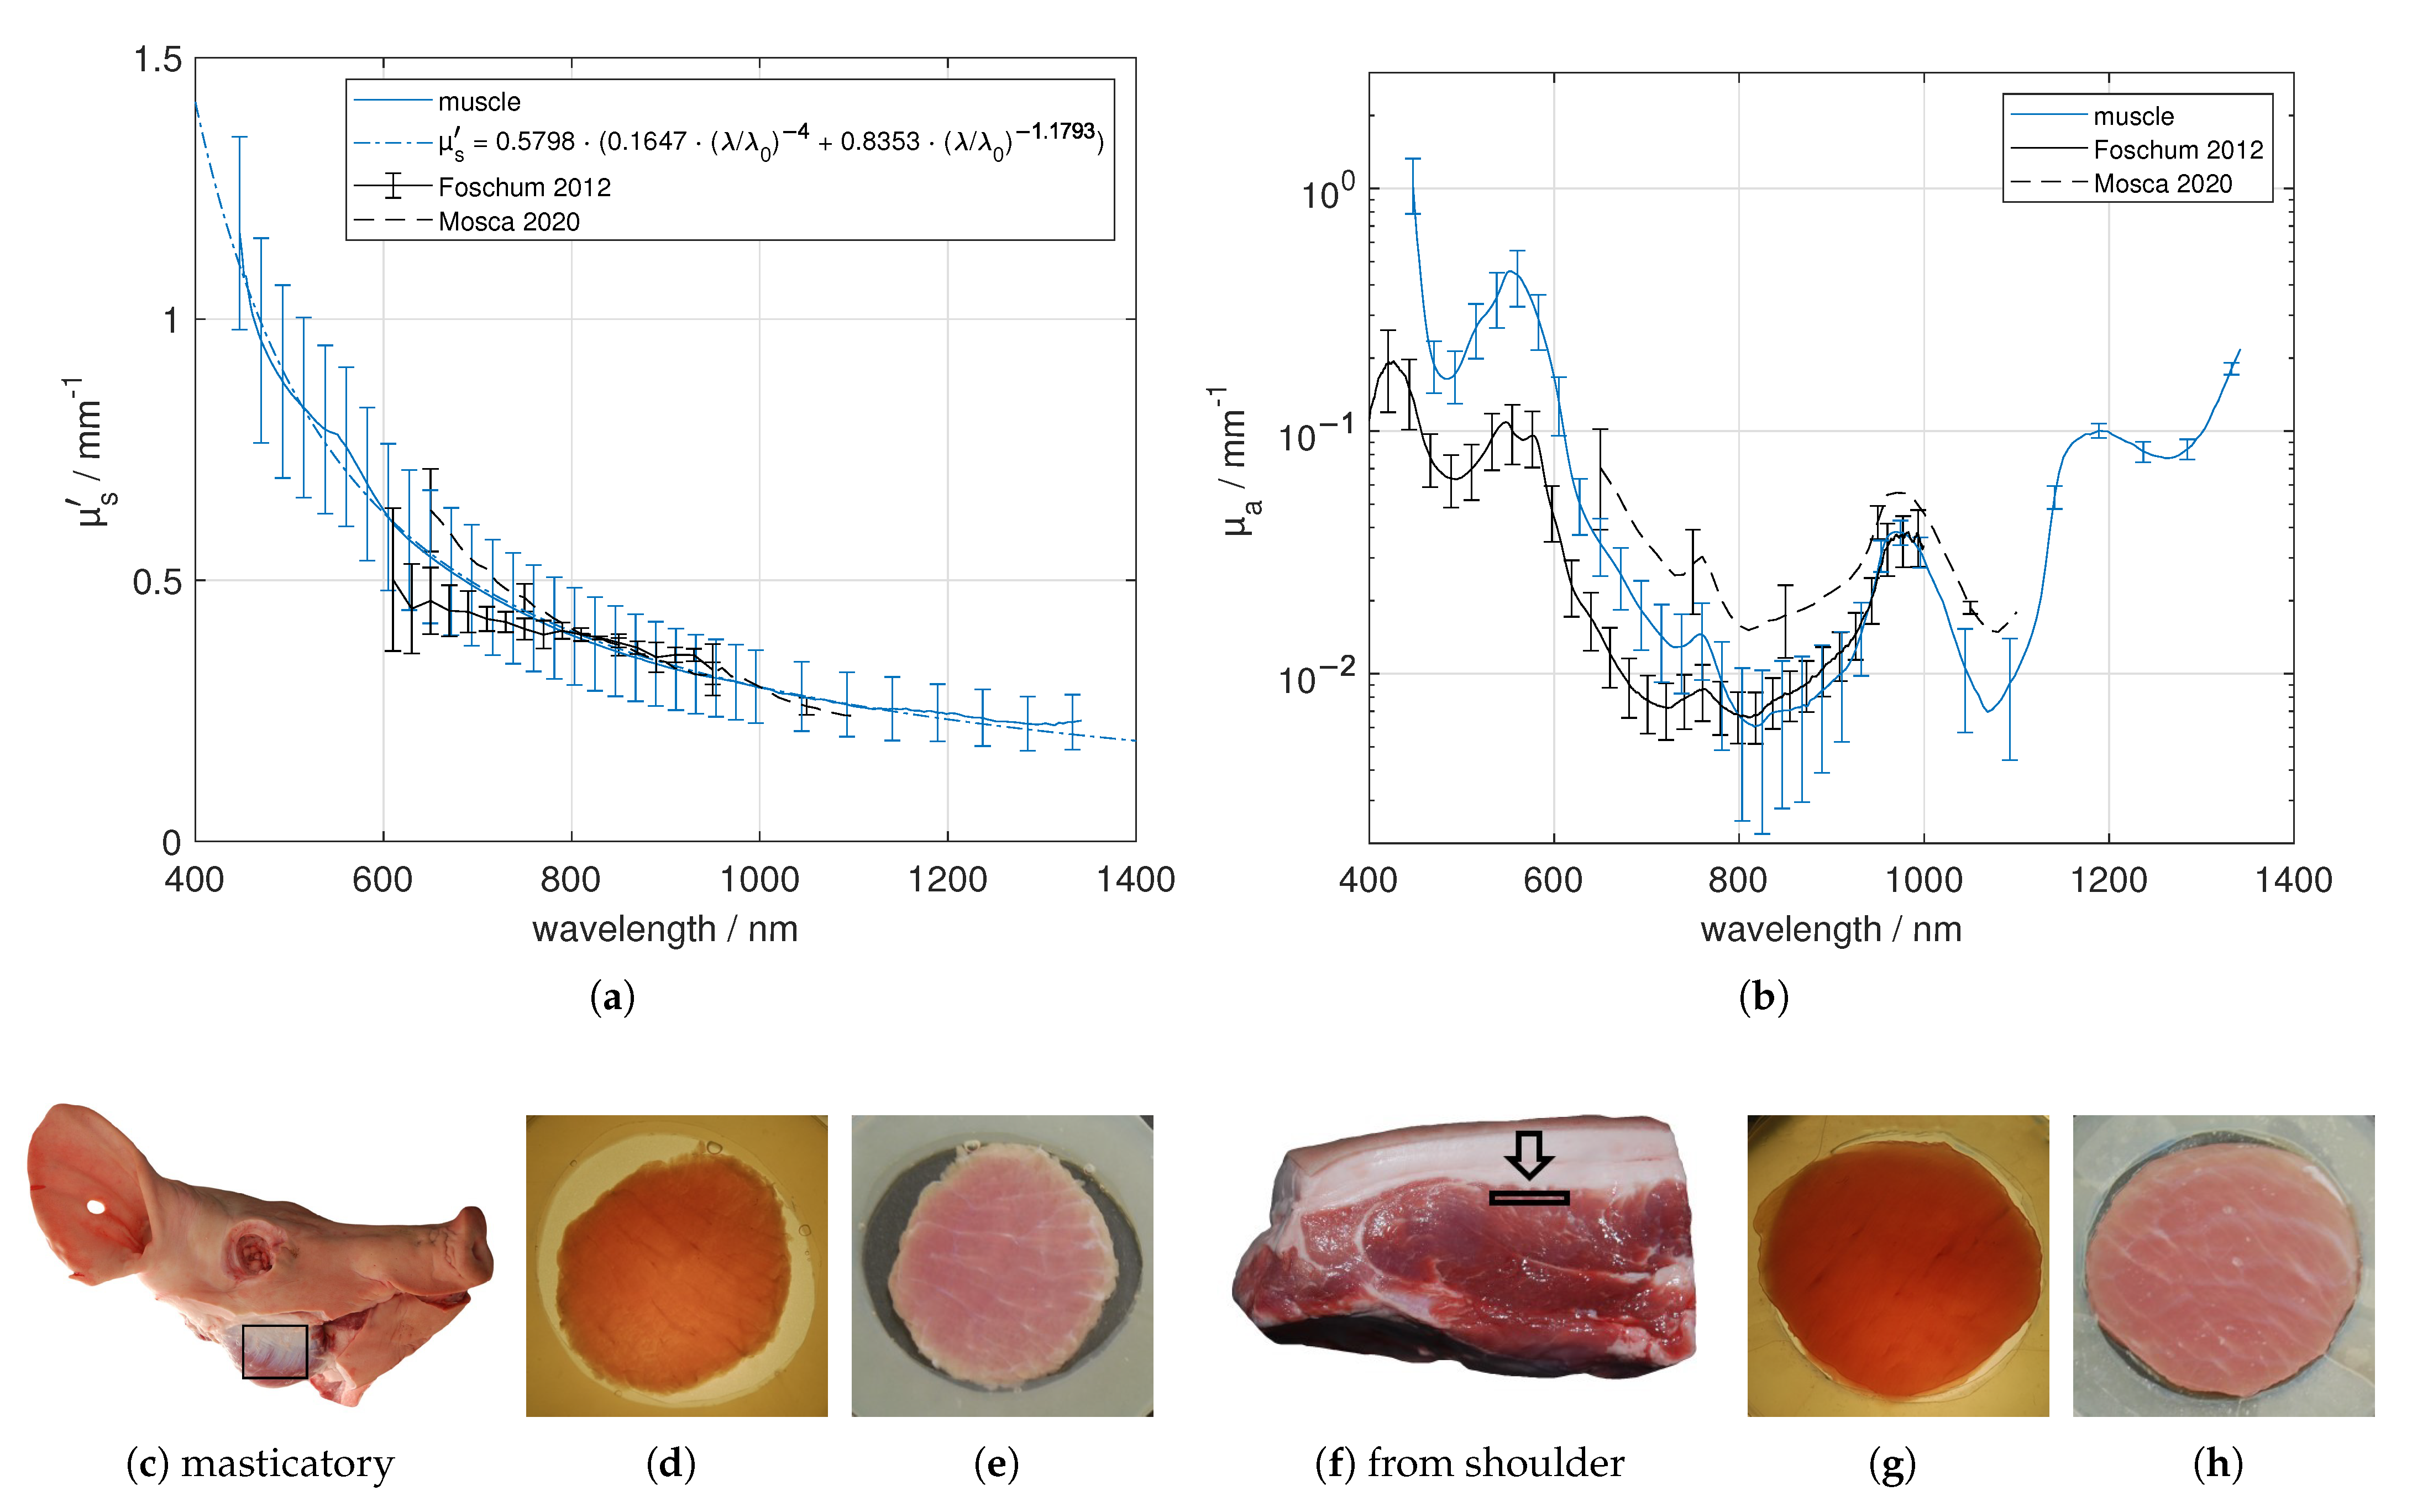
3.3. Muscle
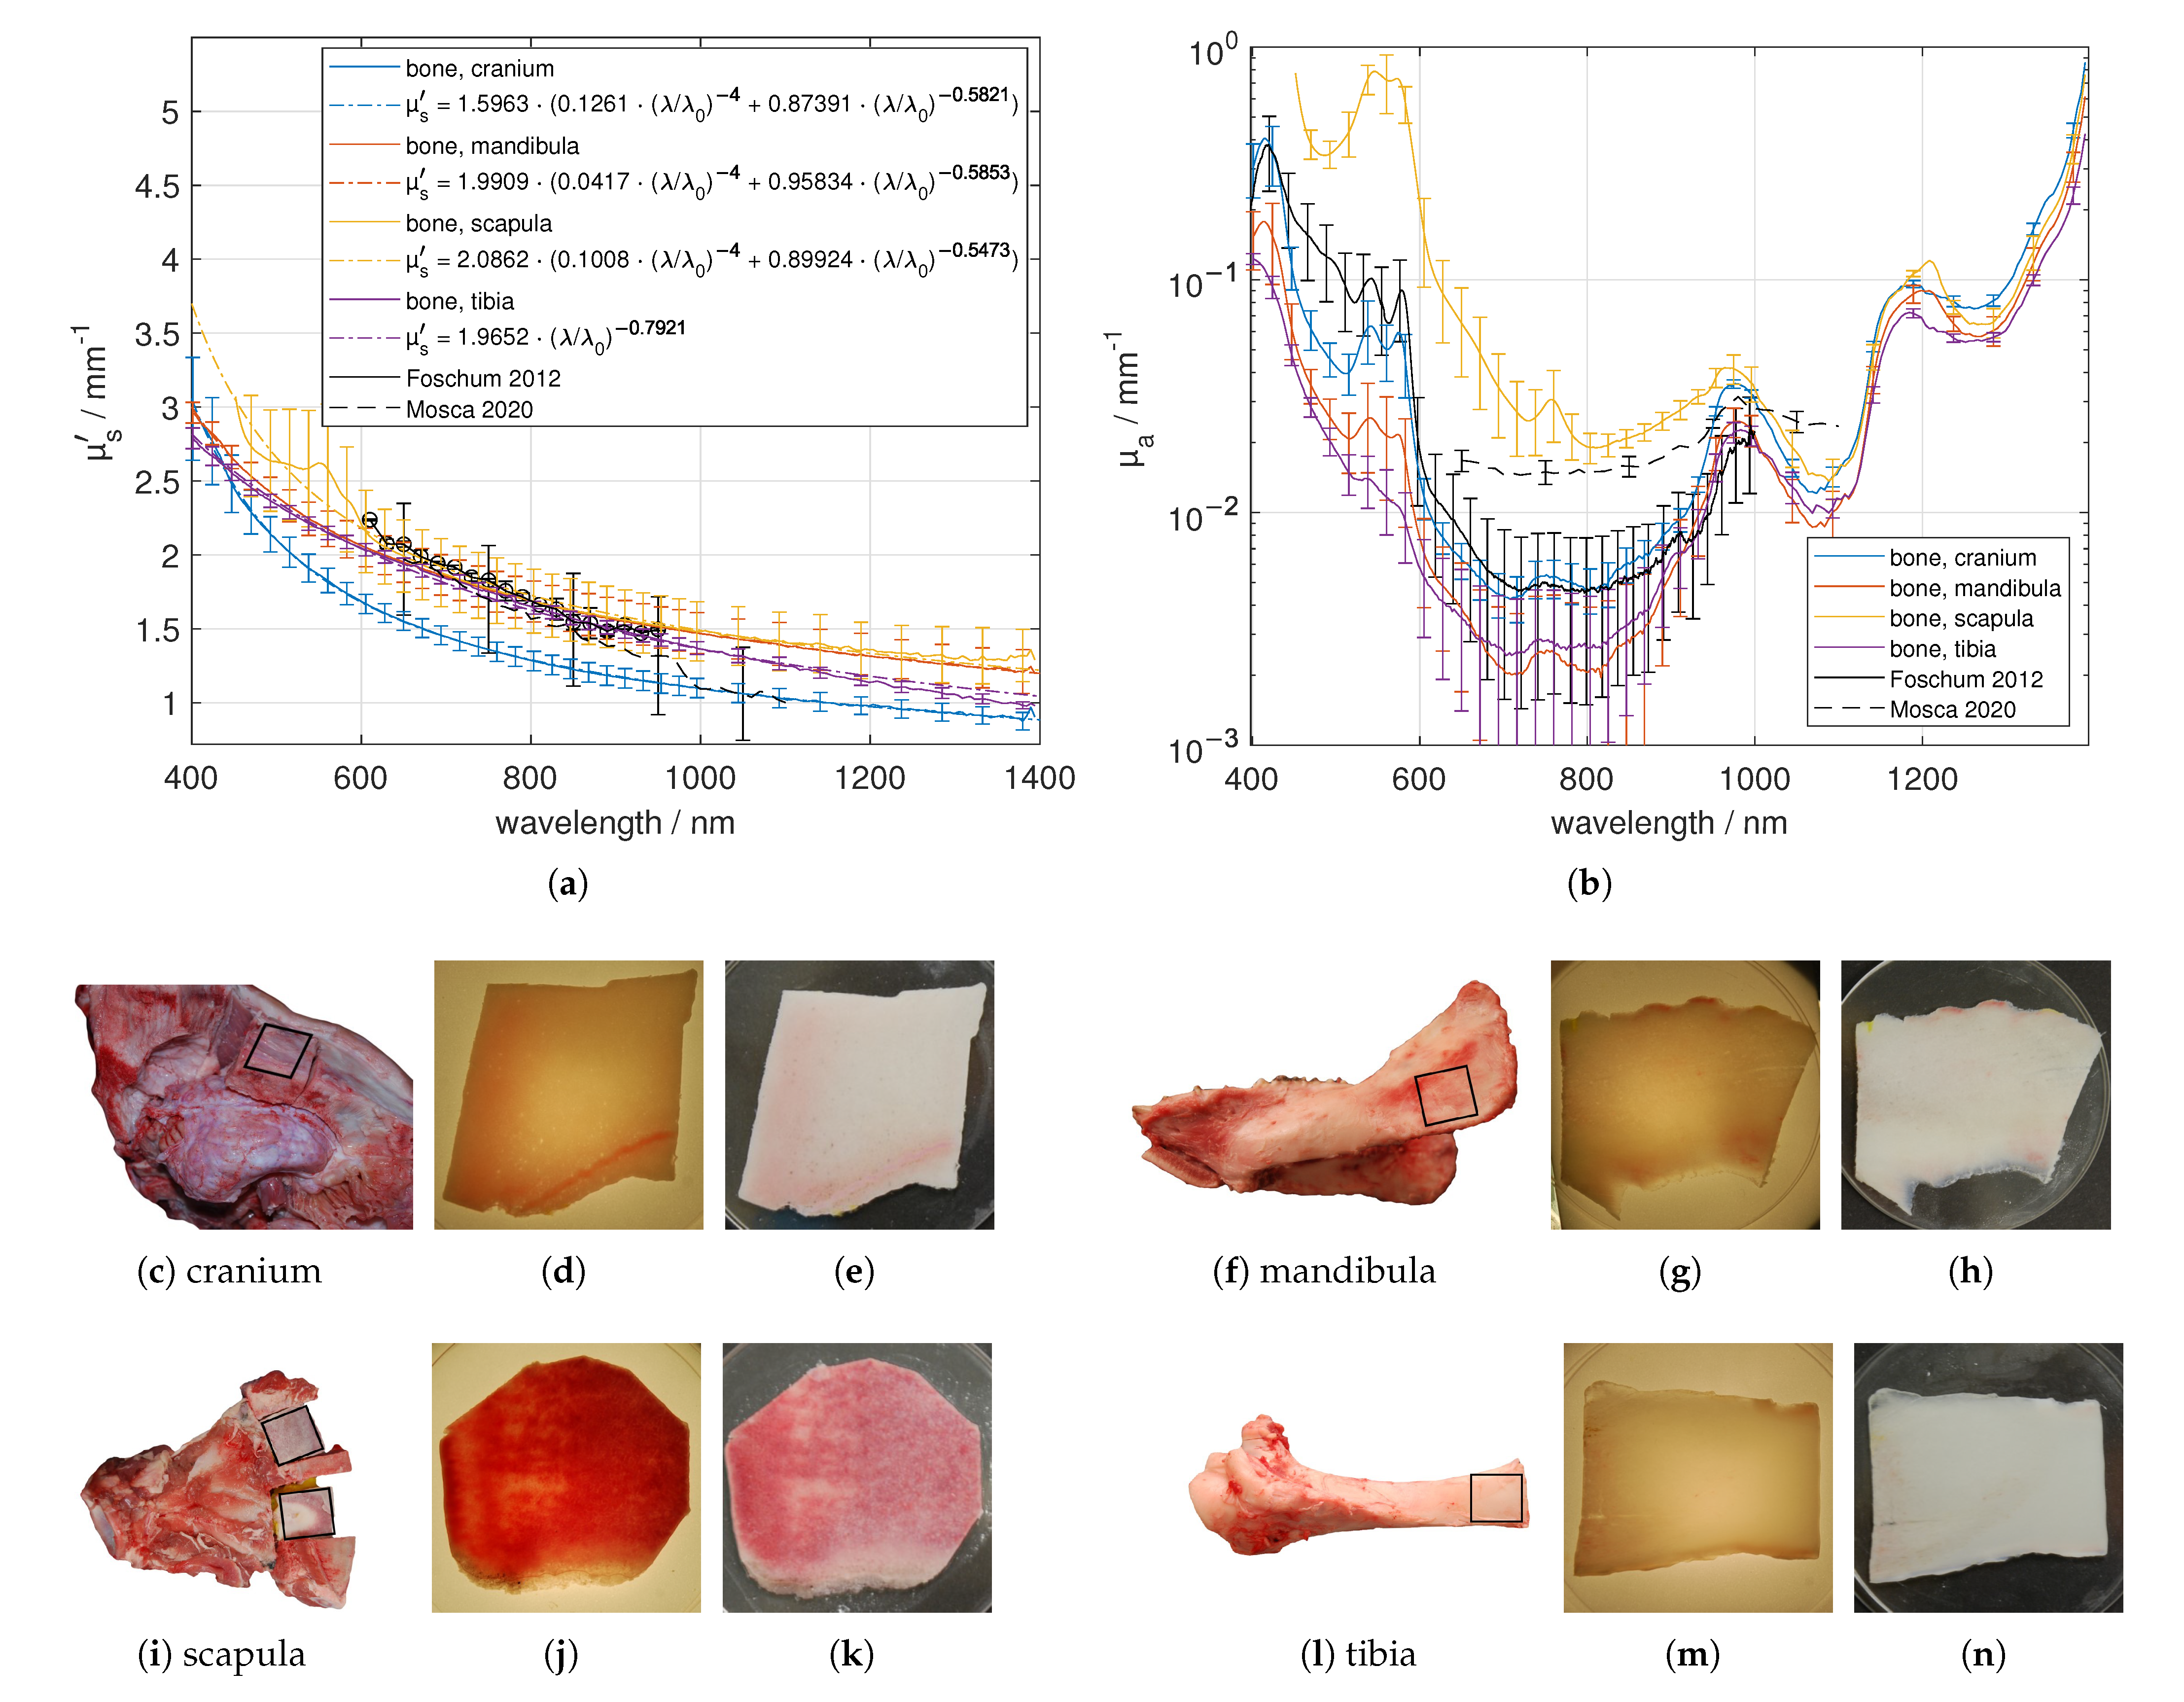
3.4. Bone
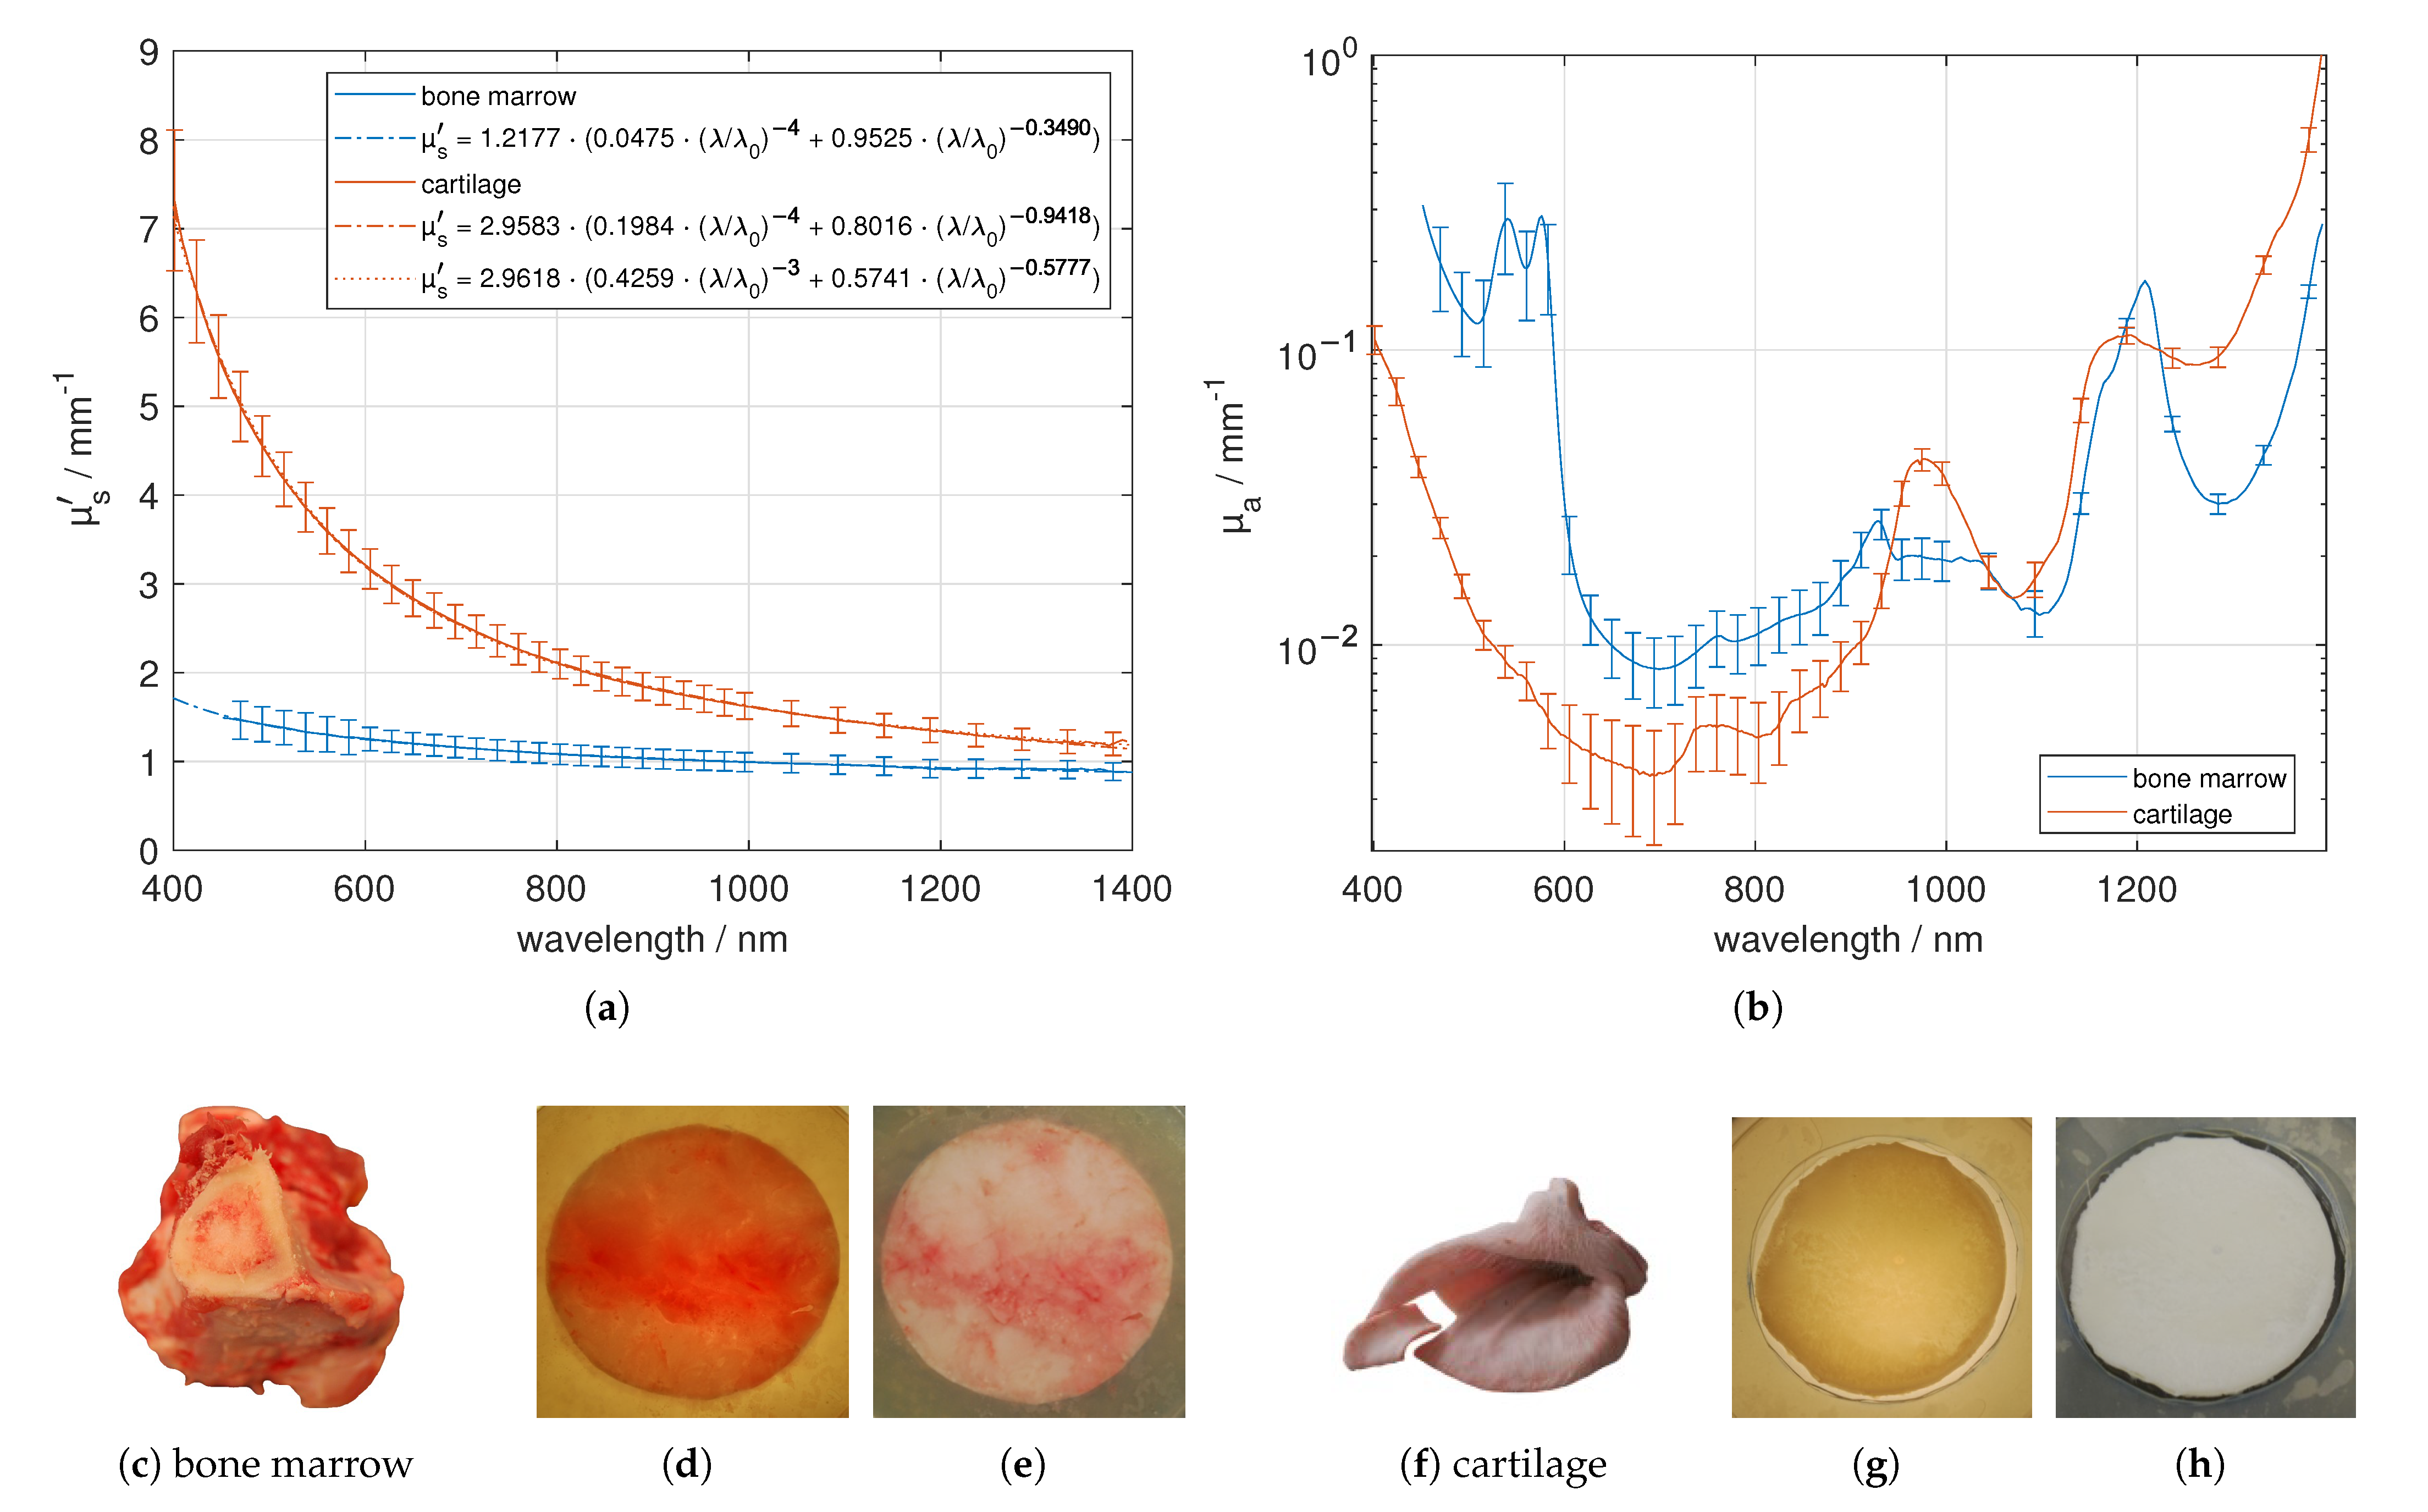
3.5. Bone Marrow and Cartilage
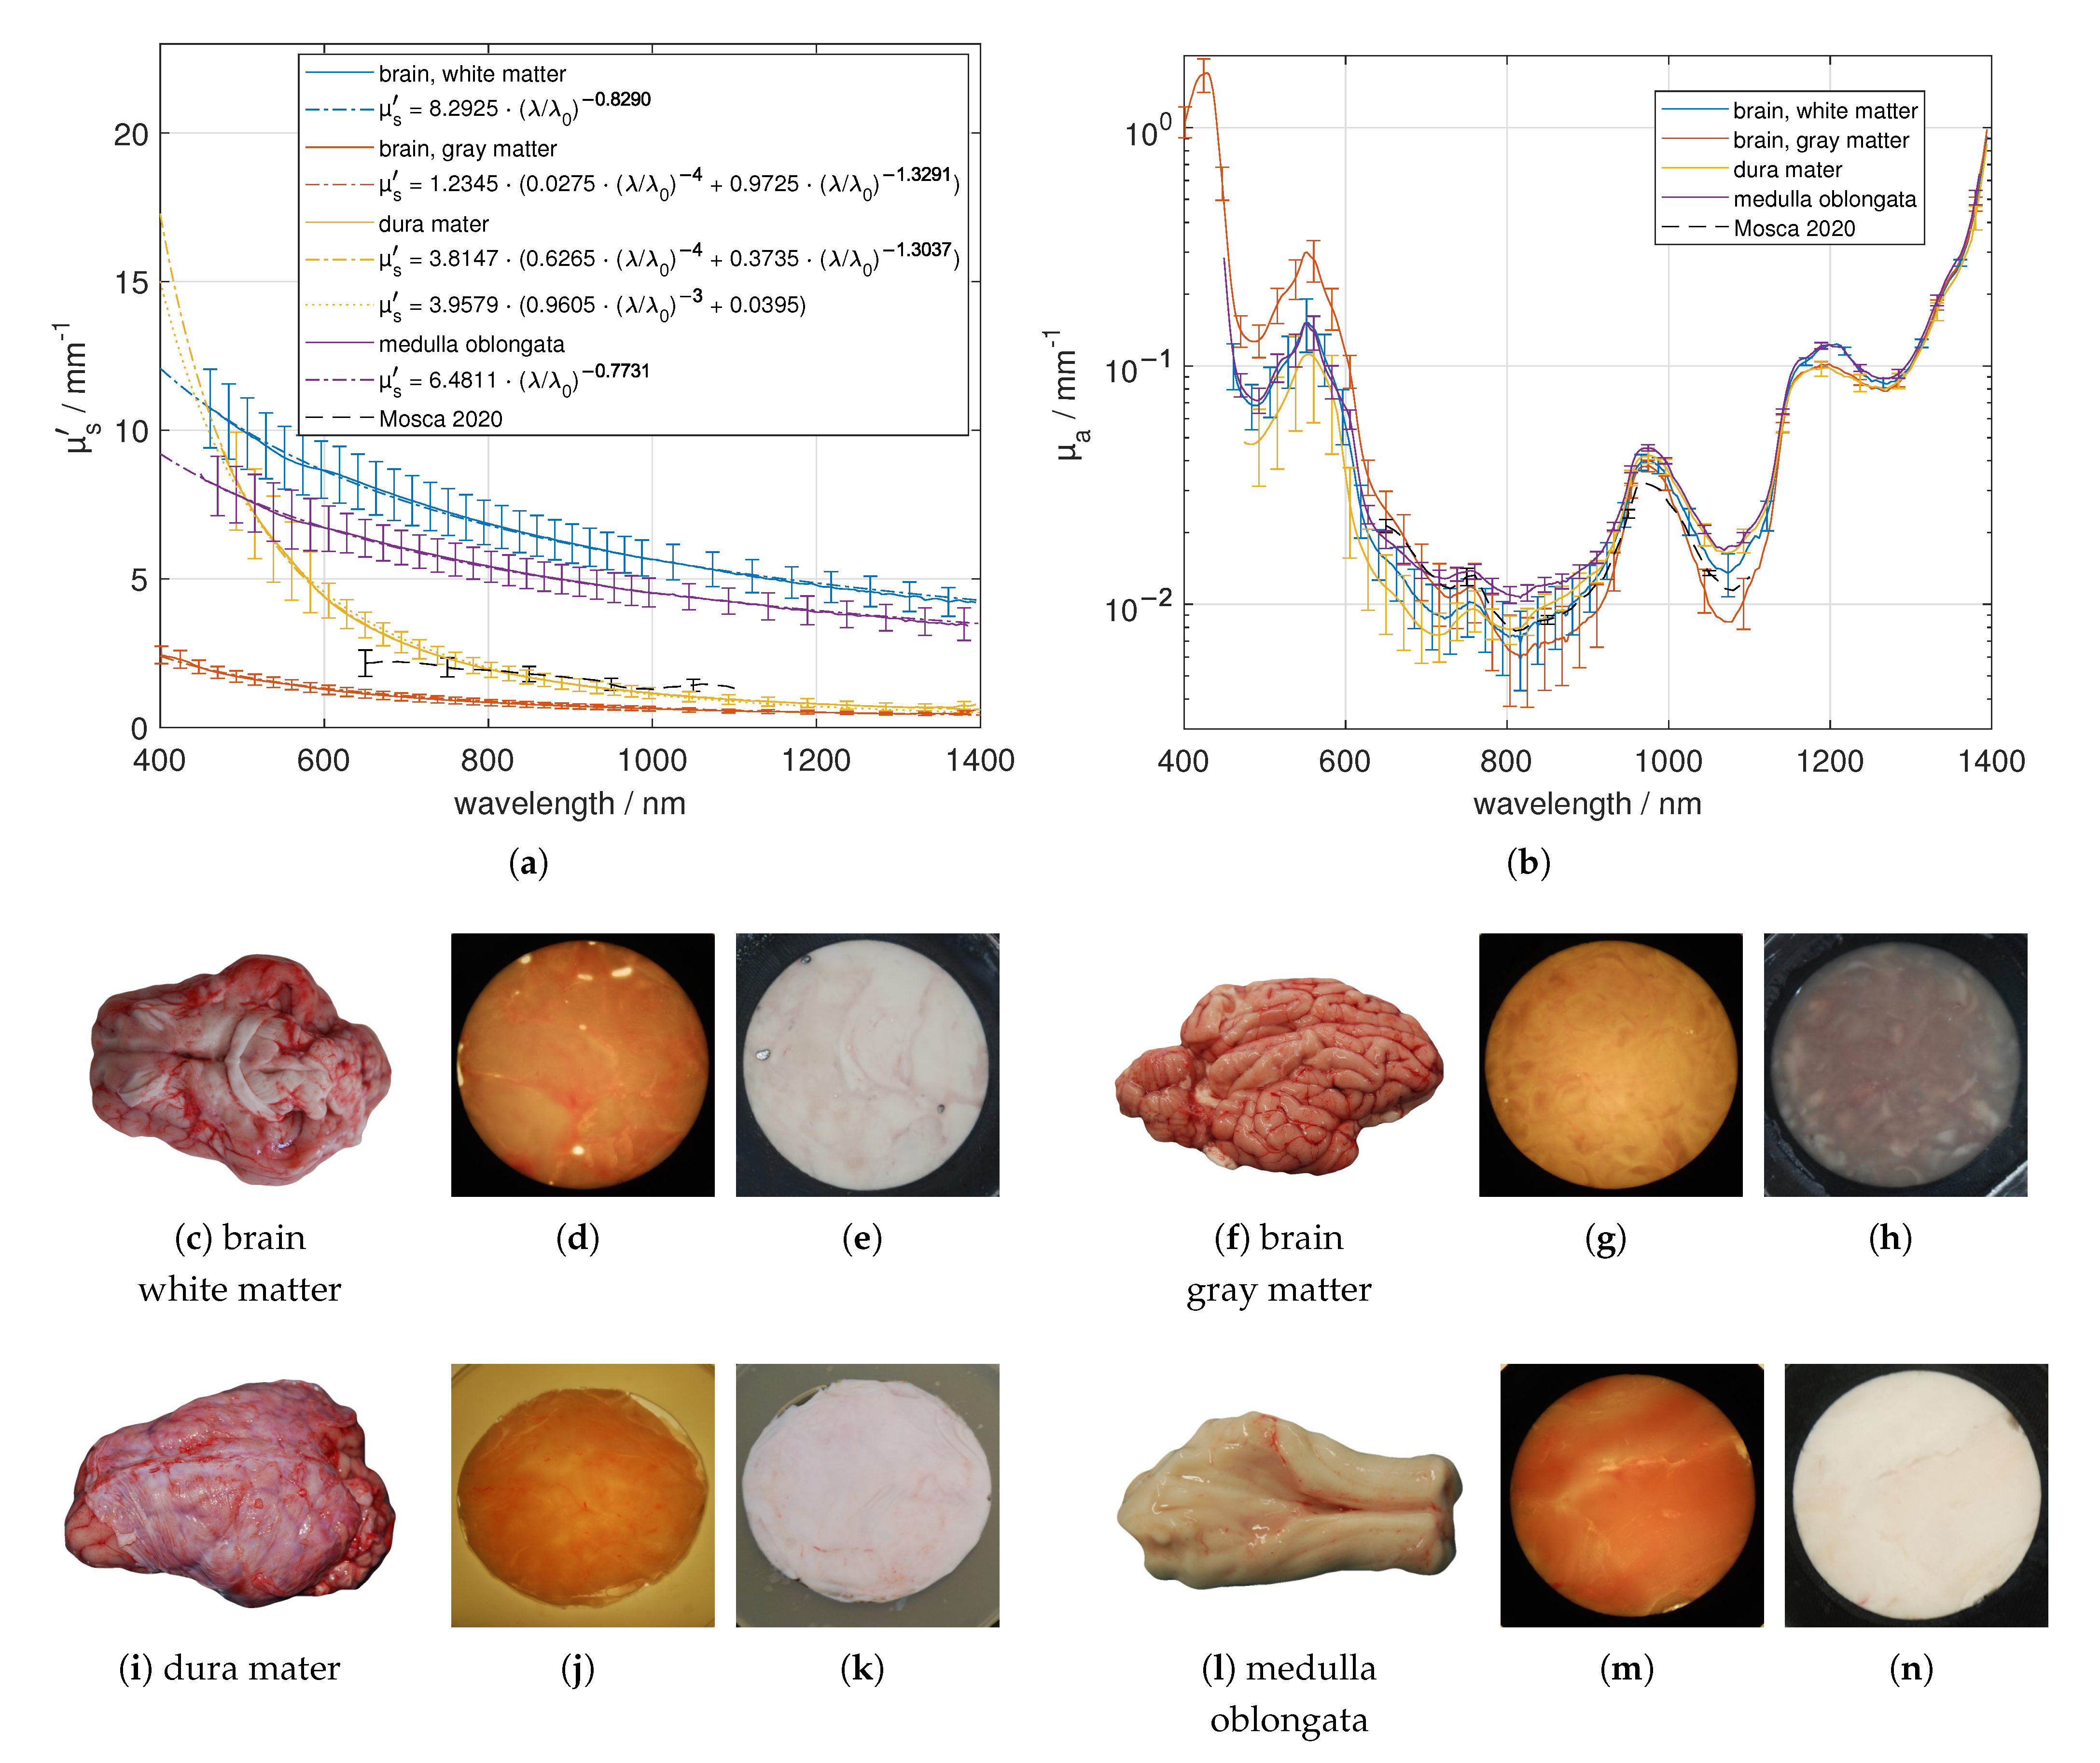
3.6. Brain
3.7. Quantitative Study
4. Conclusions
Author Contributions
Funding
Data Availability Statement
Acknowledgments
Conflicts of Interest
References
- Fantini, S.; Walker, S.A.; Franceschini, M.A.; Kaschke, M.; Schlag, P.M.; Moesta, K.T. Assessment of the size, position, and optical properties of breast tumors by noninvasive optical methods. Appl. Opt. 1998, 37, 1982–1989. [Google Scholar] [CrossRef] [PubMed]
- Tromberg, B.J.; Shah, N.; Lanning, R.; Cerussi, A.; Espinoza, J.; Pham, T.; Svaasand, L.; Butler, J. Non-invasive characterization of breast tumors using photon migration spectroscopy. Neoplasia 2000, 2, 26–40. [Google Scholar] [CrossRef] [Green Version]
- Ritz, J.P.; Roggan, A.; Isbert, C.; Müller, G.; Buhr, H.J.; Germer, C.T. Optical properties of native and coagulated porcine liver tissue between 400 and 2400 nm. Lasers Surg. Med. Off. J. Am. Soc. Laser Med. Surg. 2001, 29, 205–212. [Google Scholar] [CrossRef] [PubMed]
- Vahrmeijer, A.L.; Frangioni, J.V. Seeing the invisible during surgery. Br. J. Surg. 2011, 98, 749. [Google Scholar] [CrossRef] [PubMed] [Green Version]
- Jensen, H.W.; Marschner, S.R.; Levoy, M.; Hanrahan, P. A practical model for subsurface light transport. In Proceedings of the ACM SIGGRAPH, New York, NY, USA, 1 August 2001; pp. 511–518. [Google Scholar]
- Zoller, C.J.; Hohmann, A.; Forschum, F.; Geiger, S.; Geiger, M.; Ertl, T.P.; Kienle, A. Parallelized Monte Carlo software to efficiently simulate the light propagation in arbitrarily shaped objects and aligned scattering media. J. Biomed. Opt. 2018, 23, 065004. [Google Scholar] [CrossRef] [PubMed]
- Mosca, S.; Lanka, P.; Stone, N.; Sekar, S.K.V.; Matousek, P.; Valentini, G.; Pifferi, A. Optical characterization of porcine tissues from various organs in the 650–1100 nm range using time-domain diffuse spectroscopy. Biomed. Opt. Express 2020, 11, 1697–1706. [Google Scholar] [CrossRef] [PubMed]
- Cheong, W.F.; Prahl, S.A.; Welch, A.J. A review of the optical properties of biological tissues. IEEE J. Quantum Electron. 1990, 26, 2166–2185. [Google Scholar] [CrossRef] [Green Version]
- Kim, A.; Wilson, B.C. Measurement of and tissue optical properties: Methods and theories. In Optical-Thermal Response of Laser-Irradiated Tissue; Springer: Berlin/Heidelberg, Germany, 2010; pp. 267–319. [Google Scholar]
- Sandell, J.L.; Zhu, T.C. A review of optical properties of human tissues and its impact on PDT. J. Biophotonics 2011, 4, 773–787. [Google Scholar] [CrossRef] [Green Version]
- Bashkatov, A.N.; Genina, E.A.; Tuchin, V.V. Optical properties of skin, subcutaneous, and muscle tissues: A review. J. Innov. Opt. Health Sci. 2011, 4, 9–38. [Google Scholar] [CrossRef]
- Jacques, S.L. Optical properties of biological tissues: A review. Phys. Med. Biol. 2013, 58, R37. [Google Scholar] [CrossRef]
- Foschum, F. Bestimmung der Optischen Eigenschaften Trüber Medien Mittels Nichtinvasiver Remissionsmessungen. Ph.D. Thesis, Fakultät für Naturwissenschaften, Universität Ulm, Ulm, Germany, 2012. [Google Scholar]
- Foschum, F.; Bergmann, F.; Kienle, A. Precise determination of the optical properties of turbid media using an optimized integrating sphere and advanced Monte Carlo simulations. Part 1: Theory. Appl. Opt. 2020, 59, 3203–3215. [Google Scholar] [CrossRef] [PubMed]
- Bergmann, F.; Foschum, F.; Zuber, R.; Kienle, A. Precise determination of the optical properties of turbid media using an optimized integrating sphere and advanced Monte Carlo simulations. Part 2: Experiments. Appl. Opt. 2020, 59, 3216–3226. [Google Scholar] [CrossRef] [PubMed]
- Henyey, L.G.; Greenstein, J.L. Diffuse radiation in the galaxy. Astrophys. J. 1941, 93, 70–83. [Google Scholar] [CrossRef]
- Kedenburg, S.; Vieweg, M.; Gissibl, T.; Giessen, H. Linear refractive index and absorption measurements of nonlinear optical liquids in the visible and near-infrared spectral region. Opt. Mater. Express 2012, 2, 1588–1611. [Google Scholar] [CrossRef]
- Khan, R.; Gul, B.; Khan, S.; Nisar, H.; Ahmad, I. Refractive index of biological tissues: Review, measurement techniques, and applications. Photodiagnosis Photodyn. Ther. 2021, 33, 102192. [Google Scholar]
- Shahidi, F. Bailey’s Industrial Oil and Fat Products, Edible Oil and Fat Products: Processing Technologies; John Wiley & Sons: Hoboken, NJ, USA, 2005; Volume 5. [Google Scholar]
- Doiron, D.R.; Svaasand, L.O.; Profio, A.E. Light dosimetry in tissue: Application to photoradiation therapy. Porphyr. Photosensit. 1983, 160, 63–76. [Google Scholar]
- Wilson, B.C.; Jeeves, W.P.; Lowe, D.M. In vivo and post mortem measurements of the attenuation spectra of light in mammalian tissues. Photochem. Photobiol. 1985, 42, 153–162. [Google Scholar] [CrossRef] [PubMed]
- Bosschaart, N.; Edelman, G.J.; Aalders, M.C.; van Leeuwen, T.G.; Faber, D.J. A literature review and novel theoretical approach on the optical properties of whole blood. Lasers Med. Sci. 2014, 29, 453–479. [Google Scholar]
- Pope, R.M.; Fry, E.S. Absorption spectrum (380–700 nm) of pure water. II. Integrating cavity measurements. Appl. Opt. 1997, 36, 8710–8723. [Google Scholar] [CrossRef]
- Kou, L.; Labrie, D.; Chylek, P. Refractive indices of water and ice in the 0.65-to 2.5-μm spectral range. Appl. Opt. 1993, 32, 3531–3540. [Google Scholar] [CrossRef] [Green Version]
- Van Veen, R.; Sterenborg, H.J.; Pifferi, A.; Torricelli, A.; Chikoidze, E.; Cubeddu, R. Determination of visible near-IR absorption coefficients of mammalian fat using time-and spatially resolved diffuse reflectance and transmission spectroscopy. J. Biomed. Opt. 2005, 10, 054004. [Google Scholar] [CrossRef]
- Sekar, S.K.V.; Beh, J.S.; Farina, A.; Dalla Mora, A.; Pifferi, A.; Taroni, P. Broadband diffuse optical characterization of elastin for biomedical applications. Biophys. Chem. 2017, 229, 130–134. [Google Scholar] [CrossRef]
- Rohatgi, A. WebPlotDigitizer. 2020. Available online: https://automeris.io/WebPlotDigitizer/ (accessed on 28 January 2021).
- Graaff, R.; Aarnoudse, J.; Zijp, J.R.; Sloot, P.; De Mul, F.; Greve, J.; Koelink, M. Reduced light-scattering properties for mixtures of spherical particles: A simple approximation derived from Mie calculations. Appl. Opt. 1992, 31, 1370–1376. [Google Scholar] [CrossRef] [Green Version]
- Bohren, C.F.; Huffman, D.R. Absorption and Scattering of Light by Small Particles; John Wiley & Sons: Hoboken, NJ, USA, 2008. [Google Scholar]
- Saidi, I.S.; Jacques, S.L.; Tittel, F.K. Mie and Rayleigh modeling of visible-light scattering in neonatal skin. Appl. Opt. 1995, 34, 7410–7418. [Google Scholar] [CrossRef]
- Wells, H.C.; Edmonds, R.L.; Kirby, N.; Hawley, A.; Mudie, S.T.; Haverkamp, R.G. Collagen fibril diameter and leather strength. J. Agric. Food Chem. 2013, 61, 11524–11531. [Google Scholar] [CrossRef]
- Bancelin, S.; Aimé, C.; Gusachenko, I.; Kowalczuk, L.; Latour, G.; Coradin, T.; Schanne-Klein, M.C. Determination of collagen fibril size via absolute measurements of second-harmonic generation signals. Nat. Commun. 2014, 5, 4920. [Google Scholar] [CrossRef] [Green Version]
- Puschmann, S.; Rahn, C.D.; Wenck, H.; Gallinat, S.; Fischer, F.F. Approach to quantify human dermal skin aging using multiphoton laser scanning microscopy. J. Biomed. Opt. 2012, 17, 036005. [Google Scholar] [CrossRef] [PubMed]
- Martínez-Mancera, F.D.; Hernández-López, J.L. In vitro observation of direct electron transfer of human haemoglobin molecules on glass/tin-doped indium oxide electrodes. J. Mex. Chem. Soc. 2015, 59, 302–307. [Google Scholar]
- Worlicek, C. Fluoreszenzinduktion und Relatives Penetrationsverhalten Verschiedener 5-Aminolävulinsäure/-Methylester Formulierungen am Ex-Vivo Schweinehautmodell. Ph.D. Thesis, Medizinische Fakultät, Universität Regensburg, Regensburg, Germany, 2009. [Google Scholar]
- Arakaki, L.S.; Burns, D.H.; Kushmerick, M.J. Accurate myoglobin oxygen saturation by optical spectroscopy measured in blood-perfused rat muscle. Appl. Spectrosc. 2007, 61, 978–985. [Google Scholar] [CrossRef]
- Taylor, J.R. An Introduction to Error Analysis: The Study of Uncertainties in Physical Measurements. University Science Books; Oxford University Press: Mill Valley, CA, USA, 1982. [Google Scholar]
- Taroni, P.; Comelli, D.; Farina, A.; Pifferi, A.; Kienle, A. Time-resolved diffuse optical spectroscopy of small tissue samples. Opt. Express 2007, 15, 3301–3311. [Google Scholar] [CrossRef] [PubMed]
- Rejmstad, P.; Zsigmond, P.; Wårdell, K. Oxygen saturation estimation in brain tissue using diffuse reflectance spectroscopy along stereotactic trajectories. Opt. Express 2017, 25, 8192–8201. [Google Scholar] [CrossRef] [PubMed]


| Sample Name | Thickness Range | Refractive Index | # Samples | Power Law Fit, Equations (2) and (3), |
|---|---|---|---|---|
| in mm | a as well as in mm | |||
| non-scalded skin | (1.3–1.9) | 5 layers, 1.4 | 3 | a = 2.1808, b = 0.4912, c = 0.8663 |
| = 2.2788, = 0.8317, = 0 | ||||
| adipose tissue | (2.3–4.1) | 3 layers, 1.46 [19] | 13 | a = 1.8468, b = 0.0139, c = 0.5953 |
| muscle | (1.0–3.6) | 3 layers, 1.4 | 11 | a = 0.5798, b = 0.1647, c = 1.1793 |
| bone cranium | (0.9–1.9) | 5 layers, 1.4 | 4 | a = 1.5963, b = 0.1261, c = 0.5821 |
| bone mandibula | (0.9–1.4) | 5 layers, 1.4 | 4 | a = 1.9909, b = 0.0417, c = 0.5853 |
| bone scapula | (1.0–1.4) | 5 layers, 1.4 | 4 | a = 2.0862, b = 0.1008, c = 0.5473 |
| bone tibia | (0.9–1.0) | 5 layers, 1.4 | 2 | a = 1.9652, b = 0, c = 0.7921 |
| bone marrow | (2.5–2.6) | 5 layers, 1.4 | 2 | a = 1.2177, b = 0.0475, c = 0.3490 |
| cartilage | (1.1–1.4) | 5 layers, 1.4 | 3 | a = 2.9583, b = 0.1984, c = 0.9418 |
| = 2.9618, = 0.4259, = 0.5777 | ||||
| brain, white matter | (0.4–2.3) | 3 layers, 1.4 | 6 | a = 8.2925, b = 0, c = 0.8290 |
| brain, gray matter | (1.0–4.0) | 3 layers, 1.4 | 6 | a = 1.2345, b = 0.0275, c = 1.3291 |
| dura mater | (1.3–3.5) | 5 layers, 1.4 | 3 | a = 3.8147, b = 0.6265, c = 1.3037 |
| = 3.9579, = 0.9605, = 0 | ||||
| medulla oblongata | (1.4–1.6) | 5 layers, 1.4 | 2 | a = 6.4811, b = 0, c = 0.7731 |
| Sample Name | Water | Fat | Collagen | Hb Blood | HbO Blood | Constant | E |
|---|---|---|---|---|---|---|---|
| in % | in % | in % | in % | in % | in mm | ||
| non-scalded skin | 66.31 | 3.11 | 24.36 | 0.32 | 0.05 | 0.012 | 0.29 |
| adipose tissue | 10.29 | 82.21 | 1.6 | 0.09 | 0.05 | 0 | 0.266 |
| muscle | 59.25 | 0 | 1.55 | 1.65 | 0 | 0 | 1.087 |
| bone cranium | 61.58 | 1.5 | 17.92 | 0.09 | 0.1 | 0.002 | 0.346 |
| bone mandibula | 43.01 | 20.24 | 13.95 | 0.07 | 0 | 0 | 0.108 |
| bone scapula | 48.63 | 31.68 | 0 | 2.98 | 0.53 | 0.002 | 0.382 |
| bone tibia | 38.73 | 11.82 | 12.43 | 0.02 | 0 | 0.001 | 0.642 |
| bone marrow | 9.96 | 88.97 | 5.31 | 0 | 0.97 | 0.006 | 0.145 |
| cartilage | 79.61 | 3.47 | 10.72 | 0 | 0 | 0.003 | 0.155 |
| brain, white matter | 67.24 | 17.18 | 14.3 | 0.56 | 0 | 0.003 | 0.222 |
| brain, gray matter | 63.47 | 0 | 11.82 | 1.22 | 0 | 0 | 1.403 |
| dura mater | 70.27 | 5.4 | 6.07 | 0.33 | 0.07 | 0.004 | 0.284 |
| medulla oblongata | 69.55 | 8.69 | 17.62 | 0.54 | 0 | 0.006 | 1.831 |
Publisher’s Note: MDPI stays neutral with regard to jurisdictional claims in published maps and institutional affiliations. |
© 2021 by the authors. Licensee MDPI, Basel, Switzerland. This article is an open access article distributed under the terms and conditions of the Creative Commons Attribution (CC BY) license (https://creativecommons.org/licenses/by/4.0/).
Share and Cite
Bergmann, F.; Foschum, F.; Marzel, L.; Kienle, A. Ex Vivo Determination of Broadband Absorption and Effective Scattering Coefficients of Porcine Tissue. Photonics 2021, 8, 365. https://doi.org/10.3390/photonics8090365
Bergmann F, Foschum F, Marzel L, Kienle A. Ex Vivo Determination of Broadband Absorption and Effective Scattering Coefficients of Porcine Tissue. Photonics. 2021; 8(9):365. https://doi.org/10.3390/photonics8090365
Chicago/Turabian StyleBergmann, Florian, Florian Foschum, Leonie Marzel, and Alwin Kienle. 2021. "Ex Vivo Determination of Broadband Absorption and Effective Scattering Coefficients of Porcine Tissue" Photonics 8, no. 9: 365. https://doi.org/10.3390/photonics8090365
APA StyleBergmann, F., Foschum, F., Marzel, L., & Kienle, A. (2021). Ex Vivo Determination of Broadband Absorption and Effective Scattering Coefficients of Porcine Tissue. Photonics, 8(9), 365. https://doi.org/10.3390/photonics8090365