Abstract
The recent demonstration of external cavity quantum cascade lasers with optical feedback, controlled by an acousto-optic modulator, paves the way to ruggedized infrared laser systems with the capability of tuning the emission wavelength on a microsecond scale. Such systems are of great importance for various critical applications requiring ultra-rapid wavelength tuning, including combustion and explosion diagnostics and standoff detection. In this paper, recent research results on these devices are summarized and the advantages of the new configuration are analyzed in the context of practical applications.
1. Introduction
The development of quantum cascade laser (QCL) configurations with a broad spectral coverage, and compatible with ultra-fast spectroscopic measurements, is an area of active research, primarily driven by QCL applications in infrared standoff detection and combustion/explosion diagnostics.
One of the most promising developments in the field has been the demonstration of QCL-based frequency combs [1] and ultra-fast dual-comb QCL sensors [2]. The dual-comb QCL approach promises lab-on-a-chip sensors with a short measurement time. These sensors can potentially be integrated in various compact infrared platforms. The biggest drawback of this approach is a relatively small spectral coverage, on the order of tens of wavenumbers. This coverage may be insufficient to uniquely identify compounds with broad absorption spectra.
The widest wavelength tunability, covering a substantial fraction of the QCL gain bandwidth, has been demonstrated for lasers in the external cavity configuration with a mechanical grating controlling a wavelength-dependent feedback [3]. This configuration has been in wide use with all types of gain media including solids, liquids and gases for over forty years. Such lasers are easy to construct and utilize using proven optical components. Such systems, however, suffer from two important disadvantages arising from the need to physically rotate a macroscopic spectral dispersive component—the diffraction grating. These disadvantages are (1) slow wavelength tuning and (2) sensitivity to mechanical vibrations and shocks. The highest tuning rate reported for traditional external cavity (EC) QCLs with a mechanical grating is 5 kHz, achieved by tilting a small intracavity mirror [4]. However, the tuning range is limited. Using a micro opto-electro-mechanical systems (MOEMS) scanning grating, Grahmann et al. achieved a scanning rate of 1 kHz [5]. The improvement in tuning speed demonstrated for these devices, while impressive, is still insufficient for many important laboratory applications, including combustion/explosion diagnostics where a full spectral scan needs to be performed on the order of tens of microseconds (see, for example, Reference [6]). In practical situations, for applications involving optical detection of improvised explosive devices (IEDs) demand sub-millisecond spectral scan of a remote object. Sensitivity to vibrations and shocks, especially during the tunable laser operation precludes the consideration of the traditional EC QCLs in applications where the tunable laser is deployed on moving platforms, such as a vehicle travelling on unpaved roads, typical of a battlefield environment where the tunable lasers can be significant help to soldiers in protecting them from the dangers of IEDs. Deployment on aircraft including helicopters and unmanned aerial vehicles (UAVs) also requires ruggedness derived from immunity to vibrations and shocks.
Both of the above needs require a novel tuning mechanism, which does not rely on physical rotation of a macroscopic optical element. An ideal tunable laser system would be one which is electronically tuned with no moving parts. Moreover, to fully exploit the QCL gain bandwidth, the new approach to a rapid QCL wavelength control should be compatible with the EC configuration. Use of electronic tuning could be the key to fast tuning and absence of moving parts can assure immunity to vibrations and shocks.
2. Experimental Section
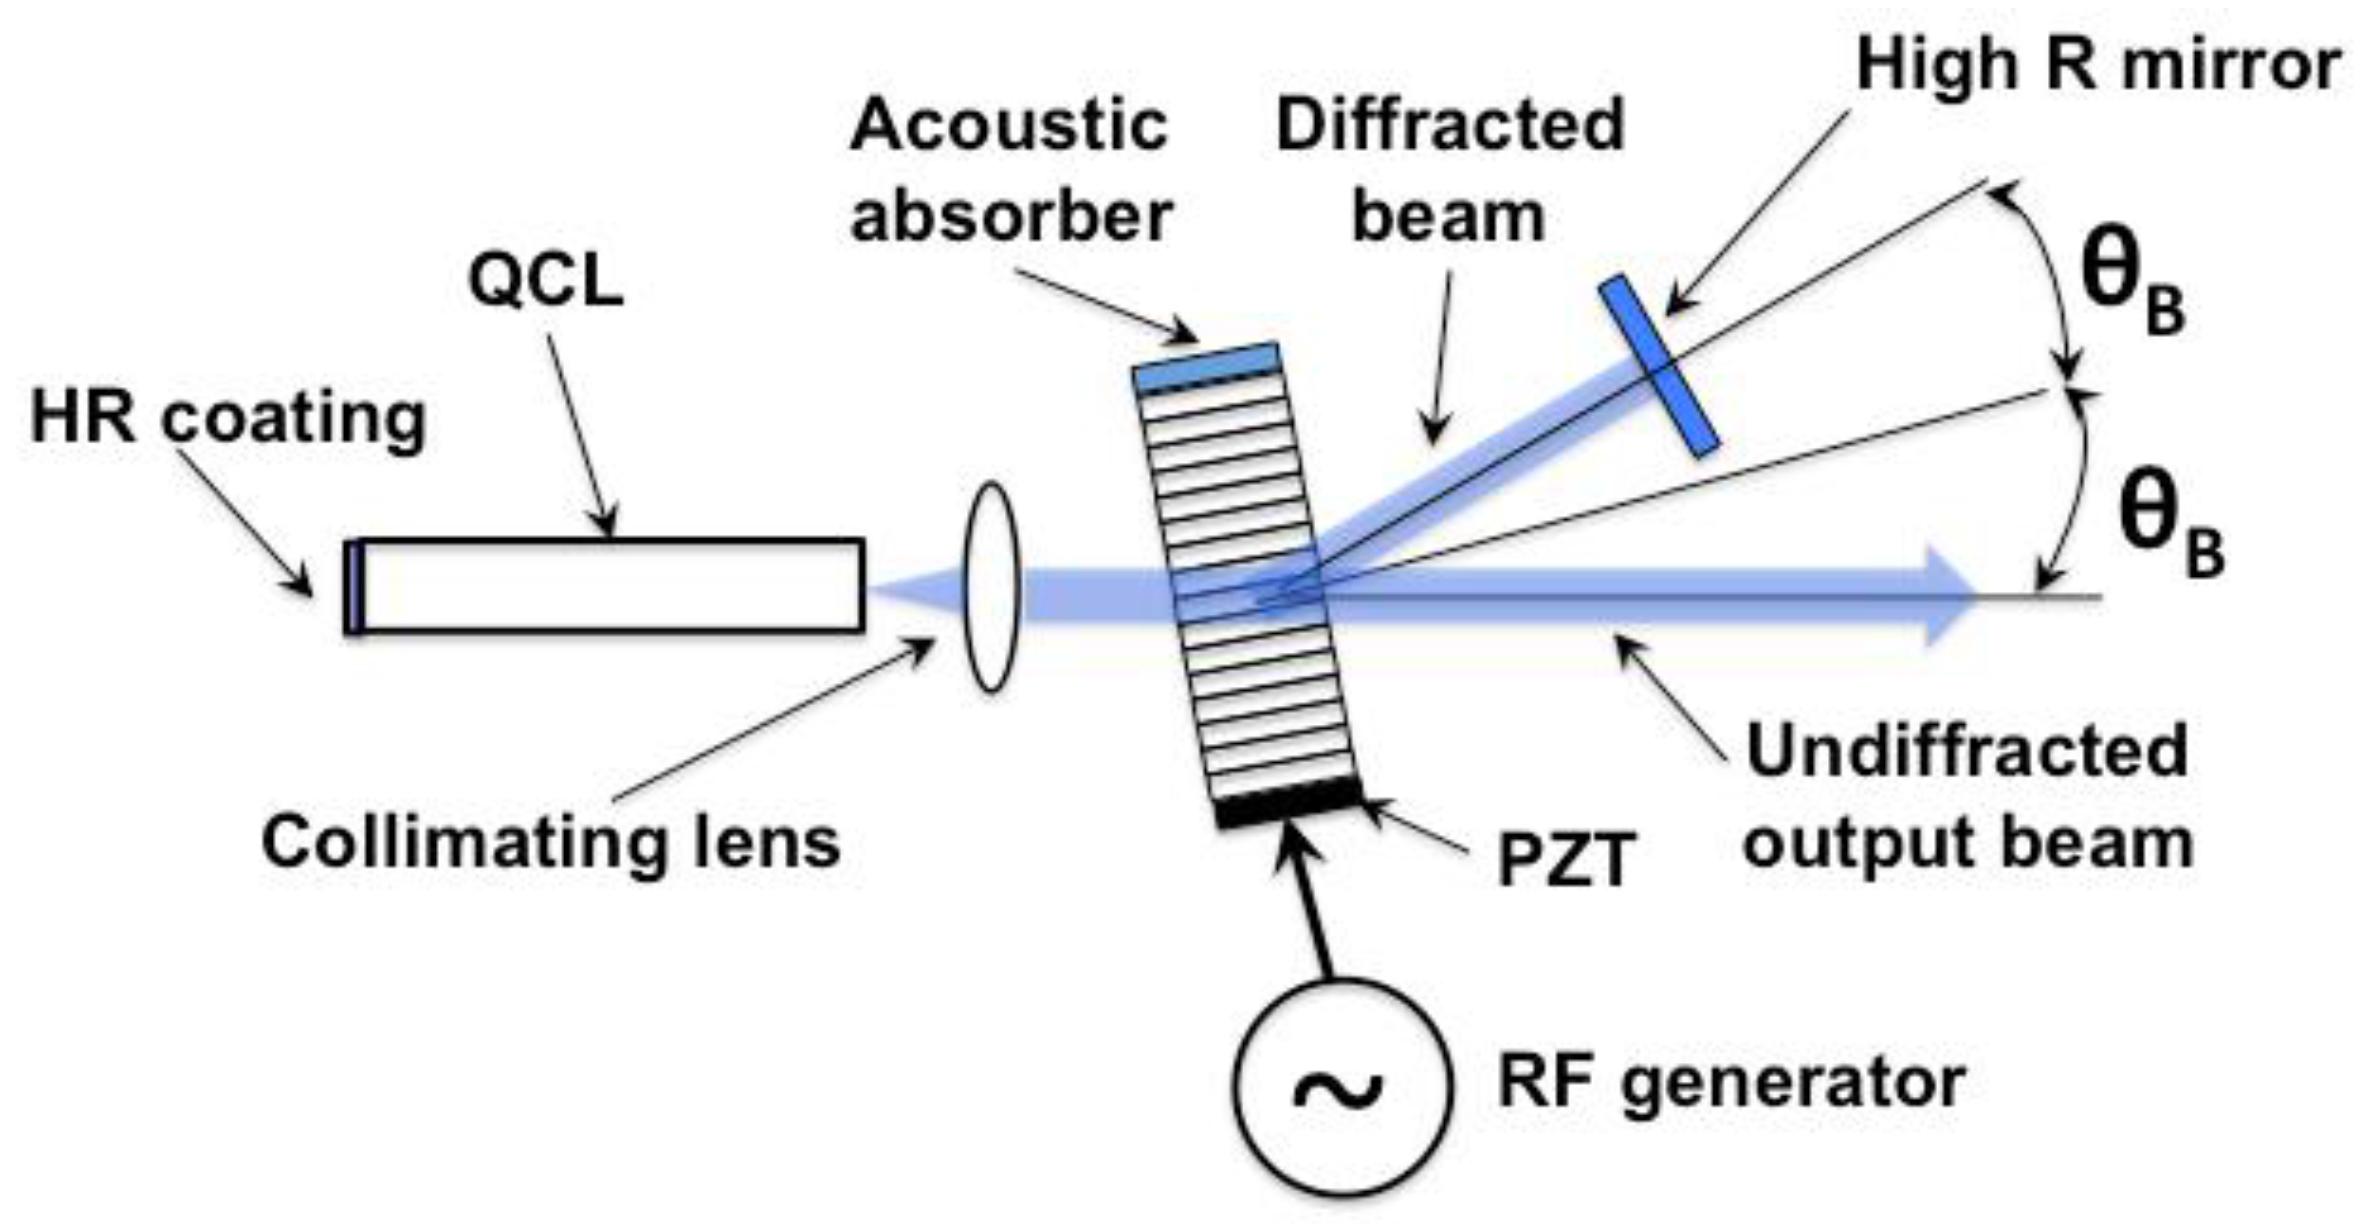
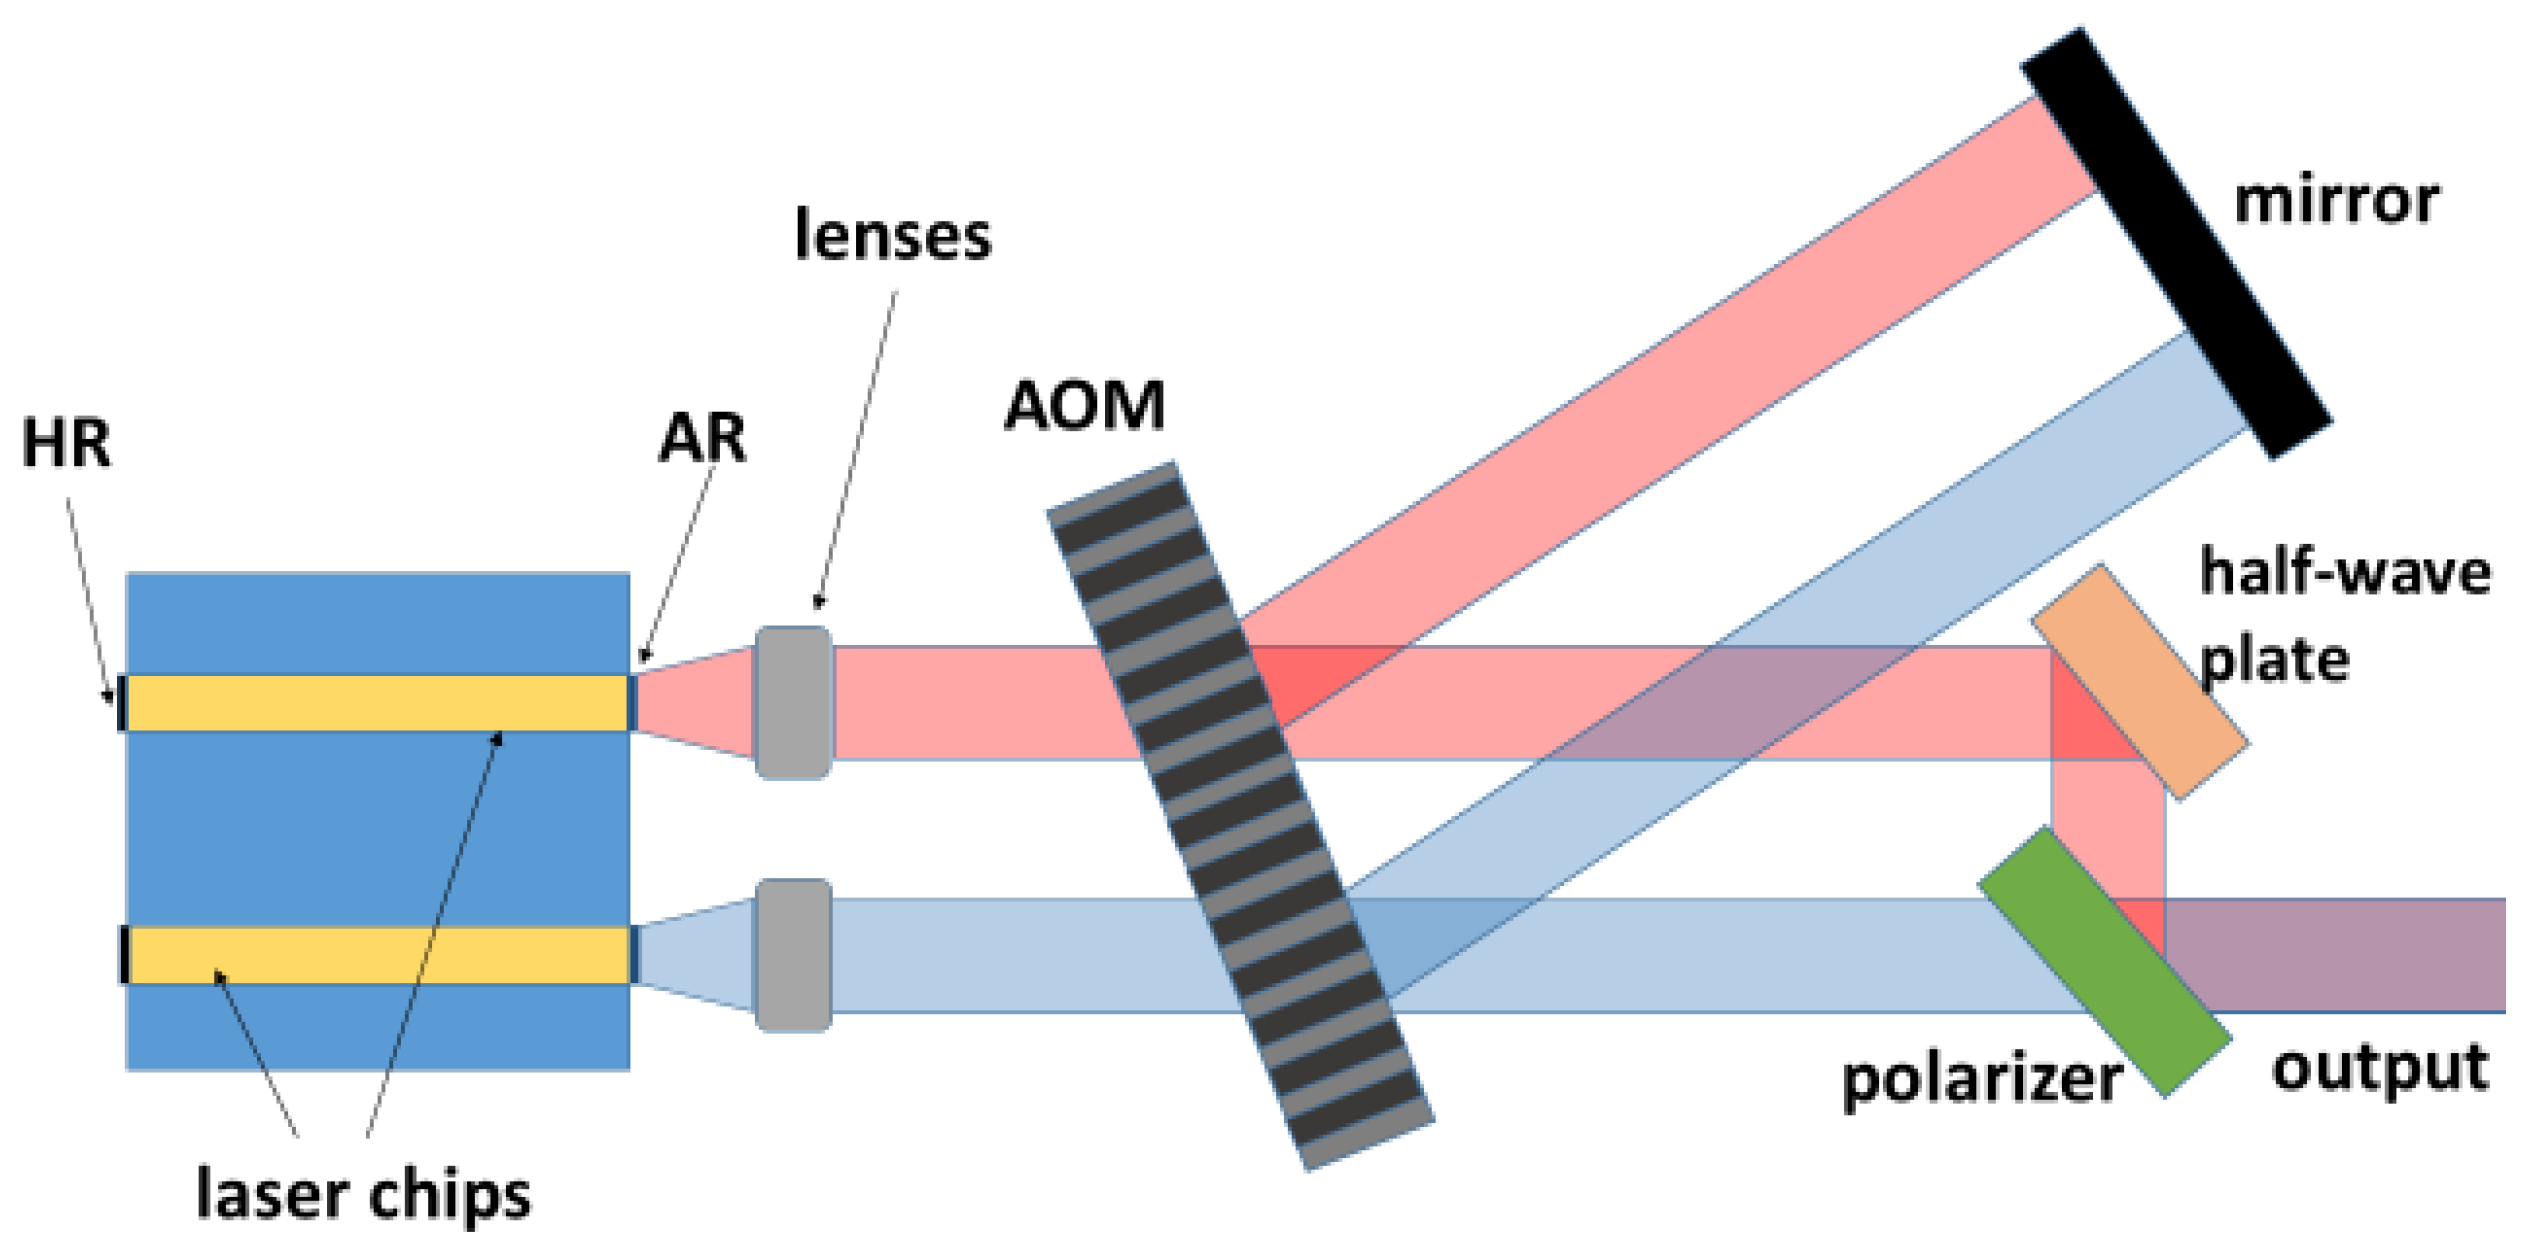
We have recently demonstrated a significantly increased scanning rate using an all-electronic grating as a wavelength selective element. The configuration explored in [7,8] is shown in Figure 1. As with the EC approach, emission wavelength of a single Fabry-Perot (FP) QCL chip with an AR-coated back facet is controlled using a dispersive optical element located outside the laser chip. However, in contrast to the traditional EC QCLs with a moving grating, the rapid wavelength tuning in the demonstrated external cavity configuration is achieved using an electrically controlled acousto-optic modulator (AOM). In the AOM, an acoustic wave at a radio frequency is generated by applying the RF electronic signal to a piezoelectric transducer attached to an optical crystal, which is transparent at the wavelength at which the laser needs to operate and also has low acoustic losses. The acoustic wave (alternate compressions and rarefactions in the crystal) represents a phase grating, from which the optical beam traversing the AOM crystal can be diffracted (see Figure 1).
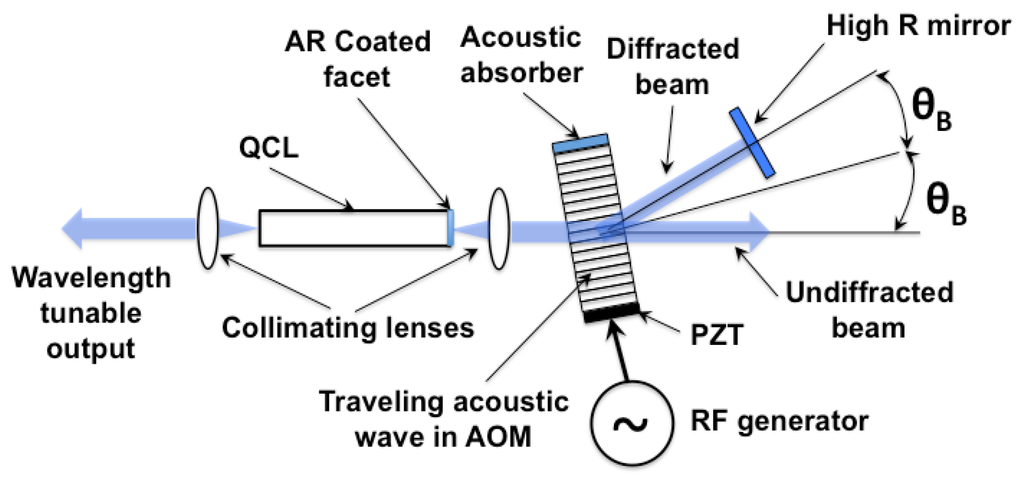
Figure 1.
Schematic of travelling wave acousto-optic modulator tuned quantum cascade laser.
The angle of diffraction, θB, is given by:
where m is the order of diffraction, n is the optical refractive index of the AOM material, λ0 is the optical wavelength and Λ is the acoustic wavelength. For an optical wavelength, λ0 = 10 μm, refractive index of ~4.0 for the germanium AOM crystal, and an acoustic wavelength of ~135 μm (assume an acoustic driving frequency of 35 MHz), we get a diffraction angle of θB = ~7.5°.
Typical diffraction efficiency of 85% is possible for an acoustic power level of ~30 W into a germanium AOM crystal, which is comparable to the diffraction efficiency of a mechanical diffraction grating.
AOMs have been successfully used for rapid and random access discreet tuning of CO2 lasers on their 9.6 μm and 10.6 μm laser bands [9] and continuous tuning of Ti-sapphire lasers [10]. Reference [10] also provides earlier data on tuning of dye lasers using acousto-optic modulators.
For practical applications, the demonstrated approach has several key advantages, over either the QCL arrays or the traditional EC QCLs with a mechanical grating.
- Tuning speed. Typical modulation bandwidth for commercially available AO modulators is in the range of tens of MHz. Hence, the required switching time, between arbitrary wavelengths, of under 1 μs can be achieved. This switching time is approximately three orders of magnitude faster than that for EC QCLs with a moving grating. The scanning rate is also much faster than characteristic mechanical vibrational frequencies of the system. As a consequence, the mirror vibration does not influence single sweep measurement results.
- Ruggedness. In contrast to the EC QCLs with a moving grating, the wavelength tuning mechanism does not require any mechanical motion. The module can therefore be ruggedized to meet the most stringent requirements for field applications.
- Yield (cost). The module comprises a single QCL chip. The standard single-QCL fabrication process has a relatively high yield, exceeding 50% for watt-level long-wave infrared devices (LWIR) devices. In the case of QCL DFB arrays, an alternative approach to fast wavelength tuning with a broad spectral coverage, however, the yield quickly drops with an increase in number of elements. For comparison, even a 10-element array processed from the same material would have a yield of less than 10%. As a consequence, DFB QCL arrays with a broad spectral coverage are projected to have low yield, making this technical approach impractical for some applications.
- Reliability and manufacturability. All the components in the proposed module have been commercially used for an extended period of time and have proven their long-term reliability. The high power FP QCLs have been in commercial production for nearly a decade and theAOMs for LWIR region have been commercially deployed for several decades. Thus, the two critical components in the proposed configuration, namely FP QCLs and AOMs, represent mature technologies compatible with a large throughput production.
- Practical Implications: Since dispersion is provided by the acoustic grating, the same mechanical construction can be used for QCLs with different center wavelengths (and different tuning ranges) unlike the mechanical diffraction grating where a different grating is needed for a different wavelength range.
3. Results
3.1. Response Time
The response time of the change in the optical wavelength with a change in the AOM frequency is the main advantage of the new configuration. The response time has two components: (1) propagation time of the acoustic wave from the piezoelectric transducer to the edge of the optical beam going through the AOM (this propagation distance is designated here as L); and (2) the propagation time for the acoustic wave across the optical beam (diameter of the beam is designated as Db). The first “delay” is the latency time and does not represent the response time of the change of the optical wavelength when AOM frequency is changed. The latency time can be shortened, almost arbitrarily, by reducing the distance between the acoustic transducer and the position of the optical beam. The actual response time, therefore, is determined by the acoustic wave transit time across the optical beam. For the present case, the time it takes an acoustic wave to propagate from the piezoelectric transducer across the germanium material to the edge of the optical beam is t1 and time for the acoustic wave to cross the optical beam is t2. The time t2 is the actual response time of the AOM for changing the optical wavelength. As mentioned above, t1 can be shortened to almost zero. However, there are limitations on how short t2 can be. If t2 is made too short by making the optical beam diameter small, the optical wave will interact with a fewer number of acoustic waves and therefore the linewidth of the output will increase. The linewidth of the optical output can be reduced by making the optical beam diameter larger, but that occurs at the expense of the response time. The optimal linewidth/response time balance is application driven.
Figure 2 shows measured response time of the system as AOM frequency switches from 35 MHz (outside of the tuning curve) to 45 MHz (center of the tuning curve). The blue curve in Figure 2 shows the AOM frequency control signal and the red curve shows the optical signal from the laser measured with a room temperature mercury-cadmium-telluride (MCT) detector, which consists of pulses of duration 100 ns and repetition period of 200 ns. AOM frequency is initially equal to 35 MHz, outside of the tuning curve of the laser. The optical signal level from the laser is at zero level since the Bragg condition is not satisfied anywhere in the laser gain spectrum. AOM frequency is abruptly changed to 45 MHz at time t = 0. AOM frequency of 45 MHz corresponds to the peak of the gain curve. It takes approximately t1 = L/vs = 1.25 μs for the acoustic signal with the new frequency to reach the area where the optical beam is incident on the crystal (vs is sound velocity). When the sound signal with the new frequency reaches that area, the optical signal starts growing. It reaches its maximum value at t2 = 550 ns + t1, in a good agreement with the calculated travelling time across the beam area t2 = DB/vs = 3.4 mm/(5.5 mm/μs) ~ 600 ns (Figure 2a). The AOM frequency switches back to 35 MHz at t = 3 μs. The process is repeated: It takes about t1 + t2 =1.8 μs for the laser to completely shut down (Figure 2b).
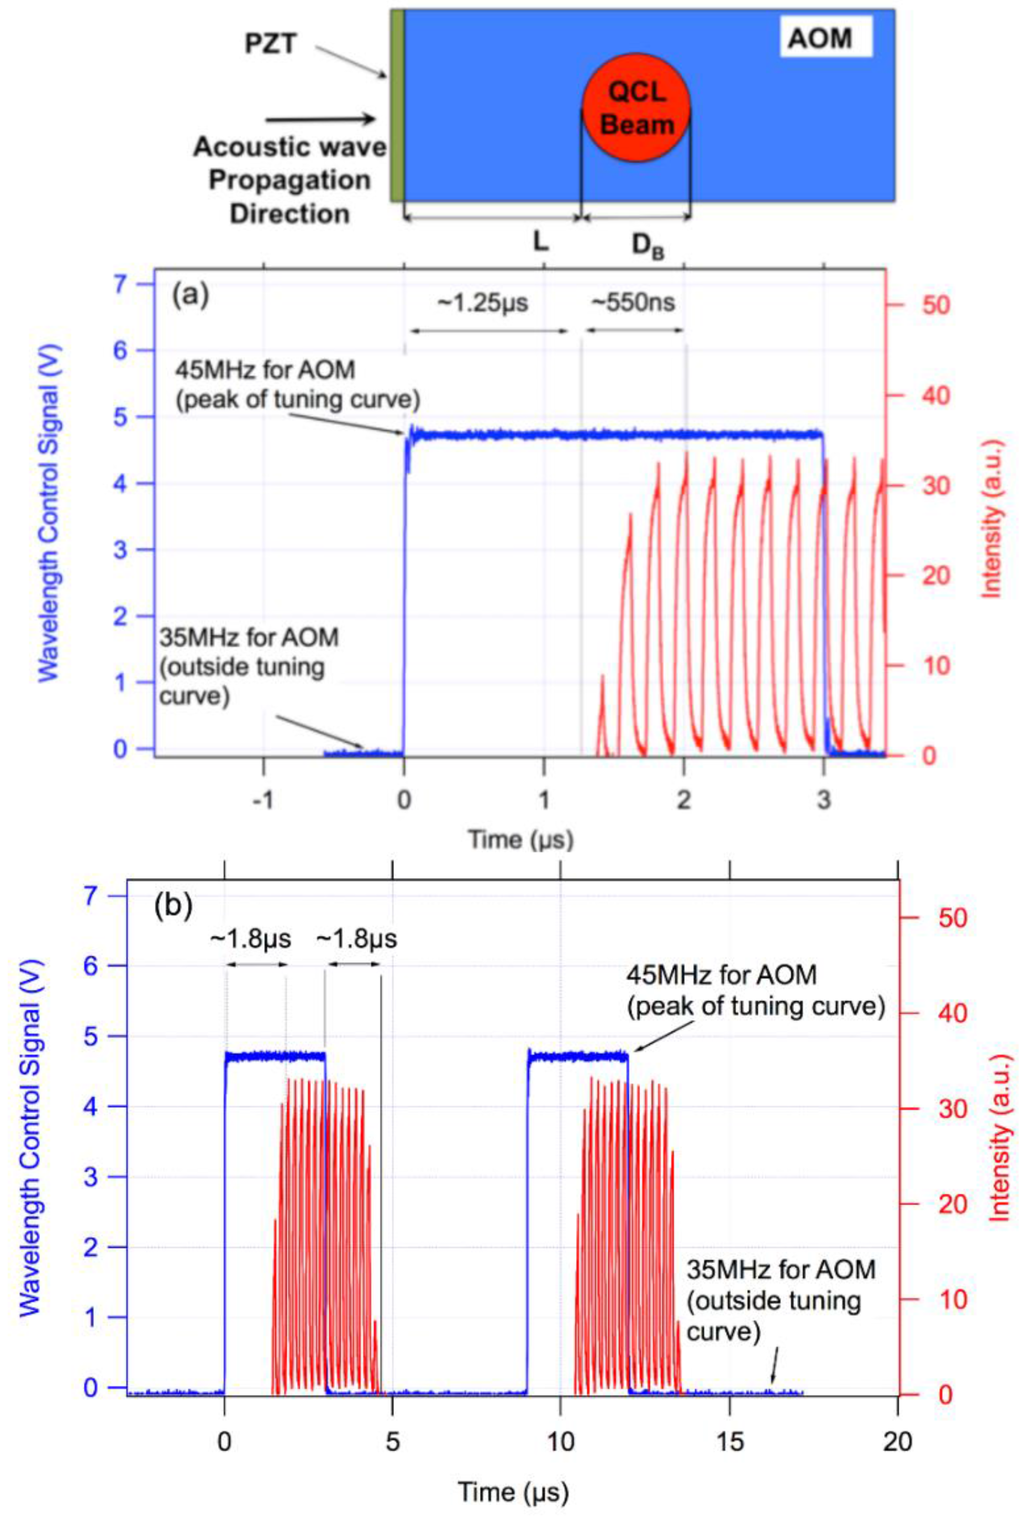
Figure 2.
Switching time data for the AOM-controlled EC QCL setup. (a) AOM frequency switches from 35 MHz outside the tuning curve to 45 MHz corresponding to the center of the tuning curve. The laser follows the AOM signal with a 1.8 μs delay, resulting from a sound wave propagation to the edge of the laser beam (1.25 μs) and across the laser beam (550 ns); (b) when AOM signal switches back to 35 MHz the process is repeated and it takes 1.8 μs for the laser to shut down.
As mentioned above, the latency time t1 is proportional to L and can be almost arbitrarily minimized by designing the AOM so that the piezoelectric transducer generating the sound wave is positioned closer to the beam area. Time t2, which is the actual wavelength switching time, on the other hand, is determined by the AOM material and beam size. It is, however, already well below 1 μs. Thus, if we change the AOM frequency between two values, say f1 and f2, the laser wavelength will switch between two corresponding values in a time less than 1 μs, the latency time notwithstanding.
3.2. Continuous Wave Operation
Two variations of the AOM approach are possible. The first one is when the acoustic wave reflects from the side opposite to the sound wave transducer, which creates a standing sound wave in the crystal. The standing acoustic waves occur at discrete acoustic frequencies defined by crystal dimensions and sound wave speed. Therefore, corresponding laser wavelengths are also discrete. A more interesting approach, explored in References [7,8], is when a sound wave absorber is positioned opposite end of the AOM crystal from the transducer. This is the travelling sound wave case. Since the standing wave resonance does not need to be satisfied, continuous wavelength tuning is available for this configuration.
A corollary property of the travelling wave approach is a frequency-shifted feedback. As the laser beam propagates through the crystal, it experiences the Doppler shift equal to the sound wave frequency. The frequency shift is doubled when the beam reflected by the high reflectivity back mirror propagates through the crystal again before coupling back into the laser waveguide. The frequency shift prevents constructive interference and formation of axial optical modes in the laser (corresponding to the round trip time for the overall laser cavity) when zero-reflectivity anti-reflection coating is used on the laser facet facing the AOM. As a consequence, emission spectrum for the AOM controlled lasers in the travelling wave configuration is expected to be different from that for traditional Fabry-Perot and external cavity devices.
Emission spectrum of lasers, including AOM-controlled QCLs, is seeded by spontaneous emission events in the gain medium. Therefore, phase consideration between these random events is not important. Each of the spontaneous emission events results into the formation of a broad spectral line as the beam propagates back and forth in the cavity. The resultant (integrated) spectrum is defined by the gain/loss spectrum, the AOM frequency response, and the frequency shift.
It was shown in Reference [11] that the integrated emission spectrum for an AOM-controlled laser, seeded by a broad spontaneous emission, has a nearly Gaussian shape with an estimated spectral full width at half maximum given by
where is the roundtrip frequency shift and is the spectral width of the AOM frequency response. The expression in Equation (2) was derived assuming that material gain/loss spectral width was much larger than . As a consequence, Equation (2) is independent of gain spectrum width. In addition, it was also assumed in Equation (2) that was much larger than both and free spectral range of the external cavity setup. These assumptions are generally applicable to AOM-controlled QCLs. For the external cavity setup described in the present work, = 2 × 45 MHz = 90 MHz and cm−1. Both parameters are calculated assuming that the beam propagated twice through the modulator during the roundtrip. For these values of and , calculated value for is approximately 1.3 cm−1.
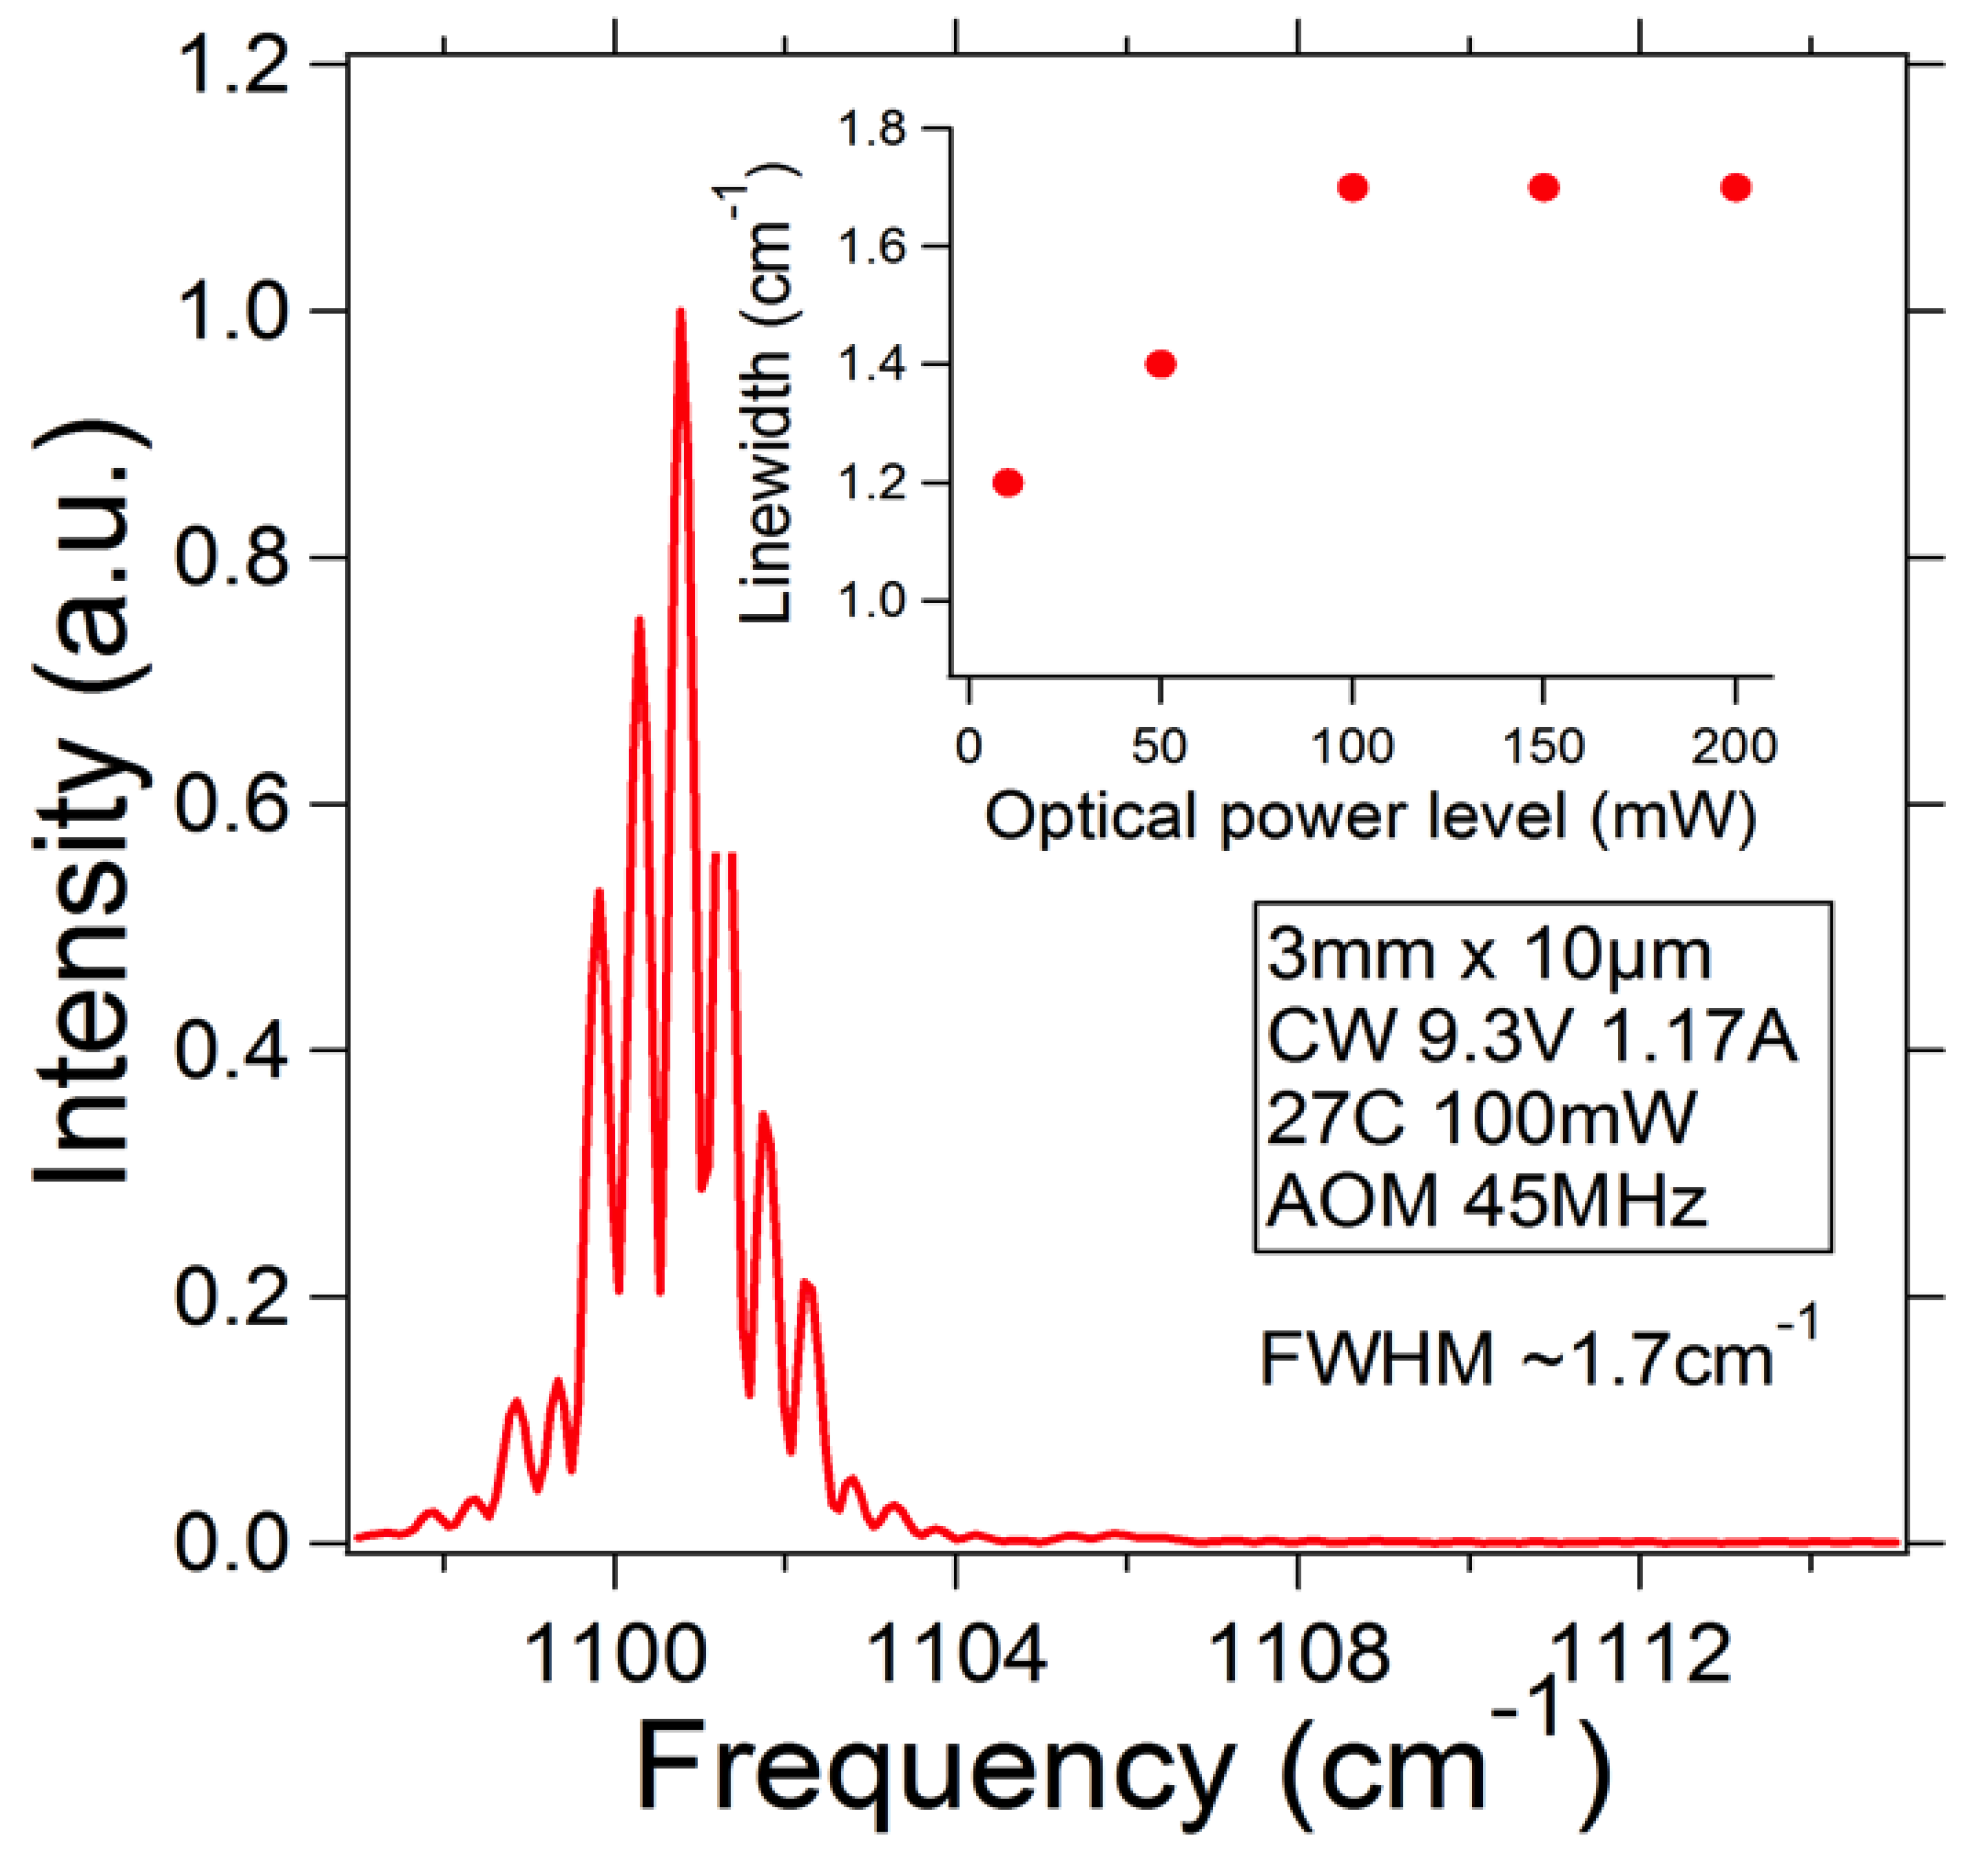
Figure 3 shows that measured continuous-wave (CW) linewidth for a 3 mm × 10 μm AOM-controlled QCL epi-down mounted on an AlN submount at a high power level (output power ~100 mW; driving conditions 1.17 A, 9.3 V, 300 K; AOM frequency 45 MHz) was approximately equal to 1.7 cm−1, in a good agreement with the model results. The spectra were measured using a Bruker FTIR spectrometer with approximately 30 s scanning time. The inset for Figure 3 also shows that linewidth narrowed to ~1 cm−1 in the vicinity of laser threshold as the spectral region where laser gain equals mirror losses becomes comparable to or less than the spectral width of the AOM response. Linewidth did not change appreciably with power level when the laser operated significantly above threshold. The emission spectrum is slightly asymmetric, as predicted in Reference [12], and modulated at free spectral range of the laser chip due to a residual reflectivity of the anti-reflection coated facet. For a zero reflectivity coating, a broad single emission line is expected.

Figure 3.
Emission line of the CW AOM-controlled QCL. Inset shows linewidth variation with change in optical power.
The relatively large linewidth could be a limitation for the usefulness of AOM-controlled EC QCLs with a frequency shifted feedback for some applications. This linewidth is, however, sufficiently narrow for numerous other applications, including improvised explosive device (IED) detection and combustion/explosion diagnostics, where absorption features are typically in the range of tens of wavenumbers. If necessary, the linewidth can be significantly reduced employing the standing wave configuration, without sacrificing the response time.
The CW tuning curve for the laser at a 100-mW power level is shown in Figure 4. The data were collected under the same conditions as the data in Figure 3. The laser tuning range under these driving parameters covered a spectral range from 1070 cm−1 to 1135 cm−1 when AOM frequency was changed from 43.5 MHz to 46.5 MHz.
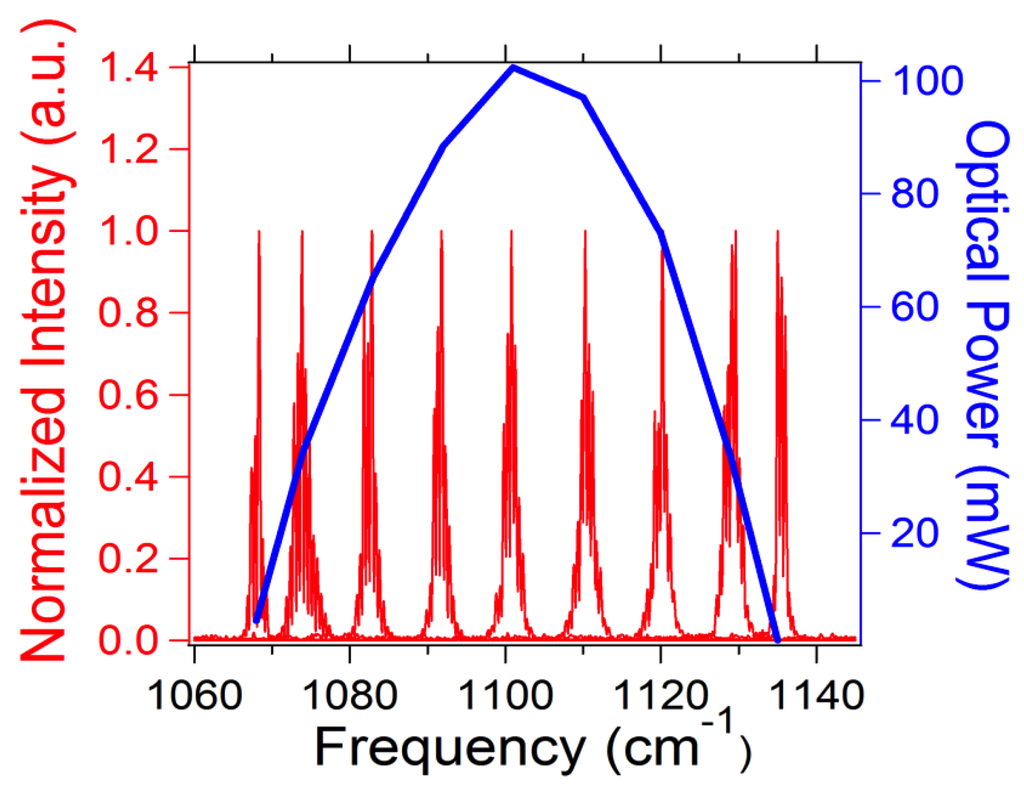
Figure 4.
Tuning curve of the CW AOM-controlled laser under the same laser driving conditions as the ones listed in Figure 3.
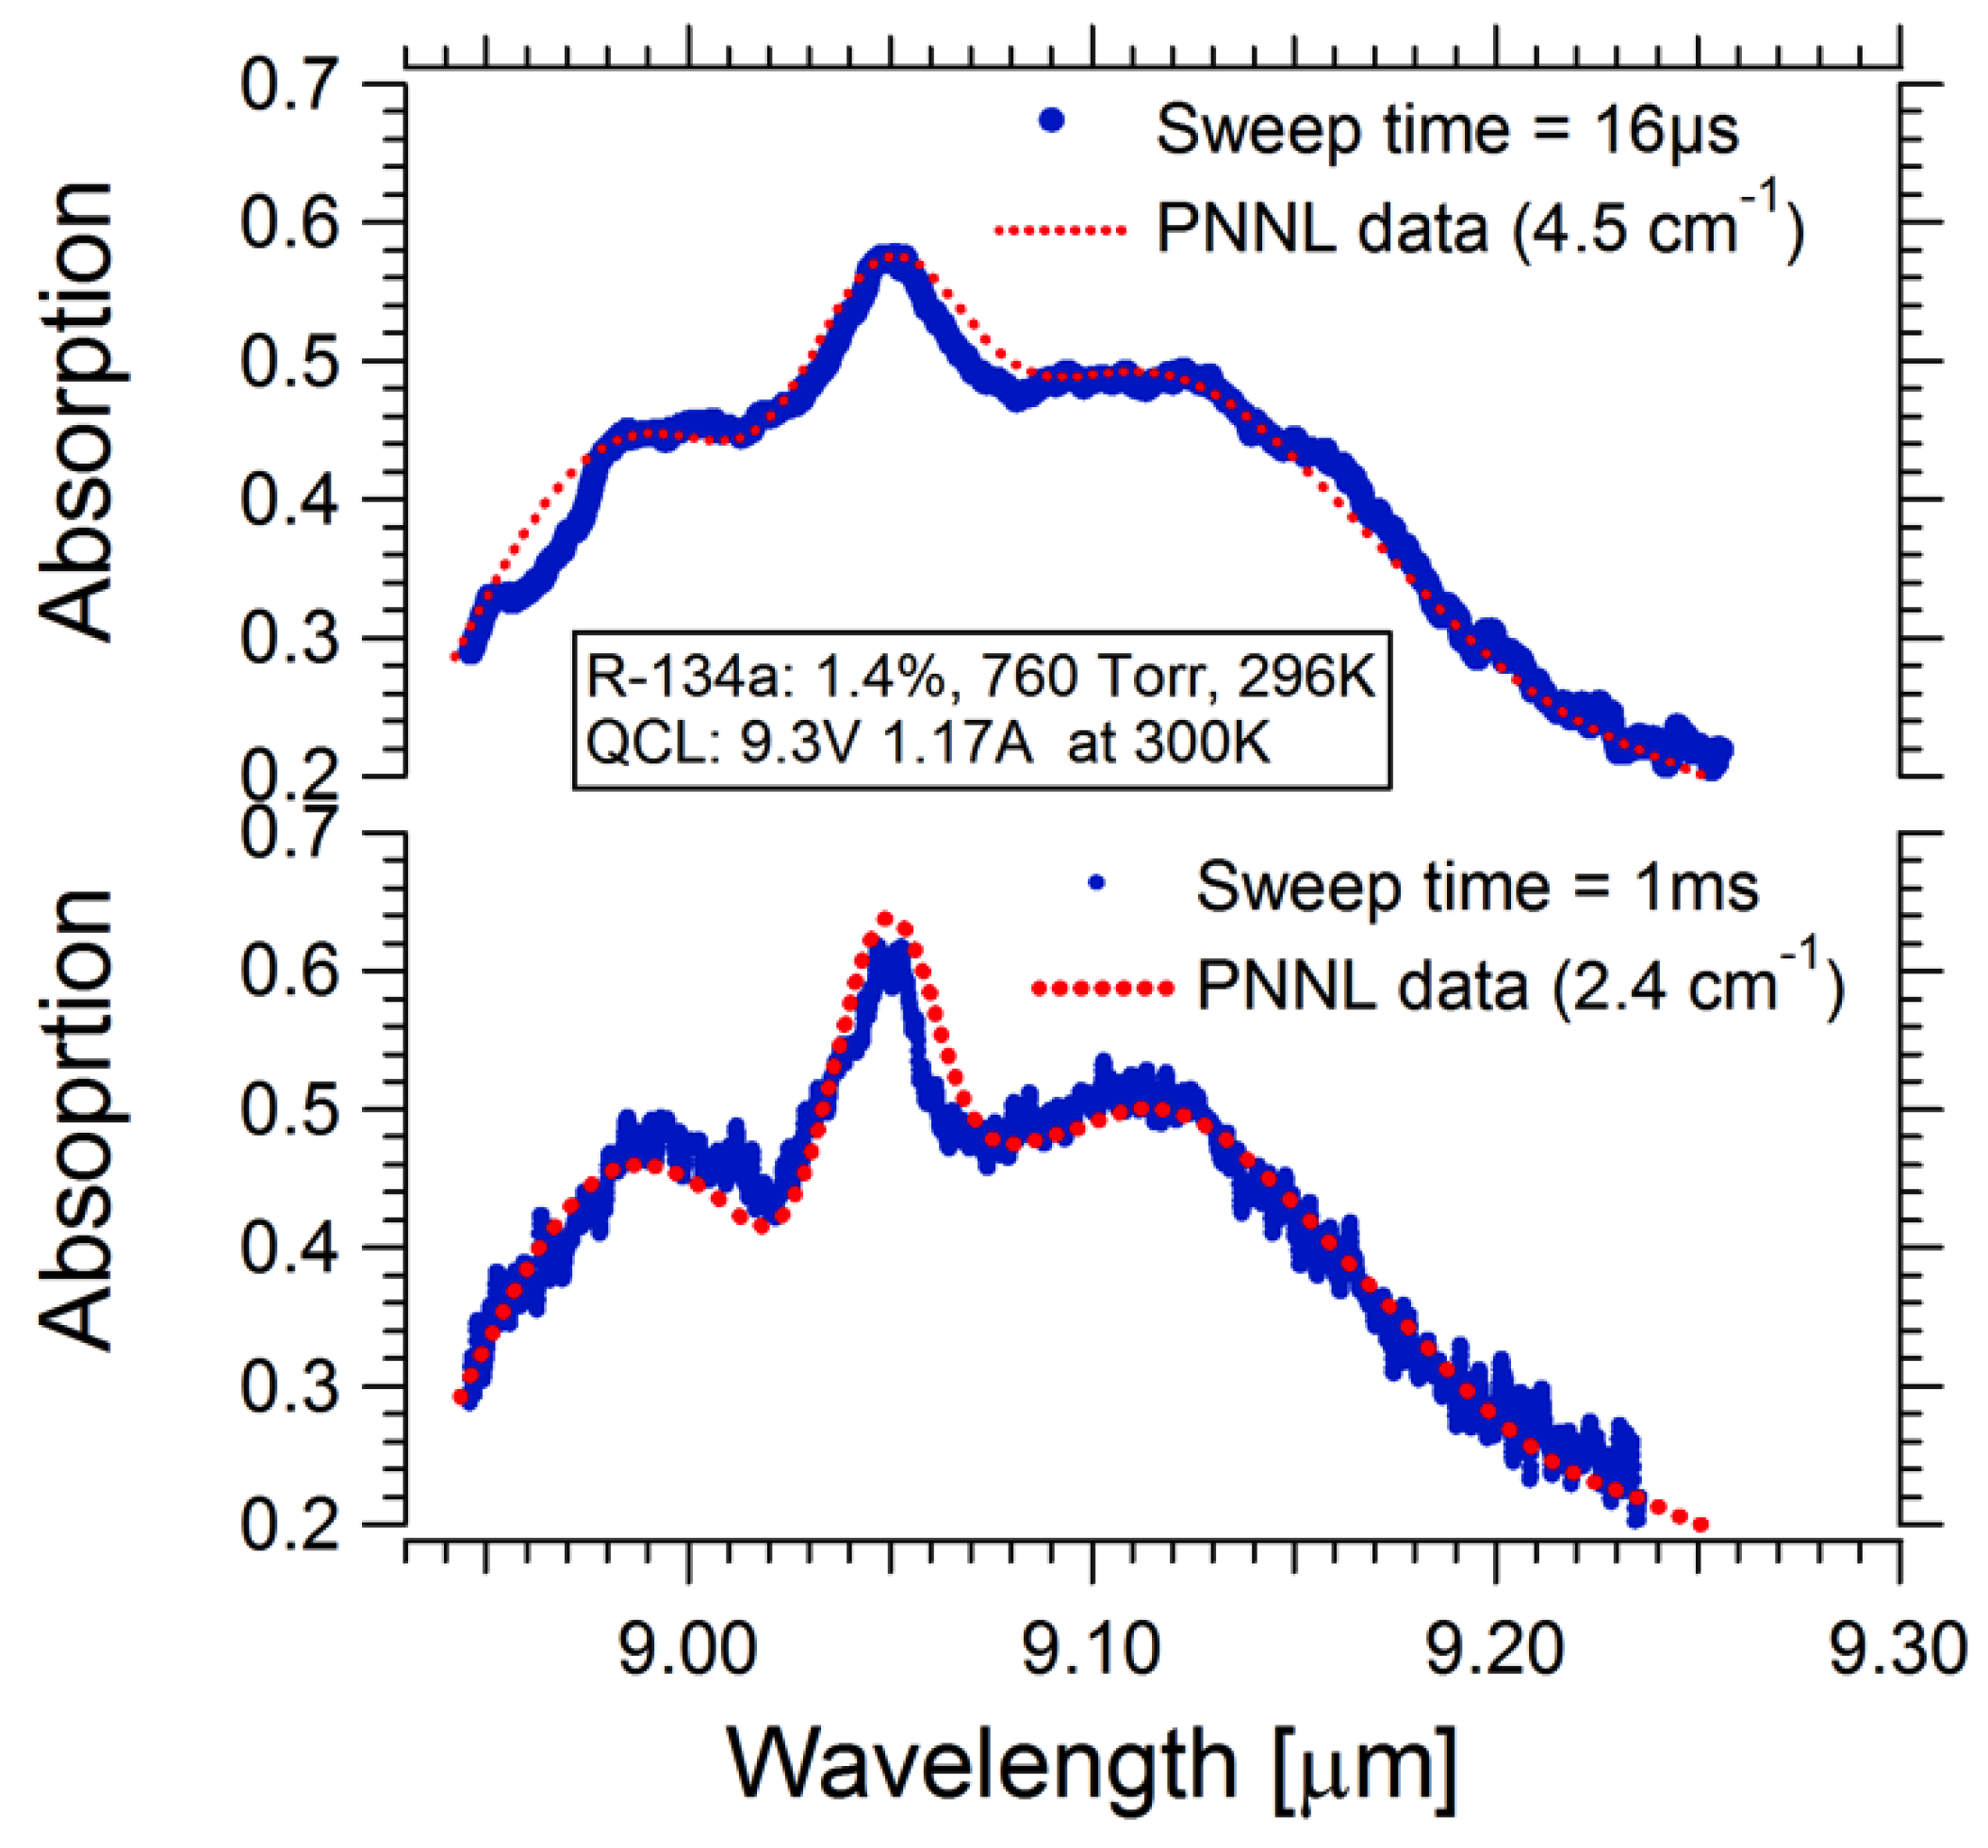
Figure 5 compares transmission spectra for refrigerant R134a (CAS no. 811-97-2) collected with a slow (1 ms) and fast (16 μs) sweep time. It is evident from the figure that the measured spectrum gets smoother as sweep time reduces. The effect can be explained noting that the effective linewidth is expected to increase for short sweep times. The increase in the linewidth required to match the simulated and experimental results is due to the chirp in the sound wave frequency across the area on the crystal illuminated by the beam. The chirp is caused by the continuous frequency sweep from one edge of the tuning curve to the other one within a short period of time. This leads to a spatial variation in the phase grating period created by the sound wave. The frequency spread is approximately a product of scanning rate and time required for sound wave to cross the illuminated area. In terms of the parameters controlled in the experiment, the additional line broadening can be estimated as:
where is the tuning range for the laser (~70 cm−1), Tsweep is the time taken to sweep emission frequency across the entire tuning range, and ttr is the sound wave transit time across the beam.

Figure 5.
Comparison between R134a absorption spectra measured for fast (16 μs; top) slow (1 ms; bottom) sweep times.
Comparison between the experimental and simulation data (Figure 5) shows that Equation (3) well describes the additional line broadening with reduction in sweep time: the additional line broadening for 16 μs sweep time compared to the 1-ms case is estimated to be 2.5 cm−1, in a good agreement with 2.1 cm−1 deduced from Figure 5. Therefore, the effective line broadening effect can be taken into account using Equation (3) when ultra-short scanning rates are used.
3.3. Quasi-Continuous Wave Operation
Due to a significant active region temperature rise (up to 100 K), the tuning range of CW EC QCLs is limited. It can be significantly extended by operating the QCL in a quasi-cw (QCW), as opposed to CW, mode of operation with a MHz-scale repetition rate and a duty cycle in the range of 20%–60%. The QCW operation allows the laser active region to cool down during the “off-cycles”, which in turn leads to a reduced average active region temperature and a higher laser performance [13]. The change of the QCL operation from the CW regime to the QCW regime is expected to lead to a change in linewidth due to the wavelength (thermal) chirp during electrical power cycling. Wavelength tuning and linewidth for the QCW operation are separately discussed below.
Figure 6 shows a measured tuning curve for the same laser in QCW mode (350 ns pulses and 50% duty cycle) as AOM frequency was changed from 41.7 MHz to 48.5 MHz (approximately 1/3 of the available frequency range). AOM input power was fixed at 35 W, which corresponded to approximately 90% diffraction efficiency and estimated 70% effective coupling efficiency of the external cavity. The emission wavelength for the EC laser tuned from 1020 cm−1 (9.8 μm) to 1170 cm−1 (8.5 μm), twice that of CW operation for the same laser. These results clearly demonstrate that a much wider tuning range can be achieved in QCW mode without sacrificing average optical power.
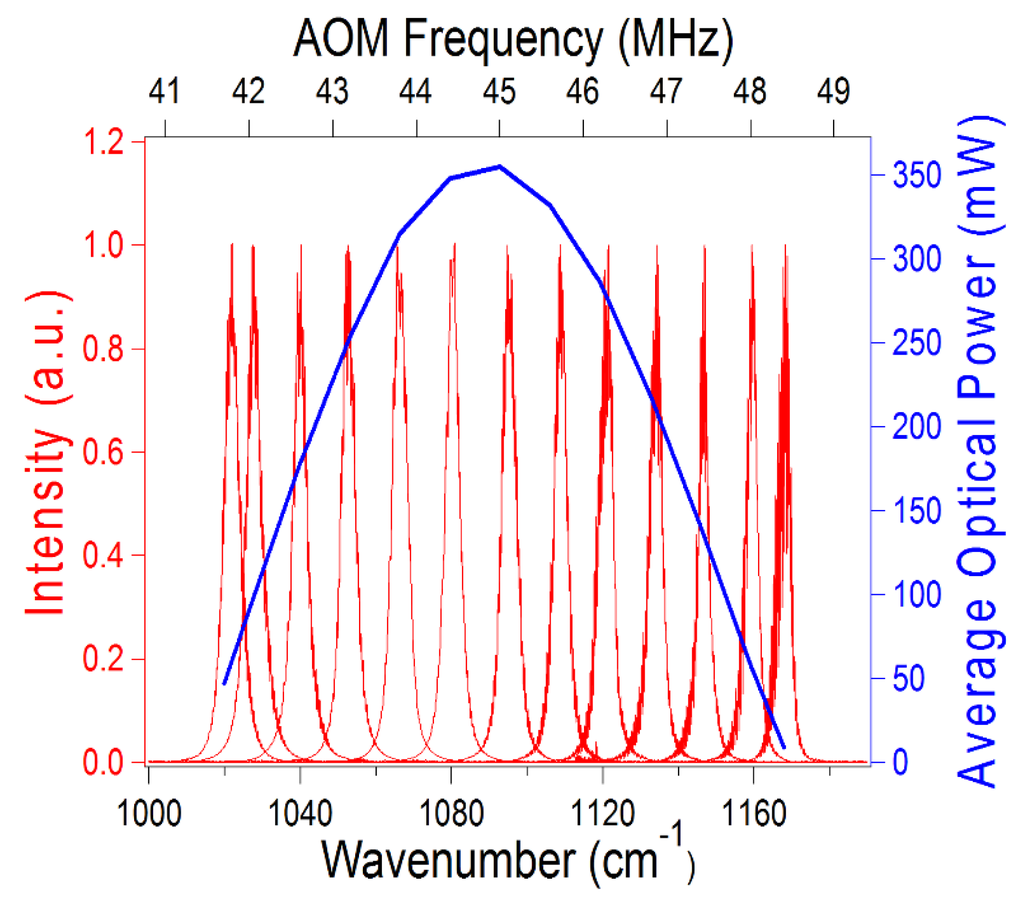
Figure 6.
Tuning curve of the QCW AOM-controlled laser.
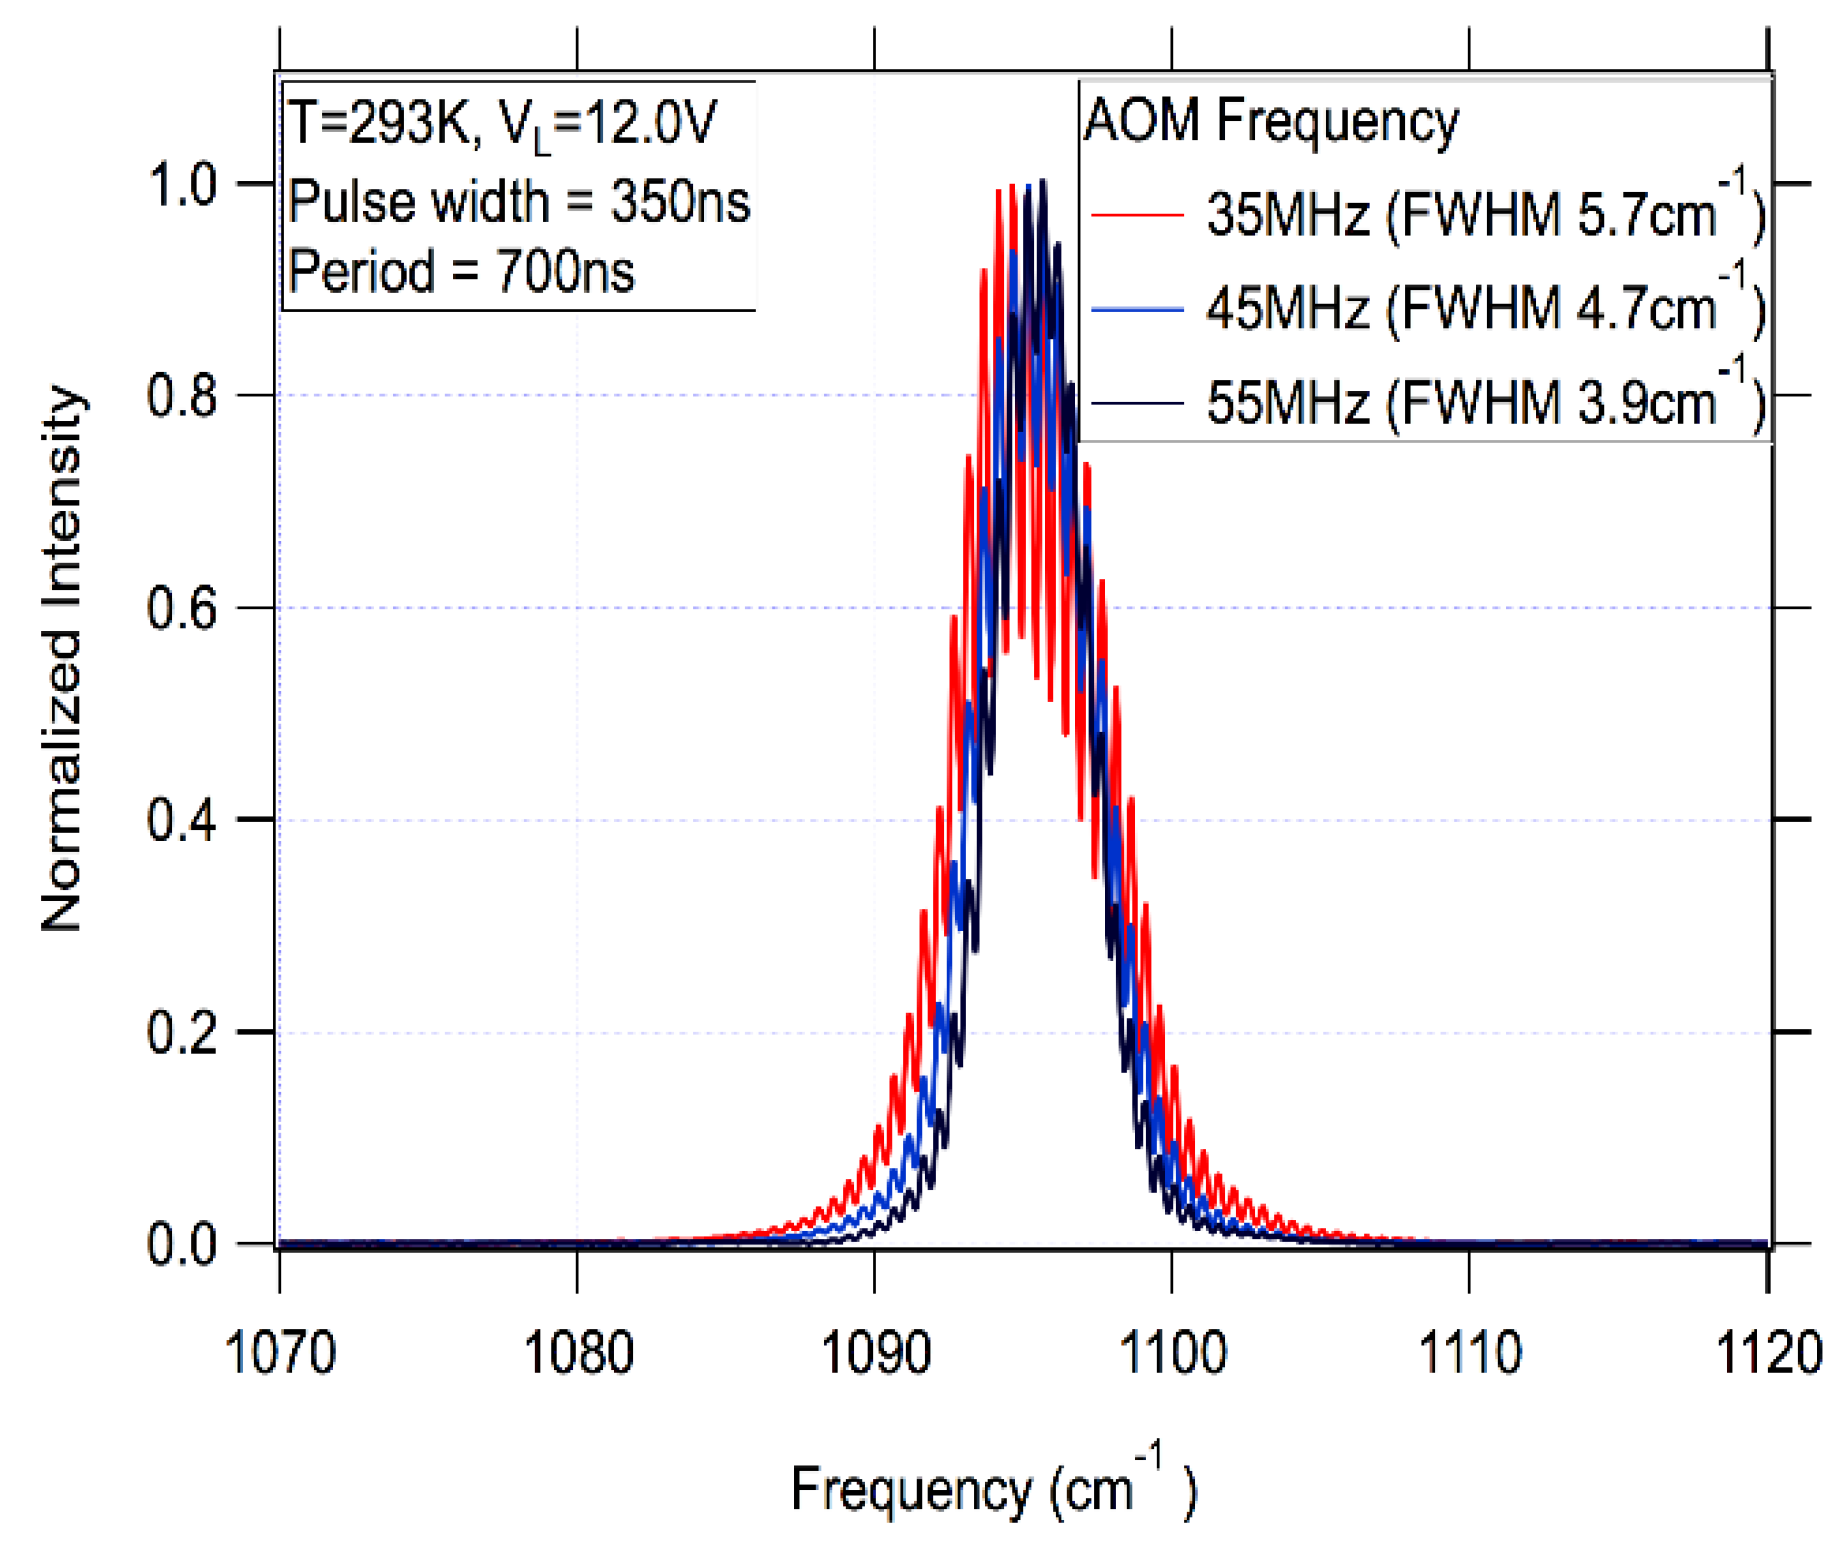
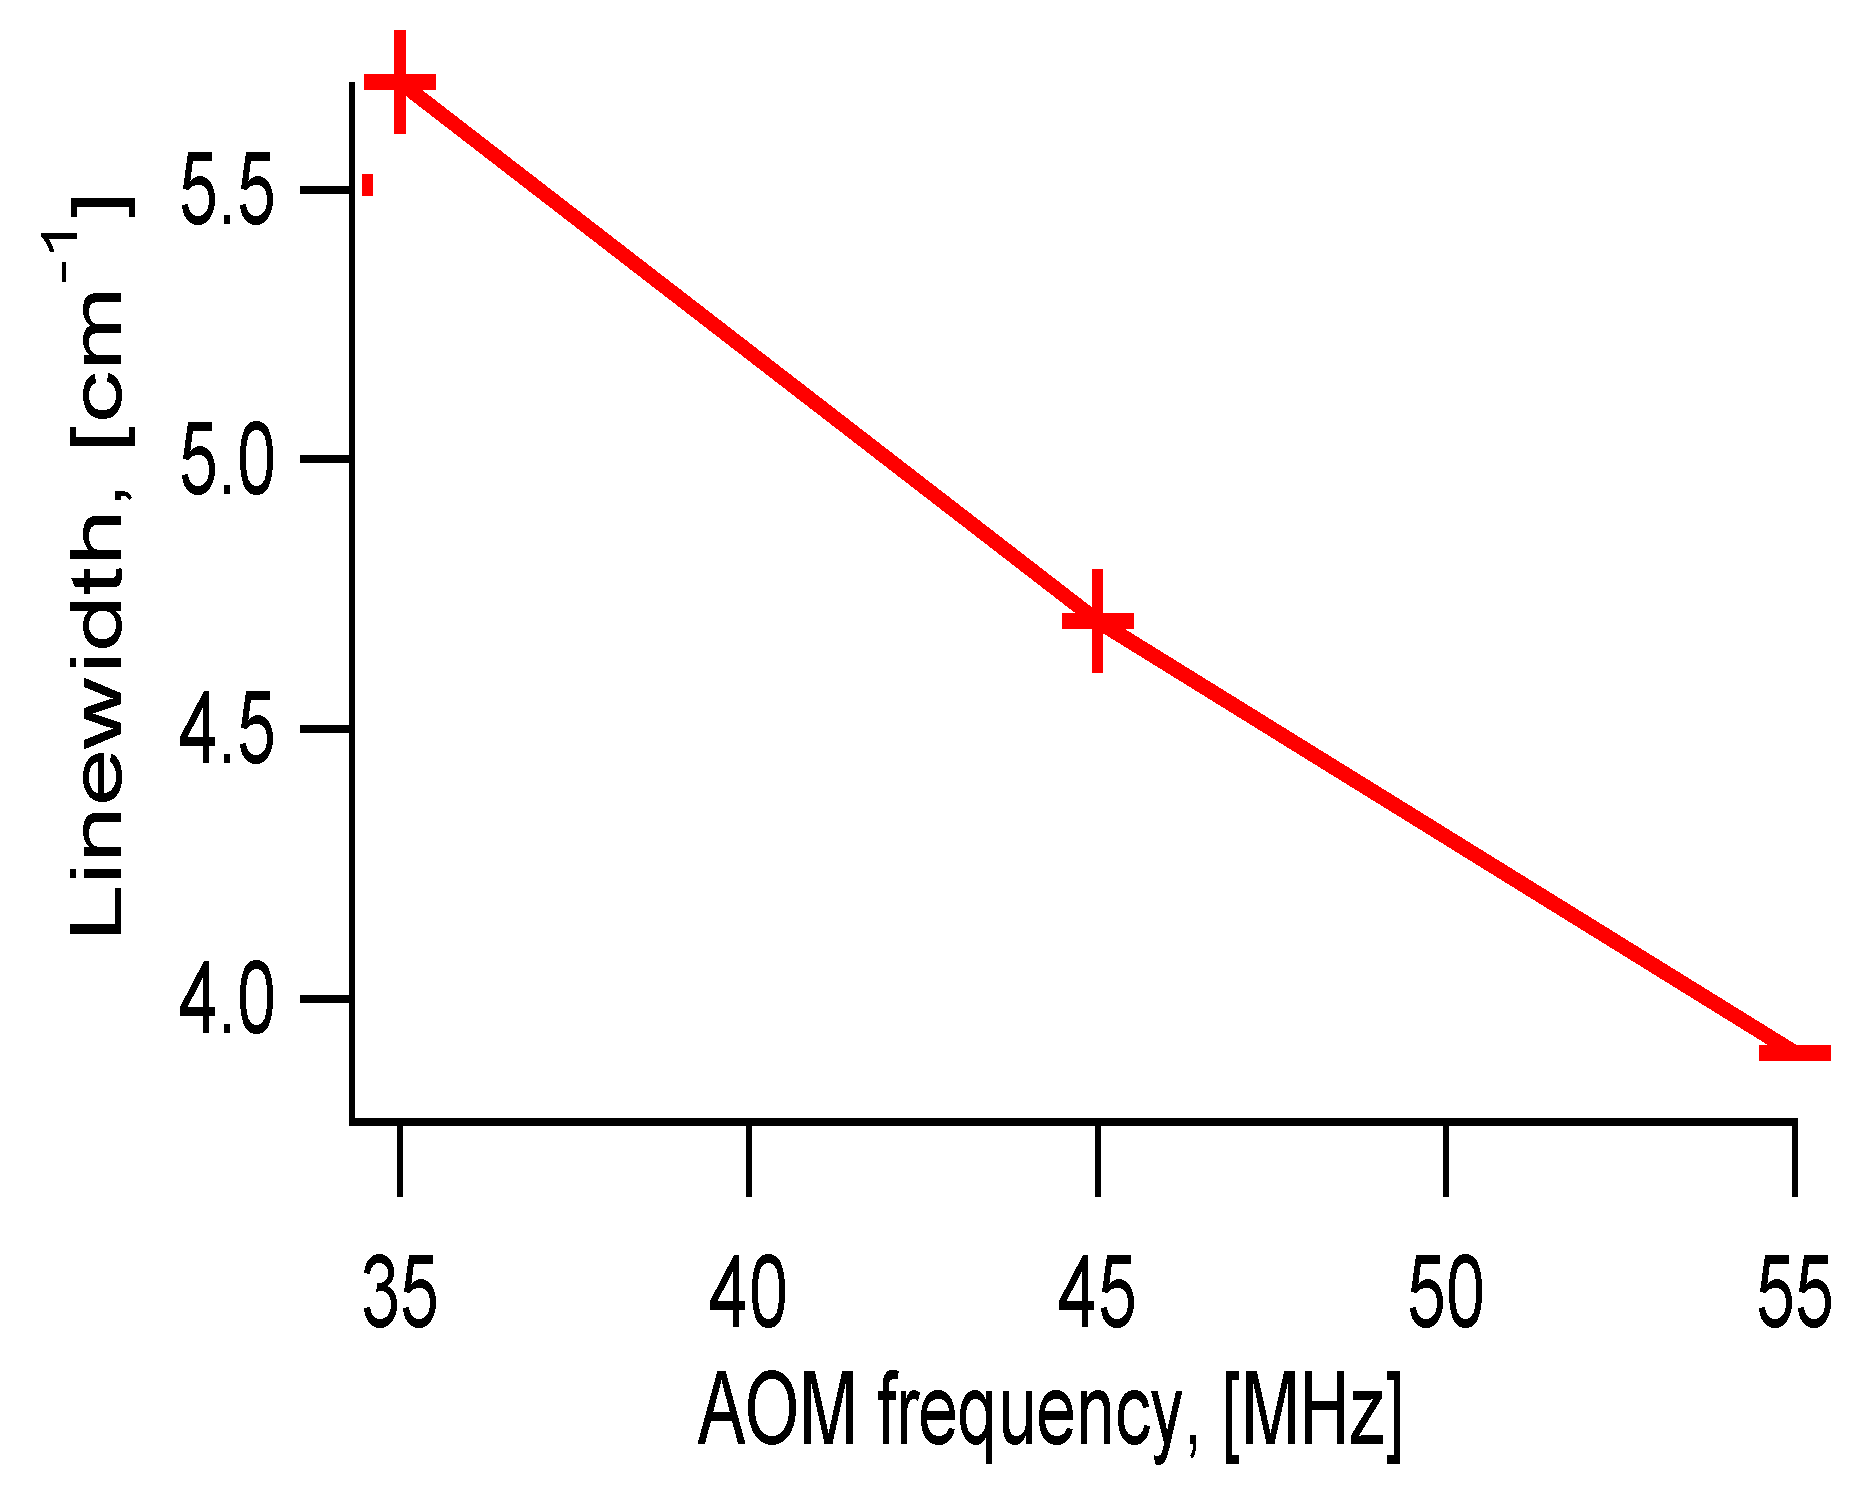
Measured QCL emission spectrum linewidth for AOM central frequency of 45 MHz was 4.7 cm−1. The increase in linewidth compared to that for CW mode of operation is attributed to the thermal wavelength chirp. The linewidth can be changed by aligning the system so that it operates at a different AOM central frequency (different Bragg condition). Employment of a higher AOM frequency will result into a larger number of illuminated acoustic grating periods and, therefore, to a proportionately narrower linewidth. To demonstrate this effect we measured linewidth for different AOM central frequencies. The increase in the central AOM frequency from 35 MHz to 55 MHz led to a linear reduction in emission linewidth from 5.7 cm−1 to 3.9 cm−1, as shown in Figure 7 and Figure 8. During these measurements, the position of the high reflectivity mirror was adjusted to keep the lasing wavelength unchanged.

Figure 7.
Spectral measurements at three AOM drive frequencies, keeping laser wavelength constant by adjusting the back reflecting mirror tilt.
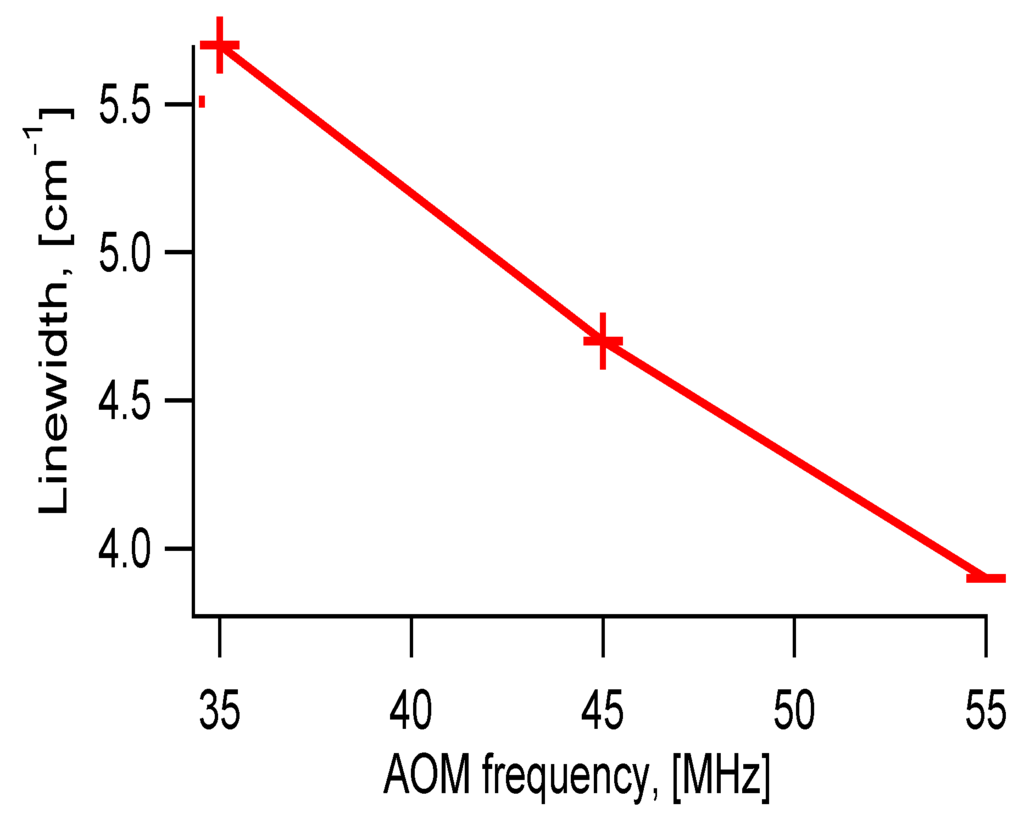
Figure 8.
Linewidth dependence on AOM frequency.
3.4. Preliminary Stand-Off Detection Studies
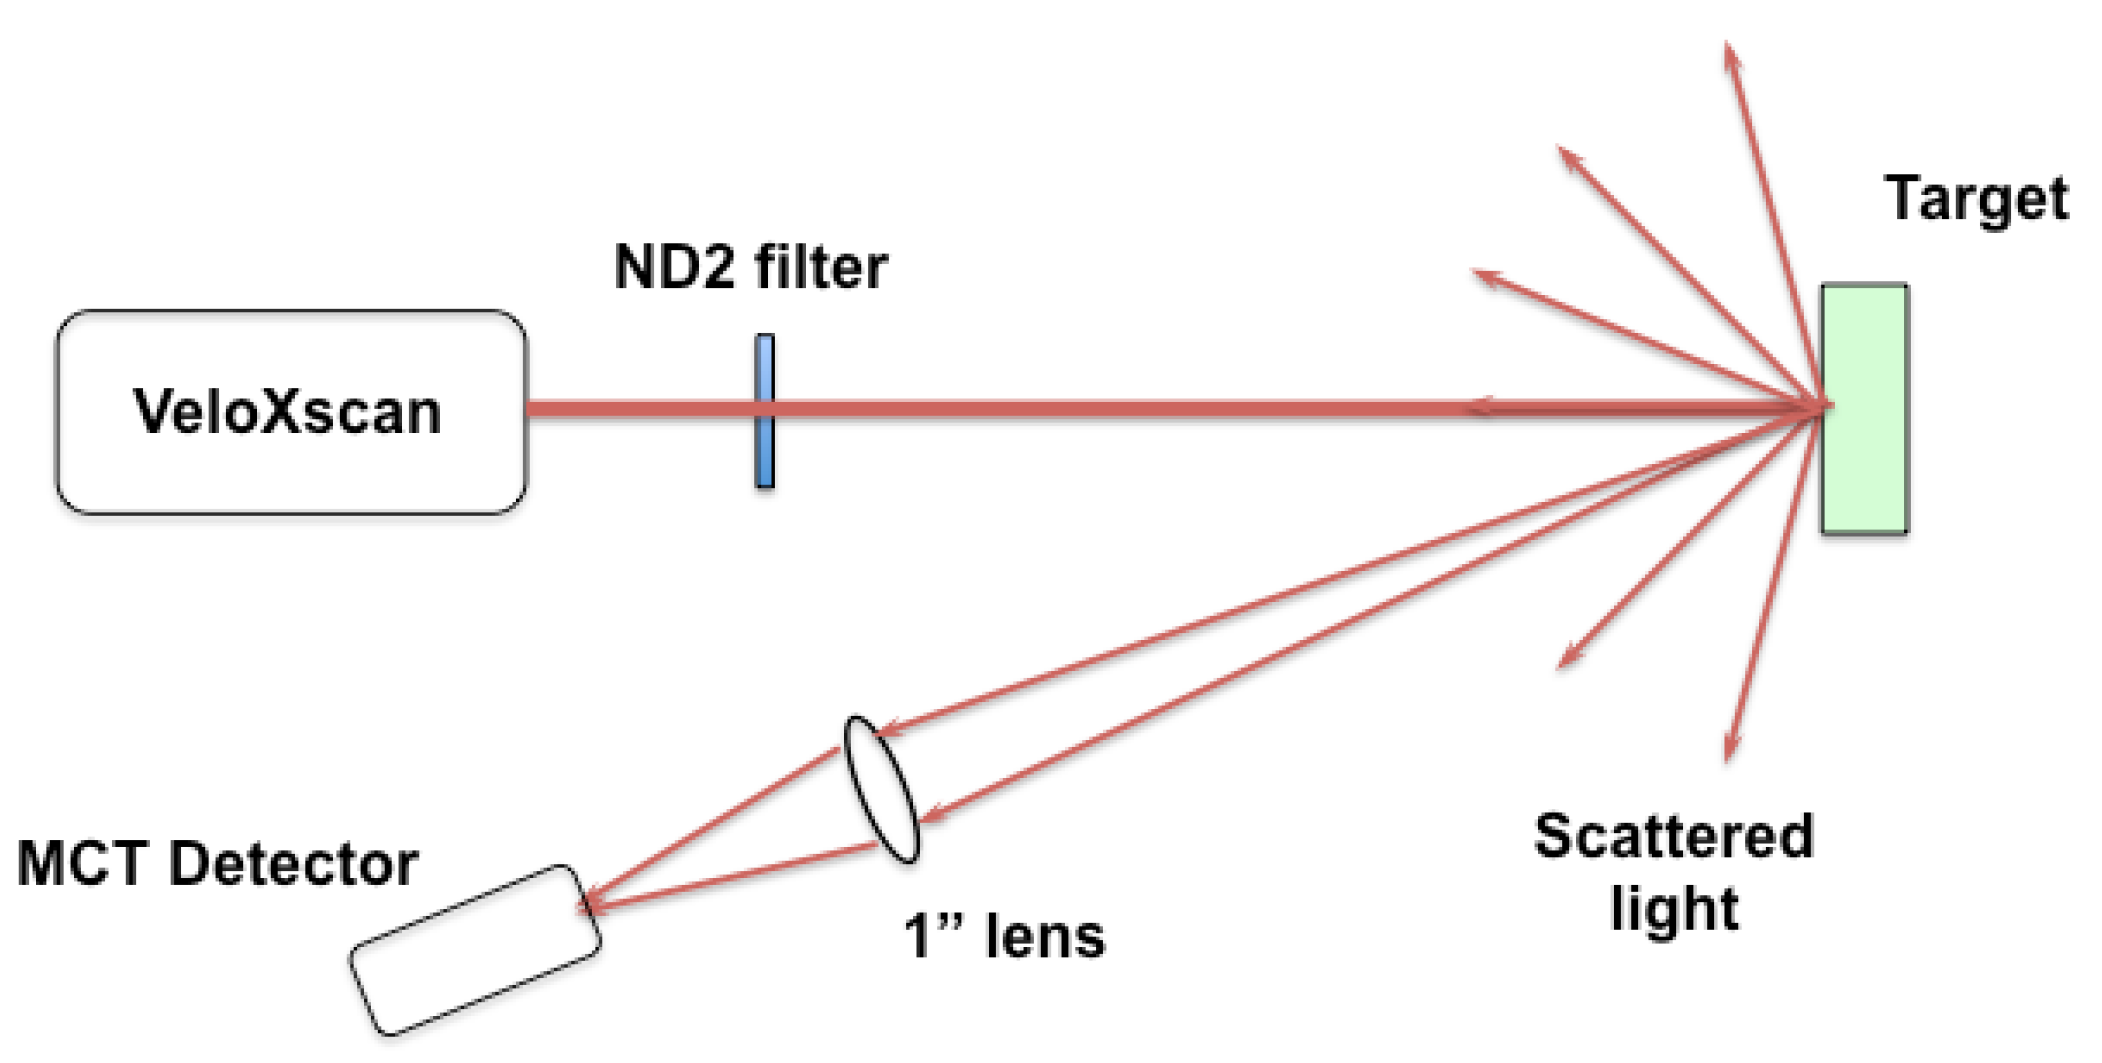
One of the potential applications for the AOM tuned QCLs is stand-off detection. We have carried out preliminary studies of short-range stand-off detection utilizing the experimental geometry shown in Figure 9. The target was placed at a distance of 50 cm from the laser source. The laser output was attenuated using an appropriate neutral density filter to assure that the detector was not saturated. A 1 cm diameter, 50 mm focal length lens, located 12 cm from the target was used to collect the laser light scattered from the target and focus light on a cooled MCT detector. The total distance from the target to the detector was 25 cm.

Figure 9.
Schematic of an AOM-controlled QCL setup for short-range standoff detection.
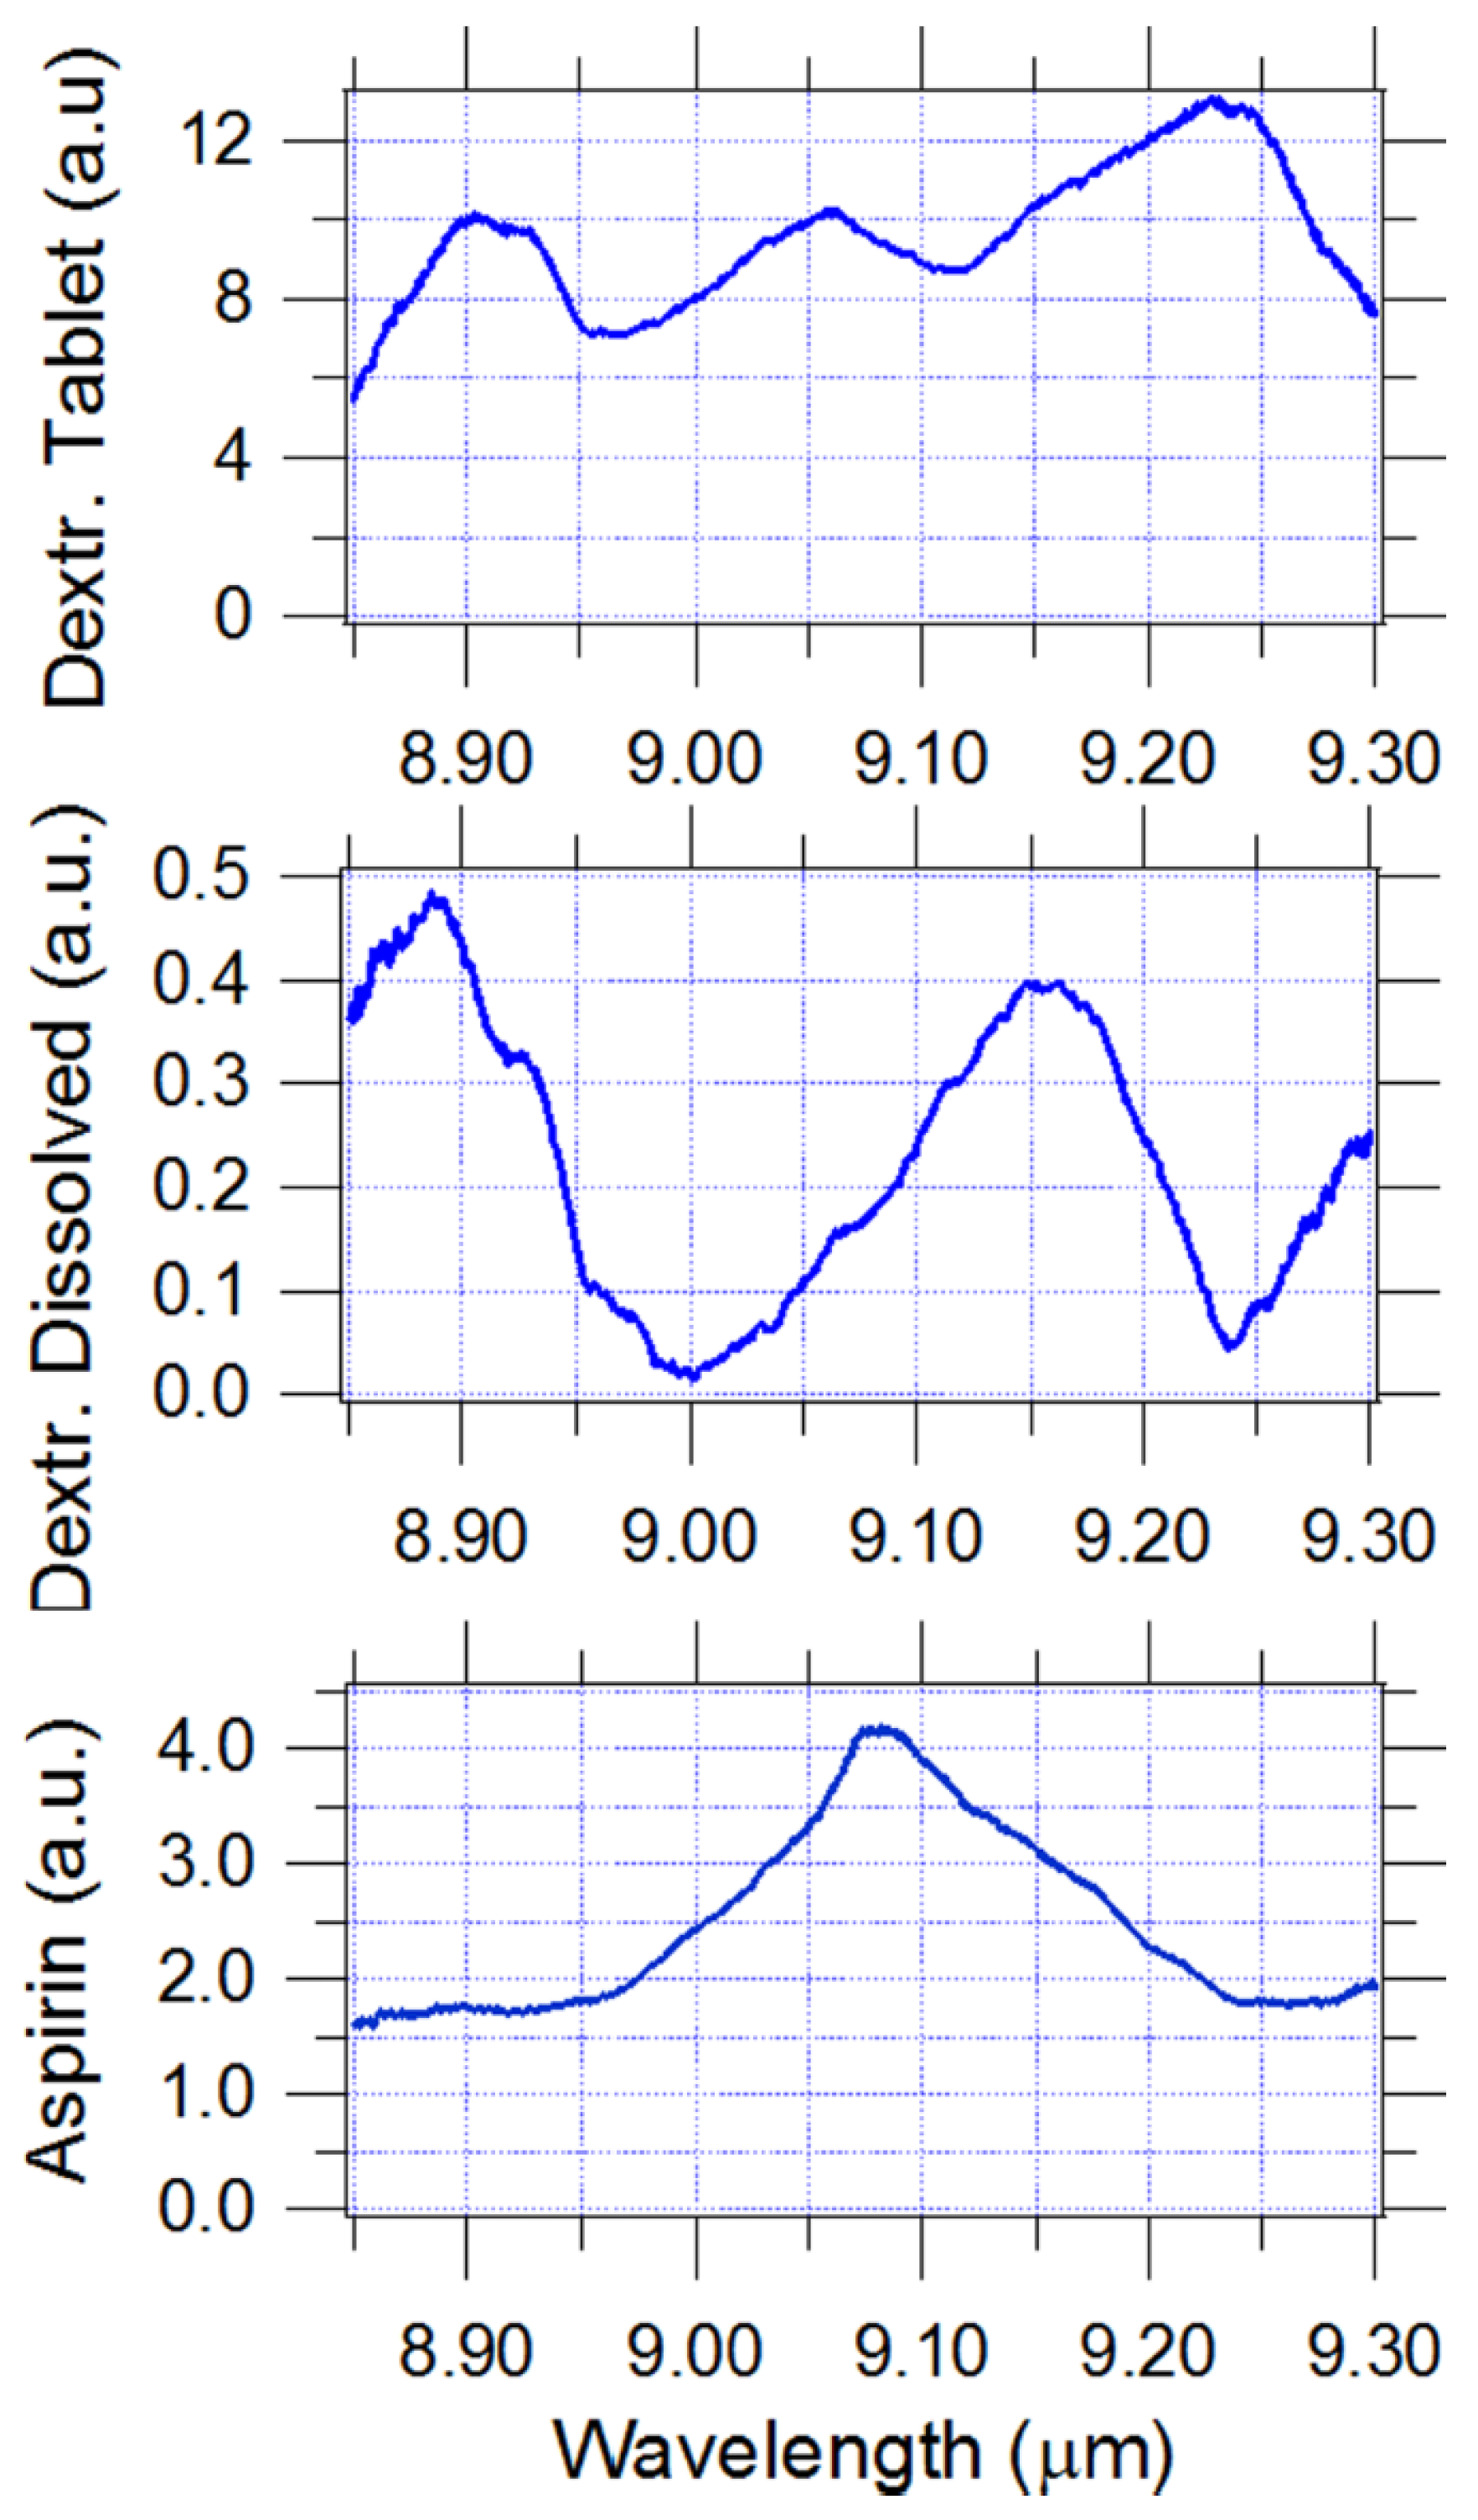
Figure 10 shows the data collected for a dextrose tablet (top graph), dissolved in water dextrose deposited on an aluminum substrate (middle graph), and dissolved in water aspirin deposited on an aluminum substrate (bottom graph). For the latter two samples, after they were dissolved in water, they were subsequently dried out before testing. Composition of the tested substances was not controlled in this prove-of-concept experiment. The measured spectra for the dextrose tablet and dissolved dextrose deposited on an aluminum substrate are different because of binders and other unknown impurities in the tablet. The scan time for each of the traces was approximately 700 μs. The preliminary data, obtained using an ND2 filter, clearly demonstrate the “single shot” data gathering capability made possible using the AOM tuned QCL system. The data also show that even at this stage of very early demonstration of the capability of AOM-controlled QCLs (VeloXscan), it is very easy to distinguish between various compounds in Figure 10.

Figure 10.
Measured short-range stand-off detection signal for dextrose tablet (top), dextrose dissolved in water (middle), and aspirin dissolved in water (bottom).
Using the present setup we estimate that data of comparable quality can be easily obtained for a stand-off distance of 2 meters by simply removing the ND2 filter and using a 2′ diameter scattered light-collecting lens.
3.5. Future Directions for AOM Tuned QCLs
For the configuration shown in Figure 1, a substantial fraction of the optical power is lost with the undiffracted beam (diffraction efficiency ~80%). The undiffracted beam can be used as the output beam, as shown in Figure 11. A very interesting aspect of the new configuration is that AOM RF power can be used to balance the laser feedback and output power. For example, AOM RF power can be (dynamically) tuned to reach the optimal efficiency for each emission wavelength under the tuning curve. This is analogous to controlling front facet reflectivity for the traditional Fabry-Perot chips. However, instead of being fixed by coating layers thicknesses, in this case, the effective reflectivity can be easily electronically adjusted on a microsecond scale.

Figure 11.
Configuration for extracting higher power output form the AOM-tuned QCL.
In contrast to the mechanical grating configuration, a single AOM can control several lasers emitting at different wavelengths at the same time. As shown in Figure 12, two or more emitters with complementary spectral coverages can be combined in a single system without increasing system size and weight. Each of these emitters can be designed to have a broad gain and, therefore, broad tuning range capability [14,15]. Their output optical beams can be combined in a single beam using either the polarization beam combining approach or the dichroic beam combining approach. The multiple-emitter configuration is projected to result into a tunable laser source with an ultra-broad coverage (4–12 μm) and ultra-rapid wavelength tuning.

Figure 12.
Dual-laser AOM-tuned QCL setup.
Additionally, unlike mechanical grating tuned QCLs, the AOM-tuned QCLs can be made to operate at more than one wavelength at a time by driving the AOM crystal with a combination of frequencies. Each one of the RF drive frequency sets up an independent grating period, which forces the QCL to operate at different wavelengths simultaneously. As a consequence, several absorption features can be tracked at the same time. Again, the wavelengths can be changed, independently, on a microsecond time scale.
The AOM that was used in References [7,8] required water-cooling. However, our experimental results showed that input RF power of only 20–25 W was sufficient for efficient module operation. That level of power dissipated in the crystal can be removed using thermo-electrical cooling (TEC)/air-cooling, a much more compact and power efficient approach. The air-cooled AOM-controlled QCL can be packaged in a “shoebox-size” platform designed for handheld applications.
4. Conclusions
The control of an all electronically tuned external cavity QCL using an AOM opens up unique opportunities in the infrared spectroscopy field. A compact (handheld), reliable, and ruggedized tunable system can be designed to cover the entire MWIR and LWIR spectral regions with an ultra-fast tuning time and a very flexible (multi) wavelength control. All the building blocks of the system represent mature technologies that are compatible with a high yield, large throughput production.
Acknowledgments
Work reported in this paper was supported, in part, by Army STTR contract #W911SR-14-C-0067 under the oversight of Alan Samuels (Edgewood Chemical Biological Center).
Author Contributions
A. Lyakh and C. Kumar N. Patel conceived and designed the experiments, A. Lyakh, R. Barron-Jimenez, I. Dunayevskiy, R. Go, and E. Tsvid performed the experiment and analyzed data.
Conflicts of Interest
The authors declare no conflict of interest.
References
- Andress, H.; Gustavo, V.; Stephane, B.; Liu, H.C. Mid-infrared frequency comb based on a quantum cascade laser. Nature 2012, 492, 229–233. [Google Scholar]
- Villares, G.; Wolf, J.; Kazakov, D.; Suess, M.; Hugi, A.; Beck, M.; Faist, J. On-chip dual-comb based on quantum cascade laser frequency combs. Appl. Phys. Lett. 2015, 107. [Google Scholar] [CrossRef]
- Luo, G.P.; Peng, C.; Le, H.Q.; Pei, S.S.; Hwang, W.-Y.; Ishaug, B.; Um, J.; Baillargeon, J.N.; Lin, C.-H. Grating-tuned external-cavity quantum-cascade semiconductor lasers. Appl. Phys. Lett. 2001, 78, 2834–2836. [Google Scholar] [CrossRef]
- Tsai, T.; Wysocki, G. External-cavity quantum cascade lasers with fast wavelength scanning. Appl. Phys. 2010, 100, 243–251. [Google Scholar] [CrossRef]
- Grahmann, J.; Merten, A.; Herrmann, A.; Ostendorf, R.; Bleh, D.; Drabe, C.; Kamenz, J. Large MOEMS Diffraction Grating Results Providing an EC-QCL Wavelength Scan of 20%. Proc. SPIE 2015, 9375. [Google Scholar] [CrossRef]
- Koroglu, B.; Pryor, O.; Lopez, J.; Nash, L.; Vasu, S. Shock tube ignition delay times and methane time-histories measurements during excess CO2 diluted oxy-methane combustion. Combust. Flame 2016, 164, 152–163. [Google Scholar] [CrossRef]
- Lyakh, A.; Barron-Jimenez, R.; Dunayevskiy, I.; Go, R.; Patel, C.; Kumar, N. Continuous wave operation of quantum cascade lasers with frequency shifted feedback. AIP Adv. 2016, 6, 29715. [Google Scholar] [CrossRef]
- Lyakh, A.; Barron-Jimenez, R.; Dunayevskiy, I.; Go, R.; Patel, C.; Kumar, N. External cavity quantum cascade lasers with ultra rapid acousto-optic tuning. Appl. Phys. Lett. 2015, 106, 2834. [Google Scholar] [CrossRef]
- Thompson, D.C.; Bush, G.E.; Hewitt, C.G.; Remelius, D.K.; Shimada, T.; Strauss, C.E.; Wilson, C.W.; Zaugg, T.J. High-speed random access laser tuning. Appl. Opt. 1999, 38, 2545–2553. [Google Scholar] [CrossRef]
- Yumoto, M.; Maeda, Y.; Saito, N.; Norihito, S.; Takyo, O.; Masafumi, Y.; Satoshi, W. Electronic Wavelength Tuning of Tunable Laser with Acousto-Optic Tunable Filter. Jpn. J. Appl. Phys. 2008, 11, 8411–8415. [Google Scholar] [CrossRef]
- Yatsenko, L.P.; Shore, B.W.; Bergmann, K. Theory of a frequency-shifted feedback laser. Opt. Commun. 2004, 236, 183–202. [Google Scholar] [CrossRef]
- Streifer, W.; Whinnery, J.R. Analysis of a dye laser tuned by acousto-optic filter. Appl. Phys. Lett. 1970, 17, 335–337. [Google Scholar] [CrossRef]
- Maulini, R.; Lyakh, A.; Tsekoun, A.; Go, R.; Patel, C.; Kumar, N. High average power uncooled mid-wave infrared quantum cascade lasers. Electron. Lett. 2011, 47, 395–397. [Google Scholar] [CrossRef]
- Maulini, R.; Beck, M.; Faist, J.; Gini, E. Broadband tuning of external cavity bound-to-continuum quantum cascade lasers. Appl. Phys. Lett. 2004, 84, 1659–1661. [Google Scholar] [CrossRef]
- Maulini, R.; Yarekha, D.A.; Bulliard, J.-M.; Giovannini, M.; Faist, J. Continuous-wave operation of a broadly tunable thermoelectrically cooled external cavity quantum cascade laser. Opt. Lett. 2005, 30, 2584–2586. [Google Scholar] [CrossRef] [PubMed]


© 2016 by the authors; licensee MDPI, Basel, Switzerland. This article is an open access article distributed under the terms and conditions of the Creative Commons Attribution (CC-BY) license (http://creativecommons.org/licenses/by/4.0/).