Abstract
The visual performance and photobiological effects of white LED systems based on spectral compensation are discussed, specifically focusing on the total optical power, the ratio of scotopic vision luminous flux to photopic vision luminous flux (S/P), the blue light hazard (BLH), and the circadian action factor (CAF). Theoretical models are established by integrating the spectral power distribution (SPD) with spectral sensitivity functions associated with the human visual system, and meanwhile, the impacts of LEDs’ electro-thermal characteristics on the mixed spectral structure and optical properties are analyzed. As experimental results demonstrate, an excellent agreement is shown between the calculated and measured values of the total optical power, S/P, BLH, and CAF, in terms of both values and variation trends. These proposed models are expected to serve as effective tools for understanding the visual perception and non-visual biological effects in specific illumination environments. Moreover, they can offer valuable reference frameworks for the development of lighting solutions that are more human-centered and health-oriented.
1. Introduction
With the rapid development of solid-state lighting technology, light-emitting diodes (LEDs) have emerged as the fourth-generation lighting sources, attributed to their high luminous efficiency, color-tunable property, and environmental friendliness [1,2]. Over the past few decades, the design, optimization, and control of LED devices and systems have predominantly centered around visual performance, aiming to enhance luminous efficiency and color quality [3,4]. However, with the increasing duration of people’s exposure to artificial lighting environments, findings from biological and medical research indicate that light stimuli have significant photobiological impacts on humans, which are also commonly referred to as non-visual biological effects [5,6,7]. The potential health risks posed by blue light exposure have garnered growing research interest since 1966 [8]. Characterized by relatively high energy, blue light can penetrate the cornea and lens and reach the retina directly, causing photochemical damage to the retina, which is called blue light hazard (BLH) [9]. It has been proved that photochemical damage due to excessive ocular exposure to blue light can trigger a cascade of pathological changes, including oxidative stress, mitochondrial dysfunction-mediated apoptosis, inflammatory responses, and DNA damage [10,11,12]. The human retina contains various photoreceptor cells to receive light stimuli. Among them, the intrinsic photosensitive retinal ganglion cells (ipRGCs), are mainly involved in regulating physiological functions such as work efficiency, circadian rhythm, reaction time and cognitive performance [13,14]. Even more, inappropriate light stimuli may disrupt physiological functions, leading to multiple negative impacts on human health, though not all of these impacts have been fully elucidated [15,16]. The circadian action factor (CAF) proposed by Gall et al. is used to quantify the role of lighting in regulating human physiological functions, and now it has been gradually adopted as a quantitative metric in evaluation and design of light sources [17].
As the health consciousness continues to grow, there is a rising preference for natural lighting, especially in indoor environments [18]. Consequently, it is essential to take into account both the visual and non-visual biological effects of light sources on humans to create human-centric and healthy lighting environments [19]. The phosphor-converted (PC) white LEDs, which combine YAG:Ce3+ phosphors and blue GaN-based chips, are the dominant artificial lighting sources due to their technological maturity and cost-effectiveness [20,21]. Nonetheless, these PC white LEDs have a relatively fixed spectral structure, lacking red and green spectra [22,23]. As a result, they typically exhibit a nearly constant correlated color temperature (CCT) and a relatively low color rendering index (CRI) [24]. In our prior research, significant advancements were achieved in investigating the potential of PC white LEDs optimized through red and green spectral compensation. The study validated that this compensation methodology could effectively modulate the CCT while concurrently improving the CRI, thereby enhancing the overall lighting quality [25]. Notwithstanding these findings, the published work did not fully explore the visual and photobiological impacts of these compensated white LED systems, primarily due to spatial limitations.
In view of the above-mentioned issues, this paper focuses on the compensated white LED systems composed of a PC white LED, a monochromatic green LED, and a monochromatic red LED, all of which can be independently driven. According to the tunable dimming solution proposed linking the spectral colorimetry and the general photo-electro-thermal (PET) theory, the core objective of this paper is to explore the visual performance and photobiological effects of the LED systems based on spectral compensation. Through detailed discussions of theoretical analysis and experimental verification, it aims to comprehensively understand the practical significance of spectral compensation in LED lighting applications, to clarify the relationships between the LEDs’ electro-thermal characteristics and their impacts on visual and photobiological effects, and ultimately contribute to the development of lighting solutions that are more human-centered and health-oriented.
2. Analysis and Modeling
Human visual perception is a complex process, which is closely related to the spectral structure and characteristics of light sources [26]. Under varying lighting conditions, the human visual system exhibits different capabilities in discerning details and perceiving colors [27]. Correspondingly, the physiological functions regulated by light stimulus also differ under diverse lighting scenarios. In our prior research [28], two crucial parameters CCT and CRI of the compensated white LED systems have been studied. To further assess lighting from a human-centered perspective, this study conducts an in-depth exploration of several additional aspects: the total optical power, the ratio of scotopic vision luminous flux to photopic vision luminous flux (S/P), the blue light hazard (BLH), and the circadian action factor (CAF).
It is noted that the compensated white LED system studied in this paper is composed of a PC white LED, a monochromatic red LED, and a monochromatic green LED—all of which support independent driving. A structural schematic of this system is provided in Figure 1. In this system, the PC white LED serves as the core component and operates in a steady state, thereby providing the basic luminous flux required for lighting applications. Meanwhile, the monochromatic red and green LEDs function as spectral compensators, enabling adjustment of red and green spectral components by regulating the electrical driving state.
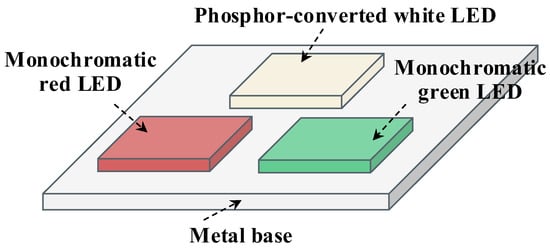
Figure 1.
Schematic diagrams of the compensated white LED system.
2.1. The Total Optical Power (Popt)
As the compensated white LED system is composed of three LEDs, i.e., a PC white LED, a monochromatic red LED, and a monochromatic green LED, the total SPD and optical power thereby can be described as
where PW(λ), PR(λ) and PG(λ) are SPDs corresponding to the PC white LED, the monochromatic red LED, and the monochromatic green LED, respectively, and P(λ) is the total SPD of the mixed spectra; Popt,W, Popt,R and Popt,G are optical power corresponding to the PC white LED, the monochromatic red LED, and the monochromatic green LED, respectively, and Popt is the total optical power of the mixed spectra.
For a monochromatic LED under an effective thermal design, a linear relationship exists between the optical power and the driving current [29], as clearly shown in Figure 2a. Consequently, for both the monochromatic red LED and the monochromatic green LED of the compensated white LED system, their optical power can be mathematically expressed as a linear function of the current,
where kR1 and kR2 are the coefficients describing the relationship between the optical power and driving current, for the monochromatic red LED; correspondingly, kG1 and kG2 are the coefficients describing the relationship between the optical power and driving current, for the monochromatic green LED.
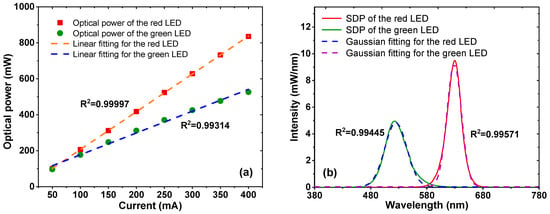
Figure 2.
The optical power and SDP of the monochromatic LEDs: (a) optical power; (b) SPD.
Since the PC white LED is operating in a steady state, and the monochromatic red and green LEDs are driven with changing currents, by combining Equations (1) and (2), the total optical power of the compensated white LED system is further described as
where kR1, kR2, kG1 and kG2 are the same as defined in Equation (2); Popt,W0 represents the constant optical power of the PC white LED; Popt,0 means the total optical power of the compensated white LED system at the given operating point (IR,0, IG,0), i.e., the red LED is operating with current IR,0 and the green LED is operating with current IG,0, and specifically Popt,0 = Popt,W0 + kR1 + kR2 IR0 + kG1 + kG2 IG0; kWR0G and kWRG0 are merged parameters introduced in the model to simplify the expression, respectively, of kWR0G = Popt,W0 + kR1 + kR2IR0 + kG1, kWRG0 = Popt,W0 + kR1 + kG1 + kG2IG0.
Equation (3) indicates that the total optical power of the mixed spectra emitted from the compensated white LED system can be expressed as a function of the driving currents IR and IG, where IR and IG correspond to the driving currents of the monochromatic red LED and monochromatic green LED, respectively.
2.2. The Ratio of Scotopic Vision Luminous Flux to the Photopic Vision Luminous Flux (S/P)
The retinal cells in human eyes exhibit distinct differences in light sensitivity and color perception, enabling humans to adapt to a wide range of ambient lighting conditions and efficiently gather visual information [30]. Photopic vision occurs in bright environments, where human eyes predominantly rely on cone cells to perceive light stimulus and distinguish object details such as color, shape, and texture. In contrast, scotopic vision is associated with darker environments, where rod cells become active in response to light stimuli. It is noted that although rod cells are highly sensitive to light, they have extremely limited color-discrimination ability. Actually, the major contribution of these rod cells is to assist in identifying the outlines and general shapes of objects in the dark, facilitating the perception of the surrounding environment.
The S/P represents the ratio of the scotopic vision luminous flux (S) to the photopic vision luminous flux (P), which is utilized to assess the luminous efficacy of light sources at low luminance levels [31]. In lighting design, the S/P can, on one hand, reflect the adaptability of the human visual system to the variation in illumination; on the other hand, it can serve as a valuable reference for adjusting the parameters of light sources and the surrounding environment according to specific visual requirements [32]. S/P is defined as
where P(λ) is the spectral power distribution (SPD) of the light source; V′(λ) and V(λ) are the spectral sensitivity functions under scotopic vision and photopic vision, respectively, with peak wavelengths corresponding to 507 nm and 555 nm; Ks and Km are defined as the maximum spectral luminous efficacy values for scotopic vision (1700 lm/W) and photopic vision (683 lm/W), respectively [32].
Referring to Equation (1), the SPD of the compensated white LED system is given by P(λ) = PW(λ) + PR(λ) + PG(λ); thus, Equation (4) can be rewritten as
Typically, the SPD of a monochromatic LED can be described using a Gaussian function [33]. As shown in Figure 2b, the SPDs of the monochromatic red and green LEDs, along with their corresponding Gaussian fitting curves, are presented. The high values of coefficient of determination (R2) indicate the rationality of the Gaussian fittings. Thus, the SPDs of the monochromatic red and green LEDs can be expressed in the mathematical form as follows:
where Popt,R and Popt,G are the same as defined in Equation (1); λpeak,R and σR are, respectively, the peak wavelength and the rated coefficient of full-width at half-maximum (FWHM) of the monochromatic red LED; λpeak,G and σG are, respectively, the peak wavelength and the rated coefficient of FWHM of the monochromatic green LED.
Combining Equations (2), (5) and (6), the S/P of the compensated white LED system can be expressed as
Since the peak wavelength and the corresponding FWHM of a monochromatic LED remain essentially unchanged with the driving current, parameters λpeak,R, λpeak,G, σR and σG can be treated as constants for simplified analysis [34]. Additionally, the SPD of the PC white LED, i.e., PW(λ), is also fixed due to the stable operating conditions of the PC white LED. Therefore, the expression of S/P in Equation (7) can be further simplified as
In Equation (8), the parameters SWRG, PWRG, SR, PR, SG and PG are introduced to simplify the expression of the S/P model, and their specific definitions are provided as follows:
Given the constancy of these foundational parameters (kR1, kR2, kG1, kG2, λpeak,R, σR, λpeak,G, σG and PW(λ)), the derived parameters SWRG, PWRG, SR, PR, SG and PG can also be regarded as constants.
Equation (8) indicates that the S/P of the mixed spectra emitted from the LED system based on spectral compensation is also determined by the driving currents of the monochromatic red and green LEDs, denoted as IR and IG.
2.3. Blue Light Hazard (BLH) Efficacy
BLH generally refers to the potential photochemical risk to the retinal tissues of human eyes caused by the radiation exposure in the wavelength range of 400–500 nm [35]. For a light source, the potential for retinal BLH is evaluated via the BLH efficacy, which is defined as the ratio of the blue-light-weighted radiometric quantity to the photometric quantity [36], as follows:
where BLH denotes the BLH efficacy, V(λ) is the spectral sensitivity functions under photopic vision, B(λ) represents the BLH spectral weighting function characterized by a wavelength peak approximately in the range of 435–440 nm. Additionally, the constant parameter Km is consistent with that in Equation (4), i.e., the maximum spectral luminous efficacy for photopic vision, with a standard value of 683 lm/W.
Substituting P(λ) = PW(λ) + PR(λ) + PG(λ) into Equation (10), the corresponding BLH can be rewritten as
Now, combining Equations (2), (6) and (11), the BLH of the compensated white LED system is expanded as
Similar to the derivation of S/P model, the parameters kR1, kR2, kG1, kG2, λpeak,R, λpeak,G, σR, σG and PW(λ) are treated as constants; thus, the BLH efficacy in Equation (12) can be further simplified to an expression with the driving currents IR and IG as variables, that is
where the parameters PWRG, PR and PG are consistent with their definitions in Equation (9), and the derived constants parameters BWRG, BR and BG are given as follows:
Equation (13) indicates that the BLH efficacy of the mixed spectra from the compensated white LED system can also be determined using the driving currents IR and IG of the monochromatic red and green LEDs.
2.4. Circadian Action Factor (CAF)
As previously described, light plays a critical role in regulating human physiological functions. To quantify the specific contribution of light sources to this regulatory process, the CAF is defined as [17]
where V(λ) is also the spectral sensitivity functions under photopic vision, and C(λ) is the circadian spectral sensitivity function with a peak wavelength of 450 nm.
By substituting P(λ) = PW(λ) + PR(λ) + PG(λ) into Equation (15), the corresponding CAF can be derived as
Similarly, based on the combination of Equations (2), (6) and (16), the CAF of the compensated white LED system is expressed in an expanded form as
As noted in the derivations of S/P and BLH models, the parameters kR1, kR2, kG1, kG2, λpeak,R, σR, λpeak,G, σG and the PW(λ) are all treated as constants. Therefore, Equation (17) corresponding to the CAF can also be expressed as a mathematical formula with the driving currents IR and IG as variables, as follows:
where the constant parameters PWRG, PR and PG are also consistent with those defined in Equation (9), while CWRG, CR and CG are additional derived constant parameters, whose specific definitions are provided as follows:
Based on Equation (18), the CAF of the white LED system with compensation of red and green spectra can also be obtained from the driving conditions of the monochromatic red and green LEDs.
From the discussions on total optical power, S/P, BLH and CAF, the following crucial aspects can be summarized:
- (1)
- For the compensated white LED systems studied, the spectral power distribution is determined by the operating states of the PC white LED, the monochromatic red LED, and the monochromatic green LED. The PC white LED serves as the core component, operating in a steady state to provide the necessary luminous flux for lighting. Meanwhile, the operating states of the monochromatic red and green LEDs are adjustable considering their stable monochromaticity.
- (2)
- The established models of total optical power, S/P, BLH and CAF can be expressed as functions of the driving currents IR and IG corresponding to the monochromatic red LED and monochromatic green LED, respectively. As a consequence, by controlling these two LEDs’ electrical driving conditions, the spectral structure of the mixed white light can be altered, enabling the regulation of visual performance and photobiological effects.
- (3)
- The S/P, BLH and CAF of a light source primarily depend on the spectral power distribution. The approach of spectral compensation can alter the intensity of light stimuli on different types of photoreceptor cells in the human retina, thereby influencing visual performance and photobiological effects.
- (4)
- Although the models of S/P, BLH and CAF exhibit non-linearity, lighting design engineers can still achieve a rapid estimation of these factors from the driving currents of the monochromatic red and green LEDs, and thus effectively understand the visual perception and photobiological effects of the illumination environments. Furthermore, these models provide valuable reference frameworks to develop lighting solutions that are more human-centered and health-oriented.
3. Verifications and Discussion
3.1. Measuring Instruments and Operating Conditions
The proposed models for the visual performance and photobiological effects are validated using two LED systems: CW-R-G LED system and WW-R-G LED system, whose structural schematic can be seen from Figure 1. It is worth mentioning that for the monochromatic green LED, its λpeak,G and σG are 524 nm and 39.1, respectively; for the monochromatic red LED, its λpeak,R and σR are 628 nm and 25.9, respectively; for the PC warm white LED in the WW-R-G LED system, it has a low CCT of 3600 K; for the PC cool white LED in the CW-R-G LED system, it has a high CCT of 6000 K.
The experimental setup, as shown in Figure 3, incorporates several key components, including: (1) an Everfine HAAS-2000 spectroradiometer system equipped with an integrating sphere photometer, utilized for conducting optical measurements; (2) a Peltier-cooled fixture CL-200, employed as an efficient temperature-controlled heatsink to guarantee optimal thermal management; (3) two external power supplies, i.e., the Rigol programmable power supplies, applied to supply stable and precisely adjustable electrical currents to the LEDs; (4) control platform implemented by a workstation, used for operation control and data analysis via specific software.
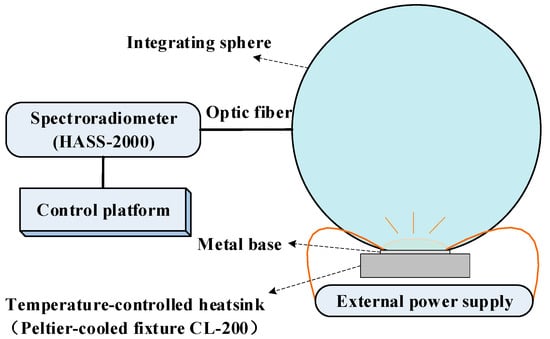
Figure 3.
The schematic diagram of the experimental setup.
During the optical measurement process, the heatsink is maintained at a constant temperature of 25 °C. The PC white LEDs in the systems operate at a fixed current of 300 mA (30% of their 1000 mA rated current), with a corresponding optical power of approximately 500 mW. This enables them to operate in a “highly efficient unsaturated region”, characterized by uniform current distribution, excellent power–current linearity, and stable electro-optical efficiency. As compensation light sources, the monochromatic red and green LEDs have driving currents that do not exceed half of that of the main light source (i.e., the PC white LED); accordingly, their adjustable current range is set to 20–140 mA, with an increment interval of 20 mA. Furthermore, to ensure the stability and reliability of the data, all optical measurements are conducted after a 20-min period of stable operation.
3.2. Result Analysis
According to the proposed models, the total optical power Popt, S/P, BLH and CAF of the white LED systems based on spectral compensation are calculated with electrical input values. The calculated results and their corresponding experimental measurements are presented in Figure 4, Figure 5, Figure 6 and Figure 7, respectively of the CW-R-G LED system and WW-R-G LED system. Notably, a high degree of agreement can be observed between the measured and calculated results, both in terms of numerical values and variation trends.
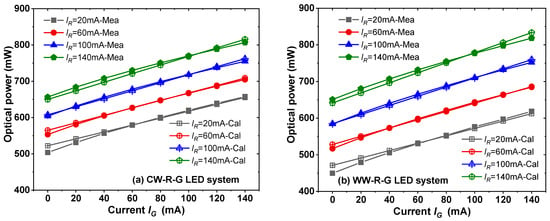
Figure 4.
Calculated and measured optical power: (a) CW-R-G LED system; (b) WW-R-G LED system.
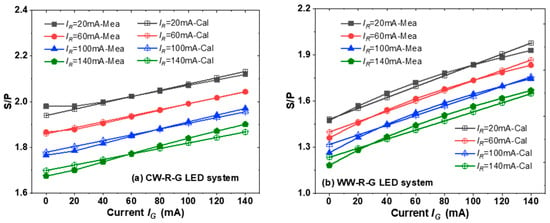
Figure 5.
Calculated and measured S/P: (a) CW-R-G LED system; (b) WW-R-G LED system.
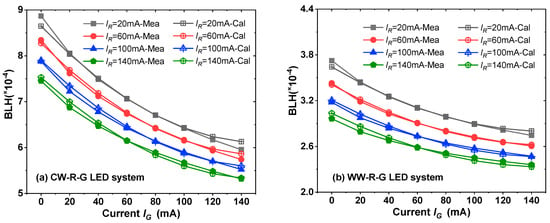
Figure 6.
Calculated and measured BLH: (a) CW-R-G LED system; (b) WW-R-G LED system.
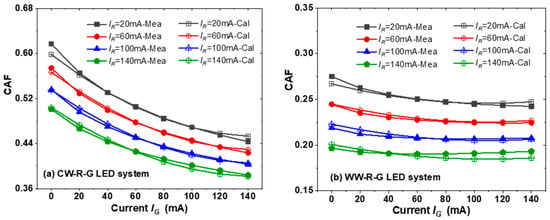
Figure 7.
Calculated and measured CAF: (a) CW-R-G LED system; (b) WW-R-G LED system.
As shown in Figure 4, the total optical power Popt of the compensated white LED system exhibits a consistent increasing trend with the rise in either the driving current IR (of the monochromatic red LED) or IG (of the monochromatic green LED). Moreover, the relationship between Popt and each of these two currents maintains excellent linearity, which is consistent with the optical power model shown in Equation (3).
As illustrated in Figure 5, at a fixed current IR, the S/P value increases with the intensity of current IG, which means that it becomes more appropriate for night-time lighting or low-illumination scenes to offer enhanced visual perception and effective visual guidance. Conversely, when the current IG is kept constant, the S/P value decreases as the intensity of current IR rises. This suggests that the illumination can generate sufficiently bright visual luminance, enabling users to clearly distinguish object details and to improve work efficiency and visual experience. This makes it particularly suitable for applications such as library reading areas, office workspaces, and shopping mall displays.
It can be seen from Figure 6 that when the current IR or current IG rises, the BLH efficacy is showing a downward trend. This indicates consistent relationships between these two input currents and the BLH efficacy. Specifically, any increment in either current IR or current IG can alleviate the degree of blue light hazard. In other words, compensation of red and green spectra is beneficial for reducing blue light hazard of the PC white LED, making the lighting environment healthier and less likely to cause retinal damage.
As shown in Figure 7, the relationships between the input currents (IR and IG) and the CAF are similar to those between the currents and the BLH efficacy. That is, an increase in either current IR or current IG will lead to a decrease in the CAF, indicating that the impact on human circadian rhythm becomes weakened. Specifically, for the CW-R-G LED system, the CAF values generally fall within the range of 0.35–0.65. This indicates that it can effectively suppress the secretion of melatonin, thereby keeping people awake and alert. Consequently, it is suitable for situations such as in offices or libraries, as it is conducive to improving concentration and efficiency. For the WW-R-G LED system, its CAF mainly ranges from 0.15–0.35, and the circadian rhythm stimulation associated with light is beneficial for the normal secretion of melatonin. Hence, it is recommended for lounges or bedrooms, helping to relieve tension and create a relaxing and soothing atmosphere.
Seen from Figure 4 and Figure 5, the linearity of both the total optical power and S/P with respect to the driving currents (IR for the monochromatic red LED and IG for the monochromatic green LED) is generally excellent. In contrast, as shown in Figure 6 and Figure 7, respectively, the linearity between the BLH and the current, as well as that between the CAF and the current, is relatively weak. Moreover, as the current IG increases, the descending gradients of both BLH and CAF exhibit a diminishing trend. Combined with the electroluminescence mechanism of LEDs, this phenomenon is potentially related to the fact that, as the driving electrical power increases, the emission spectra of GaN-based green LEDs shift to the short-wave band [37,38]. This is the phenomenon known as the blue shift [39]. In addition, all the curves presented in Figure 4, Figure 5, Figure 6 and Figure 7 are vertically evenly spaced. It indicates a high degree of linearity, as values of total optical power, S/P, BLH, and CAF change uniformly with the increasing current IR. This also provides support for the fact that no obvious spectral shift occurs in monochromatic red LEDs. The emission spectra of the monochromatic red and green LEDs versus their driving currents are illustrated in Figure 8. Here, the emission spectra of each individual LED under different currents are normalized, thus allowing for a more distinct observation of the spectral shift.
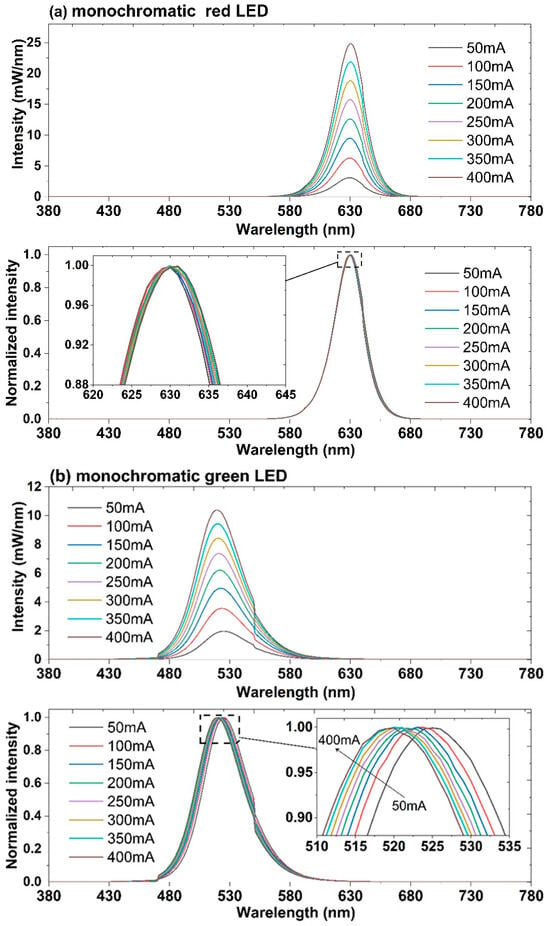
Figure 8.
The actual and normalized emission spectra of the monochromatic LEDs versus driving current: (a) the monochromatic red LED; (b) the monochromatic green LED.
Furthermore, the absolute and relative errors of the results are also calculated as quantitative supplements, with the corresponding maximum and mean values presented in Table 1. Notably, all errors associated with total optical power, S/P, BLH, and CAF are sufficiently small: the maximum relative errors do not exceed 5.9%, and the mean relative errors are within 1.4%.

Table 1.
Errors analysis of S/P, BLH and CAF.
The high consistency between the calculated and measured results (as illustrated in the figures) and the error analysis collectively validate the accuracy and reliability of the proposed models, thereby demonstrating their effectiveness in predicting the visual performance and photobiological effects of compensated white LED systems.
3.3. Performance Comparison
The prominent advantage of the proposed compensated white LED systems is that they can simultaneously achieve tunable CCT while ensuring a sufficiently high CRI. Here, a comparison with a dual-color white LED system has been discussed, as follows.
For the CW-R-G system, when the red and green LEDs operate with changing currents, it achieves a tunable CCT range of 3413–5311 K and a satisfactory CRI range of 80–89.3, accompanied by a gradually increasing light purity from 3.7 to 27.1. Compared with the uncompensated PC cool white LED (CRI = 75.9), the maximum CRI improvement rate reaches 17.65% and the light purity increases by more than 6 times. Correspondingly, for the WW-R-G system, it obtains a tunable CCT range of 2343–4521 K and a satisfying CRI range of 80.2–95.3, accompanied by an excellent light purity gradually increasing from 41.7 to 60.9. In comparison with the uncompensated PC warm white LED (CRI = 77.8), the maximum CRI improvement rate is as high as 22.49% and the light purity has increased by 46%.
The dual-color white LED system for comparison is integrated by two PC white LEDs, one with a high CCT of 7600 K, a CRI of 79.6 and a light purity of 14; the other with a low CCT of 2700 K, a CRI of 82.3 and a light purity of 55. When integrated into the dual-color white LED system, the CCT of the mixed spectra can be adjusted from 2700 K to 7600 K, while the CRI ranges from 79.8 to 84.4, the maximum CRI improvement rate is only 6.03%. Regarding the light purity of the integrated system, no significant correlational relationship was observed between its values and the spectral intensity of the two PC white LEDs. Specifically, as the spectral intensity of the PC white LEDs varied, the light purity sometimes increases but sometimes decreases, basically falls within the range of 3.5–44.
Since the CCT range considered ideal for general lighting typically falls between 2300 K and 5300 K, the compensated white LED systems are able to deliver a more appropriate lighting environment when comprehensively considering both the tunable CCT and improved CRI.
4. Conclusions
In this work, the visual performance and photobiological effects of white LED systems based on spectral compensation are investigated, and models of S/P, BLH and CAF are proposed which link up the spectral power distribution and spectral efficiency functions of the human visual system. The proposed models mathematically explain the intuitive influence of electrical driving conditions of LEDs on the total optical power, S/P, BLH and CAF. In the experimental verification, excellent agreement is exhibited between the calculations and their corresponding measurements, indicating the rationality and accuracy of the models and their establishment. These proposed models are expected to serve as powerful tools for comprehending the visual perception and photobiological effects of illumination, to provide guidance for the design of LED lighting products with more optimized spectral distributions, and to reduce the negative impact on human health and to improve the overall lighting experience.
The proposed models are primarily designed for the compensated white LED system, where the PC white LED serves as the core component and operates in a steady state to provide the basic luminous flux required for lighting, and the monochromatic red and green LEDs function as spectral compensators to enable adjustment of spectral structure and improvement of optical performance. More generally, the application scope of these models can be further expanded to any multi-LED system where one or several LEDs act as stable core light sources (maintaining a fixed operating state) and the remaining multiple monochromatic LEDs serve as adjustable spectral compensators (allowing regulation of electrical driving state). For such systems, the optical power, S/P, BLH, and CAF models will exhibit forms similar to those proposed in this paper. Though certain parameters of the models will vary depending on the specific composition of the system, acquiring these parameters poses little difficulty for engineers engaged in LED system design.
Author Contributions
Conceptualization, X.S. and H.C.; methodology, X.J.; validation, B.C. and X.S.; formal analysis, F.Q.; writing—review and editing, all authors. All authors have read and agreed to the published version of the manuscript.
Funding
This research was funded by the National Natural Science Foundation of China (No. 62001200), the Funding by Science and Technology Projects in Guangzhou (SL2024A04J01939, SL2024A04J01462), and the Industry-University-Research Collaboration Foundation of the Fujian Province (2024H6014, 2022G02006).
Data Availability Statement
The data that support the findings of this study are available from the corresponding author upon reasonable request.
Conflicts of Interest
The authors declare no conflicts of interest.
References
- Nian, L.; Pei, X.; Zhao, Z.; Wang, X. Review of optical designs for light-emitting diode packaging. IEEE Trans. Compon. Packag. Manuf. Technol. 2019, 9, 642–648. [Google Scholar] [CrossRef]
- Mitterhofer, S.; Korošak, Ž.; Rojec, Ž.; Jankovec, M.; Topič, M. Development and analysis of a modular LED array light source. Photonics 2020, 7, 92. [Google Scholar] [CrossRef]
- Liu, G.; Chen, H.; Zheng, Y.; Lin, H.; Lin, S.; Wu, Y. Two-dimensional photothermal modeling of multichip LEDs device with thermal coupling matrix by microscopic hyperspectral imaging. IEEE Trans. Electr. Dev. 2024, 71, 6198–6207. [Google Scholar] [CrossRef]
- Nie, J.; Chen, Z.; Jiao, F.; Zhan, J.; Chen, Y.; Pan, Z.; Deng, C.; Xi, X.; Kang, X.; Wang, Y.; et al. Optimization of the dynamic light source considering human age effect on visual and non-visual performances. Opt. Laser Technol. 2022, 145, 107463. [Google Scholar] [CrossRef]
- Berson, D.M.; Dunn, F.A.; Takao, M. Phototransduction by retinal ganglion cells that set the circadian clock. Science 2002, 295, 1070–1073. [Google Scholar] [CrossRef] [PubMed]
- Llenas, A.; Carreras, J. A simple yet counterintuitive optical feedback controller for spectrally tunable lighting systems. Opt. Eng. 2019, 58, 075104. [Google Scholar] [CrossRef]
- Dick, M.; Pohl, W.; Lackner, H.K.; Weiss, E.M.; Canazei, M. Effects of personalized lighting on subjective ratings, cognitive performance, and physiological stress response in a simulated office environment. LEUKOS 2024, 20, 347–366. [Google Scholar] [CrossRef]
- Ham, W.T.; Mueller, H.A.; Sliney, D.H. Retinal sensitivity to damage from short wavelength light. Nature 1967, 260, 153–155. [Google Scholar] [CrossRef] [PubMed]
- Ouyang, X.; Yang, J.; Hong, Z.; Wu, Y.; Xie, Y.; Wang, G. Mechanisms of blue light-induced eye hazard and protective measures: A review. Biomed. Pharmacother. 2020, 130, 110577. [Google Scholar] [CrossRef]
- De Vera Mudry, M.C.; Kronenberg, S.; Komatsu, S.-I.; Aguirre, G.D. Blinded by the light: Retinal phototoxicity in the context of safety studies. Toxicol. Pathol. 2013, 41, 813–825. [Google Scholar] [CrossRef]
- Maurya, M.; Nag, T.C.; Kumar, P.; Roy, T.S. Expression patterns of iron regulatory proteins after intense light exposure in a cone-dominated retina. Mol. Cell. Biochem. 2021, 476, 3483–3495. [Google Scholar] [CrossRef] [PubMed]
- Wasowicz, M.; Morice, C.; Ferrari, P.; Callebert, J.; Versaux-Botteri, C. Long-term effects of light damage on the retina of albino and pigmented rats. Investig. Ophthalmol. Vis. Sci. 2002, 43, 813–820. [Google Scholar]
- Khanh, T.Q.; Bodrogi, P.; Zandi, B.; Vinh, T.Q. Brightness perception under photopic conditions: Experiments and modeling with contributions of S-cone and ipRGC. Sci. Rep. 2023, 13, 14542. [Google Scholar] [CrossRef]
- Meng, J.-J.; Shen, J.-W.; Li, G.; Ouyang, C.-J.; Hu, J.-X.; Li, Z.-S.; Zhao, H.; Shi, Y.-M.; Zhang, M.; Liu, R.; et al. Light modulates glucose metabolism by a retina-hypothalamus-brown adipose tissue axis. Cell 2023, 186, 398–412. [Google Scholar] [CrossRef]
- Ding, J.Y.; Huang, S.; Zheng, H.; Huang, L.; Zeng, P.; Ye, S.; Wu, Q.; Zhou, J. A novel broad-band cyan light-emitting oxynitride based phosphor used for realizing the full-visible-spectrum lighting of WLEDs. J. Lumin. 2021, 231, 117786. [Google Scholar] [CrossRef]
- Andersen, M.; Mardaljevic, J.; Lockley, S. Aframe work for predicting the non-visual effects of daylight–PartI: Photobiology basedmodel. Light. Res. Technol. 2012, 44, 37–53. [Google Scholar] [CrossRef]
- Gall, D.; Bieske, K. Definition and measurement of circadian radiometric quantities. In Proceedings of the CIE Symposium ‘04 on Light and Health, Vienna, Austria, 30 September–2 October 2004; pp. 129–132. [Google Scholar]
- Yang, X.; Zhang, Y.; Zhang, Q.; Cai, Q.; Ye, Q.; Pang, H.; Wu, X. Method of matching different background spectra based on spectrally tunable light source. Opt. Eng. 2022, 61, 055104. [Google Scholar] [CrossRef]
- Spitschan, M.; Joyce, D.S. Human-centric lighting research and policy in the melanopsin age. Policy Insights Behav. Brain Sci. 2023, 10, 237–246. [Google Scholar] [CrossRef]
- Kumar, M.; Sunny; Kumar, A.; Seong, K.-S.; Park, S.-H. GaN phosphors converted white light-emitting diodes for high luminous efficacy and improved thermal stability. IET Optoelectron. 2020, 14, 155–158. [Google Scholar] [CrossRef]
- Sun, X.; Liang, Y.; Zheng, J.; Zhao, C.; Fang, Z.; Tian, T.; Liang, X.; Huan, W.; Xiang, W. Advancing Laser Lighting: High-Brightness and High-Stability Ce: YAG Phosphor-in-Glass. Ceram. Int. 2024, 50, 48909–48917. [Google Scholar] [CrossRef]
- Ramesh, B.; Dillip, G.R.; Rambabu, B.; Joo, S.W. Deva Prasad Raju. Structural studies of a green-emitting terbium doped calcium zinc phosphate phosphor. J. Mol. Struct. 2018, 1155, 568–572. [Google Scholar] [CrossRef]
- Ma, Y.; Gao, X.; Zhang, W.-T.; Yang, Z.-R.; Zhao, Z.; Qu, C. Enhanced red luminescence of Ca3Si2−xMxO7:Eu3+ (M = Al, P) phosphors via partial substitution of Si4+ for applications in white light-emitting diodes. Rare Met. 2024, 43, 736–748. [Google Scholar] [CrossRef]
- Zhang, R.; Guo, Z.; Chen, Y.; Ruan, Y.; Zhu, L.; Chen, G. A Deep Learning-Aided Remote Spectrally Tunable LED Light Source Integrated System. IEEE Trans. Instrum. Meas. 2023, 72, 7008109. [Google Scholar] [CrossRef]
- Toftum, J.; Thorseth, A.; Markvart, J.; Logadóttir, Á. Occupant response to different correlated colour temperatures of white LED lighting. Build. Environ. 2018, 143, 258–268. [Google Scholar] [CrossRef]
- Thapan, K.; Arendt, J.; Skene, D.J. An action spectrum for melatonin suppression: Evidence for a novel non-rod, non-cone photoreceptor system in humans. J. Physiol. 2021, 535, 261–267. [Google Scholar] [CrossRef]
- Solomon, S.G.; Lennie, P. The machinery of colour vision. Nat. Rev. Neurosci. 2007, 8, 276–286. [Google Scholar] [CrossRef]
- Shen, X.; Chen, H.; Zhang, W.; Ji, X.; Yi, Y. Analysis and tunable models for phosphor-converted white light-emitting diode based on spectral compensation. IEEE Photon. J. 2023, 15, 8200410. [Google Scholar] [CrossRef]
- Liu, G.; Chen, H.; Lin, S.; Lin, H.; Chen, J.; Chen, C. Determining 2-D optical characteristics dependent surface temperature of organic light-emitting diode. IEEE Trans. Electr. Dev. 2023, 70, 6427–6434. [Google Scholar] [CrossRef]
- Conus, V.; Geiser, M. A review of silent substitution devices for melanopsin stimulation in humans. Photonics 2020, 7, 121. [Google Scholar] [CrossRef]
- Maziarka, J.; Bena, L.; Wachta, H. Meaning of scotopic/photopic ratio of light sources in lighting of outdoor spaces. In Proceedings of the 2018 VII Lighting Conference of the Visegrad Countries (Lumen V4), Trebic, Czech Republic, 18–20 September 2018; pp. 1–4. [Google Scholar] [CrossRef]
- Zhu, X.; Guo, X.; Zhang, J.; Liu, J.; Jiang, F. Phosphor-free, color-mixed, and efficient illuminant: Multi-chip packaged LEDs for optimizing blue light hazard and non-visual biological effects. Opt. Laser Technol. 2020, 134, 106174. [Google Scholar] [CrossRef]
- Benkner, S.; Herzog, A.; Klir, S.; Van Driel, W.D.; Khanh, T.Q. Advancements in spectral power distribution modeling of light-emitting diodes. IEEE Access 2022, 10, 83612–83619. [Google Scholar] [CrossRef]
- Shen, X.; Chen, H.; Xu, M.; Ji, X.; Qin, Q. Measurement model of circadian action factor of phosphor-converted white LEDs based on photometric, electrical, and thermal properties. Metrologia 2024, 61, 025002. [Google Scholar] [CrossRef]
- Hipólito, V.; Coelho, J.M.P. Blue light and eye damage: A review on the impact of digital device emissions. Photonics 2023, 10, 560. [Google Scholar] [CrossRef]
- Sun, P.; Min, M.; Wu, Q.; Huang, W.; Xiao, Q.; Xiao, W.; Zheng, C. A four-primary-color micro-LED display with wide color gamut, low blue light hazard, and promise to improve working efficiency in the working conditions. AIP Adv. 2025, 15, 015008. [Google Scholar] [CrossRef]
- Zhang, Y.-P.; Liu, W.; Liu, B.-D.; Wang, R.-M. Morphology–structure diversity of ZnS nanostructures and their optical properties. Rare Met. 2014, 33, 1–15. [Google Scholar] [CrossRef]
- Choi, I.; Min, S.; Shim, J.-I.; Shin, D.-S. Understanding and evaluating the mean photon energy and the external quantum efficiency of light-emitting diodes. IET Optoelectron. 2023, 17, 32–37. [Google Scholar] [CrossRef]
- Samosvat, D.; Karpova, A.; Zegrya, G. Internal piezoelectric field and Auger recombination in InGaN/GaN quantum wells: Impact on device performance. Appl. Phys. A 2025, 131, 99. [Google Scholar] [CrossRef]
Disclaimer/Publisher’s Note: The statements, opinions and data contained in all publications are solely those of the individual author(s) and contributor(s) and not of MDPI and/or the editor(s). MDPI and/or the editor(s) disclaim responsibility for any injury to people or property resulting from any ideas, methods, instructions or products referred to in the content. |
© 2025 by the authors. Licensee MDPI, Basel, Switzerland. This article is an open access article distributed under the terms and conditions of the Creative Commons Attribution (CC BY) license (https://creativecommons.org/licenses/by/4.0/).