Abstract
The particle size of submicron particles significantly affects their properties; thus, the accurate measurement of submicron particle size is essential to ensure its excellent properties. Polarized light scattering is an important tool for measuring the particle size of the ensemble of particles in suspension. However, in the existing measurement systems, the polarized scattered light is detected using a CCD detector or an array of single-point detectors. The CCD detector misses a large part of the polarized scattered light due to its narrow detection range of scattering angles, and the array of single-point detectors has the problem of low angular resolution due to the limited number of detectors. According to the above problems, this paper designs a submicron particle size measurement method based on the polarization difference in polarized scattered light with high angular resolution. The vertically and horizontally polarized scattered light was acquired with high angular resolution (angular separation = 2°) over a scattering angle range of 50°–110° using a photomultiplier coupled with a turntable. The scattering angle of the acquired vertically and horizontally polarized scattered light were corrected to eliminate the scattering angle deviations caused by obliquely incident light, and then the polarization difference in the vertically and horizontally polarized scattered light was computed, from which the submicron particle size distribution was inverted subsequently. Experiments were performed using polystyrene microsphere standard particles with particle sizes of 350 nm, 200 nm, and 100 nm. The experimental results show that (1) the Pearson correlation coefficient of the linearly fitted curve of the corrected polarization difference to the theoretical polarization difference is larger than 0.997, and the slope and intercept of the linearly fitted curve are, respectively, close to 1 and 0, indicating that the corrected polarization difference is highly consistent with the theoretical polarization difference; (2) the mean relative error and coefficient of variation of the particle size distribution parameter D50 obtained from the polarization difference with high angular resolution (angular separation = 2°) are better than those of the parameter D50 obtained from the polarization difference with low angular resolution (angular separation = 12°), indicating better accuracy and repeatability of the particle size distribution inverted from the polarization difference with high angular resolution; and (3) for the particle size distribution parameters D10, D50, and D90 obtained from the scattering angle-corrected polarization difference with high angular resolution, the deviation of the measured values from the average value are all smaller than the thresholds given in the international standard, indicating a good repeatability of the proposed method.
1. Introduction
Submicron particles usually refer to particles with a particle size of 0.1 μm to 1 μm. Due to the extremely small particle size, the atomic arrangement, electron distribution structure, and crystal structure on the surface of submicron particles are significantly changed compared to those of ordinary particles, so they have completely different special properties in optical, electromagnetic, acoustic, thermal, and other physical properties [1,2,3,4,5]. Submicron particles can be used as additives, cured coatings, and adhesives with excellent physical, chemical, and surface properties, which help to improve product performance [6,7,8,9,10,11]. The particle size of submicron particles significantly affects their effectiveness in application [12,13,14,15,16,17]. Therefore, the particle size becomes an important indicator of the quality of submicron particles, and obtaining the particle size distribution has become an essential and important step in the preparation of submicron particles.
For the particle size measurement of an ensemble of particles in suspension, the light scattering method is widely used because of its advantages of being fast, accurate, and field-monitorable [18,19,20,21,22]. Submicron particles exhibit different scattering characteristics for incident light in different polarization states. Thus, the polarized scattered light has been used to measure the particle size distribution of the ensemble of particles in suspension [23,24]. At present, the detection of polarized scattered light is mainly divided into two ways: one is to use a CCD detector [25,26], and the other is to use an array of single-point detectors [27,28]. The CCD detector can only detect the scattered light in a narrow scattering angle range. However, for submicron particles, the scattered light that is related to the particle size is mainly distributed over a wide range of scattering angles; thus, the CCD detector is not applicable for the measurement of the particle size of the submicron particles. The approach using an array of single-point detectors can detect the polarized scattered light over a wide range of scattering angles, but there is a problem of low angular resolution of polarized scattered light detection due to the limited number of detectors.
At the same time, as the polarized scattered light related to the submicron particle size distributes in a wide range of large scattering angles [28], in order to avoid the total reflection effect that limits the emission of scattered light at large scattering angles, the oblique incidence of the light source is used, i.e., the incident light is at an angle to the wall of the sample cell. However, in the oblique incidence mode, the optical axis is deflected due to the refraction of the quartz glass and liquid medium, which in turn causes a deviation in the scattering angle of the measured polarized scattered light. Therefore, in order to accurately invert the particle size distribution, the measured scattering angle of the polarized scattered light needs to be corrected.
According to the above problems, a submicron particle size measurement method based on scattering angle-corrected polarization difference with high angular resolution was proposed in this paper. For the ensemble of particles in suspension, the vertically and horizontally polarized scattered light were obtained with high angular resolution over a wide range of large scattering angles, and the scattering angle deviation caused by the oblique incidence of incident light was also corrected. The polarization difference between the vertically and horizontally polarized scattered light was computed, and finally, the particle size distribution was accurately inverted from the polarization difference using the Chahine algorithm.
2. Methods
2.1. Principle of Polarization Difference Method
According to the Mie scattering theory [29,30], for spherical particles with a certain size distribution, the scattered light intensity at the detection site (corresponding to the scattering angle ) is shown in Equations (1) and (2).
where is the effective detection area of the detector; is the area element; is the scattered light intensity of a particle at scattering angle ; is the density of the particle; is the representative particle size (i.e., the diameter of the particle) of the particle size range; is the wight of the particles in the particle size range; ; and .
For all the n detection sites, the scattered light intensity can be expressed in the form of a matrix, as shown in Equation (3), and can be expressed simply, as in Equation (4).
where is the scattered light column vector, is the coefficient matrices of the scattered light, and is the particle size distribution of representative particle sizes selected artificially.
Submicron particles have significantly different scattering characteristics for vertically and horizontally polarized incident light [28,31]. For vertically and horizontally polarized incident light, the scattered light column vectors and can be, respectively, measured, and the coefficient matrices of the scattered light and can be calculated based on Equation (2). Consequently, based on Equation (5), the polarization difference , that is, the intensity difference in the scattered light of the vertically and horizontally polarized light can be calculated, and then the particle size distribution can be inverted.
The measurement accuracy of the polarized scattered light will directly affect the effectiveness of the particle size inversion. Thus, this paper focused on the accuracy of the polarized scattered light in two aspects: scattering angle correction and high angular resolution of the scattered light.
2.2. Scattering Angle Correction Method
Shown in Figure 1 are the theoretical polarization differences in the 350 nm, 200 nm, and 100 nm submicron spherical particle samples under an incident light at 632.8 nm. The wavelength of 632.8 nm was selected because it is widely used in particle size measurement. The wavelength of 632.8 nm is easily obtained by using the He-Ne laser in practical applications; the power of the He-Ne laser is stable, which is conducive to reducing the interference caused by fluctuations in the light source. Furthermore, since the polarization difference method is sensitive to particles smaller than approximately 2/3 the wavelength of the incident light [28], the submicron spherical particle samples of 350 nm, 200 nm, and 100 nm were chosen for analysis. To facilitate comparative analysis, the theoretical polarization differences were normalized using a linear normalization method to map the raw data between [0, 1]. The peak positions of the polarization difference in the three particle sizes are different, and the smaller the particle size, the closer the peak of the polarization difference is to 90°. The analysis shows that the light scattering information that reflects the particle size is mainly concentrated in the range of large scattering angles, specifically, in the range around a 90° scattering angle. Therefore, in order to obtain as much effective scattered light information as possible, scattered light detection must be carried out in the range of large scattering angles.
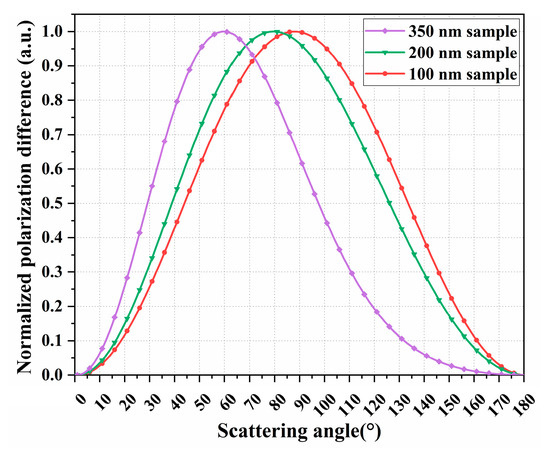
Figure 1.
The normalized polarization difference in 350 nm, 200 nm, and 100 nm submicron spherical particle samples.
However, according to the law of refraction and reflection of light, if the incident light is perpendicular to the surface of the sample cell, the scattered light in the scattering angle range of 48.8°–131.2° cannot emit from the sample cell due to the influence of total reflection, resulting in the loss of light scattering information in the angular range that contains the most information about the size of submicron particles. Therefore, this paper adopts the oblique incidence method ( = 70° in Figure 2), breaking through the restriction of glass total reflection on the emission of scattered light at large scattering angles. The scattering light from 0° to 180° can then emit out of the sample cell and be detected by the detector.
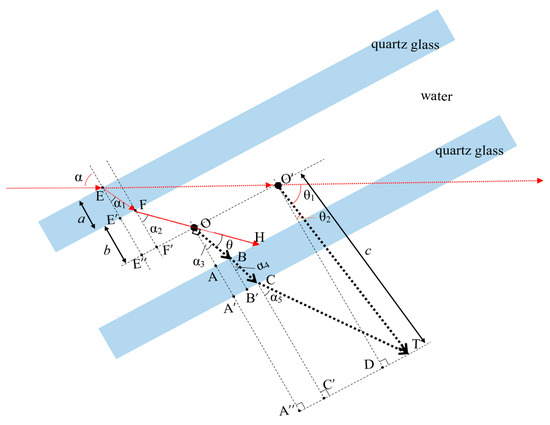
Figure 2.
Schematic diagram of scattering angle correction.
In the oblique incidence mode, the optical axis is deflected due to the refraction caused by the sample cell and liquid medium. As shown in Figure 2, the red dashed line is the virtual optical axis when no refraction occurs, and the red solid line is the refracted actual optical axis. When measuring, the detector rotates around the sample cell (Point ) to acquire the scattered light, and the rotation angle of the detector with respect to the virtual optical axis can be obtained, while the actual scattering angle is the angle between the actual optical axis and the scattered light that detected by the detector. Therefore, a scattering angle correction is required, i.e., calculating the actual scattering angle from the rotation angle of the detector.
This paper proposed a scattering angle correction method based on geometric optics. As shown in Figure 2, there exists the relationship described in Equations (6)–(16), where is the thickness of the quartz glass of the sample cell; is half of the internal width of the sample cell; is the distance from the detector to the center of the sample cell and is much larger than ; is the angle of incidence of the incident light; is the refractive index of the quartz glass; and is the refractive index of the liquid medium; , , , , are constants; and as described in Equation (12), , and are also constants in a stereotyped measurement system.
Equation (6) describes a line segment summation, and Equations (7)–(12) introduce angular parameters related to refraction and scattering. By bringing Equations (7)–(12) into Equation (6), an equation containing variables , , and and constants , , , , and can be obtained. Since can be represented by and (described in Equation (13)), , , and can be represented by , , , and (described in Equation (12) and Equations (14)–(16)); the obtained equation can be transformed to an equation that contains variables and and constants , , , , , and . From the obtained equation, the actual scattering angle can be calculated using the rotation angle of the detector.
3. Experiments
3.1. Experimental System
According to the above analysis, a measurement system using oblique incidence was designed in this paper to acquire the polarized scattered light with high angular resolution. As shown in Figure 3, the light source is composed of a 632.8 nm linearly polarized He-Ne laser (HENE016B-P) and a half-wave plate (WPF2225-633-M30). The power of the He-Ne laser is 1.6 mW, and the polarization ratio is 200:1. The direction of polarization of the laser light can be changed by controlling the angle of the half-wave plate, generating the vertically and horizontally polarized incident light of the system.
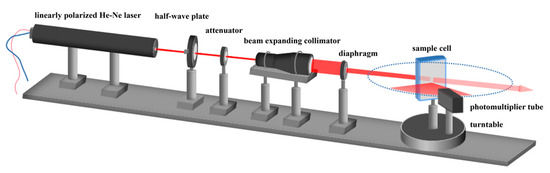
Figure 3.
Schematic diagram of the submicron particle size measurement system using polarization difference.
The light power is adjusted by an attenuator (HANF-D25-003, with a transmittance of 50% at 633 nm), and then the light beam is expanded and collimated into a parallel beam of 18 mm in diameter by a beam-expanding collimator. Due to the Gaussian distribution of the beam generated by the He-Ne laser, the light intensity at the edge of the expanded beam is weak and contains stray light. Therefore, an 8 mm diameter diaphragm (IDY-03M4) is installed at the output of the beam expanding collimator to intercept a stable, uniform, and high-quality vertically polarized laser beam at the center of the beam. The light beam then incidents obliquely (angle of incidence = 70°) into a sample cell containing the particle sample to be measured. In order to facilitate geometrical-optical calculations and thus the scattering angle correction, a rectangular sample cell is used. The sample cell is made of 3 mm thick quartz glass, and the external dimensions are 40 mm, 10 mm, and 60 mm in length, width, and height, respectively.
The scattered light is then detected by a photomultiplier (H10721-01) located 100 mm from the sample cell. In order to detect the scattered light in the range of large scattering angles with high angular resolution, a slit with a width of 2 mm is used to limit the width of the effective detection area of the photomultiplier to 2 mm, and the photomultiplier is rotated around the sample cell driven by a turntable to acquire the polarized scattered light in the range of 50°–110° scattering angle at an angular interval of 2°. The detected scattered light column vectors and are then employed for the particle size inversion.
According to the above system parameters, the length of the light beam in the sample cell can be calculated from the law of refraction to be about 5.66 mm, which is much smaller than the distance from the sample cell to the detector (100 mm); thus, it can be assumed that the particles are concentrated at a single point in the center of the sample cell, and the methodological analysis in Section 2 is based on this assumption.
3.2. Materials
Water was used as the liquid medium for submicron particle samples. Polystyrene microsphere standard particles with particle sizes of 350 nm, 200 nm, and 100 nm (hereinafter referred to as 350 nm sample, 200 nm sample, and 100 nm sample) were selected as experimental samples. The standard particles are perfectly spherical in shape, and the refractive index is 1.59. The particle size distribution parameters D10, D50, and D90 and the width of the particle size distribution (D90/D10) are employed in this paper. D10 is the particle size corresponding to the 10th percentile of the cumulative distribution, i.e., the particle size on the horizontal coordinate calculated from the cumulative distribution when the vertical coordinate of the cumulative distribution is 10%. It is the same for D50 and D90. The nominal values of D50 are, respectively, 353.4 nm, 205.3 nm, and 103.6 nm for 350 nm, 200 nm, and 100 nm samples. The nominal values of the width of particle size distribution calculated from the nominal values of D90 and D10 for 350 nm, 200 nm, and 100 nm standard samples are, respectively, 1.05, 1.13, and 1.23.
According to the light scattering theory [32,33,34], the method in Section 2.1 applies to the condition where the light scattering is uncorrelated single scattering, and when the particle concentration is too high, multiple scattering will occur, and the uncorrelated single scattering condition is no longer satisfied; thus, the method in Section 2.1 becomes inapplicable. However, when the particle concentration is too low, the intensity of the scattered light will be too weak to be accurately detected, and the measured scattered light will be susceptible to noise interference, leading to reduced stability and accuracy of the measurement result. Therefore, it is necessary to control the particle concentration in a suitable range.
The obscuration (or opacity) of the sample solution is positively correlated with the particle concentration; thus, the obscuration is used as an indicator of the particle concentration. According to the previous experiment results, the obscuration of the particle solution should be controlled between 10 and 20% to ensure accuracy and stability. The particle solution was shaken well before the experiment to ensure that the submicron particles were uniformly dispersed in the solution.
The solution of each particle size sample was divided into eight parallel samples, and each sample was measured to obtain the corresponding particle size distribution and particle size distribution parameters D10, D50, D90, and the width of particle size distribution.
4. Results and Discussion
4.1. Scattering Angle Correction
The effect of scattering angle correction was analyzed using 350 nm, 200 nm, and 100 nm samples. As shown in Figure 4, the black curve is the theoretical polarization difference calculated based on the Mie scattering theory, and the blue and red curves are, respectively, the uncorrected polarization difference and corrected polarization difference. The above three polarization differences were all normalized using a linear normalization method to map the raw data between [0, 1] for comparative analysis.
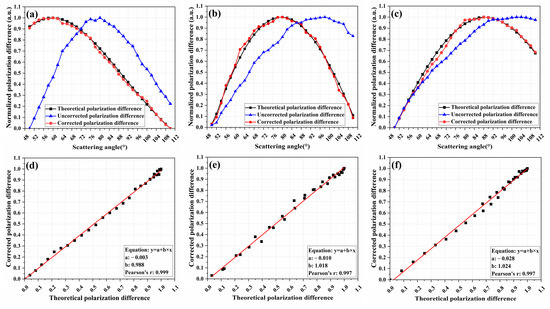
Figure 4.
Uncorrected and corrected polarization difference for 350 nm (a), 200 nm, (b) and 100 nm (c) samples; the linear fittings of the corrected polarization difference to the theoretical polarization difference for 350 nm (d), 200 nm, (e) and 100 nm (f) samples.
As can be seen from Figure 4 and Figure 5a–c, the uncorrected polarization difference deviates significantly from the theoretical polarization difference, which would affect the accuracy of the particle size inversion. The corrected polarization differences in 350 nm, 200 nm, and 100 nm samples are in high agreement with the corresponding theoretical ones. The corrected polarization differences were linearly fitted to the theoretical ones, and as shown in Figure 4 and Figure 5d–f, the Pearson correlation coefficients (Pearson’s r) of the fitted curves, respectively, reached 0.999, 0.997, and 0.997, indicating a good linear correlation between corrected polarization difference and theoretical polarization difference. Furthermore, the slopes of the fitted curves are, respectively, 0.952, 1.018, and 1.029, and the intercepts are, respectively, 0.019, 0.01, and −0.031. Therefore, the analysis of Pearson’s r, slope, and intercept indicate that the corrected polarization difference is not only linearly related to the theoretical one but also highly consistent in value.
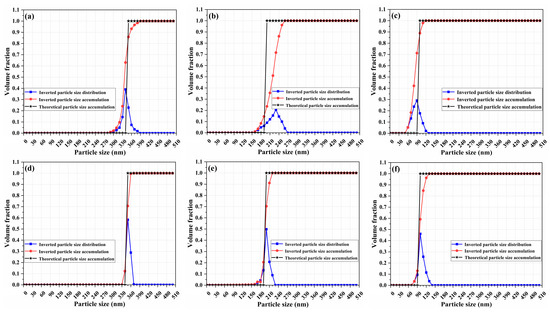
Figure 5.
The inversion results of 350 nm, 200 nm, and 100 nm samples: (a–c) are the results inverted from the polarization differences with low angular resolution, and (d–f) are the results inverted from the polarization differences with high angular resolution.
4.2. Comparison of the Results Inverted from Polarization Difference with High and Low Angular Resolution
In order to verify the advantage of the polarization difference with high angular resolution, the particle size inversion results that were, respectively, inverted from the polarization difference with high angular resolution and low angular resolution were compared. The angular interval of the polarization difference with high angular resolution is 2°, and the polarization difference with low angular resolution consists of the scattered light intensities at six scattering angles, which are extracted uniformly from the polarization difference with high angular resolution, corresponding to scattering angles of 50°, 62°, 74°, 86°, 98°, and 110°.
Particle size was inverted from the polarization difference using the Chahine algorithm, which is an effective method to realize particle size inversion. The Chahine algorithm is an iterative algorithm with a simple iterative formula and a fast convergence rate [35,36]. The iteration format of the algorithm is shown as Equation (17). Firstly, an initial value is set for the particle size distribution , and iteration is performed using Equations (17) and (18). During the iteration process, the convergence condition is judged for each iteration, and when the convergence condition is reached, the iteration ends, and the corresponding is the optimal solution.
where is the number of iterations, is the scattered light column vector, is the coefficient matrices of the scattered light, is the particle size distribution of m representative particle sizes selected artificially, denotes the multiplication of the corresponding elements of the vectors, denotes the division of the corresponding elements of the vectors, and denotes the summation of the elements in each column vector of the matrix .
Shown in Figure 5 are the inversion results of the 350 nm, 200 nm, and 100 nm samples, where a, b, and c are the results inverted from the polarization differences with low angular resolution, and d, e, and f are the results inverted from the polarization differences with high angular resolution. The blue curves are the inverted particle size distribution curves, the red curves are the inverted cumulative distribution of the particle size, and the black curves are the theoretical cumulative distribution of the particle size.
In order to evaluate the inversion results shown in Figure 5, three important parameters, peak particle size, the volume fraction of the peak particle size, and the width of particle size distribution, were analyzed. Since the 350 nm, 200 nm, and 100 nm polystyrene microsphere standard particles possess narrow particle size distribution, the inversion results of the three samples should achieve the following: (1) the peak particle size should be close to the nominal value, (2) the volume fraction of the peak particle size should be high, and (3) the width of particle size distribution should be close to 1. Shown in Table 1 are the above three parameters that, respectively, inverted from the polarization differences with low and high angular resolution, corresponding to the particle size distributions in Figure 5a–f. As can be seen from Table 1, when, respectively, using polarization differences with a low and high angular resolution for particle size inversion, the peak particle sizes of 350 nm, 200 nm, and 100 nm standard samples inverted from the latter are equal to the nominal values, while those inverted from the former all deviate from the nominal values; the volume fraction of the peak particle sizes inverted from the latter are higher than those inverted from the former; and the width of particle size distributions inverted from the latter are closer to the nominal values and thus to 1 than those inverted from former.

Table 1.
Parameters obtained from polarization difference with high and low angular resolution, respectively.
For the cumulative particle size distribution, as shown in Figure 5, although all of the inverted cumulative distributions obtained from the polarization differences with low and high angular resolution possess step-up trend, the cumulative distributions obtained from the polarization differences with high angular resolution are more in line with the theoretical cumulative distributions.
Furthermore, the accuracy and repeatability of the inversion results that are, respectively, inverted from the polarization difference with low and high angular resolution were analyzed using parameter D50, which is a typical particle size distribution parameter. The obtained D50 of the 350 nm, 200 nm, and 100 nm samples is shown in Table 2, Table 3 and Table 4, where D50L and D50H, respectively, represent the D50 that was obtained from the polarization difference with low and high angular resolution. The mean relative error (MRE) that was calculated using the nominal value of D50 as a reference value was used to evaluate the accuracy of the inversion result; and the coefficient of variation (CV) was used to describe the repeatability. The smaller the MRE, the higher the accuracy, and the smaller the CV, the better the repeatability.
Table 2.
D50 of 350 nm sample.
Table 3.
D50 of 200 nm sample.
Table 4.
D50 of 100 nm sample.
As can be seen from Table 2, Table 3 and Table 4, for the 350 nm sample, the MRE of D50H for the eight parallel samples is smaller than that of D50L, and it is the same for the 200 nm and 100 nm samples. The CV of D50H is smaller than that of D50L for 350 nm, 200 nm, and 100 nm samples. The analysis of MRE and CV show that the accuracy and repeatability of the particle size distribution inverted from the polarization difference with high angular resolution is better than those inverted from the polarization difference with low angular resolution.
4.3. Repeatability
In the international standard [34], the repeatability is evaluated using the deviation of the measured values from the average value, and for parameters D10, D50, and D90, the deviations should be less than ±3%, ±2.5% and ±4%, respectively. As described in Section 3.2, each size of sample has eight parallel samples; thus, the parameters D10, D50, and D90 were calculated for each parallel sample, and then the deviations were calculated, as shown in Table 5, Table 6 and Table 7. As can be seen, for D10, D50, and D90, the deviations are less than the deviations specified in the international standard, indicating good repeatability.
Table 5.
Repeatability measurement results of 350 nm sample.
Table 6.
Repeatability measurement results of 200 nm sample.
Table 7.
Repeatability measurement results of 100 nm sample.
5. Conclusions
In this paper, a submicron particle size measurement method based on scattering angle-corrected polarization difference with high angular resolution was proposed. The polarized scattered light is detected with high angular resolution over a wide range of large scattering angles, and the scattering angle deviation caused by oblique incidence was corrected. Measurement experiments were carried out using monodisperse polystyrene microsphere standard particles with particle sizes of 350 nm, 200 nm, and 100 nm. The experimental results show that the scattering angle correction eliminates the scattering angle deviation caused by oblique incidence, and the corrected polarization difference is highly consistent with the theoretical polarization difference. The results inverted from the polarization difference with high angular resolution are significantly better than those inverted from polarization difference with low angular resolution in terms of the peak particle size, volume fraction of the peak particle size, and the width of particle size distribution, as well as accuracy and repeatability. Moreover, the repeatability of the results obtained using the proposed method is better than the thresholds given by the international standard. This method solves the problems of the existing techniques that are based on polarized scattered light; that is, the detection range of the scattering angle is narrow, or the angular resolution of the detected polarized scattered light is low. Furthermore, the simple system structure reduces the design and manufacturing cost of the system, so in summary, the proposed method provides a technical reference for the low-cost and accurate measurement of particle size in the production and application of submicron particles. It should be pointed out that, based on the principle of light scattering, a shorter wavelength of incident light is required if submicron particles with smaller sizes are to be measured. At the same time, although the samples used in this paper are monodisperse particles, the proposed method is also applicable to polydisperse particles according to the theoretical analysis, which should be further verified in following studies.
Author Contributions
Conceptualization, C.S. and Z.Z. (Zuwei Zhu); Methodology, C.S. and G.Y.; Software, Z.Z. (Zuwei Zhu) Validation, Z.Z. (Zehua Zhou); Formal Analysis, X.G. and Z.Z. (Zehua Zhou); Investigation, Z.Z. (Zuwei Zhu) and C.S.; Resources, S.Z. and Z.W.; Data Curation, S.Z. and Z.W.; Writing—Original Draft Preparation, Z.Z. (Zuwei Zhu); Writing—Review and Editing, C.S. and G.Y.; Visualization, Z.Z. (Zuwei Zhu) and C.S.; Supervision, X.G. and X.H.; Project Administration, G.Y. and X.H.; Funding Acquisition, C.S., G.Y. and X.H. All authors have read and agreed to the published version of the manuscript.
Funding
The Excellent Young Talents Fund Program of Higher Education Institutions of Anhui Province (No. gxyq2021229), the Scientific Research Instrumentation Development Program of the Chinese Academy of Sciences (No. YJKYYQ20190050), The Scientific Research Program of Higher Education Institutions of Anhui Province (No. 2023AH052188), the Academic Degree Program of Anhui Province (No. 2022tsxwd048), and the Key Discipline Project of Hefei University (No. 2023xk04).
Institutional Review Board Statement
Not applicable.
Informed Consent Statement
Not applicable.
Data Availability Statement
The data presented in this study are available upon request from the corresponding author.
Conflicts of Interest
The authors declare no conflict of interest.
References
- Karpov, M.; Kudryavtseva, A.; Shevchenko, M.; Tcherniega, N.; Umanskaya, S. Stimulated low-frequency Raman light scattering in systems of nano- and submicron-sized particles. Quantum Electron. 2022, 52, 580–586. [Google Scholar] [CrossRef]
- Gadow, R.; Antipov, V.I.; Kolmakov, A.G.; Vinogradov, L.V.; Larionov, M.D.; Mukhina, Y.E. Synthesis of Submicron, Nanostructured Spherical Powders of Y3Al5O12-Phases by the Method by Ultrasonic Spray Pyrolysis and Investigation of Their Structure and Properties. Ceramics 2022, 5, 201–209. [Google Scholar] [CrossRef]
- Kim, J.; Choi, H.; Park, J.; Lee, C. Effects of submicron magnetite particles on granulation of flocculent sludge and process stability in upflow anaerobic sludge blanket reactor. Bioresour. Technol. 2022, 366, 128205. [Google Scholar] [CrossRef] [PubMed]
- Ti, C.; Shen, Y.; Lei, Y.; Liu, Y. Optical Trapping of Sub−Micrometer Particles with Fiber Tapers Fabricated by Fiber Pulling Assisted Chemical Etching. Photonics 2021, 8, 367. [Google Scholar] [CrossRef]
- Akther, A.; Marqus, S.; Rezk, A.R.; Yeo, L.Y. Submicron particle and cell concentration in a closed chamber surface acoustic wave microcentrifuge. Anal. Chem. 2020, 92, 10024–10032. [Google Scholar] [CrossRef] [PubMed]
- Czarnecki, R.; Bicker, K.L.; Green, R.M. Soluble Powder, Such as Composite Powder Used as Coating Additive and Additive in Personal Care Products, Comprises Homogenous Composite Particles Comprising Soluble Thermoplastic Material and Submicron Nanoparticle Material. U.S. Patent US 2023/0050330 A1, 10 August 2023. [Google Scholar]
- Cravotto, G.; Laszlo, J.; Foglia, E.; Crabotto, J.C.; Rathrow, I.; Elena, F.A. Preparation of Composite Containing Submicron Sized Particles of Metal Oxide-Pigment Used in Cosmetics, Involves Providing Metal Oxide Pigment and Oligomeric and/or Polymeric Carbohydrate Present in Preset Mass Ratio. International Patent WO 2021/058591 A1, 26 April 2021. [Google Scholar]
- Septiani, E.L.; Yamashita, S.; Cao, K.L.A. One-Step Aerosol Synthesis of SiO2-Coated FeNi Particles by Using Swirler Connector-Assisted Spray Pyrolysis. Ind. Eng. Chem. Res. 2022, 61, 17885–17893. [Google Scholar] [CrossRef]
- Septiani, E.L.; Kikkawa, J.; Cao, K.L.A.; Hirano, T.; Okuda, N.; Matsumoto, H.; Enokido, Y.; Ogi, T. DC bias characteristic enhancement of the powder core by using densified submicron sized FeNi particles through spray pyrolysis. J. Mater. Chem. C 2022, 10, 8288–8295. [Google Scholar] [CrossRef]
- Quynh, L.M.; Van Huy, H.; Thien, N.D. Synthesis of Si/SiO2 core/shell fluorescent submicron-spheres for monitoring the accumulation of colloidal silica during the growth of diatom Chaetoceros sp. Commun. Sci. Technol. 2022, 7, 1–7. [Google Scholar] [CrossRef]
- Morimoto, R.; Suzuki, T.; Minami, H. Preparation of Polypropylene/Polystyrene Composite Particles with Multilayered Inner Morphology by Seeded Emulsion Polymerization. ACS Appl. Polym. Mater. 2022, 4, 5619–5625. [Google Scholar] [CrossRef]
- Boldin, M.; Popov, A.; Nokhrin, A.; Murashov, A.; Shotin, S.; Chuvil’Deev, V.; Tabachkova, N.Y.; Smetanina, K. Effect of grain boundary state and grain size on the microstructure and mechanical properties of alumina obtained by SPS: A case of the amorphous layer on particle surface. Ceram. Int. 2022, 48, 25723–25740. [Google Scholar] [CrossRef]
- Lemishko, S.V.; Andriiko, A.; Golovina, I. Dielectric and magnetic properties of KTaO3 co-doped with Li and Co: Size effects. Funct. Mater. 2021, 28, 427–436. [Google Scholar]
- Aliotta, L.; Cinelli, P.; Coltelli, M.B.; Lazzeri, A. Rigid filler toughening in PLA-Calcium Carbonate composites: Effect of particle surface treatment and matrix plasticization. Eur. Polym. J. 2019, 113, 78–88. [Google Scholar] [CrossRef]
- De Oliveira, A.E.; Guerra, V.G. Electrostatic precipitation of nanoparticles and submicron particles: Review of technological strategies. Process Saf. Environ. Prot. 2021, 153, 422–438. [Google Scholar] [CrossRef]
- Bläubaum, L.; Röder, F.; Nowak, C.; Chan, H.S.; Kwade, A.; Krewer, U. Impact of particle size distribution on performance of Lithium-Ion batteries. ChemElectroChem 2020, 7, 4755–4766. [Google Scholar] [CrossRef]
- Arifuzzaman, M.; Ranasinghe, M.; Rajamanthrilage, A.C.; Bhattacharya, S.; Anker, J.N. Fast and Inexpensive Separation of Bright Phosphor Particles from Commercial Sources by Gravitational and Centrifugal Sedimentation for Deep Tissue X-ray Luminescence Imaging. Photonics 2022, 9, 347. [Google Scholar] [CrossRef]
- Villegas, A.; Quiroz-Juárez, M.A.; U’ren, A.B.; Torres, J.P.; León-Montiel, R.d.J. Identification of Model Particle Mixtures Using Machine-Learning-Assisted Laser Diffraction. Photonics 2022, 9, 74. [Google Scholar] [CrossRef]
- Chicea, D.; Doroshkevich, A.S.; Lyubchyk, A. On the Possibility of Designing an Advanced Sensor with Particle Sizing Using Dynamic Light Scattering Time Series Spectral Entropy and Artificial Neural Network. Sensors 2022, 22, 3871. [Google Scholar] [CrossRef]
- Zhang, J.; Zhang, Z.; Hou, L.; Zhou, W. A Novel Optical Instrument for Measuring Mass Concentration and Particle Size in Real Time. Sensors 2023, 23, 3616. [Google Scholar] [CrossRef] [PubMed]
- Wang, Z.; Liu, T.; Li, T.; Qiu, H.; Huang, M. Particle size distribution measurement based on the angular scattering efficiency factor spectra inversion–simulation and experiment. Opt. Express 2023, 31, 19867–19885. [Google Scholar] [CrossRef] [PubMed]
- Yoshida, A.; Moteki, N.; Adachi, K. Identification and particle sizing of submicron mineral dust by using complex forward-scattering amplitude data. Aerosol Sci. Technol. 2022, 56, 609–622. [Google Scholar] [CrossRef]
- Li, H.; Zhu, J.; Deng, J.; Guo, F.; Sun, J.; Zhang, Y.; Hou, X. Influence mechanism of the particle size on underwater active polarization imaging of reflective targets. Opt. Express 2023, 31, 7212–7225. [Google Scholar] [CrossRef] [PubMed]
- Kobus, J.; Petersen, A.; Greiner, F.; Wolf, S. Radiative transfer simulations for in-situ particle size diagnostic in reactive, particle growing plasmas. J. Phys. D Appl. Phys. 2022, 55, 355202. [Google Scholar] [CrossRef]
- Singh, M.D.; Vitkin, I.A. Spatial helicity response metric to quantify particle size and turbidity of heterogeneous media through circular polarization imaging. Sci. Rep. 2023, 13, 2231. [Google Scholar] [CrossRef] [PubMed]
- Huang, X.Q.; Yuan, J.Y.; Hervé, P. Determination of particle size distribution by polarization analysis of the scattered light. Optik 2022, 251, 168454. [Google Scholar] [CrossRef]
- Zhang, C.; Lv, Q.; Zhang, F. Particle size and refractive index measurement based on the polarization distribution difference of scattered light. Acta Opt. Sin. 2021, 41, 247–255. [Google Scholar]
- Bott, S.E.; Howard, H.W. Particle Size Analysis Utilizing Polarization Intensity Differential Scattering. U.S. Patent US5104221, 14 April 1992. [Google Scholar]
- Genc, S.; Icoz, K.; Erdem, T. Numerical analysis and experimental verification of optical scattering from microplastics. R. Soc. Open Sci. 2023, 10, 230586. [Google Scholar] [CrossRef] [PubMed]
- Takamune, M.; Sasaki, S.; Kondo, D.; Naoi, J.; Kumakura, M.; Ashida, M.; Moriwaki, Y. In situ size measurement of a magnetically trapped single superconducting microparticle by Mie scattering. Appl. Phys. Express 2021, 15, 012007. [Google Scholar] [CrossRef]
- Cheng, Q.; Wang, Y.M.; Zhang, Y.L. Analysis of the polarization characteristics of scattered light of underwater suspended particles based on Mie theory. Optoelectron. Lett. 2021, 17, 252–256. [Google Scholar] [CrossRef]
- Gomi, H. Multiple scattering correction in the measurement of particle size and number density by the diffraction method. Appl. Opt. 1986, 25, 3552–3558. [Google Scholar] [CrossRef]
- Pan, L. Improvement on Calculation and Detection Method of Particle Scattered Light Distribution. Master’s Thesis, Tianjin University, Tianjin, China, 2013. [Google Scholar]
- ISO13320—2020; Particle Size Analysis-Laser Diffraction Methods. International Organization for Standardization: Geneva, Switzerland, 2020.
- Shi, Y.; Yin, G.; Zhao, N.; Shi, C.; Jia, R.; Ma, M.; Liu, D.; Qi, Y.; Xia, M.; Gan, T.; et al. Static light scattering method for measuring particle sizes of suspended particles in water body to eliminate background interference. Chin. J. Lasers 2022, 49, 0704004. [Google Scholar]
- Kumar, P.S.; Korving, L.; Keesman, K.J.; van Loosdrecht, M.C.; Witkamp, G.-J. Effect of pore size distribution and particle size of porous metal oxides on phosphate adsorption capacity and kinetics. Chem. Eng. J. 2019, 358, 160–169. [Google Scholar] [CrossRef]
Disclaimer/Publisher’s Note: The statements, opinions and data contained in all publications are solely those of the individual author(s) and contributor(s) and not of MDPI and/or the editor(s). MDPI and/or the editor(s) disclaim responsibility for any injury to people or property resulting from any ideas, methods, instructions or products referred to in the content. |
© 2023 by the authors. Licensee MDPI, Basel, Switzerland. This article is an open access article distributed under the terms and conditions of the Creative Commons Attribution (CC BY) license (https://creativecommons.org/licenses/by/4.0/).