Abstract
China has abundant deep coalbed methane (CBM) resources; however, high temperature, stress, and reservoir pressure complicate the gas adsorption–desorption–diffusion–seepage processes, severely restricting the development of deep CBM. Through experimental research on adsorption, desorption, diffusion, and seepage behaviors of various coal samples, the control mechanisms of deep coal reservoir properties on CBM production in the Linxing–Shenfu region have been revealed. The results indicate that CBM adsorption and desorption characteristics are jointly controlled by coal rank, ash yield, temperature. and pressure. Among the above conditions, coal rank and pressure exhibit positive effects, while ash yield and temperature show inhibitory effects. Analysis of desorption efficiency based on the Langmuir model further identifies sensitive desorption and rapid desorption stages as key phases for enhancing productivity. Moreover, the gas diffusion mechanism is dynamically evolving, with Knudsen diffusion and Fick diffusion being the main modes during high ground pressure stages, gradually transitioning to the coexistence of Knudsen, transition, and Fick diffusions as pressure decreases. Concurrently, gas–water seepage experiments demonstrate that increasing temperature will reduce the irreducible water saturation and enhance the relative permeability of the gas. Since irreducible water saturation is negatively correlated with relative permeability of gas, the relative permeability of the gas phase, cross-point saturation, and the range of the two-phase co-seepage zone all significantly increases with the increase in temperature. The findings systematically elucidate the regulatory mechanisms of deep coal reservoir properties in the process of “adsorption–desorption–diffusion–seepage,” providing critical theoretical support for optimizing development strategies and enhancing the efficiency of deep CBM development.
1. Introduction
In recent years, significant breakthroughs in the exploration and development of deep coalbed methane (CBM) have driven innovations in accumulation theory and advances in key technologies such as horizontal well fracturing, thereby leading to a marked increase in national CBM production [1,2,3,4]. As a vital unconventional natural gas resource primarily accumulated in coal-bearing strata, CBM is characterized by cleanliness, low carbon intensity, and abundant resource potential. Consequently, it plays an increasingly pivotal role in China’s energy structure adjustment and carbon emission reduction strategies. Results from the fourth national resource assessment indicate that the CBM resources in China buried at depths of 1500~2000 m and 2000~3000 m are 1.193 × 10¹² m3 and 1.847 × 10¹² m3, respectively. As one of the coal-bearing basins with the most abundant CBM resources, the highest degree of exploration and development, and the most systematic theoretical research in China, the Ordos Basin holds a prominent position in national CBM reserves and is regarded as a core region for the industrialization of China’s CBM industry. The basin is characterized by complex geological conditions, featuring multiple coal seams with significant thickness and lateral stability, which provide favorable conditions for the formation of large-scale CBM reservoirs. In recent years, continuous progress has been made in the exploration of deep coalbed methane (CBM) within the Ordos Basin. To date, more than 200 deep CBM production wells have been established, with proven geological reserves exceeding 1100 × 108 m3. These achievements have served as a vital demonstration and provided strategic guidance for the development of the national CBM industry. As a focal area for current deep CBM exploration, the eastern margin of the Ordos Basin exhibits significant disparities in development outcomes across different blocks [5]. For instance, while the Daning–Jixian Block has achieved a breakthrough in deep CBM development, progress in the Linxing–Shenfu Block remains relatively lagged. This discrepancy is primarily attributed to the marked variations in coal reservoir characteristics under different blocks and varying burial depths [4,6,7]. As the primary vehicle for CBM occurrence and production, the pore–fracture system of coal seams is controlled by the coupling of multiple fields, including temperature, pressure, and stress. These factors vary significantly with burial depth and tectonic position, profoundly dictating the occurrence state and production dynamics of CBM [1,8,9,10]. Therefore, precisely characterizing the disparities in the “adsorption–desorption–diffusion–seepage” behaviors within coal seams of varying properties and identifying the dominant factors controlling CBM occurrence and production are of great significance for achieving accurate productivity prediction and efficient development of deep CBM resources.
CBM production is a dynamic process among coal, water, and methane, following the physical sequence of “desorption–diffusion–seepage” [4,9,11,12]. The “three high” characteristics (high temperature, high in situ stress, and high reservoir pressure) of deep coal seams intensify the complexity of coal–gas–water interactions, directly influencing desorption, diffusion, and seepage of CBM [2,4,13]. Although previous studies have extensively investigated the accumulation and production mechanisms of CBM, the Linxing–Shenfu region covers a vast area with substantial variations in burial depth and coal rank, resulting in strong reservoir heterogeneity. Consequently, research on the “adsorption–desorption–diffusion–seepage” processes in coal with different properties across this region remains relatively scarce, which constrains the efficient development of deep CBM in the region [2,4,14]. Therefore, this study integrates physical and numerical simulation methods to systematically reveal the influence of deep coal reservoir conditions on the entire gas production process, aiming to provide theoretical support for the efficient development of deep CBM in the Linxing–Shenfu region.
2. Geological Background
The Ordos Basin, a significant petroliferous basin of the North China Craton, extends predominantly in a near north–south direction and comprises several secondary structural units, including the Yishan Slope, the Western Thrust Belt, the Tianhuan Depression, the Yimeng Uplift, the Jinxi Flexural Fold Belt, and the Weibei Uplift (Figure 1) [15]. The Linxing–Shenfu Block is located along the eastern margin of the Ordos Basin, bordering the Baode Block to the north and the Sanjiaobei Block to the south and extending from Fugu County in the north to Xing County in the south [10]. The terrain of the basin exhibits a steep gradient in the north and a gentler slope in the south, being higher in the east and lower in the west. Tectonically, the block spans two first-order structural units: the Northern Shaanxi (Shanbei) Slope and the Jinxi Flexural Fold Belt. A complete Paleozoic–Mesozoic stratigraphic succession developed in the study area [16]. Coal seams are primarily developed in Carboniferous Taiyuan (C3t) formation. Among these, the Nos. 8 + 9 coal seams of the C3t formation are characterized by substantial thickness and lateral stability, serving as the principal target intervals for deep CBM exploration. The burial depth of the Nos. 8 + 9 coal seams ranges from 1500 to 2200 m with thickness varying between 1.2 and 17.5 m, exhibiting significant spatial heterogeneity [17].
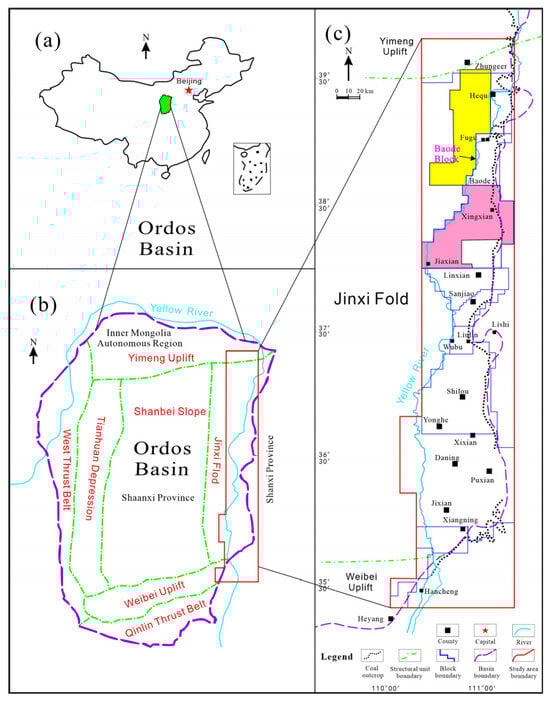
Figure 1.
Location map of the research area (Adapted from Ref. [10]). (a) Schematic map of the Ordos Basin’s geographic location; (b) Geological overview map of the Ordos Basin; (c) Schematic map of the study area’s geographic location.
3. Methods and Samples
This study is based on 71 coal samples (9 # coal seam: 34; 4 + 5 # coal seam: 37) collected from the C3t formation across 39 wells (A1~A39) in the Linxing–Shenfu Block. The sampling depths range from 1933 to 2394 m, covering a broad spectrum of coal ranks within the region. The primary objective is to elucidate the disparities in adsorption, desorption, diffusion, and seepage behaviors of coal seams under varying coal ranks, petrographic compositions, and coal qualities. In terms of experimental design, adsorption–desorption experiments were conducted using high-pressure volumetric isothermal adsorption apparatus in accordance with the Chinese national standard experimental methods of high-pressure isothermal adsorption to coal [18]. Due to the geothermal temperatures (55~65 °C) and formation pressures (exceeding 14 MPa) in the C3t of the Ordos Basin, the experiments were performed at four temperature levels (45 °C, 50 °C, 55 °C, and 60 °C) across a range of pressure steps (0.5, 1, 2, 3, 5, 7, 11, 14, 22, and 30 MPa) [19,20]. These experiments aimed to elucidate the dominant control mechanisms of external temperature–pressure conditions and intrinsic coal properties on the adsorption–desorption behavior. Proximate analysis and vitrinite reflectance (Ro) measurements were conducted in accordance with the Chinese national standard proximate analysis of coal and determination of vitrinite reflectance by microscopy [21,22], utilizing a muffle furnace and a polarizing microscope equipped with a micro-photometer, respectively. During the Ro measurements, the instrument was periodically calibrated using a series of reflectance standards (e.g., yttrium aluminum garnet and sapphire) to ensure the accuracy and comparability of the analytical results. In addition, representative samples were selected for gas diffusion experiments conducted under five pressure levels (5, 10, 15, 20, and 25 MPa) and five temperature levels (20, 25, 30, 35, and 40 °C). Gas–water two-phase seepage experiments were further performed at 30 and 50 °C to determine the diffusion capacity and seepage characteristics of gases in the coal seams of the study area, as well as their primary controlling factors.
4. Result and Discussion
4.1. Adsorption Characteristics
Experimental results indicate that the Langmuir volume (VL) of coal in the study area ranges from 6.88 to 21.97 m3/t (Figure 2), and the Langmuir pressure (PL) ranges from 1.17 to 5.45 MPa (Figure 2). At constant temperature, the adsorption characteristics of coal for methane conform to the Langmuir isothermal adsorption model, expressed as:
Note: V: adsorption capacity; VL: Langmuir volume; PL: Langmuir pressure
The isothermal adsorption curves of coal reveal distinct adsorption behaviors among samples with different properties (Figure 3). In the low-pressure stage, coal with higher coal rank exhibits a more pronounced increase in adsorption capacity, while in the high-pressure stage, the adsorption capacity of high-rank coal continues to rise with increasing pressure, whereas that of low-rank coal gradually approaches saturation.

Figure 2.
Coupling relationship between Langmuir parameters and metamorphic degree of coal in Linxing–Shenfu region.

Figure 3.
Isotherm adsorption curves of representative samples in Linxing–Shengfu region.
4.2. Adsorption Characteristic Control Factors
4.2.1. Coal Metamorphism Degree
The degree of coal metamorphism is a key factor affecting the adsorption capacity of coal. As shown in Figure 2, both the VL and PL show an upward trend with the increase in Ro, indicating that rank coals not only enhance the adsorption capacity but also delay the pressure required for gas adsorption saturation (Equations (2) and (3)) [7,23]. However, the correlation between coal rank and adsorption parameters shows notable fluctuations. Among samples with similar Ro, the maximum difference in VL reaches 11 m3/t, such as in A3:
4.2.2. Ash Yield
Isothermal adsorption results on an air-dried basis and dry-ash-free basis reveal a significant inhibitory effect of ash yield on methane adsorption capacity of coal. For low-ash samples, the difference between isothermal adsorption curves under the two bases is relatively small. For example, the differences in VL between the 4 + 5 # coal seam of well A1 (3.68%) and the 9 # coal seam of well A2 (13.65%) are 0.67 m3/t and 2.1 m3/t, respectively (Figure 4a,b). In contrast, the adsorption curves of the two bases show a clear separation for high-ash-yield samples, with the differences in VL increasing to 3.69 m3/t and 6.71 m3/t between the 9 # coal seam of well A3 and the 5 # coal seam of well A4, respectively (Figure 4c,d).
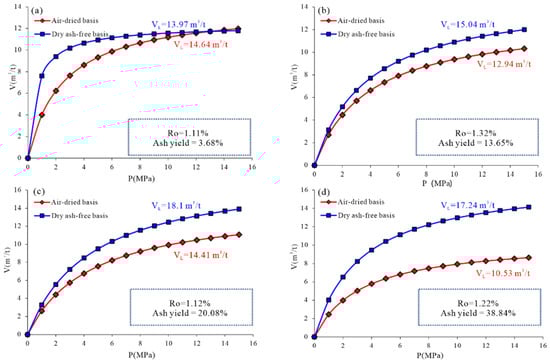
Figure 4.
Comparison of isothermal adsorption curves of coal samples with different ash yields. (a) A1; (b) A8; (c) A13; (d) A19.
4.2.3. In Situ Temperature and Pressure Conditions
The adsorption capability of coal is influenced not only by intrinsic coal properties but also significantly by external factors such as reservoir temperature and pressure. Isothermal adsorption experiments demonstrate that reservoir temperature exerts an inhibitory effect on methane adsorption (Figure 5), whereas reservoir pressure exhibits an enhancing effect (Figure 5). As temperature and pressure conditions vary with burial depth, the coupling of the above factors controls adsorption behavior, leading to the existence of a “critical depth” along the vertical profile. Above the critical depth the positive effect of pressure dominates, thereby adsorption capacity increases with burial depth. Below the critical depth the negative effect of temperature intensifies, resulting in a decrease in adsorption capacity with increasing depth [7,23].
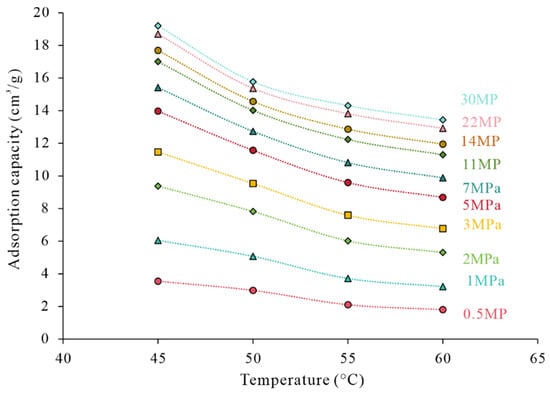
Figure 5.
Variation pattern of isothermal adsorption curves with temperature and pressure.
4.3. Desorption Characteristics
Focusing on the reversible and dynamic equilibrium characteristics of the CBM adsorption and desorption process, this study depends on the four stages CBM desorption process proposed by Meng et al., including inefficient, slow, fast, and sensitive [24]. Combined with the isothermal adsorption curve, the variation pattern of desorption pressure thresholds is explored to provide guidance for the optimal selection of favorable CBM intervals [24,25,26].
The four-stage classification scheme by Meng uses curvature as the basis (Equation (4)) [24], with starting pressure (Pst), transition pressure (Ptu), and sensitive pressure (Pse) as thresholds to demarcate different desorption stages. Equation (4) is as follows:
First, based on the Langmuir isothermal adsorption equation (Equation (1)), the first derivative with respect to pressure is taken to derive the expression for desorption efficiency (η), which represents the change in CBM desorption volume per unit pressure drop and is used to evaluate the CBM desorption capacity under different reservoir pressures (P) (Equation (5)) as follows:
Combining the second derivative of Langmuir equation results in the following:
Substitute Equations (5) and (6) into Equation (4) produces the following:
The stagnation points of desorption efficiency curvature corresponding to the transition pressure (Ptu) are calculated as follows:
When the second derivative of the desorption curve curvature is 0, the starting pressure and sensitive pressure are as follows:
Based on experimental results, the calculated starting pressure ranges from 2.92 to 8.31 MPa, the transition pressure from 1.71 to 5.25 MPa, and the sensitive pressure from 0.07 to 1.98 MPa. Based on these three pressure thresholds, the CBM desorption process of the samples is divided into four stages (Figure 6). Taking the 9 # coal seam in well A2 as an example, the reservoir enters the slow desorption stage when pressure drops to 5.69 MPa, transitions to the rapid desorption stage at 3.21 MPa, and reaches the sensitive desorption stage at 0.55 MPa. This quantitative classification establishes an effective evaluation standard for analyzing desorption processes. During the inefficient desorption stage, the desorption efficiency remains relatively stable, with limited contribution of pressure drop to methane desorption; thereby, it has a low productivity contribution. In contrast, the rapid and sensitive desorption stages exhibit significantly enhanced desorption efficiency, which are regarded as key phases for achieving high CBM production.
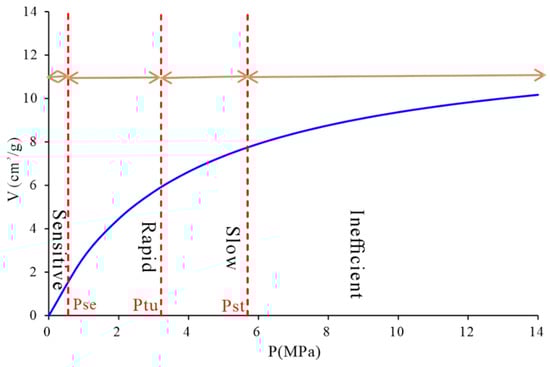
Figure 6.
Schematic diagram of desorption stage division. Note: The red dashed lines represent the stage boundaries; the solid lines with double arrows denote different stages.
The variation in the ranges of desorption stages among different samples originates from differences in coal rank. High coal rank corresponds to greater values of the pressure thresholds (Figure 7).
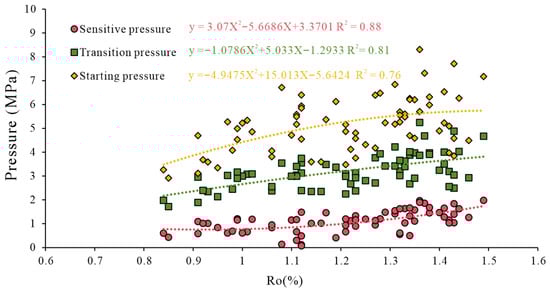
Figure 7.
The relationship between various pressure thresholds and Ro.
In summary, from a desorption perspective, high-rank coal demonstrates significant advantages in rapid or sensitive desorption stages, which is conducive to efficient CBM extraction. In contrast, although low-rank coals exhibit shorter stage durations and faster production buildup, the rapid desorption characteristics tend to cause premature reservoir pressure depletion, making it difficult to sustain long-term stable production. Therefore, production strategies should be tailored according to coal rank to avoid affecting overall recovery efficiency due to the pursuit of short-term high yield.
4.4. Diffusion Characteristics of CBM
4.4.1. Diffusion Type
Driven by concentration gradients, CBM diffuses from high-concentration zones to low-concentration zones. The diffusion behavior is classified into Knudsen diffusion, transition diffusion, and Fick diffusion based on the Knudsen number (Kn), with the pore diameter thresholds for each diffusion type defined as D ≤ 0.1λ, 0.1λ < D < 10λ, and D ≥ 10λ, respectively [27,28,29,30].
According to the kinetic theory of gas, the Kn and the λ can be calculated as follows:
Note: D: pore diameter; λ: mean free path; kB: Boltzmann constant (1.38 × 10⁻²³ J/K); T: absolute temperature; d: effective molecular diameter
Based on the calculation result, the λ shows negligible variation with temperature at constant pressure, whereas it exhibits a significant negative correlation with pressure at constant temperature. A comparison of the correspondence between diffusion types and pore diameter thresholds at different depths reveals that as temperature and pressure increase, the pore diameter ranges corresponding to the three diffusion mechanisms systematically shift toward smaller values. Specifically, the upper limit of pore diameter for Knudsen diffusion, transition diffusion, and Fick diffusion all decrease with increasing burial depth. This trend indicates that the high-temperature and high-pressure conditions in deep reservoirs cause gas diffusion to become increasingly concentrated in fine pore–fracture systems, thereby enhancing the constraints of pore diameter on diffusion pathways [31,32,33] (Table 1).

Table 1.
Pore diameter distribution of coal with different diffusion types.
4.4.2. Diffusion Coefficient
The diffusion behavior of gas in coal exhibits multi-scale characteristics, with significant differences in the dominant factors governing each diffusion mechanism. The calculation formulas for the three diffusion coefficients are as follows [34,35]:
Fick diffusion coefficient:
Knudsen diffusion coefficient:
Transition diffusion coefficient:
Based on the calculated diffusion coefficients (Equations (13)–(15)), the three diffusion models exhibit distinct responses to changes in temperature and pressure. For the Fick diffusion, when the pressure increases from 5 MPa to 25 MPa at a constant temperature, Df decreases by 21.68 × 10⁻⁹ nm, while a temperature increase from 20 °C to 40 °C results in a difference in Df of only 0.63 × 10⁻⁹ nm under constant pressure (Figure 8). The Knudsen diffusion coefficient shows minor variation with temperature and pressure under a fixed pore diameter. However, the Knudsen diffusion coefficient varies by up to 10.05 × 10⁻⁸ nm as the pore diameter increases when under constant temperature and pressure conditions (Figure 9). In comparison, the transition diffusion coefficient exhibits an average difference of 0.368 × 10⁻⁹ nm with varying temperature and pressure, and a difference of 2.07 × 10⁻¹⁰ nm due to changes in pore diameter (Figure 10).
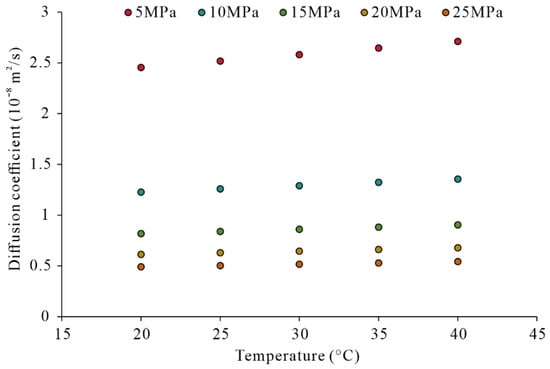
Figure 8.
Fick diffusion coefficient varies with temperature and pressure.
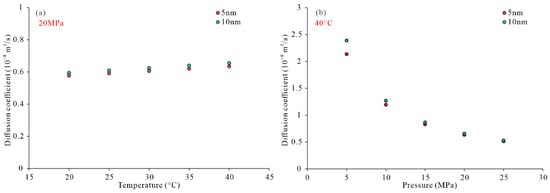
Figure 9.
Transition diffusion coefficient varies with temperature and pressure. (a) Constant pressure condition; (b) Constant temperature condition.
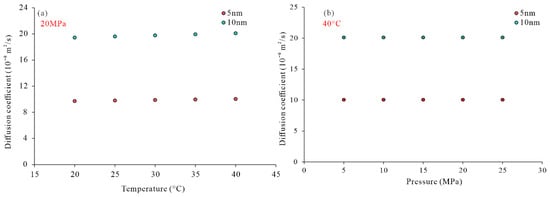
Figure 10.
Knudsen diffusion coefficient varies with temperature and pressure. (a) Constant pressure condition; (b) Constant temperature condition.
In summary, the Fick diffusion coefficient decreases significantly with increasing pressure and is relatively weakly influenced by temperature. The Knudsen diffusion coefficient increases mainly with pore diameter and is insensitive to changes in temperature and pressure, while the transition diffusion coefficient demonstrates a composite response characteristic that lies between the other two.
4.4.3. CBM Diffusion Mode
To simulate the evolution of diffusion modes throughout the entire CBM drainage process, pressure boundary conditions were set as an initial pressure of 20 MPa and an abandonment pressure of 0.7 MPa. Therefore, when the study was combined with the formulas for molecular free path and diffusion coefficients a model for classifying diffusion mechanisms at different drainage stages was established [35,36]. During the initial drainage stage (20 MPa), Knudsen diffusion dominates with pore diameters (D) ≤ 0.037 nm, transition diffusion occurs in the range 0.037 nm < D < 3.7 nm, and Fick diffusion takes place where D ≥ 3.7 nm. By the late drainage stage, the corresponding pore diameter ranges for the three diffusion types extend to D ≤ 1.064 nm, 1.064 nm < D < 106.4 nm, and D ≥ 106.4 nm, respectively. Overall, Fick diffusion predominates in the initial drainage stage, supplemented by transition diffusion. As pressure decreases, Fick diffusion gradually weakens, transition diffusion strengthens, and Knudsen diffusion only begins to manifest in the mid to late stages of drainage. It is important to note that the adsorption potential energy on the coal surface causes gas in pores of 0.33–1.1 nm to remain in an adsorbed state. Knudsen diffusion only becomes possible when the pore diameter exceeds 1.1 nm and the reservoir pressure falls below 7 MPa. Since the pressure during the early extraction phase is generally higher than this threshold, the contribution of Knudsen diffusion is limited initially.
4.5. Seepage Characteristics of CBM
To reveal the effects of temperature and properties of coal on seepage behavior, this study conducted gas–water two-phase seepage experiments at 30 °C and 50 °C. Based on the relative permeability curves and their key characteristic parameters (Figure 11), the variations in gas–water two-phase flow capacity in coal were analyzed (Table 2).
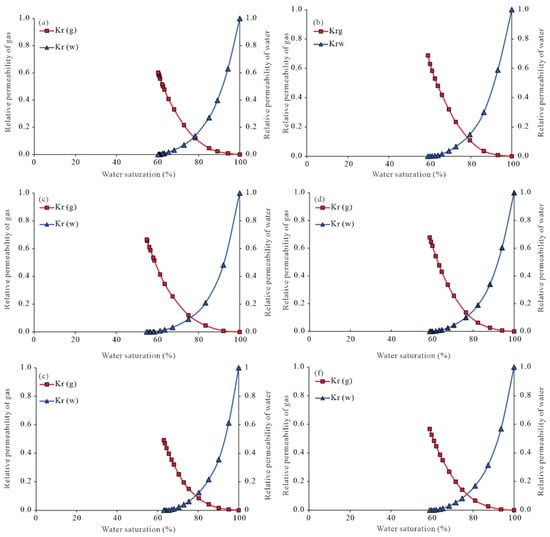
Figure 11.
Relative permeability curves of coal samples under different temperatures. (a) A4, 30 °C; (b) A4, 50 °C; (c) A3, 50 °C; (d) A2, 50 °C; (e) A1, 50 °C; (f) A5, 50 °C.
Table 2.
Relative permeability data of gas and water at 30 °C and 50 °C.
- (1)
- Irreducible water saturation (Swi)
Swi refers to the lower saturation limit for effective gas–water flow. A high Swi indicates strong hydrophilicity, complex pore structure, and poor connectivity in the coal. In the Linxing–Shenfu region, the Swi of coal ranges from 54.77% to 63.07%, with an average of 59.14%, reflecting the reservoir strong hydrophilic nature, small pore diameter, and relatively low seepage capacity.
- (2)
- Relative permeability of gas at irreducible water saturation Krg(Swi)
Krg(Swi) reflects the influence of irreducible water on gas flow and the degree of water-phase damage in the coal. The measured Krg(Swi) of coal from the study area ranges between 0.49 and 0.69, with a mean value of 0.62, indicating significant water-phase damage and relatively weak initial gas flow capacity.
- (3)
- Relative permeability at the isotonic point Kx(Sx)
Kx(Sx) reflects the maximum degree of permeability impairment during two-phase flow. The Kx(Sx) of the coal samples range from 0.1 to 0.13, with a mean of 0.12, indicating strong gas–water interference and a significant reduction in seepage capacity.
- (4)
- Isotonic point saturation (Sx)
Sx is a key parameter in gas–water relative permeability experiments, representing the intersection point of the water and gas saturation curves. The Sx of the coal samples range from 77.5% to 79.1%, with a mean of 77.95%, further confirming the strong hydrophilic nature of the reservoir.
In summary, as temperature increases, the irreducible water saturation in the coal of the study area decreases, while the gas relative permeability under irreducible water conditions increases accordingly. Furthermore, a negative correlation exists between irreducible water saturation and gas relative permeability. With increasing temperature, the gas relative permeability, isotonic point saturation, and the range of the two-phase co-seepage zone all expand. Overall, the coal in the study area is characterized by typically low seepage efficiency.
Notably, although core-scale seepage experiments have elucidated the impact of temperature on gas–water two-phase flow behavior, potential scale effects and geological variations must be meticulously considered when extrapolating these findings to field applications. The coal cores utilized in laboratory tests are representative of locally homogeneous units; however, actual coal reservoirs exhibit profound heterogeneity and anisotropy. Furthermore, reservoir temperature distributions and fluid flow are dynamic, transient processes governed by the complex coupling of stress variations, hydrogeological conditions, and engineering disturbances. Consequently, the experimentally derived relative permeability curves should be regarded as core-scale parameters. For field-scale predictions, these must be calibrated through history matching within reservoir numerical simulations to obtain effective relative permeability characteristics applicable to the grid scale of the model.
5. Conclusions
Based on isothermal adsorption, diffusion, and gas–water two-phase seepage experiments, this study systematically reveals the dynamic behavior of CBM throughout the entire “adsorption–desorption–diffusion–seepage” process and clarifies the controlling mechanisms of coal reservoir properties and external conditions on production capacity. The main conclusions are as follows:
(1) The adsorption and desorption behaviors of coal are jointly controlled by coal rank, ash yield, and temperature–pressure conditions. Coal rank and pressure exhibit positive effects, while ash yield and temperature show inhibitory effects. Moreover, analysis of Langmuir desorption efficiency indicates that the sensitive and rapid desorption stages are critical for productivity enhancement.
(2) The gas diffusion mechanism evolves dynamically during the drainage process. Under high-reservoir-pressure conditions, transition and Fick diffusion dominate. As pressure continuously decreases, the mechanism gradually shifts to a coexistence of Knudsen diffusion, transition diffusion, and Fick diffusion, reflecting a significant response of diffusion pathways to pressure variation.
(3) Gas–water two-phase seepage characteristics are significantly influenced by temperature. Increased temperature reduces irreducible water saturation and enhances gas relative permeability. Moreover, irreducible water saturation is negatively correlated with gas relative permeability, while gas relative permeability, isotonic point saturation, and the range of the two-phase co-seepage zone all expand with rising temperature, collectively influencing the overall seepage capacity of the reservoir.
Author Contributions
B.Z.: Data curation, Formal analysis, Methodology, Software, Validation, Visualization, Writing—original draft, and Writing—review and editing; T.J.: Data curation and Visualization; L.N.: Data curation and Visualization; S.L.: Data curation and Visualization; S.T.: Methodology, Project administration, Writing—review and editing, and Supervision; All authors have read and agreed to the published version of the manuscript.
Funding
This research was funded by the National Natural Science Foundation of China grant number 42272200.
Data Availability Statement
The data are not publicly available due to confidentiality agreements, but they can be accessed by qualified researchers upon reasonable request to the corresponding author.
Conflicts of Interest
Author Bingwen Zhang, Tao Jiang and Li Niu were employed by the Inner Mongolia Coal Geological Exploration (Group) 109 Co., Ltd., Hailar 021000, China. The remaining authors declare that the research was conducted in the absence of any commercial or financial relationships that could be construed as a potential conflict of interest.
References
- Li, S.; Qin, Y.; Tang, D.Z.; Shen, J.; Wang, J.J.; Chen, S.D. A Comprehensive Review of Deep Coalbed Methane and Recent Developments in China. Int. J. Coal Geol. 2023, 279, 104369. [Google Scholar] [CrossRef]
- Zhang, B.; Tao, S.; Yang, F.; Cui, Y.; Jing, Q.H.; Guo, J.; Chen, S.D.; Wen, Y.J.; Men, X.Y. The Genesis and Accumulation Mechanism of CBM in the Typical Mid- to Low-Rank Coal-Bearing Basins. Pet. Sci. 2025, 22, 3069–3085. [Google Scholar] [CrossRef]
- Tao, S.; Tang, D.Z.; Xu, H.; Li, S.; Geng, Y.G.; Zhao, J.L.; Wu, S.; Meng, Q.; Kou, X.; Yang, S.Y.; et al. Fluid Velocity Sensitivity of Coal Reservoir and Its Effect on Coalbed Methane Well Productivity: A Case of Baode Block, Northeastern Ordos Basin, China. J. Pet. Sci. Eng. 2017, 152, 229–237. [Google Scholar] [CrossRef]
- Wen, Y.J.; Tao, S.; Yang, F.; Cui, Y.; Jing, Q.H.; Guo, J.; Chen, S.D.; Zhang, B.; Ye, J.C. Prediction Method of Gas Content in Deep Coal Seams Based on Logging Parameters: A Case Study of the Baijiahai Region in the Junggar Basin. Int. J. Coal Sci. Technol. 2025, 12, 76. [Google Scholar] [CrossRef]
- Geng, M.; Chen, H.; Chen, Y.P.; Zeng, L.J.; Chen, S.S.; Jiang, X.C. Methods and results of the fourth round national CBM resources evaluation. Coal Sci. Technol. 2018, 46, 64–68. [Google Scholar] [CrossRef]
- Guo, Z.Q.; Cao, Y.X.; Zhang, Z.; Dong, S. Geological Controls on the Gas Content and Permeability of Coal Reservoirs in the Daning Block, Southern Qinshui Basin. ACS Omega 2022, 7, 17063–17074. [Google Scholar] [CrossRef]
- Tao, S.; Chen, S.D.; Tang, D.Z.; Zhao, X.; Xu, H.; Li, S. Material Composition, Pore Structure and Adsorption Capacity of Low-Rank Coals around the First Coalification Jump: A Case of Eastern Junggar Basin, China. Fuel 2018, 211, 804–815. [Google Scholar] [CrossRef]
- Tao, S.; Pan, Z.J.; Tang, S.L.; Chen, S.D. Current Status and Geological Conditions for the Applicability of CBM Drilling Technologies in China: A Review. Int. J. Coal Geol. 2019, 202, 95–108. [Google Scholar] [CrossRef]
- Tao, S.; Pan, Z.J.; Chen, S.D.; Tang, S.L. Coal Seam Porosity and Fracture Heterogeneity of Marcolithotypes in the Fanzhuang Block, Southern Qinshui Basin, China. J. Nat. Gas Sci. Eng. 2019, 66, 148–158. [Google Scholar] [CrossRef]
- Ma, L.; Yang, F.; Yang, J.; Cui, Y.; Wang, W.; Liu, C.; Zhang, B.; Yang, J.; Tao, S. Gas Content and Gas Occurrence Mechanism of Deep Coal Seams in the Shenfu-Linxing Block. Energies 2025, 18, 699. [Google Scholar] [CrossRef]
- Tao, S.; Tang, D.; Xu, H.; Gao, L.; Fang, Y. Factors Controlling High-Yield Coalbed Methane Vertical Wells in the Fanzhuang Block, Southern Qinshui Basin. Int. J. Coal Geol. 2014, 134–135, 38–45. [Google Scholar] [CrossRef]
- Pan, Z.J.; Connell, L.D. Modelling Permeability for Coal Reservoirs: A Review of Analytical Models and Testing Data. Int. J. Coal Geol. 2012, 92, 1–44. [Google Scholar] [CrossRef]
- Fu, X.; Chen, S.D.; Yang, F.; Tao, S.; Ma, L.T.; Liu, C.; Yang, J.H.; Cui, Y.; Jing, Q.H.; Gao, W. NMR-Based Quantitative Characterization and Predictive Modeling of Adsorbed and Free Methane in Deep Coal Reservoirs. Fuel 2026, 405, 136655. [Google Scholar] [CrossRef]
- Ma, Z.Y.; Tao, S.; Gao, L.C.; Cui, Y.; Jing, Q.H.; Chen, S.D.; He, W.; Guo, J.; Hai, L.F. Detailed Characterization of Microscopic Pore Structure in Low-Rank Coal: A Case Study of Zhalainuoer Coalfield. Nat. Resour. Res. 2024, 33, 2261–2277. [Google Scholar] [CrossRef]
- Sun, J.; Dong, Y. Middle–Late Triassic sedimentation in the Helanshan tectonic belt: Constrain on the tectono-sedimentary evolution of the Ordos Basin, North China. Geosci. Front. 2019, 10, 213–227. [Google Scholar] [CrossRef]
- Gan, Y.; Zhang, K.; Yao, H. Discussion on potential joint mining of coal measures gases resources in Ordos area, Inner Mongolia. J. China Coal Soc. 2018, 43, 1661–1668. [Google Scholar]
- Xu, C.G.; Ji, H.Q.; Wang, C.W.; Zhu, X.S. Enrichment patterns and exploration countermeasures of deep coalbed methane in the Linxing-Shenfu block on the eastern margin of the Ordos Basin. Coal Geol. Explor. 2024, 52, 1–11. [Google Scholar]
- GB/T 19560-2025; Experimental Method of High-Pressure Isothermal Adsorption to Coal. State Administration for Market Regulation, Standardization Administration of the People’s Republic of China: Beijing, China, 2025.
- Li, Y.; Zhu, Z.T.; Wu, P.; Shen, C.Z.; Gao, J.X. Pressure evolution of gas-bearing systems in the Upper Paleozoic tight reservoirs at the eastern margin of the Ordos Basin. Oil Gas Geol. 2023, 6, 1568. [Google Scholar]
- Feng, X.L.; Wang, X.D.; Luo, J.; Wei, Z.K.; Zong, X.Y.; Guo, S.; Luo, T. Geothermal and Helium Resource Prospects in the Ordos Basin: Insight from the Curie Point Depths. Northwestern Geol. 2025, 58, 22–32. [Google Scholar]
- GB/T 212-2024; Proximate Analysis of Coal. State Administration for Market Regulation, Standardization Administration of the People’s Republic of China: Beijing, China, 2024.
- GB/T 6948-2008; Method of Determining Microscopically the Reflectance of Vitrinite in Coal. State Administration for Market Regulation, Standardization Administration of the People’s Republic of China: Beijing, China, 2008.
- Tao, S.; Wang, Y.B.; Tang, D.Z.; Xu, H.; Lv, Y.M.; He, W.; Li, Y. Dynamic Variation Effects of Coal Permeability during the Coalbed Methane Development Process in the Qinshui Basin, China. Int. J. Coal Geol. 2012, 93, 16–22. [Google Scholar] [CrossRef]
- Meng, Y.J.; Tang, D.Z.; Xu, H.; Qu, Y.J.; Li, Y.; Zhang, W.Z. Division of Coalbed Methane Desorption Stages and Its Significance. Pet. Explor. Dev. 2014, 41, 671–677. [Google Scholar] [CrossRef]
- Shen, J.; Qin, Y.; Fu, X.H.; Wang, G.; Chen, R.; Zhao, L.J. Study of High-Pressure Sorption of Methane on Chinese Coals of Different Rank. Arabian J. Geosci. 2015, 8, 3451–3460. [Google Scholar] [CrossRef]
- Quan, F.K.; Wei, C.T.; Zhang, J.J.; Feng, S.L.; Hao, S.Q.; Lu, G.W.; Hu, Y.B. Study on Desorption and Diffusion Dynamics of Coal Reservoir through Step-by-Step Depressurization Simulation—An Experimental Simulation Study Based on LF-NMR Technology. J. Nat. Gas Sci. Eng. 2020, 75, 103149. [Google Scholar] [CrossRef]
- Peng, Z.; Liu, S.W.; Deng, Z.W.; Feng, H.X.; Xiao, M. Apparent Permeability Model of Coalbed Methane in Moist Coal: Coupling Gas Adsorption and Moisture Adsorption. ACS Omega 2023, 8, 21677–21688. [Google Scholar] [CrossRef]
- Peng, Z.Z.; Liu, S.W.; Long, Y.Q.; Xiao, M.; Feng, H.X. Lattice Boltzmann Simulation of the Kinetics Process of Methane Diffusion with the Adsorption–Desorption Hysteresis Effect in Coal. ACS Omega 2023, 8, 31135–31144. [Google Scholar] [CrossRef] [PubMed]
- Lin, H.F.; Long, H.; Li, S.G.; Bai, Y.; Xiao, T.; Qin, A.L. CH4 Adsorption and Diffusion Characteristics in Stress-Loaded Coal Based on Molecular Simulation. Fuel 2023, 333, 126478. [Google Scholar] [CrossRef]
- Chen, M.J.; Kang, Y.L.; Zhang, T.S.; You, L.J.; Li, X.C.; Chen, Z.X.; Wu, K.L.; Yang, B. Methane Diffusion in Shales with Multiple Pore Sizes at Supercritical Conditions. Chem. Eng. J. 2018, 334, 1455–1465. [Google Scholar] [CrossRef]
- Zhong, Y.; She, J.P.; Zhang, H.; Kuru, E.; Yang, B.; Kuang, J.C. Experimental and Numerical Analyses of Apparent Gas Diffusion Coefficient in Gas Shales. Fuel 2019, 258, 116123. [Google Scholar] [CrossRef]
- Fu, Y.H.; Zhang, R.J.; Jiang, Y.Q.; Fan, X.Y.; Gu, Y.F. Experimental Studies on Pore Structure and the Gas Content Evolution Mechanisms of Shale Gas Reservoirs at Different Burial Depths in the Longmaxi Formation, Southern Sichuan Basin. Appl. Sci. 2023, 13, 13194. [Google Scholar] [CrossRef]
- Reinecke, S.A.; Sleep, B.E. Knudsen Diffusion, Gas Permeability, and Water Content in an Unconsolidated Porous Medium. Water Resour. Res. 2002, 38, 16-1–16-15. [Google Scholar] [CrossRef]
- Lu, X.K.; Tjaden, B.; Bertei, A.; Li, T.; Li, K.; Brett, D.; Shearing, P. 3D Characterization of Diffusivities and Its Impact on Mass Flux and Concentration Overpotential in SOFC Anode. J. Electrochem. Soc. 2017, 164, F188–F195. [Google Scholar] [CrossRef]
- Yang, Y.; Liu, S.M. Estimation and Modeling of Pressure-Dependent Gas Diffusion Coefficient for Coal: A Fractal Theory-Based Approach. Fuel 2019, 253, 588–606. [Google Scholar] [CrossRef]
- Chen, S.D.; Tao, S.; Tang, D.Z. In Situ Coal Permeability and Favorable Development Methods for Coalbed Methane (CBM) Extraction in China: From Real Data. Int. J. Coal Geol. 2024, 284, 104472. [Google Scholar] [CrossRef]
Disclaimer/Publisher’s Note: The statements, opinions and data contained in all publications are solely those of the individual author(s) and contributor(s) and not of MDPI and/or the editor(s). MDPI and/or the editor(s) disclaim responsibility for any injury to people or property resulting from any ideas, methods, instructions or products referred to in the content. |
© 2025 by the authors. Licensee MDPI, Basel, Switzerland. This article is an open access article distributed under the terms and conditions of the Creative Commons Attribution (CC BY) license.