You are currently viewing a new version of our website. To view the old version click .
Separations
  • Article
  • Open Access

4 November 2025

Determination of Phthalate Esters and Bisphenol A in Pear by Packed-Fiber Solid-Phase Extraction Coupled with Gas Chromatography–Mass Spectrometry

,
,
,
,
,
and
1
School of Biological and Food Engineering, Suzhou University, Suzhou 234000, China
2
College of Integrated Chinese and Western Medicine, Anhui University of Chinese Medicine, Hefei 230012, China
3
School of Public Health, Wannan Medical College, Wuhu 241002, China
4
Suzhou Food and Drug Inspection Center, Suzhou 234000, China
Separations2025, 12(11), 304;https://doi.org/10.3390/separations12110304 
(registering DOI)
This article belongs to the Section Analysis of Natural Products and Pharmaceuticals

Abstract

This study aimed to achieve efficient capture of phthalate esters (PAEs) and bisphenol A (BPA) from pear samples collected in the northern Anhui Province. A novel polystyrene–pyridine (PS/PD) composite nanofiber membrane was fabricated via electrospinning and employed as a filter in the sampling process. Following sample collection, PAEs and BPA were extracted with acetonitrile (ACN). Then, 100 μL of the extract was further concentrated using packed-fiber solid-phase extraction (PFSPE), with PS/PD nanofibers as the sorbent, and subsequently analyzed by gas chromatography–mass spectrometry (GC-MS). Under the optimized procedure, satisfactory recoveries of 87.0–109.9% were obtained for pear samples, with relative standard deviations (RSDs) ranging from 0.6% to 11.9%. Limits of detection (LOD) and limits of quantification (LOQ) were 0.03–0.10 μg/L and 0.034–0.34 μg/L, respectively. Analysis of pear samples from local markets and the native region was performed, and the detected concentrations of five PAEs and BPA ranged from 0.037 to 0.079 μg/L. Matrix effects were also evaluated. These findings demonstrate that the developed packed-nanofiber solid-phase extraction (PFSPE)-GC-MS method is reliable and effective for the determination of PAEs and BPA in pear samples.

1. Introduction

Phthalate esters (PAEs) and bisphenol A (BPA) are important environmental pollutants and endocrine-disrupting chemicals (EDCs) that pose significant risks to human health, even at low exposure levels []. PAEs, a group of semi-volatile organic compounds (SVOCs), are widely used as plasticizers in consumer products and building materials, leading to ubiquitous human exposure. Within PAE polymers, the interactions are primarily physical rather than chemical, allowing these compounds to migrate and accumulate in food, including pear, over time []. Consequently, PAEs are frequently detected in the environment and in food products, and their exposure has been associated with various adverse health effects such as carcinogenesis and endocrine disruption [,,,].
Similarly, BPA is a raw material for the production of polycarbonate plastics, epoxy resins, polyvinyl chloride, and rubber. These materials are extensively used in food packaging, beverage containers, and household or office equipment such as mixers, microwaves, televisions, telephones, and computers. During production and use, BPA can leach into the environment and has been detected in both indoor and outdoor air [,,,,].
Sample enrichment and pretreatment of PAEs and BPA are critical steps in their determination before chromatographic analysis. Conventional pretreatment methods often require membranes with large pore sizes (up to 500 μm), consume considerable amounts of organic solvents, and are time-intensive []. Various extraction methods have been developed for PAEs and BPA in pear, including Soxhlet extraction, liquid–solid extraction (LSE), sonication extraction (SE), and solid-phase extraction (SPE) [,,]. Soxhlet extraction, while effective, is time-consuming and requires large volumes of organic solvents []. Similarly, LSE involves laborious steps []. SE and SPE coupled with gas chromatography–tandem mass spectrometry (GC-MS/MS) have also been applied for the determination of PAEs in pear, achieving satisfactory recoveries (84–117%), but this conventional sorbent-supported SPE is still laborious and time-consuming when dealing with large volume samples [].
Recently, nanostructured materials such as electrospun nanofibers have attracted significant attention across many fields. Compared with micrometer-sized materials, nanofibers offer a much larger surface area-to-volume ratio, enabling the capture of greater amounts of target analytes, and can be readily modified to improve sorbent selectivity in packed-fiber solid-phase extraction (PFSPE) []. Electrospun nanofiber adsorbents have already been applied to enrich diverse compounds, including trazodone in plasma [], short-chain fatty acids in children’s urine [], retinol and α-tocopherol in plasma [], and PAEs in children’s urine []. However, to date, no study has reported the enrichment of PAEs and BPA in pear using PFSPE.
In this study, polystyrene-pyridine (PS-PD) nanofibers were fabricated and employed as sorbents both during sample collection and within a micro-column system. The method was developed for the capture and pre-concentration of trace levels of butyl benzyl phthalate (BBP), diethyl phthalate (DEP), dibutyl phthalate (DBP), di(2-ethylhexyl) phthalate (DEHP), di-n-octyl phthalate (DNOP), and BPA in pear samples.
In summary, a GC-MS method was established for the determination of five PAEs and BPA in pear. Key parameters such as the adsorption material, eluent type, eluent volume, and salt concentration were optimized, and matrix effects were systematically evaluated.

2. Materials and Methods

2.1. Chemicals and Reagents

N,N-Dimethylformamide (DMF) and tetrahydrofuran (THF) were obtained from Sinopharm Chemical Reagent Co., Ltd. (Suzhou, China). Polystyrene (PS, Mw = 185,000), aluminum foil, non-woven fabrics, and gauze were purchased from Nanjing Chemical Reagents Co., Ltd. (Nanjing, China). Pyridine (PD) was supplied by the Shanghai Chemical Agents Institute (Shanghai, China).
GC-grade standards of butyl benzoate (BBz, internal standard), butyl benzyl phthalate (BBP), diethyl phthalate (DEP), dibutyl phthalate (DBP), di(2-ethylhexyl) phthalate (DEHP), di-n-octyl phthalate (DNOP), and HPLC-grade n-hexane were purchased from Aladdin Reagent (Shanghai, China). Bisphenol A (BPA, analytical grade) was purchased from Nanjing Chemical Reagent Co., Ltd. (Nanjing, China). Analytical reagent (AR)-grade acetone was purchased from Sinopharm (Shanghai, China). HPLC-grade methanol and acetonitrile (ACN) were obtained from Yuwang Group (Dezhou, China), and HPLC-grade ethanol was obtained from Kemiou Chemical Reagent Co. (Tianjin, China).
A stock internal standard solution of BBz (50 µg/mL) was prepared in methanol. Stock solutions of the five PAEs and BPA (100 µg/mL each) were prepared in ACN. Working solutions were freshly prepared daily by appropriate dilution of stock solutions.

2.2. Sample Collection and Preparation

Pear samples were collected from local fields. Approximately 100 g of homogenized pear sample was accurately weighed. After being washed and peeled, the pear samples were chopped and homogenized in a blender to extract pear juice, and then vortexed for 5 min. The mixture was centrifuged at 3000 rpm for 5 min, and the supernatant was collected for the further PFSPE procedure.

2.3. Preparation of the PS-PD Nanofibers

The PS-PD material used in the electrospinning procedure was performed by a homemade experimental device. A total of 10% w/v of the electrospinning solution was prepared by dissolving PS/PD (1:1, m/m) in a mixed solvent, which consisted of tetrahydrofuran and dimethylformamide (6:4, v/v), then stirring at room temperature for approximately 10 h. After the PS/PD was dissolved completely, the solution was placed in a syringe with a stainless steel needle connected to a 15 kV voltage source. And the feed rate was 2 mL/h, and the injection solution was collected on screen, which consisted of aluminum foil.

2.4. PFSPE Procedure

Prior to extraction, the sample was adjusted to pH 7.0 using phosphate buffer. For optimal protonation of the target analytes (PD) in an aqueous environment, a 1:1 (v/v) dilution was performed with acetonitrile/water mixture (1:1); the 5 mL PS-PD nanofiber cartridges (glass columns) were activated by sequential washing with 200 µL of methanol followed by 400 µL of deionized water. For extraction, 500 µL of the pear sample was loaded onto the preconditioned nanofiber sorbent (5 mg) using air pressure applied with a 10 mL gas-tight syringe (0.5 mm in diameter) attached to the cartridge. After the entire sample had passed through, analytes were eluted with 100 µL of ACN. Finally, 1 µL of the eluent was injected into the GC-MS using an autosampler. The complete extraction process required approximately 5 min at room temperature.

2.5. Chromatographic Analysis

GC-MS analysis was carried out by an Agilent 7890B GC (Agilent, Santa Clara, CA, USA) coupled to a 5977A mass-selective detector (Agilent, Santa Clara, CA, USA) and a 7693 autosampler (Agilent, Santa Clara, CA, USA) was used. Separation was carried out on a HP-5MS column (30 m × 0.25 mm i.d. × 0.25 μm film thickness). Helium was used as carrier gas at a constant flow rate of 2.25 mL/min. Injection was performed in splitless mode with 1 µL injection volume. The oven program was 100 °C (2 min hold) to ramp 15 °C/min to 300 °C (hold 4 min). Detector conditions were ion source temperature of 280 °C, quadrupole 250 °C, and transfer line 280 °C. Electron impact ionization was applied at 70 eV. The GC-MS parameters for the determination of PAEs and BPA are summarized in Table 1.
Table 1. GC-MS parameters for detecting five PAEs and BPA. Reprinted with permission from Ref. []. Copyright 2019, John Wiley and Sons. All rights reserved.

2.6. Quality Assurance and Quality Control (QA/QC)

Rigorous quality control was applied to minimize potential contamination, as PAEs and BPA are widespread in laboratory environments. All sample handling materials were glass or certified free of PAEs and BPA. Method blanks were analyzed after every 20 samples to monitor systematic contamination, and results confirmed negligible contamination during analysis.

2.7. Method Validation

Method validation was performed to ensure reliability. Linearity was evaluated using calibration solutions of PAEs and BPA at 0.01, 0.05, 0.1, 0.5, 1, 5, and 10 µg/L. Accuracy was assessed through recovery studies by spiking liquid samples of pear at 0.1, 1, and 10 µg/L. Limits of detection (LOD) and quantification (LOQ) were determined at signal-to-noise ratios of 3:1 and 10:1, respectively. Precision was assessed as relative standard deviation (RSD) using five different nanofiber membranes under repeat analysis.

3. Results

3.1. Characterization of Nanofibers

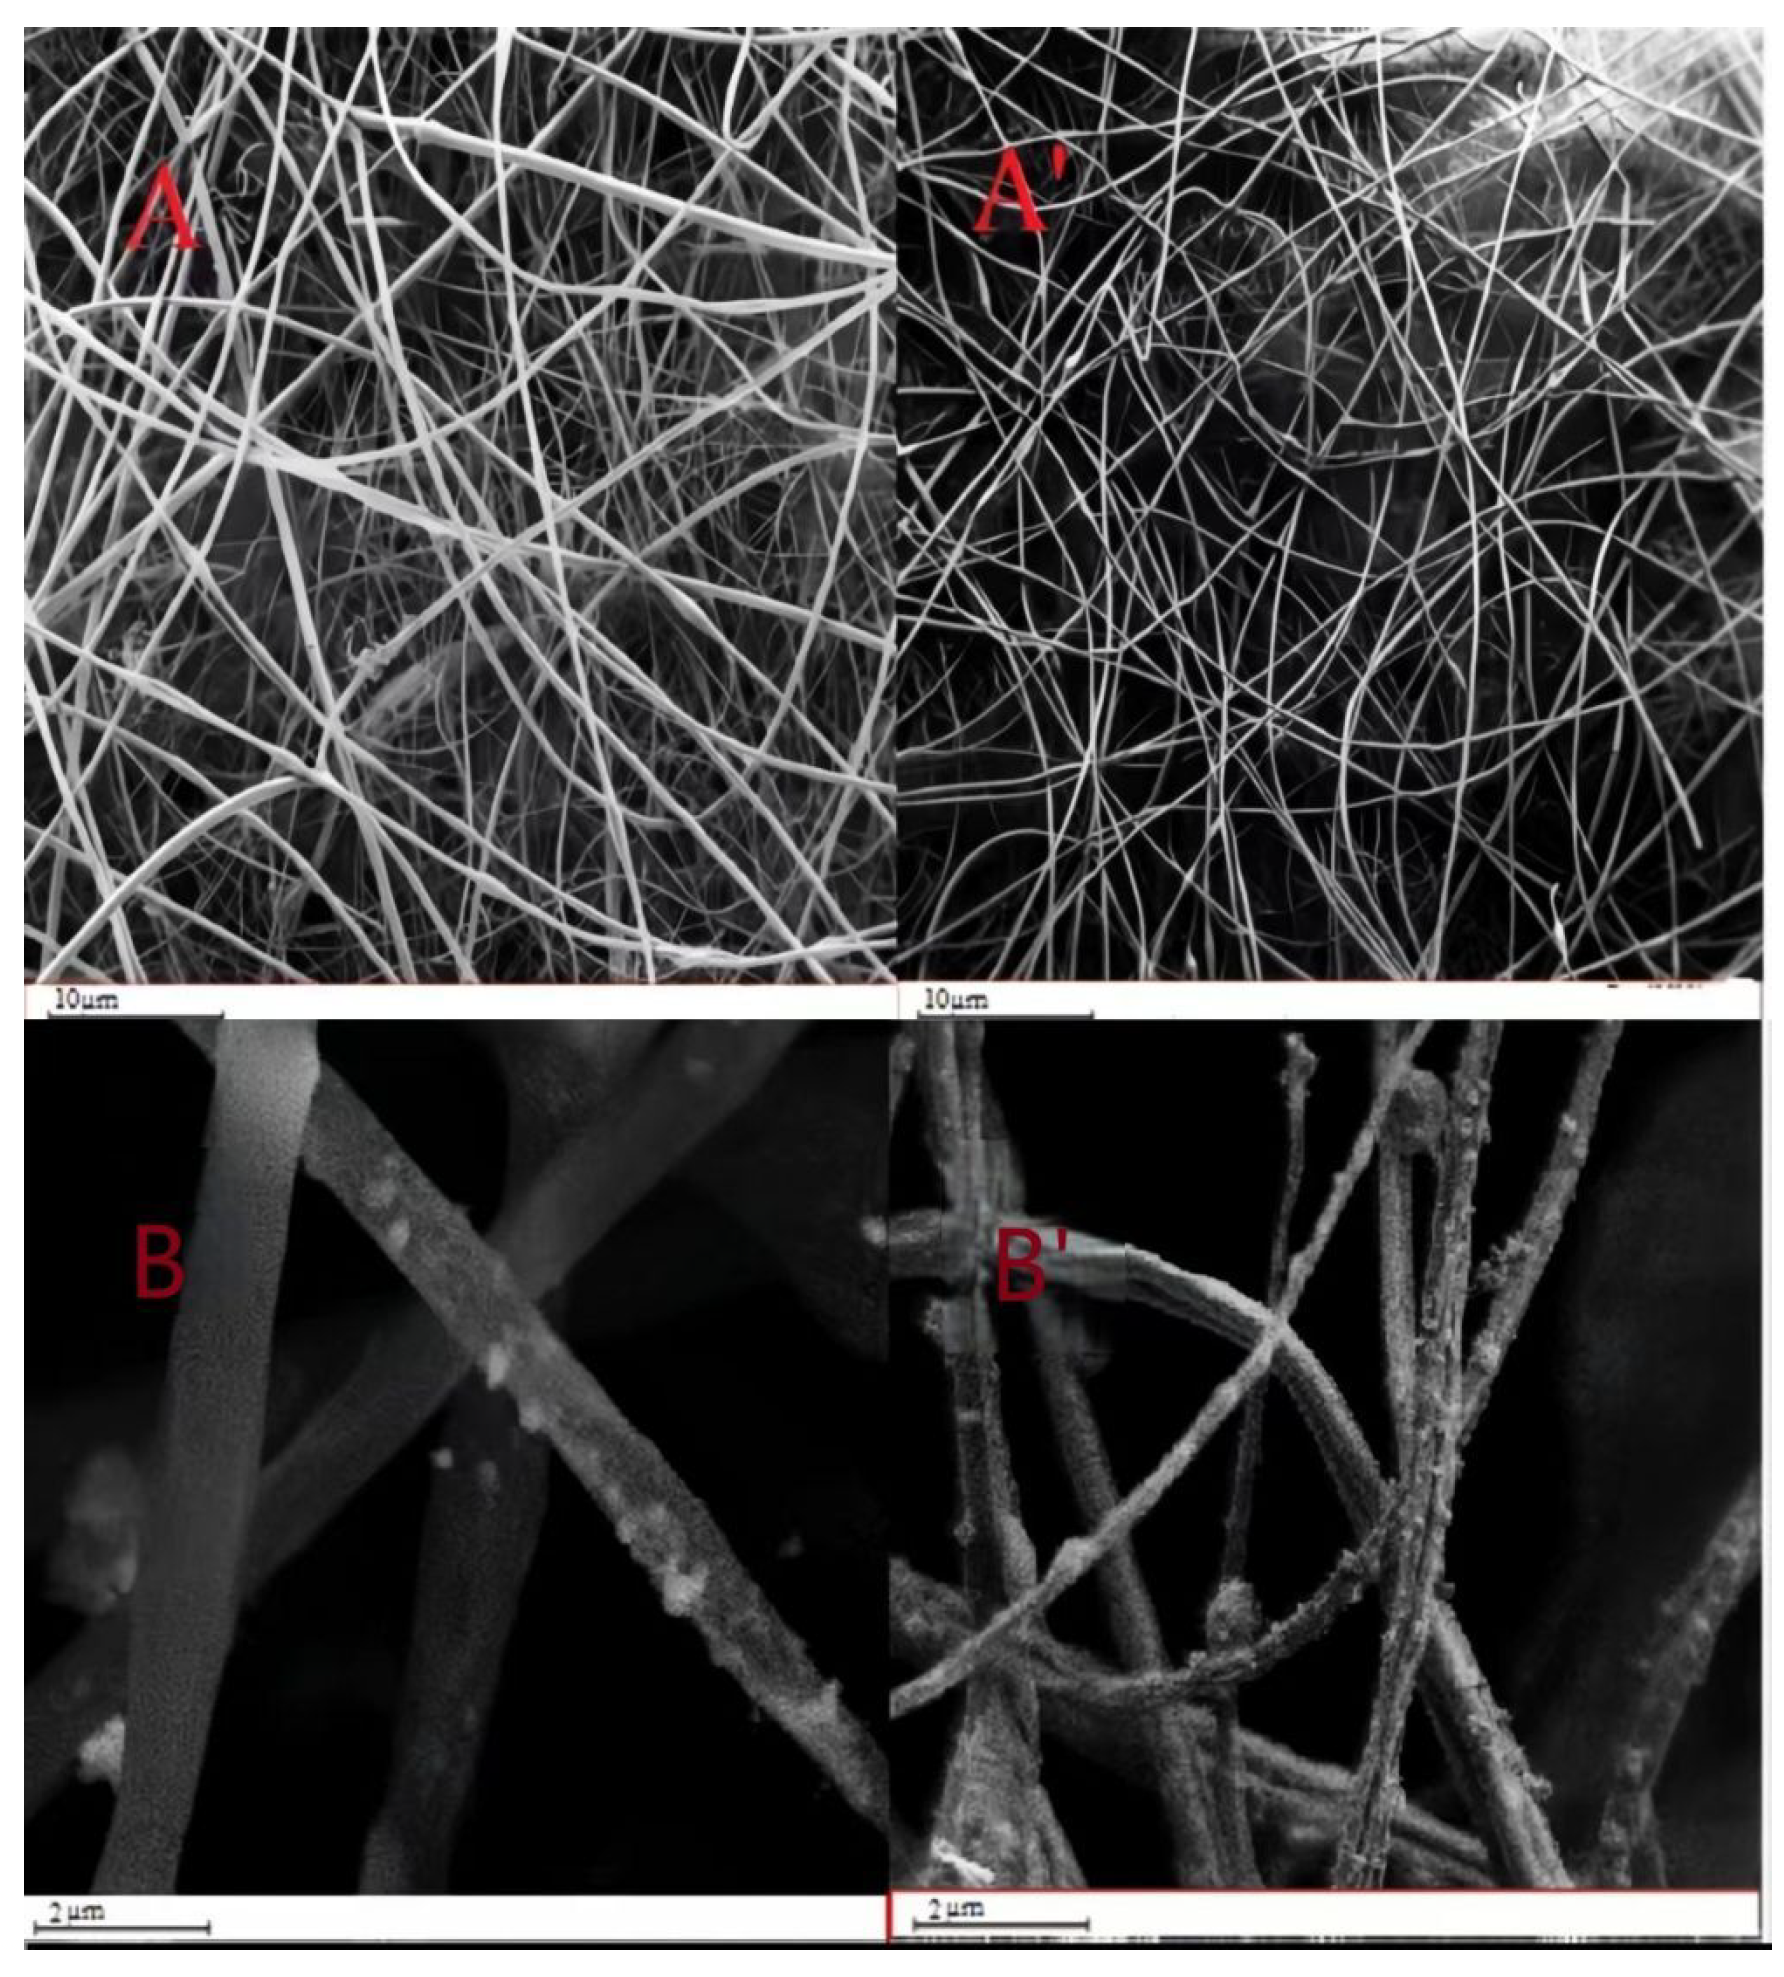
The morphology of the PS-PD nanofibers was characterized using SEM and TEM. The SEM and TEM images of PS/PS-PD nanofibers are shown in Figure 1A and Figure 1A’, respectively. After modification with PD, the PS nanofibers became finer in structure, suggesting that the PS-PD nanofibers may possess a more porous architecture, which could enhance the efficiency of interactions between the fibers and the target compounds. Furthermore, Figure 1B,B’ display the SEM images of PS nanofibers and PS-PD nanofibers after exposure to target compounds in sample. In addition, the PS/PD nanofibers are finer than PS nanofiber, and the average diameter of PS nanofiber (0.98 μm) is almost three times of the PS/PD nanofiber (0.29 μm) by using Nano Measurer 1.2 calculation. Thus, the PS/PD nanofiber possesses higher surface area (39.2 m2/g) than PS nanofiber (19.83 m2/g), which may increase adsorption efficiency of the nanofibers interacting with the target compounds.
Figure 1. SEM and TEM images of (A) PS nanofibers, (A’) PS-PD nanofibers, and (B,B’) PS/PS-PD nanofibers after collection of target compounds.
The results clearly demonstrated that the amount of particulate matter adsorbed by the PS-PD nanofibers was significantly higher than that of the PS nanofibers. Thus, it can be speculated that the sample collection efficiency of PS-PD nanofibers was superior to that of PS nanofibers in capturing the target compounds.
Since PS nanofibers themselves exhibit adsorption capacity for PAEs, as reported in our previous work, and quartz membranes have also been shown to adsorb heavy metals [,], the enrichment of five PAEs and BPA in pear was further investigated using PS nanofibers, PS-PD nanofibers, and quartz membranes as sorbent materials. The purpose was to verify whether the PD modification could improve the efficiency of sample collection. As shown in Figure 2, compared with the results obtained from unmodified PS nanofibers, the PS nanofibers modified with PD exhibited an increase in sample collection efficiency for PAEs and BPA by approximately 20–30%, and the relevant experiment was performed under conditions involving amounts of unmodified PS nanofibers; the PS-PD nanofibers that were used were the same.
Figure 2. Comparison of adsorption efficiency of different nanofibers on target compounds.
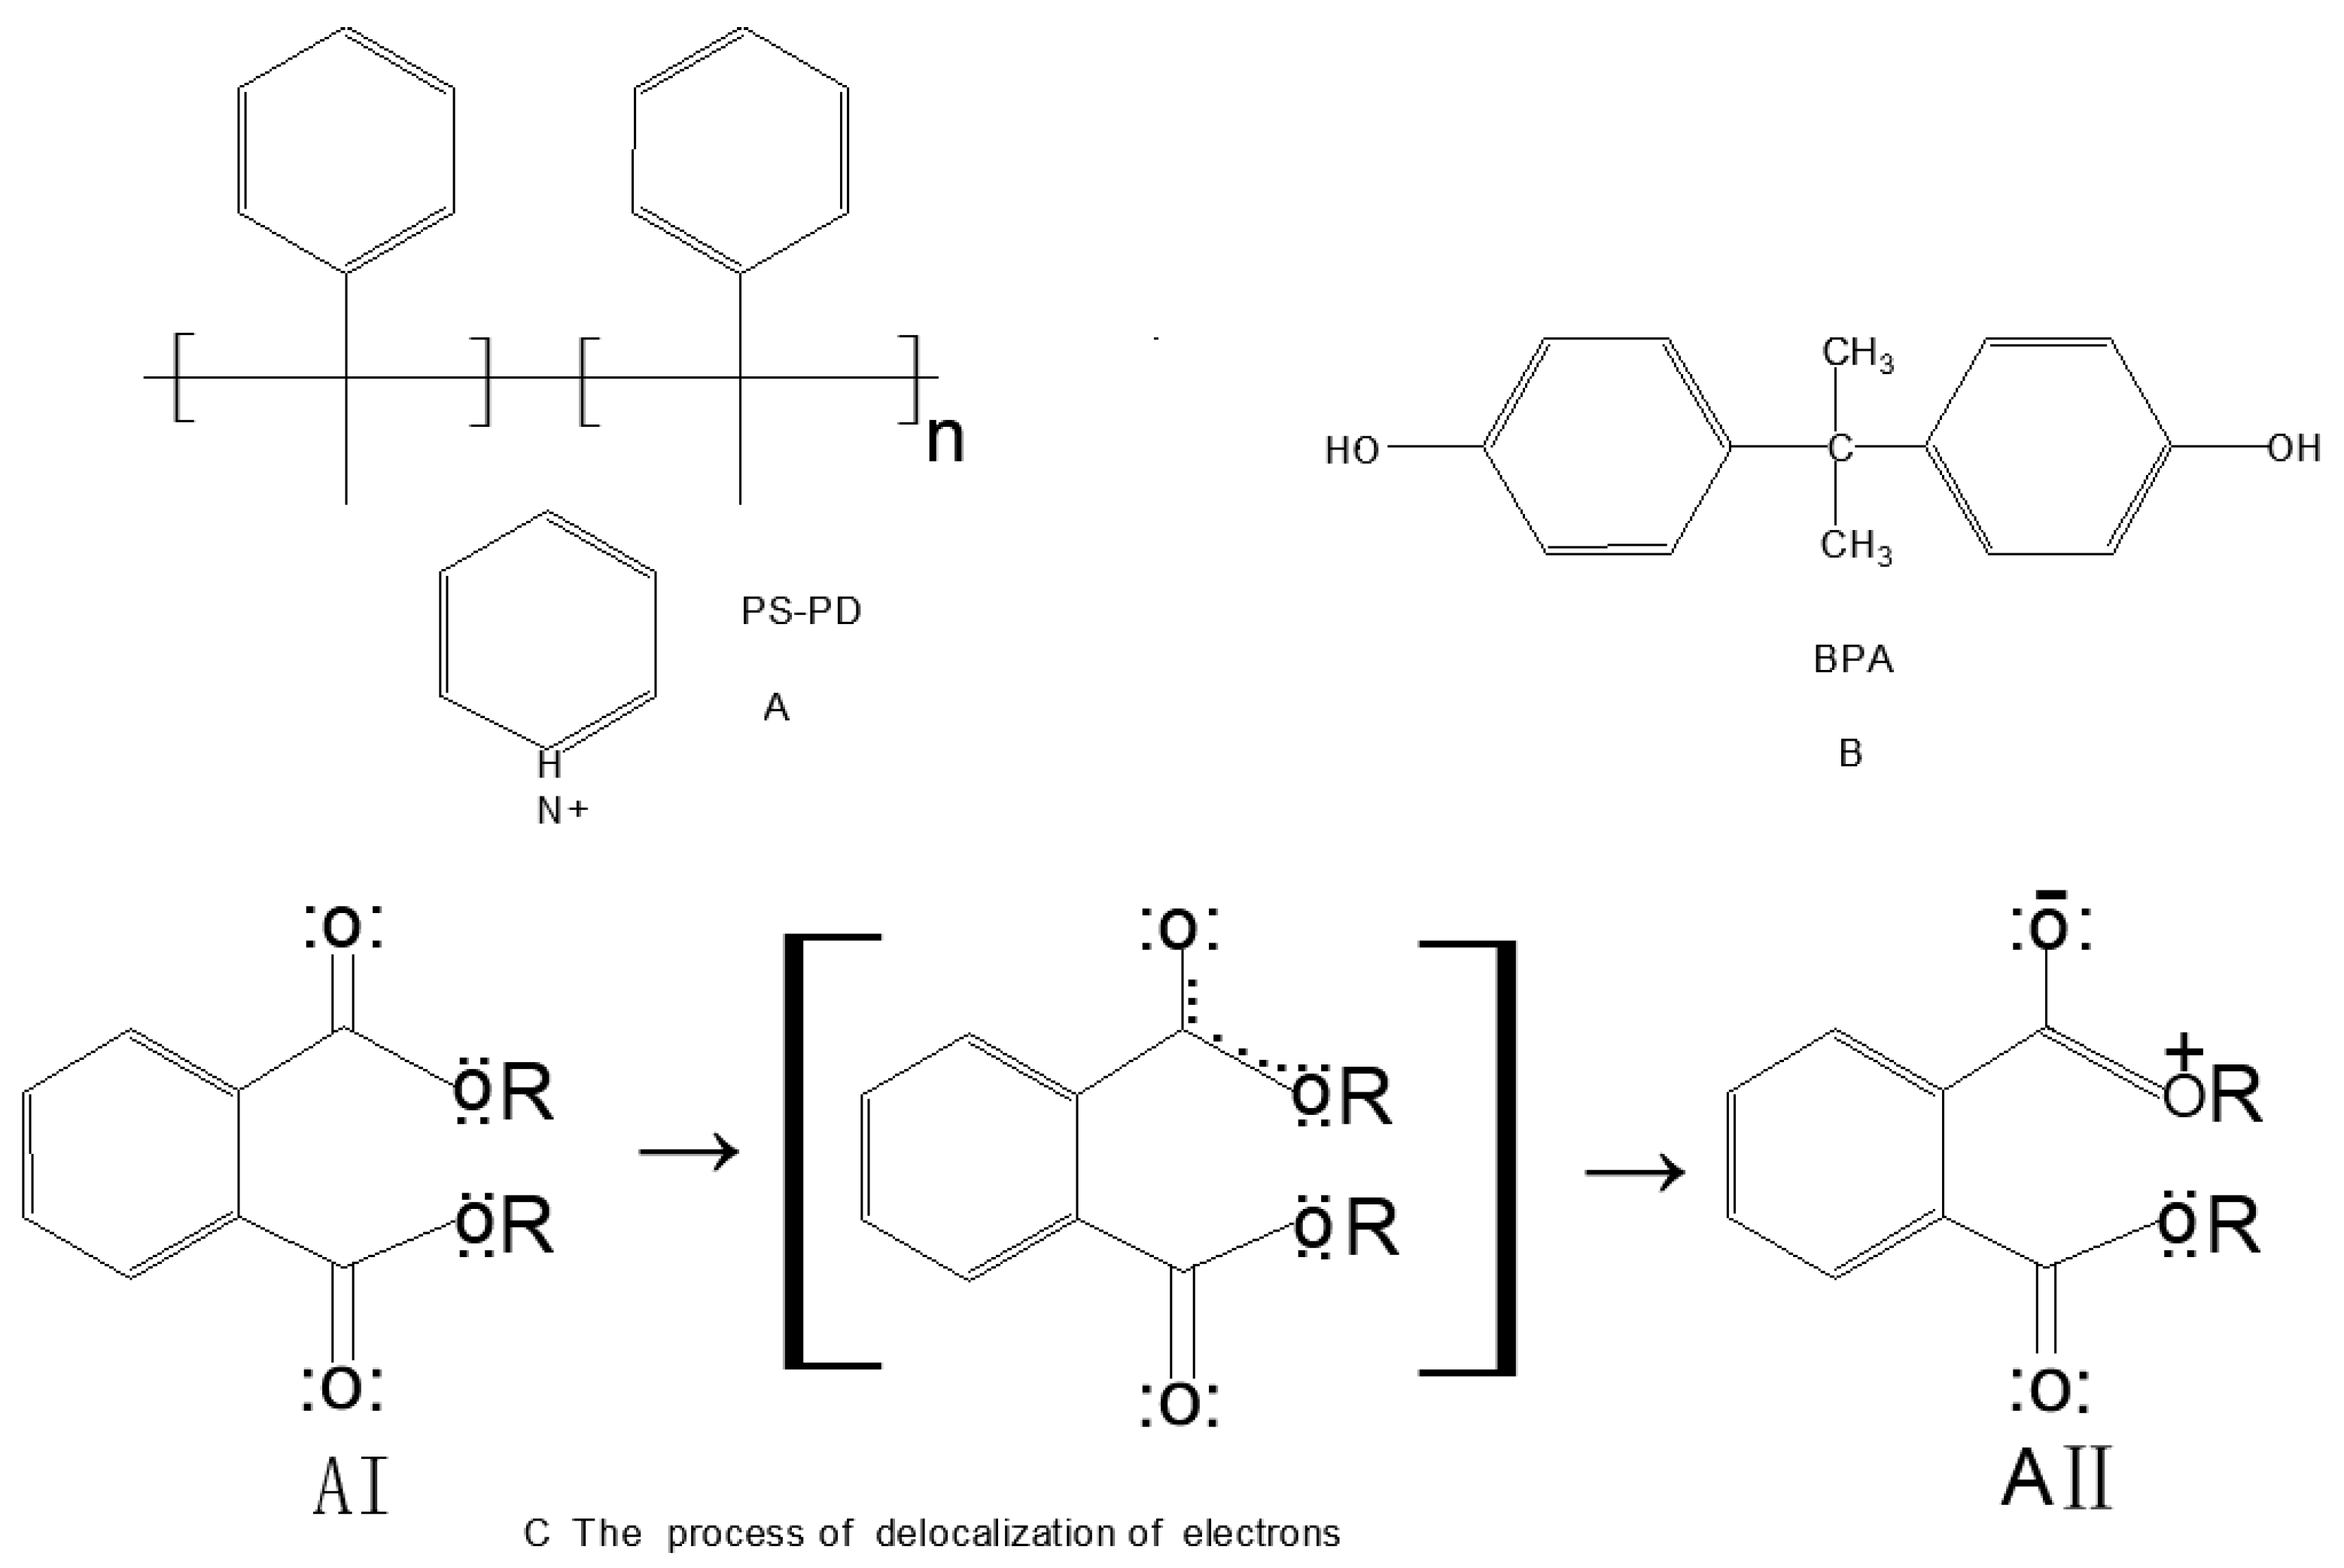
As presented in Figure 3A, the positive effect of PD modification on the efficiency of PS nanofibers in collecting PAEs and BPA can be attributed to additional intermolecular interactions. Specifically, in addition to the π-π interactions between PS nanofibers and BPA, there was an extra hydrogen-bonding interaction between the nitrogen atom in the PD ring and the hydroxyl group (-OH) of BPA. On the other hand, as schematically illustrated in Figure 3C, the ester groups of PAEs possess a partial double-bond character due to electron delocalization, as shown in resonance structures (AI and AII) []. Moreover, in aqueous solution, PD becomes protonated, carrying a positive charge. This leads to additional electrostatic interactions between PS-PD nanofibers and the PAEs, further enhancing adsorption efficiency.
Figure 3. Chemical structure of PS-PD nanofibers and BPA, and schematic illustration of electron delocalization in phthalate molecules. (A) PS/PD; (B) BPA; (C) The process of delocalization of electrons.

3.2. Optimization of Elution Solvent and PH

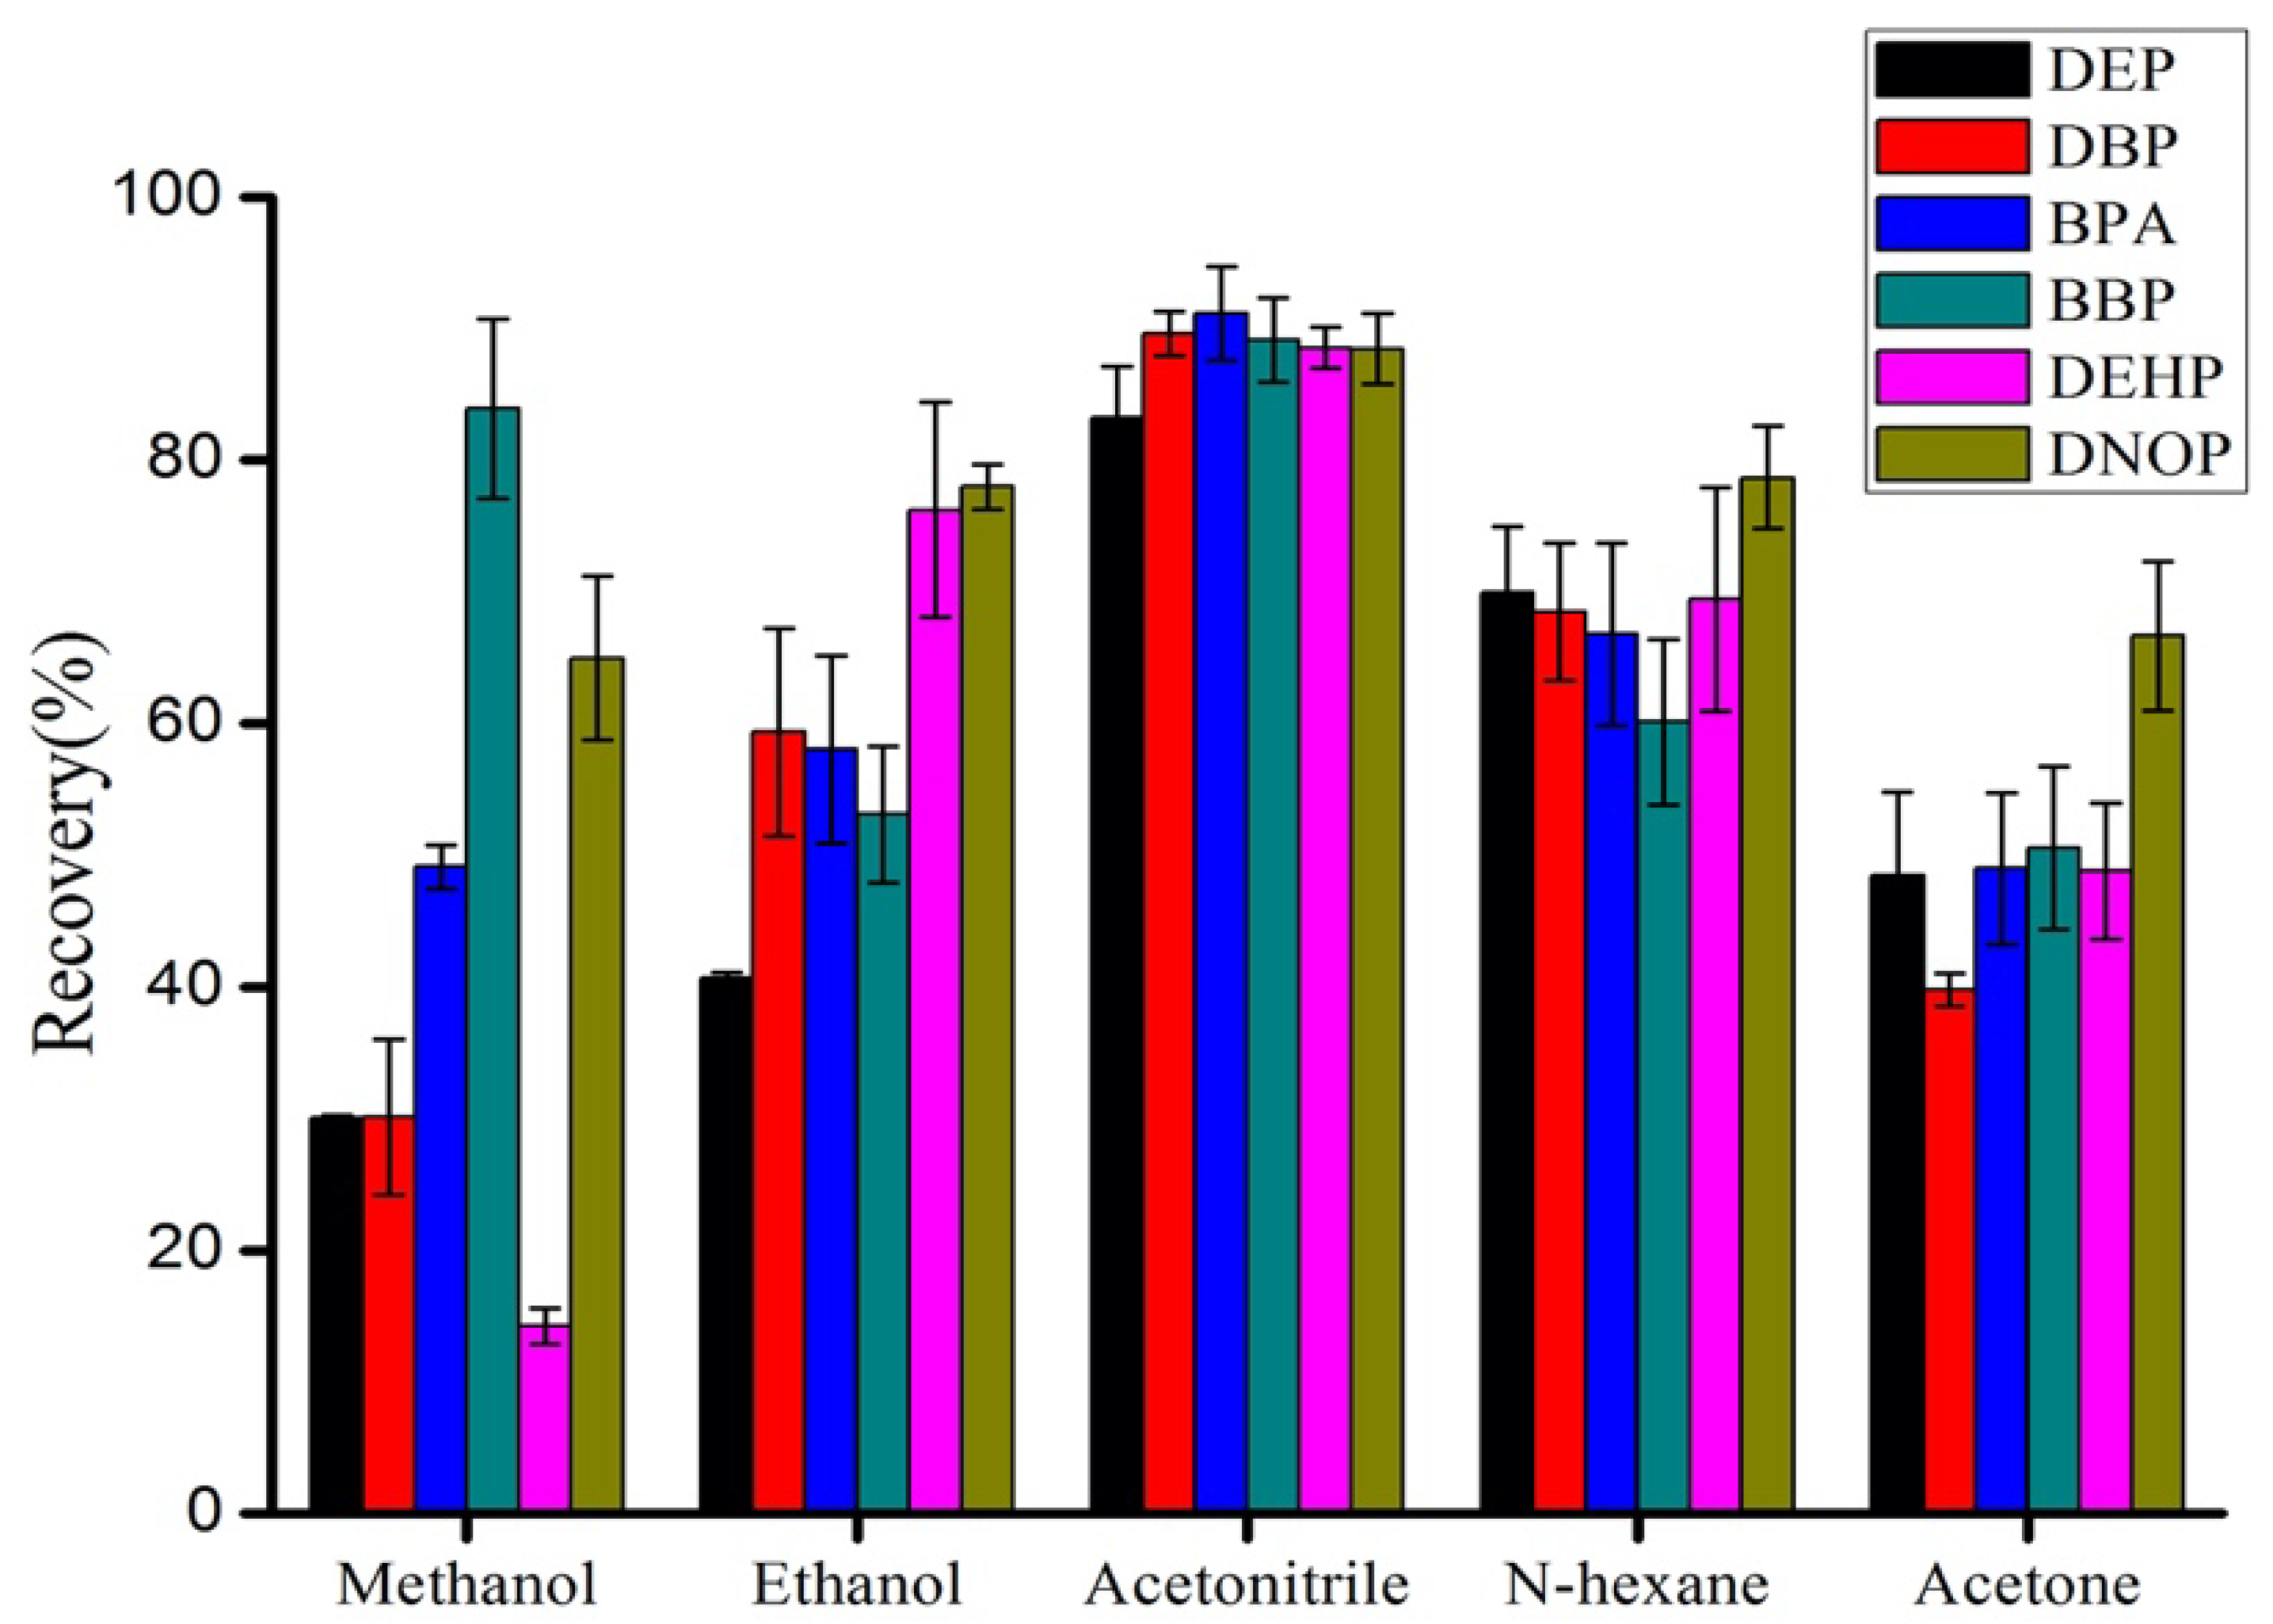
The elution solvent plays a crucial role in the PFSPE-based system. In general, methanol, ethanol, acetonitrile (ACN), n-hexane, and acetone are commonly used in PFSPE techniques []. Therefore, in this work, five organic extraction solvents—methanol, ethanol, ACN, n-hexane, and acetone—were tested. As shown in Figure 4, the highest extraction recoveries (83.2–91.2%) with acceptable RSD values (<5%) were obtained using ACN. Thus, ACN was selected as the optimal eluent for further experiments.
Figure 4. Influence of elution solvent type on the extraction efficiency of fibers for five PAEs and BPA.
It has been reported that decreasing the elution volume improves detection sensitivity; however, too small a volume may fail to completely desorb the adsorbates []. To ensure maximum elution efficiency of PAEs and BPA from the PFSPE columns, different volumes of ACN ranging from 50 to 200 µL were tested for optimal desorption of the five PAEs and BPA from the nanofibers, as shown in Figure 5. The recovery reached its maximum when the elution solvent volume was 100 µL. Increasing the elution volume beyond 100 µL, up to 300 µL, did not result in any significant improvement. Hence, 100 µL of ACN was deemed sufficient for efficient elution.
Figure 5. Influence of elution solvent volume on the extraction efficiency of fibers for five PAEs and BPA.
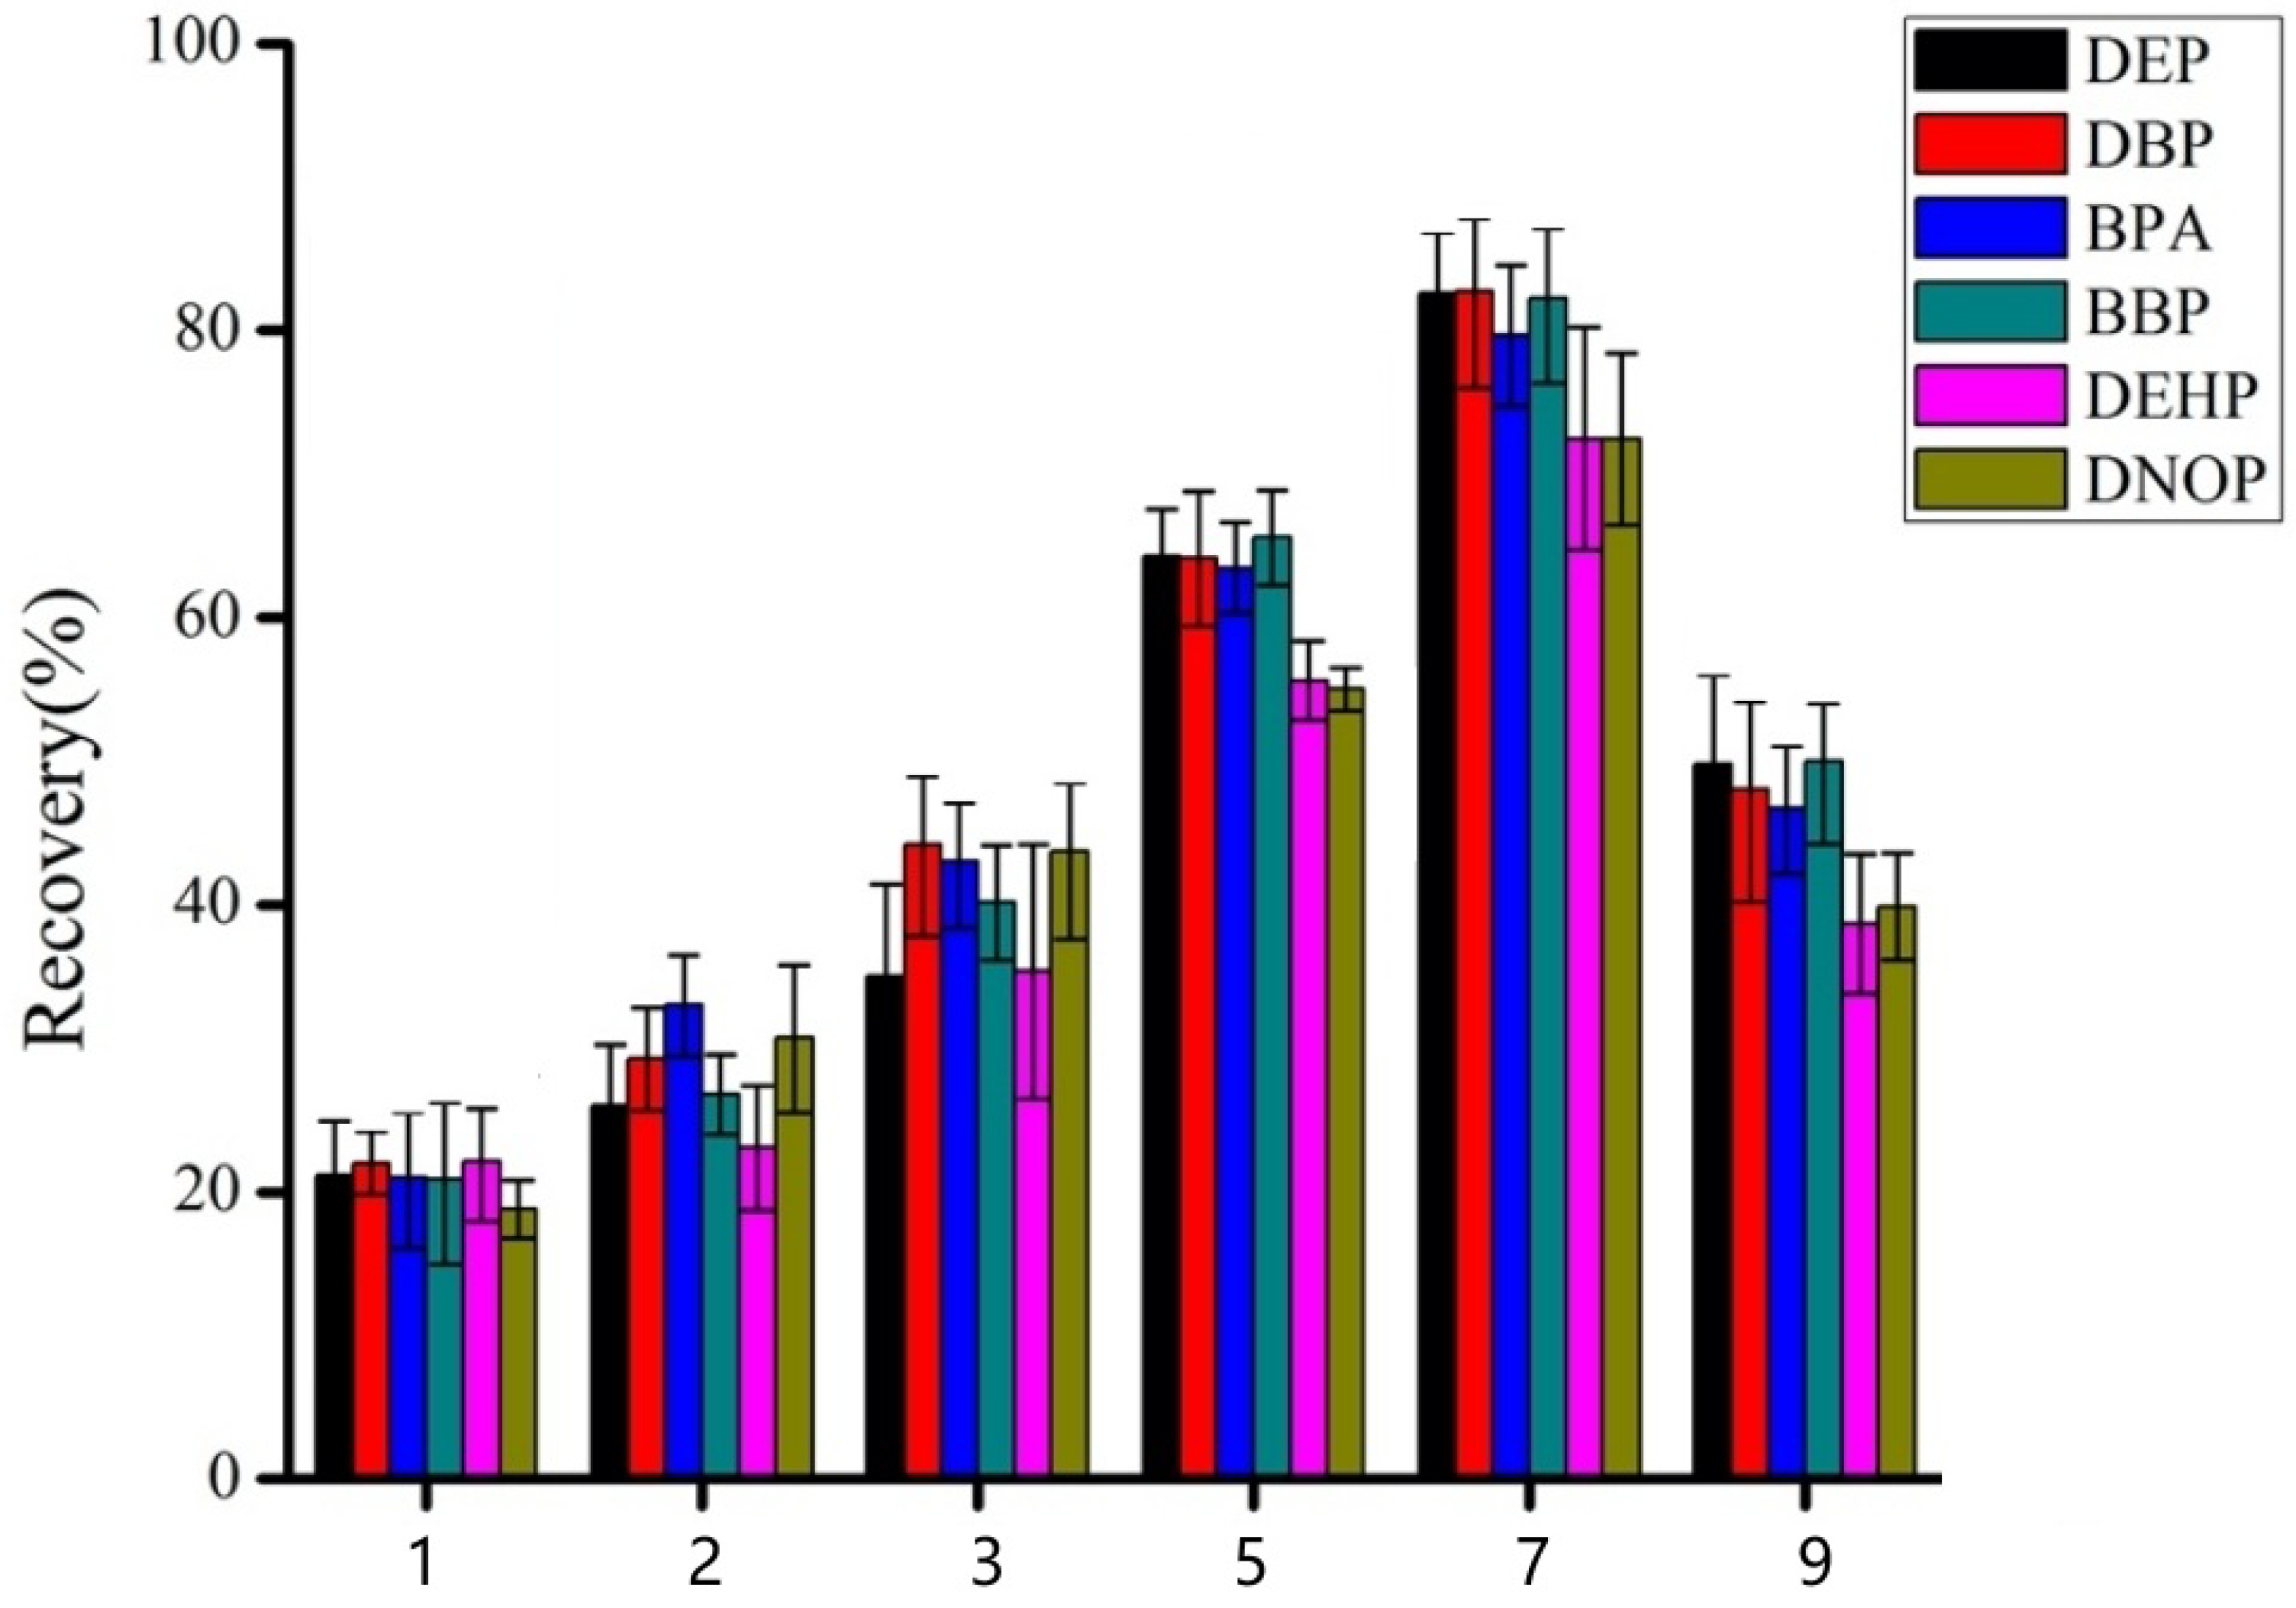
The PH of pear sample is also an crucial role for quantitative recovery of the analytes, The effect of pH of 1, 2, 3, 5, 7, and 9 were tested. As shown in Figure 6, the maximum performance was obtained at pH 7. This pH is appropriate to ensure all the extraction of PAEs, BPA and the removal of matrix compounds and interference. The subsequent experiments were carried out at pH 7.
Figure 6. Influence of PH on the extraction efficiency of fibers for five PAEs and BPA.

3.3. Optimization of Salt Concentration

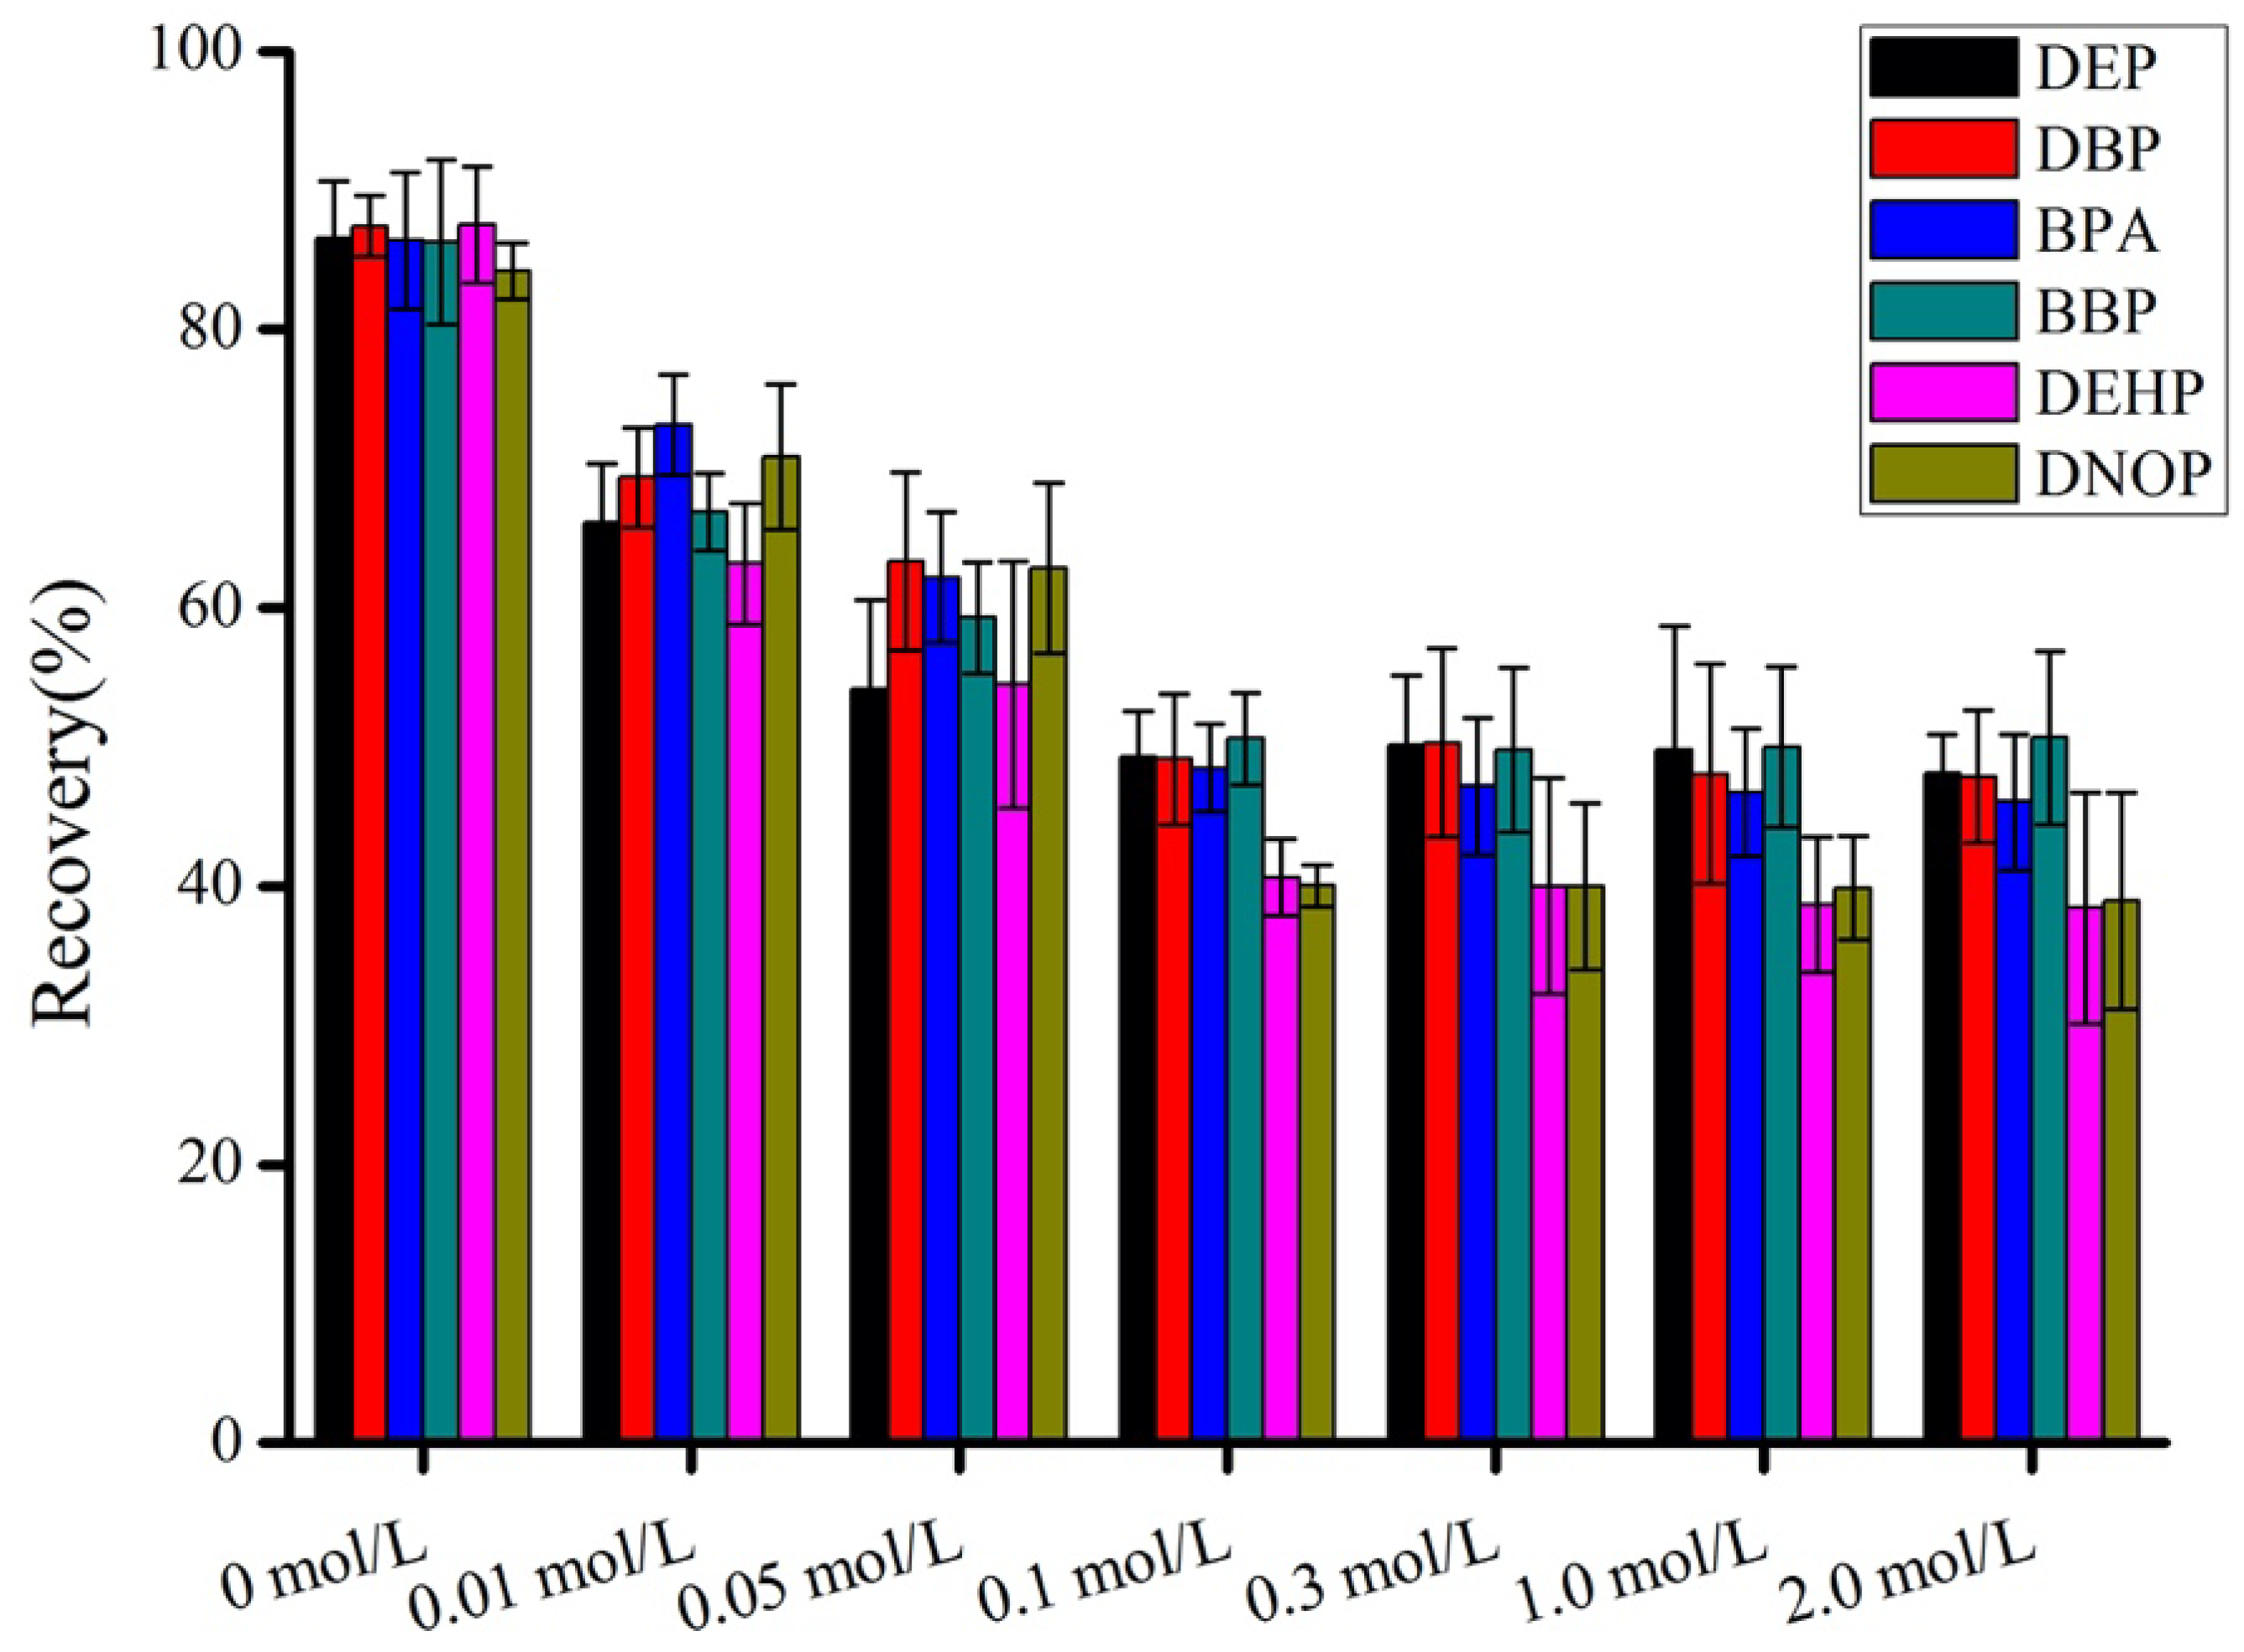
In general, the addition of salt to aqueous samples can reduce the solubility of organic compounds in the water phase and thereby increase the partition coefficients of the target analytes. In this study, the salting-out effect was investigated by adding sodium chloride at concentrations ranging from 0 to 2 mol/L. As shown in Figure 7, the highest extraction recoveries were achieved without the addition of salt. When salt was added, the recoveries significantly decreased. This decline can be attributed to the increase in viscosity of the pear matrix, which hindered the transfer and adsorption of target compounds from the donor to the acceptor phase []. In summary, it was not necessary to add salt to the samples.
Figure 7. Influence of salt concentration on the extraction efficiency of fibers for five PAEs and BPA.

3.4. Method Validation

In the present study, the analysis of pear samples was verified under optimal conditions. The validation parameters included calibration curves, linearity, selectivity, reproducibility, limits of detection, limits of quantification, and precision.

3.4.1. Calibration Curves

The linearity of the calibration curves was evaluated over three days and assessed by plotting the peak area ratio of analytes to the internal standard (Ai/Ai.s.) versus the nominal concentration. The concentration range of the calibration curves extended from 0.01 μg/L to 10 μg/L, covering the concentration levels detected in pear sample solutions. The correlation coefficients (R2) were greater than 0.9951, indicating excellent linearity.

3.4.2. Selectivity and Reproducibility

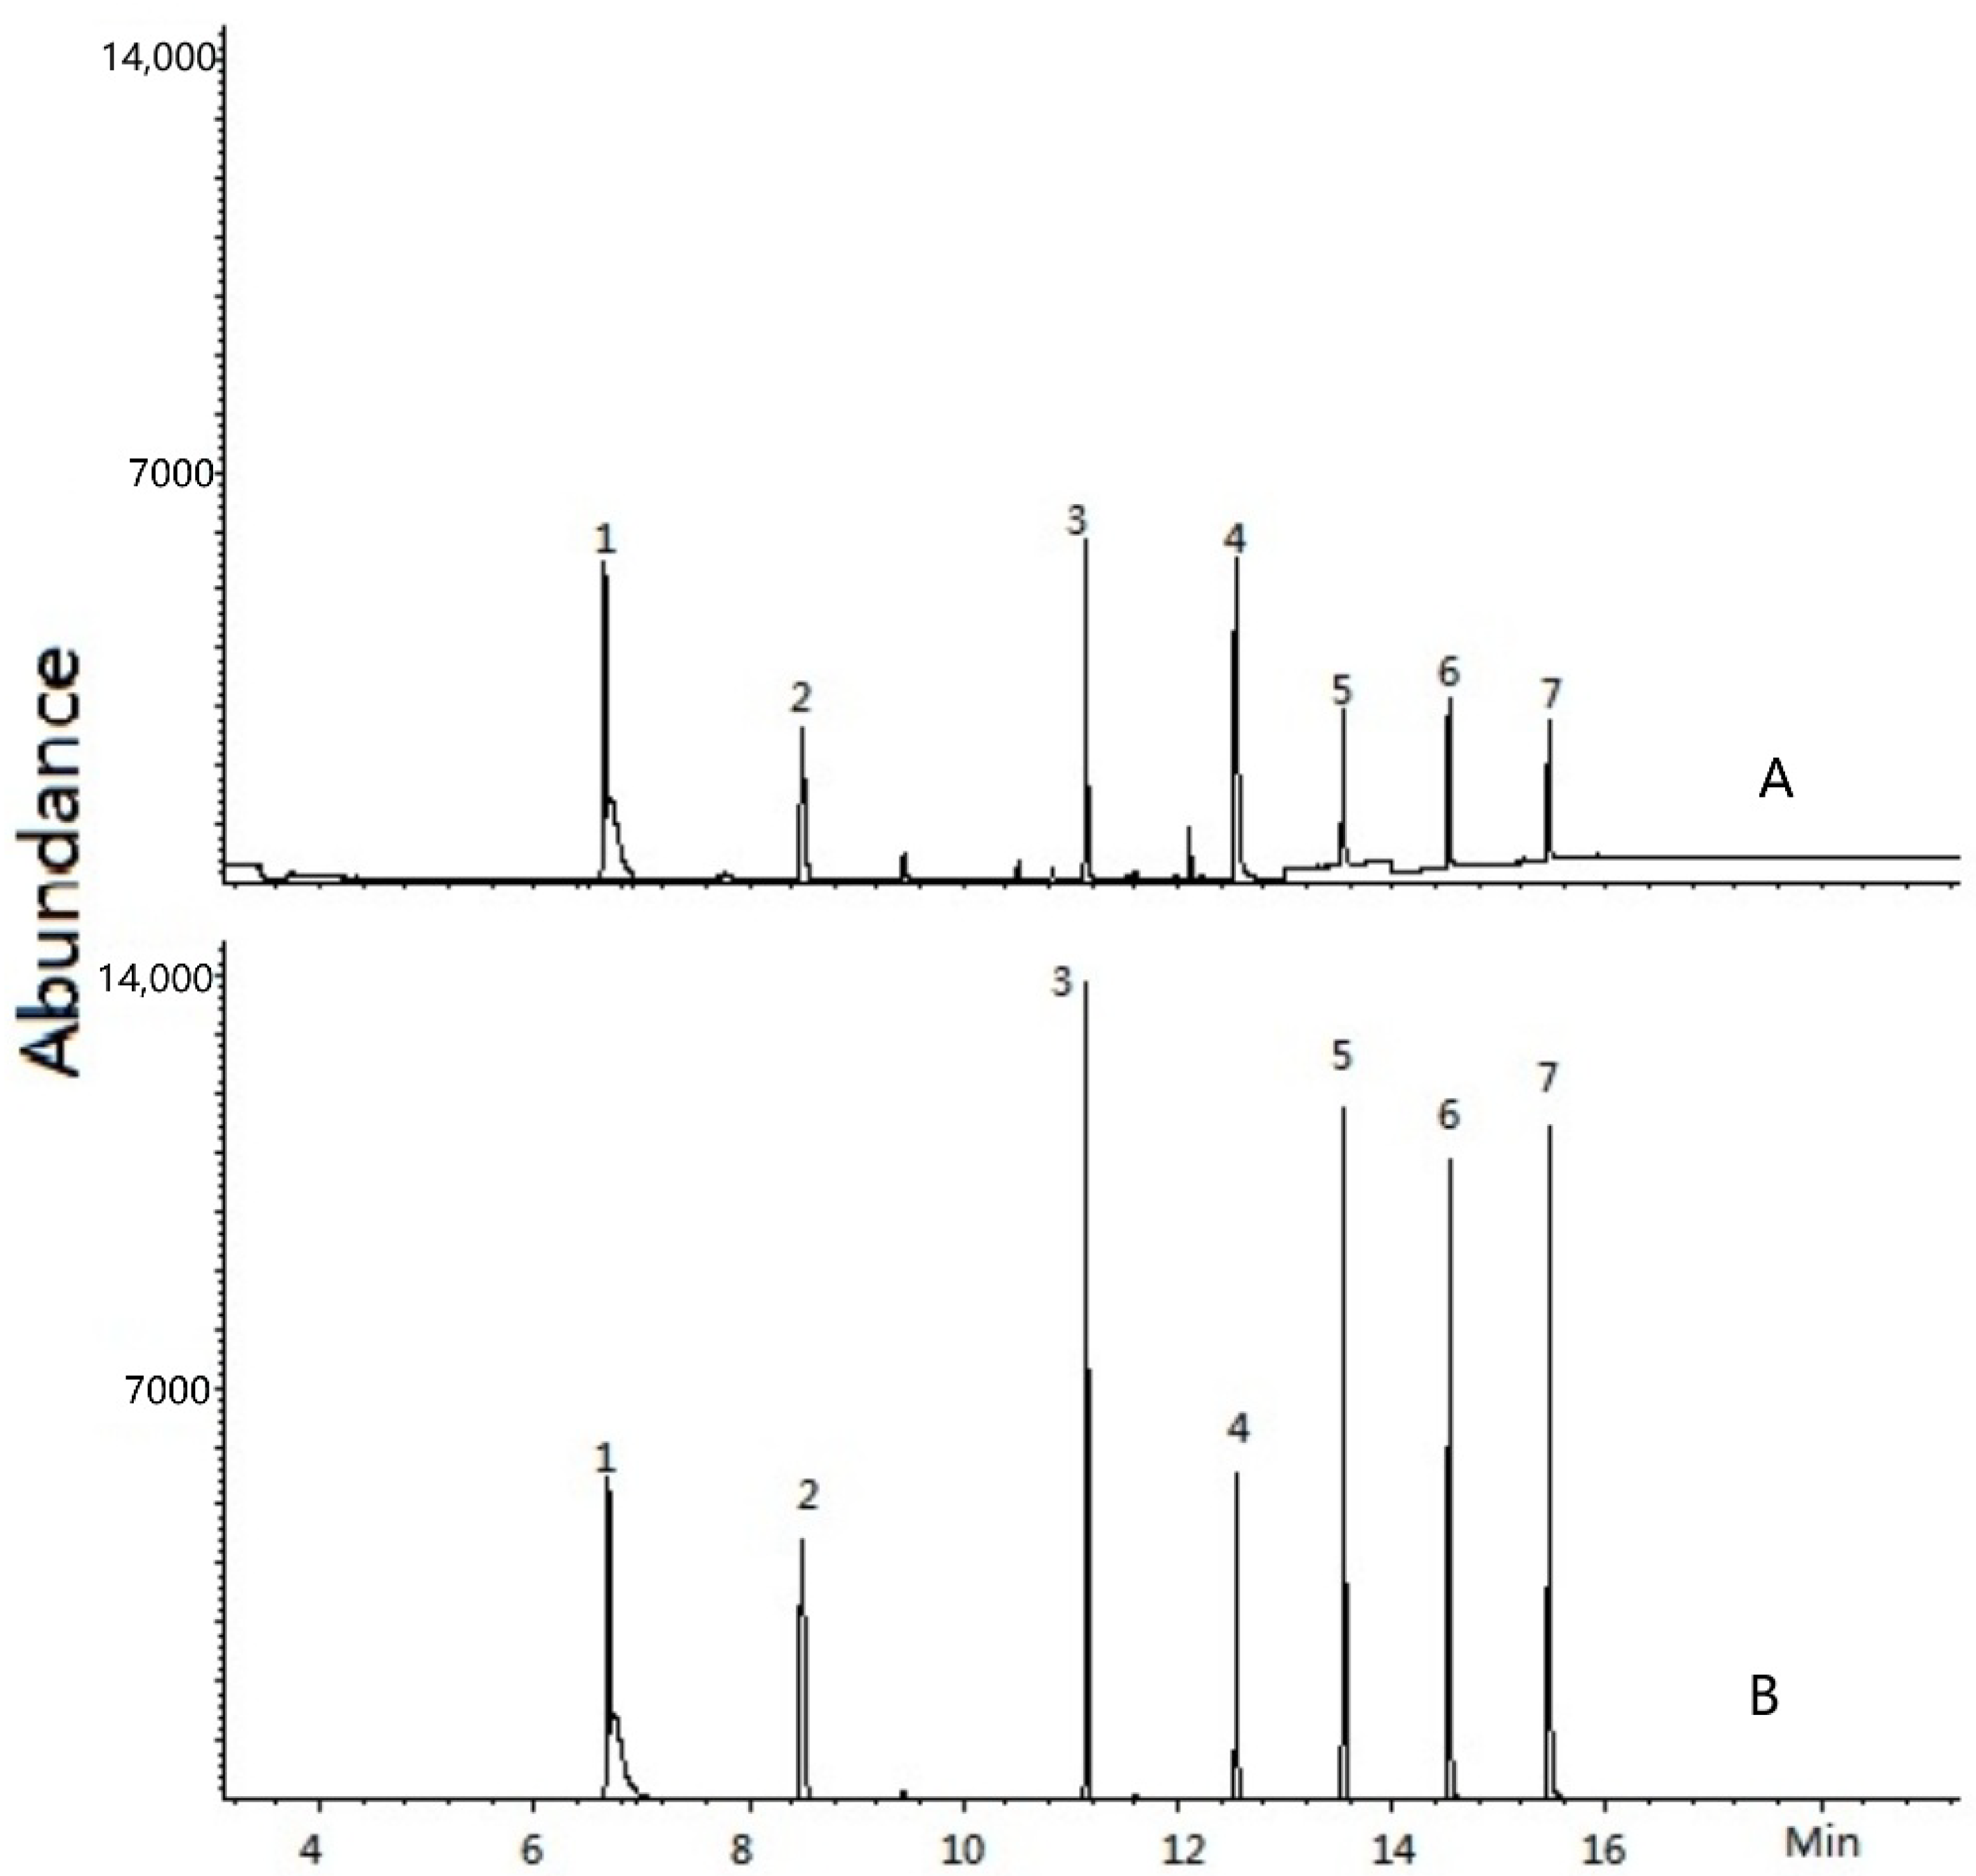
Selectivity was determined by injecting a blank matrix solvent and spiked samples containing five PAEs and BPA into the GC-MS system. The typical GC-MS chromatograms shown in Figure 8 demonstrated that the five PAEs and BPA were well separated, with no obvious interfering peaks observed. In addition, the baseline noise was consistent regardless of the matrix. These results confirmed the excellent selectivity of the established method.
Figure 8. Chromatograms of (A) pear sample solution pretreated with PFSPE; (B) standard solution of PAEs and BPA in methanol. (1) BBz; (2) DEP; (3) DBP; (4) BPA; (5) BBP; (6) DEHP; (7) DNOP.

3.4.3. Precision

The reproducibility of the method was evaluated through intra-day and inter-day precision studies. Both intra-day and inter-day precision were determined by analyzing five PAEs and BPA at three concentrations (0.1 µg/L, 1 µg/L, 10 µg/L) under optimal conditions for five consecutive days. Independent sample preparations were used for each test. As shown in Table 2, good results were obtained, with relative standard deviations (RSDs) ranging from 0.6% to 11.9%. These results demonstrated the excellent reproducibility of the method and confirmed its reliability for quantitative analysis.
Table 2. Analytical parameters for the GC-MS method: linearity, recovery, RSD, LOD, and LOQ.

3.4.4. Limits of Detection and Quantification

As shown in Table 2, the limits of detection (LOD, S/N = 3.0) and limits of quantification (LOQ, S/N = 10.0) for the PFSPE-GC/MS method were in the ranges of 0.03–0.10 μg/L and 0.034–0.34 μg/L, respectively, for the five PAEs and BPA. These results demonstrated the high sensitivity of the method for detecting PAEs and BPA in pear samples.

3.5. Matrix Effect

It has been reported that the ratio of calibration curve slopes (matrix-matched versus pure solvent) can approximately reflect the matrix effects []. In the present study, the matrix effect (ME) was evaluated by comparing the responses of stock solutions spiked in ACN with those of solutions prepared in the pear matrix (ACN extract). The ratio of calibration curve slopes was used to evaluate the ME for the entire method. The ME response ratio was calculated using the following formula:
ME(%) = (Slope post extraction sample/Slope solvent) × 100%
Ratios within the range of 80–120% were considered to indicate no significant matrix effect []. As shown in Table 3, the ratios ranged from 93.2% to 107.1%. Therefore, it can be concluded that no matrix effect was observed in the established PFSPE-GC/MS method.
Table 3. Evaluation of matrix effect by comparison of calibration curve slopes.

3.6. Application of the Developed Procedure to Real Samples

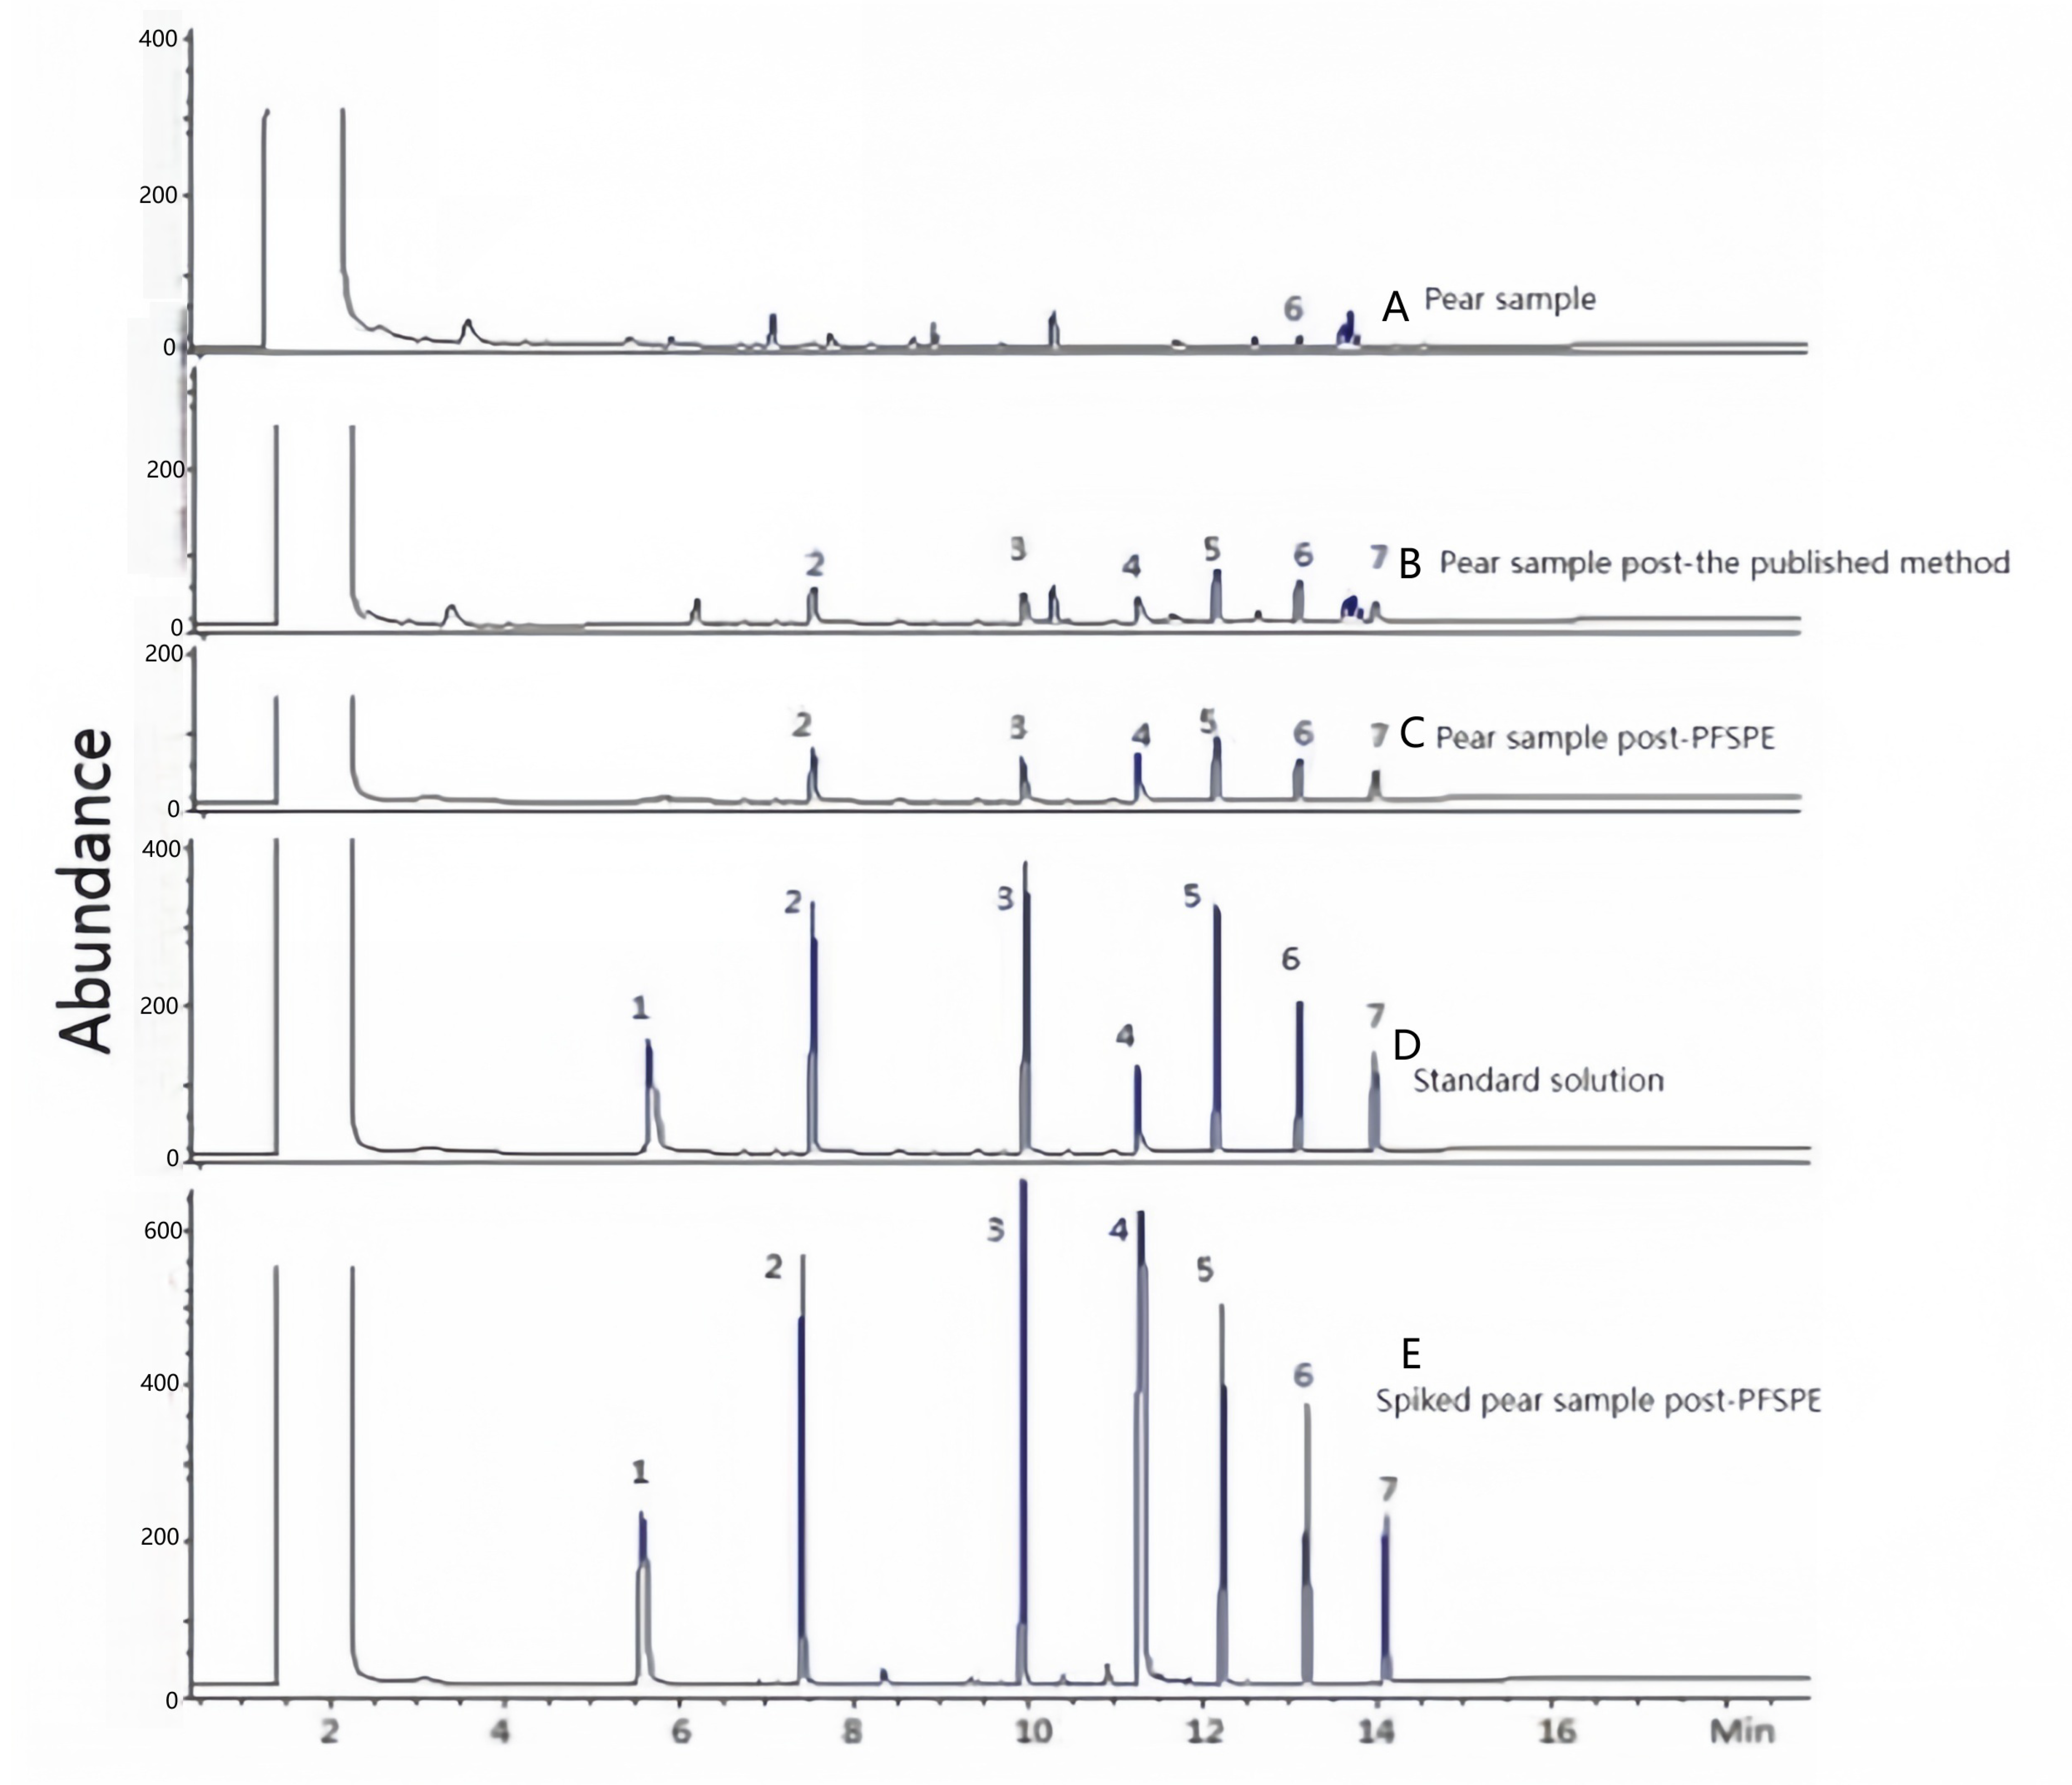
The practical applicability of the developed PFSPE-GC/MS method was evaluated using real pear samples under optimized conditions. The chromatograms of the pear samples and the standard solution are shown in Figure 9. Without pretreatment by PFSPE, the response values of most PAEs and BPA could not be detected due to the interference from other components present in the pear matrix. However, after pretreatment with PFSPE, the response values of PAEs and BPA were clearly enhanced, and the matrix interference was effectively minimized.
Figure 9. Chromatograms of A: Pear sample; B: Pear sample post-the published method; C: Pear sample post-PFSPE; D: Standard solution; E: Spiked pear sample post-PFSPE. Peaks: (1) BBz; (2) DEP; (3) DBP; (4) BPA; (5) BBP; (6) DEHP; (7) DNOP.
Moreover, the novel method was successfully applied for the determination of trace levels of five PAEs and BPA in pear samples collected from the northern region of Anhui Province. The results are presented in Table 4. The results demonstrate that the levels of concentration of PAEs and BPA from pear in supermarket were higher than in those from the native place; this may due to the fact that the PAEs and BPA in supermarket pear could have stemmed from additional transmission from the materials used for packaging pears. The test results were almost all in accordance with GB 9685-2016 []. And previous studies have also shown that PAEs have been detected in fruits []. The traditional method requires a large amount of organic solvents (such as 200–500 mL for Soxhlet extraction), while PFSPE achieves green objectives through micro-scale solvents (<5 mL). Recovery rate and precision: the recovery rate of PFSPE for polycyclic aromatic hydrocarbons (PAEs) (>85%) is superior to that of traditional SPE (70–80%), and the RSD is <5%, which is more stable compared to Soxhlet (RSD 10–15%).
Table 4. Concentrations of phthalates and bisphenol A (µg/L) in pear samples from a supermarket and from the native region (0.039–0.079).

4. Conclusions

In this study, we established a rapid and convenient method for the determination of five PAEs and BPA in pear samples. All parameters affecting the extraction efficiency of the PFSPE system for the enrichment and determination of PAEs and BPA were systematically optimized. Under the optimal conditions, the observed 87% higher recovery for samples with a surface area > 39.2 m2/g aligns with prior studies on porous materials. The pH-dependent protonation of PD (Figure 3) confirms the proposed mechanism; at pH 7, the zwitterionic form dominates, enabling optimal electrostatic interaction with the PFSPE sorbent. This method provides reliable technical support for the monitoring of PAEs and BPA in pears from the northern Anhui Province. In addition, this study is significant and helpful for the development of installation that can be extended in realms such as water treatment, extraction of farm products, and others. And it could open new horizons in the preconcentration and analysis of target objects in a complex matrix.

Author Contributions

Conceptualization, W.X. and Z.T.; methodology, W.X., L.W., M.J. and Z.T.; software, Z.T.; validation, W.X., L.W. and Z.T.; investigation, X.Z.; resources, J.L. and X.Z.; data curation, W.X.; writing—original draft preparation, W.X. and J.L.; writing—review and editing, H.L. and Z.T.; visualization, L.W. and M.J.; supervision, X.Z.; project administration, J.L. and H.L. All authors have read and agreed to the published version of the manuscript.

Funding

This research was funded by the 2021 Doctoral Research Startup Fund Project of Suzhou University, grant number 2021BSK046.

Data Availability Statement

The original contributions presented in this study are included in the article. Further inquiries can be directed to the corresponding authors.

Conflicts of Interest

The authors declare no conflicts of interest.

References

  1. Gu, Y.Y.; Yu, X.J.; Peng, J.F.; Chen, S.B.; Zhong, Y.Y.; Yin, D.Q.; Hu, X.L. Simultaneous solid-phase extraction coupled with liquid chromatography-tandem mass spectrometry and gas chromatography-tandem mass spectrometry for the highly sensitive determination of 15 endocrine-disrupting chemicals in seafood. J. Chromatogr. B 2014, 965, 164–172. [Google Scholar] [CrossRef]
  2. Wang, L.X.; Gong, M.Y.; Xu, Y. Phthalates in pear collected from various indoor environments in Beijing, China and resulting non-dietary human exposure. Build. Environ. 2017, 124, 315–322. [Google Scholar] [CrossRef]
  3. Huang, W.; Li, N.; Xu, R.; Li, T.; Li, C. Determination of nine pyrethroid pesticide residues in tea by gas chromatography-tandem mass spectrometry combined with accelerated solvent extraction and solid-phase extraction. Chin. J. Chromatogr. 2018, 36, 1303–1310. [Google Scholar] [CrossRef]
  4. Chakraborty, P.; Bharat, G.K.; Gaonkar, O.; Mukhopadhyay, M.; Chandra, S.; Steindal, E.H.; Nizzetto, L. Endocrine-disrupting chemicals used as common plastic additives: Levels, profiles, and human dietary exposure from the Indian food basket. Sci. Total. Environ. 2022, 810, 152200. [Google Scholar] [CrossRef]
  5. Wu, J.; Lai, Y.; Zhu, H.; Yang, X.; Ye, X.; Zhang, A.; Sun, J. Phthalate esters and their metabolites in paired soil-crop systems from farmland in major provinces of eastern China: Pollution characteristics and implications for human exposure. Sci. Total Environ. 2023, 882, 163645. [Google Scholar] [CrossRef] [PubMed]
  6. Otero, P.; Saha, S.K.; Moane, S.; Barron, J.; Clancy, G.; Murray, P. Improved method for rapid detection of phthalates in bottled water by gas chromatography-mass spectrometry. J. Chromatogr. B 2015, 997, 229–235. [Google Scholar] [CrossRef] [PubMed]
  7. Al-Saleh, I.; Elkhatib, R.; Al-Rajoudi, T.; Al-Qudaihi, G. Assessing the concentration of phthalate esters (PAEs) and bisphenol A (BPA) and the genotoxic potential of treated wastewater (final effluent) in Saudi Arabia. Sci. Total Environ. 2017, 578, 440–451. [Google Scholar] [CrossRef] [PubMed]
  8. Kargarghomsheh, P.; Naghashan, M.; Farhadiyan, S.; Arabameri, M.; Tooryan, F.; Shariatifar, N. Determination of phthalic acid esters (PAEs) along with probabilistic health risk assessment in fruit juice samples in Tehran, Iran. Environ. Sci. Pollut. Res. 2023, 30, 44833–44844. [Google Scholar] [CrossRef]
  9. Yin, S.; Yang, Y.; Yang, D.; Li, Y.; Jiang, Y.; Wu, L.; Sun, C. Determination of 11 phthalate esters in beverages by magnetic solid-phase extraction combined with high-performance liquid chromatography. J. AOAC Int. 2019, 102, 1624–1631. [Google Scholar] [CrossRef]
  10. Rastkari, N.; Jeddi, M.Z.; Yunesian, M.; Ahmadkhaniha, R. Effect of sunlight exposure on phthalate migration from plastic containers to packaged juices. J. Environ. Health Sci. Eng. 2018, 16, 27–33. [Google Scholar] [CrossRef]
  11. Zhang, T.; Ma, B.; Wang, L. Phthalic acid esters in grains, vegetables, and fruits: Concentration, distribution, composition, bioaccessibility, and dietary exposure. Environ. Sci. Pollut. Res. 2023, 30, 2787–2799. [Google Scholar] [CrossRef] [PubMed]
  12. Wang, X.; Xu, M.; Yang, A.; Wang, Y.; Hou, S.; Zheng, N.; Dong, D. Health risks of population exposure to phthalic acid esters through the use of plastic containers for takeaway food in China. Sci. Total Environ. 2021, 785, 147347. [Google Scholar] [CrossRef]
  13. Xu, Q.; Yin, X.; Wu, S.; Wang, M.; Wen, Z.; Gu, Z. Determination of phthalate esters in water samples using Nylon6 nanofibers mat-based solid-phase extraction coupled to liquid chromatography. Microchim. Acta 2010, 168, 267–275. [Google Scholar] [CrossRef]
  14. Zhang, Q.Q.; Ma, Z.R.; Cai, Y.Y.; Li, H.R.; Ying, G.G. Agricultural plastic pollution in China: Generation of plastic debris and emission of phthalic acid esters from agricultural films. Environ. Sci. Technol. 2021, 55, 12459–12470. [Google Scholar] [CrossRef]
  15. Zhao, R.S.; Chu, L.L.; Wang, Y.; Song, Y.; Liu, P.; Li, C.; Huang, J.J.; Kang, X.J. Application of packed-fiber solid-phase extraction coupled with GC-MS for the determination of short-chain fatty acids in children’s urine. Clin. Chim. Acta 2017, 468, 120–125. [Google Scholar] [CrossRef]
  16. Liu, Z.Y.; Kang, X.J.; Fang, F. Solid-phase extraction with electrospun nanofibers for determination of retinol and α-tocopherol in plasma. Microchim. Acta 2010, 168, 59–64. [Google Scholar] [CrossRef]
  17. Tang, Z.G.; Chu, L.L.; Wang, Y.; Song, Y.; Liu, P.; Fan, J.H.; Huang, J.J.; Liu, X.W.; Wei, L.L.; Li, C.; et al. Packed-nanofiber solid-phase extraction coupled with gas chromatography-mass spectrometry for the determination of phthalate esters in urine from children. J. Chromatogr. B 2017, 1061–1062, 342–348. [Google Scholar] [CrossRef] [PubMed]
  18. Tang, Z.G.; Han, Q.; Xie, L.; Chu, L.L.; Wang, Y.; Sun, Y.; Kang, X.J. Simultaneous determination of five phthalate esters and bisphenol A in milk by packed-nanofiber solid-phase extraction coupled with gas chromatography and mass spectrometry. J. Sep. Sci. 2019, 42, 851–861. [Google Scholar] [CrossRef]
  19. Liu, D.; Min, S.H.; Song, X. The application of directly suspended droplet microextraction for the evaluation of phthalic acid esters in cow’s milk by gas chromatography-mass spectrometry. J. Chromatogr. A 2016, 1443, 66–74. [Google Scholar] [CrossRef]
  20. Mousa, A.; Basheer, C.; Al-Arfaj, A.R. Application of electro-enhanced solid-phase microextraction for determination of phthalate esters and bisphenol A in blood and seawater samples. Talanta 2013, 115, 308–313. [Google Scholar] [CrossRef]
  21. Sajid, M.; Basheer, C.; Alsharaa, A.; Narasimhan, K.; Buhmeida, A.; Qahtani, M.A.; Al-Ahwal, M.S. Development of natural sorbent-based micro-solid-phase extraction for determination of phthalate esters in milk samples. Anal. Chim. Acta 2016, 924, 35–44. [Google Scholar] [CrossRef] [PubMed]
  22. Mehraie, A.; Shariatifar, N.; Arabameri, M.; Moazzen, M.; Mortazavian, A.M.; Sheikh, F.; Sohrabvandi, S. Determination of phthalic acid esters (PAEs) in bottled water distributed in Tehran: A health risk assessment study. Int. J. Environ. Anal. Chem. 2024, 104, 2417–2431. [Google Scholar] [CrossRef]
  23. Zhuo, L.Y.; Yin, Y.C.; Fu, W.S.; Qiu, B.; Lin, Z.Y.; Yang, Y.Q.; Zheng, L.M.; Li, J.R.; Chen, G.N. Determination of paralytic shellfish poisoning toxins by HILIC-MS/MS coupled with dispersive solid-phase extraction. Food Chem. 2013, 137, 115–121. [Google Scholar] [CrossRef] [PubMed]
  24. Almeida, S.; Raposo, A.; Almeida-González, M.; Carrascosa, C. Bisphenol A: Food exposure and impact on human health. Compr. Rev. Food Sci. Food Saf. 2018, 17, 1503–1517. [Google Scholar] [CrossRef]
  25. GB 9685-2016; Use of Additives in Materials and Products Contacting Food. National Health Commission: Beijing, China, 2016.
  26. Ji, Y.; Wang, F.; Zhang, L.; Shan, C.; Bai, Z.; Sun, Z.; Liu, L.; Shen, B. A comprehensive assessment of human exposure to phthalates from environmental media and food in Tianjin, China. J. Hazard. Mater. 2014, 279, 133–140. [Google Scholar] [CrossRef]
Disclaimer/Publisher’s Note: The statements, opinions and data contained in all publications are solely those of the individual author(s) and contributor(s) and not of MDPI and/or the editor(s). MDPI and/or the editor(s) disclaim responsibility for any injury to people or property resulting from any ideas, methods, instructions or products referred to in the content.

Article Metrics

Citations

Article Access Statistics

Multiple requests from the same IP address are counted as one view.