Abstract
Phenolic compounds contribute significantly to the nutritional value of underused rowan (Sorbus aucuparia L.), but their extraction depends heavily on pre-processing and extraction methods. This study examined convective drying (CD) and freeze-drying (FD) of fruits, followed by ethanol extraction using rotor–stator homogenization, ultrasound-assisted extraction (UAE), or Soxhlet, to measure total phenolics (TPC), total flavonoids (TFC), and DPPH antioxidant activity (AA). AGREEprep benchmarking was included to assess method greenness. FD samples outperformed CD samples, increasing TPC by ≈2× (α = 0.05). For CD samples, Soxhlet extraction produced the highest averages, while for FD samples, UAE resulted in the highest AA (>58 μmol TE/g DW), and Soxhlet with 16 cycles maximized TPC and TFC (22.82 mg CGA/g DW; 4.24 mg QE/g DW). AA correlated strongly with TPC (R = 0.860) but only exhibited a moderate correlation with TFC. Multivariate analysis revealed that extracts mainly differed based on drying method and extraction intensity. AGREEprep scores were 0.45 for homogenization/UAE and 0.35 for Soxhlet. Overall, drying and extraction methods jointly influence results: FD combined with UAE offers a robust antioxidant profile with a lower environmental impact, whereas FD with Soxhlet maximizes phenolic and flavonoid yields at a higher environmental cost.
1. Introduction
Phenolic compounds are abundant and structurally diverse plant metabolites defined by at least one hydroxylated aromatic ring; they include simple phenolic acids/alcohols through to tannins and proanthocyanidins [1]. In plants, they contribute to defense, structure, and reproduction, and in the human diet, they are supplied by fruits, vegetables, cereals, legumes, nuts, and beverages such as tea, cocoa, wine, and beer. Their levels in edible tissues vary with genotype, environment, organ, and processing, and their redox properties (hydrogen/electron donation, metal chelation) underpin antioxidant effects relevant to food quality and health [2,3,4,5,6].
Phenolics provide health benefits through redox actions—hydrogen/electron donation, stable-radical formation, and metal chelation—thereby neutralizing reactive oxygen species, inhibiting pro-oxidant enzymes, and supporting the body’s defenses [6]. Flavonoids slow LDL oxidation, which is involved in atherogenesis, as demonstrated in Mediterranean diet studies [7]. Beyond their antioxidant effects, phenolics influence cytokines, antibodies, and lymphocytes, showing anti-inflammatory and anticancer potential (including stopping tumor growth and spread) [8], and play neuroprotective roles by encouraging neuronal survival, plasticity, and memory, while reducing cell death [9]. They also affect food quality: tannins cause bitterness and astringency in tea and cocoa [10], catechins/proanthocyanidins shape red wine flavor [11], chlorogenic/caffeic/quinic acids contribute to coffee bitterness [12], and flavones give culinary herbs their distinctive notes [13]. From a technological perspective, anthocyanins (E163) serve as natural colorants (with pH-dependent hues), while phenolic extracts act as antioxidants and antiseptics, reducing lipid oxidation and microbial spoilage. Commercial uses include rosemary extracts (E392) as oil stabilizers, gallic acid esters (E310–E312) as antioxidants, and p-hydroxybenzoate esters (E214, E218) as preservatives [14].
Within this context, rowan (Sorbus aucuparia L.) is a resilient Rosaceae species whose small, orange-to-scarlet pomes have long been used in culinary applications after freezing or brief heating to temper astringency (jams, confections, fermented beverages, and liqueurs) [15,16,17]. Chemically, the fruits are rich in phenolics, with chlorogenic and neochlorogenic acids dominating, along with other hydroxycinnamates, flavonols, and procyanidins. Extracts show strong antioxidant activity in model foods [15,16,17,18,19]. Despite this potential, rowan remains underused compared with other berry-like fruits.
Existing reviews on Sorbus summarize its composition, activity, and common extraction approaches, and method-oriented studies report hydroalcoholic reflux and ultrasound-assisted protocols, with DES/NADES emerging as a means to reduce volatile organic solvent use [15,16,17,20,21,22,23]. However, side-by-side evaluations that jointly compare drying pretreatments (convective vs. freeze-drying) and multiple extraction workflows within a single solvent system and a unified analytics framework remain limited for S. aucuparia, constraining method selection for research and processing.
Herein, the current study intends to address this gap. This study aimed to compare various pre-treatment methods for rowan fruits and assess different extraction techniques to determine their impact on the recovery of phenolic compounds. The hypothesis proposed that the amount of phenolics recovered depends on the drying method used for the raw material and the specific extraction process and conditions. To verify this, fruits were pre-treated with convective drying or freeze-drying, followed by extraction using homogenizer-assisted, Soxhlet, or ultrasound-assisted methods. The resultant extracts were analyzed spectrophotometrically to quantify total phenolic and flavonoid contents and to evaluate antioxidant activity against DPPH radicals, enabling a comparison of the effectiveness across the different methods.
2. Materials and Methods
2.1. Materials
Ripe fruits of European rowan (S. aucuparia L.) were collected by hand in September 2022 in Nużewo (Masovian Voivodeship, Poland, 52°50′20.4″ N 20°35′52.8″ E). The trees were located at the forest edge opposite cultivated fields. A total of 1.0 kg of fruit was collected, destemmed, and taken to the lab for analysis (Figure 1). The fruits were washed with water and dried. Their initial moisture content was measured at 120 °C using a moisture analyzer (MAC 50/NH, RADWAG, Radom, Poland), yielding a value of 72.83%. All other substances and chemicals were sourced from Sigma-Aldrich (Poznań, Poland).
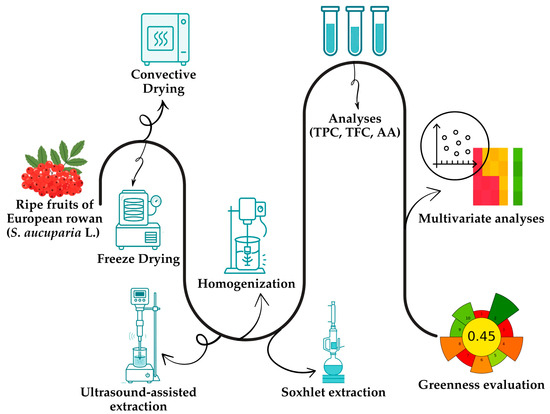
Figure 1.
Schematic workflow of the presented study.
2.2. Pre-Processing: Convective Drying and Freeze-Drying
2.2.1. Convective Drying
Fruits were spread in a single, non-overlapping layer on perforated stainless-steel trays. Drying was performed in a laboratory convection dryer (KBC-65 G, WAMED, Warsaw, Poland) at a constant air temperature of 55 °C until a constant mass was reached. The final moisture content of the convectively dried material was 1.1%, measured with the same moisture analyzer described in Section 2.1. The drying process lasted approximately 48 h. Immediately after drying, samples were cooled to room temperature in a desiccator, and then sealed and stored in desiccators.
2.2.2. Freeze-Drying
The remaining fruits were initially frozen at −40 °C for 24 h using a freezer (Irinox 51.20, Irinox, Corbanese, Italy) and then dried by lyophilization for 48 h in a freeze dryer (Gamma 1-16, Martin Christ Gefriertrocknungsanlagen GmbH, Osterode am Harz, Germany) at a chamber pressure of 63 Pa and a product shelf temperature of 25 °C. The moisture content after drying, measured with the moisture analyzer mentioned earlier, was 6.59%.
Once dried, all materials were ground using an electric grinder (120–160 W; Esperanza, Ożarów Mazowiecki, Poland) and then employed in extraction experiments.
2.3. Homogenization in Ethanol
To enable comparison among extraction methods, intensive vortex mixing of fruit suspensions in ethanol was chosen as the control approach, with suspensions vigorously vortex-mixed for 2 min. Unless specified otherwise, all extractions used 96% (v/v) ethanol and maintained a consistent solid-to-solvent ratio of 1:15 (w/v), meaning 1.0 g of milled fruit was suspended in 15 mL of ethanol.
Rotor–stator homogenization was performed by homogenizing suspensions with a mechanical rotor–stator homogenizer (T25 digital ULTRA-TURRAX, IKA, Warsaw, Poland) at 5000 or 10,000 rpm for 1, 2, or 5 min.
After treatment, all samples were centrifuged at 8000 rpm for 10 min (MPW-352, MPW Med. Instruments, Warsaw, Poland). Supernatants were decanted and used for subsequent analyses. All extraction conditions (Section 2.3, Section 2.4 and Section 2.5) were performed as three separate extractions (n = 3) for each dried material. After centrifugation, supernatants from each independent extract were analyzed separately.
2.4. Ultrasound-Assisted Extraction (UAE)
For both convectively dried and freeze-dried materials, four UAE variants were tested at a fixed duty cycle of 80%, with amplitudes of 20% and 80% and sonication times of 2 or 5 min. For each variant, 1.0 g of milled fruit was mixed with 15 mL of 96% ethanol. Sonication was performed using an ultrasonic homogenizer (UP400S, 400 W, 24 kHz; Hielscher Ultrasonics, Teltow, Germany) equipped with a 22 mm titanium sonotrode. Samples were processed in beakers placed in an ice–water bath to limit temperature rise.
2.5. Continuous Extraction in a Soxhlet Apparatus
Ground fruit (10.0 g) was placed into a cellulose extraction thimble, and 150 mL of 96% ethanol was added to a round-bottom flask. Soxhlet extractions were performed for both pre-processing methods (convective drying and freeze-drying). Four operational durations were used based on the number of siphon cycles: 4, 8, 12, or 16.
2.6. Total Phenolic Content (TPC)
All spectrophotometric measurements were conducted using a UV–Vis spectrophotometer (Rayleigh UV1601, Beijing Beifen-Ruili Analytical Instrument (Group) Co., Ltd., Beijing, China) with the 1 cm quartz cuvettes.
TPC was determined using the Folin–Ciocalteu method to assess the reducing capacity of phenolic compounds [20]. A calibration curve was prepared with chlorogenic acid (ethanolic stock solution 1 mg/mL; working range 0.005–1.000 mg/mL). For the assay, 0.18 mL of extract was mixed with 4.92 mL of distilled water and 0.30 mL of Folin–Ciocalteu reagent. After 3 min, 0.60 mL of 17.7% (w/v) Na2CO3 was added. The mixture was vortexed and incubated in the dark for 60 min. Absorbance was measured at 750 nm against ethanol as the reference. Results (reported as mean ± SD across n = 3 independent extracts per condition) were calculated from the calibration curve and expressed as mg chlorogenic acid equivalents per gram of dry weight (mg CGA/g DW).
2.7. Total Flavonoid Content (TFC)
TFC was determined through complex formation with aluminum chloride, as described by Aryal et al. [24]. A quercetin calibration curve was prepared from a 0.1 mg/mL ethanolic stock solution (solvent blank: ethanol). For each measurement, 1.00 mL of ethanolic extract was combined with 0.20 mL of 0.3 mM aqueous AlCl3, 0.20 mL of 1 M sodium acetate, and 5.60 mL of distilled water. After mixing, the samples were kept in the dark for 30 min. Absorbance was measured at 430 nm with ethanol as the reference. Results (mean ± SD across n = 3 independent extracts) were expressed as mg quercetin equivalents per gram of dry weight (mg QE/g DW).
2.8. Antioxidant Activity
Radical-scavenging activity was assessed using the DPPH• method [25]. A Trolox calibration curve served as the reference standard. Reaction mixtures contained 0.30 mL of appropriately diluted ethanolic extract and 2.70 mL of 0.004% (w/v) methanolic DPPH• solution. After incubation for 30 min in the dark, absorbance was measured at 517 nm (reference: ethanol). Results were calculated based on the Trolox calibration and expressed as μmol Trolox equivalents per gram of dry weight (μmol TE/g DW) and reported as means ± SD across n = 3 independent extracts.
2.9. Greenness Assessment
The greenness of the three extraction workflows was assessed with AGREEprep [26].
2.10. Statistical Analysis
Data were analyzed using Statistica 13.3 (TIBCO Software Inc., Palo Alto, CA, USA). All responses are reported as mean ± SD from n = 3 independent extractions per treatment. Prior to inference, the normality of residuals was assessed with the Shapiro–Wilk test and the homogeneity of variances with Levene’s test. When assumptions were satisfied, one-way ANOVA was performed, followed by Tukey’s HSD (α = 0.05). Furthermore, multivariate analyses were used to explore relationships between variables and to characterize the rowanberry extracts. These included Principal Component Analysis (PCA) and Hierarchical Cluster Analysis (HCA) on standardized data using Ward’s method with Euclidean distance, along with correlation analysis shown as a heatmap of Pearson correlation coefficients.
3. Results and Discussion
In studies focused on identifying the most effective methods for extracting phenolic compounds from Rowan fruits, the total polyphenols, flavonoids, and antioxidant activity were measured. The freeze-dried (FD) controls consistently outperformed the convectively dried (CD) controls across all metrics (Figure 2, Figure 3 and Figure 4). Specifically, TPC increased by approximately 2.78× (14.83 vs. 5.33 mg CGA/g DW), TFC by about 1.29× (1.71 vs. 1.33 mg QE/g DW), and antioxidant activity (AA) by roughly 3.26× (33.94 vs. 10.41 μmol TE/g DW). These results indicate that the drying method used for the raw material significantly affects extraction efficiency (α = 0.05).
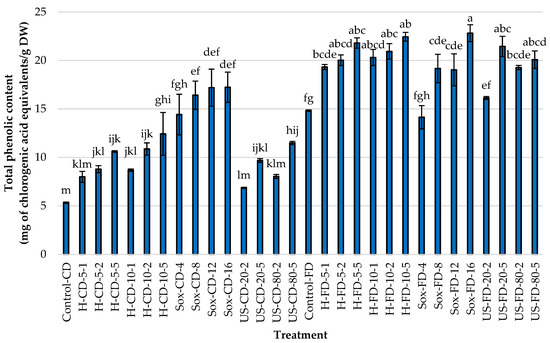
Figure 2.
Total phenolic content (TPC; mg of chlorogenic acid equivalents per g dry weight) in rowanberry (S. aucuparia L.) fruit extracts obtained by mechanical homogenization in ethanol (H), ultrasonic homogenization (US), or continuous Soxhlet extraction (Sox). Raw materials: convectively dried (CD) and freeze-dried (FD). Control samples were vigorously mixed in ethanol using a vortex for 2 min (Control-CD, Control-FD). Homogenization settings: 5 and 10 = 5000 and 10,000 rpm; 1, 2, 5 = minutes. Ultrasonic settings: 20 and 80 = 20% and 80% amplitude; 2 and 5 = minutes. Soxhlet settings: 4, 8, 12, 16 = number of solvent cycles. Bars show mean ± SD. Different lowercase letters (a–m) denote significant differences among treatments (Tukey’s HSD, α = 0.05).
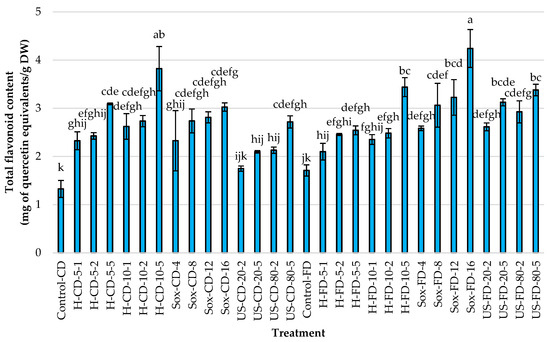
Figure 3.
Total flavonoid content (TFC; mg of quercetin equivalents per g dry weight) in rowanberry (S. aucuparia L.) fruit extracts obtained by mechanical homogenization in ethanol (H), ultrasonic homogenization (US), or continuous Soxhlet extraction (Sox). Raw materials: convectively dried (CD) and freeze-dried (FD). Control samples were vigorously mixed in ethanol using a vortex for 2 min (Control-CD, Control-FD). Homogenization settings: 5 and 10 = 5000 and 10,000 rpm; 1, 2, 5 = minutes. Ultrasonic settings: 20 and 80 = 20% and 80% amplitude; 2 and 5 = minutes. Soxhlet settings: 4, 8, 12, 16 = number of solvent cycles. Bars show mean ± SD. Different lowercase letters (a–k) denote significant differences among treatments (Tukey’s HSD, α = 0.05).
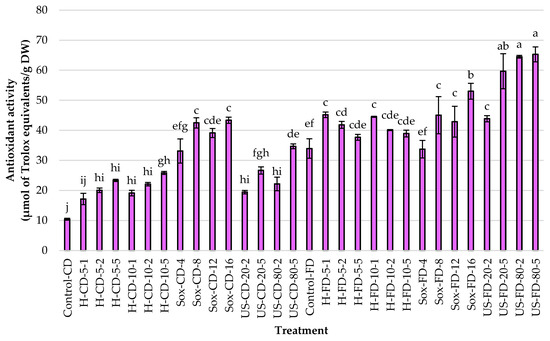
Figure 4.
Antioxidant activity (DPPH assay; μmol of Trolox equivalents per g dry weight) in rowanberry (S. aucuparia L.) fruit extracts obtained by mechanical homogenization in ethanol (H), ultrasonic homogenization (US), or continuous Soxhlet extraction (Sox). Raw materials: convectively dried (CD) and freeze-dried (FD). Control samples were vigorously mixed in ethanol using a vortex for 2 min (Control-CD, Control-FD). Homogenization settings: 5 and 10 = 5000 and 10,000 rpm; 1, 2, 5 = minutes. Ultrasonic settings: 20 and 80 = 20% and 80% amplitude; 2 and 5 = minutes. Soxhlet settings: 4, 8, 12, 16 = number of solvent cycles. Bars show mean ± SD. Different lowercase letters (a–j) denote significant differences among treatments (Tukey’s HSD, α = 0.05).
Using convectively dried (CD) fruit, Soxhlet extraction yielded the highest average results across all responses, surpassing those of mechanical homogenization and ultrasonication. The peak values appeared in the Soxhlet-extracted samples after 12 and 16 cycles of solvent transfer through the material, with approximately 17.2 mg CGA/g DW and 39–43 µmol TE/g DW. When freeze-dried fruits were used, the US exhibited the highest average AA (>58 μmol TE/g DW), with an amplitude of 20% and a duration of 5 min or 80% amplitude regardless of time. Interestingly, using Soxhlet extraction for 16 cycles yielded the highest TPC and TFC levels, at 22.82 mg/g and 4.24 mg/g, respectively. Across methods, increasing process intensity generally boosted responses, except when extending homogenization time for FD material, which did not further increase AA. As shown in Figure 2, Figure 3 and Figure 4, changing the tested material from CD to FD improved the average results for H and US, with slightly smaller gains for Soxhlet, a high-temperature process.
Regarding the homogenization process, increasing either speed or time led to consistent increases across all metrics, with at least a 1.5× increase observed in TPC, TFC, and AA. For FD, enhancements in TPC and TFC occurred with increased mixing intensity and duration, but extending the processing time did not further boost the antioxidant activity of the extracts, suggesting diminishing returns for radical scavenging despite higher phenolic levels. Furthermore, increasing the evaluated variables during ultrasonication (i.e., 20% vs. 80% amplitude; 2 vs. 5 min) and Soxhlet extraction (4–16 cycles) led to higher responses across all responses, regardless of the pretreatment of the Rowan fruits.
Kobus et al. [21] investigated how specific parameters affect the ultrasound extraction of phenolic compounds and their antioxidant activity in Sorbus intermedia. They used both continuous and pulsed extraction modes at three ultrasound amplitudes—12, 24, and 36 μm—and for durations of 15, 30, and 45 min. Flavonoid content ranged from 0.132 mg QE/g DW during 5 min pulsed extraction at 12 μm to 0.502 mg QE/g DW during 15 min continuous extraction at 36 μm. The highest antioxidant activity was observed with pulsed extraction at 24 μm for 15 min: 75.000 μmol TE/g DW, while the lowest was with continuous extraction at 12 μm for 5 min: 32.768 μmol TE/g DW. Increasing the duty cycle of the ultrasonic processor significantly impacted the yield of phenolic compounds and antioxidant activity, with higher amplitudes and longer processing times both enhancing extraction efficiency.
In another study, Turumtay et al. [22] measured the total phenolic content and DPPH free-radical scavenging activity in solutions extracted from S. aucuparia fruits using an ultrasonic bath. They used the Folin–Ciocalteu method to determine total phenolics, finding 22.84 ± 1.81 mg of chlorogenic acid per gram of dried extract for phenolic compounds, and 12.34 ± 1.01 mg of quercetin per gram for flavonoids, while the concentration needed to achieve 50% DPPH radical scavenging was 0.37 ± 0.01 mg/mL.
Olszewska and Michel [23] also investigated the antioxidant activity and phenolic compound composition of extracts, including those from S. aucuparia fruits. They prepared the extracts by refluxing the material in 70% methanol at its boiling point. The antioxidant capacity, assessed using the DPPH method, was 105.5 μmol TE per gram of dry weight. The TPC, determined by the Folin–Ciocalteu method, showed fruits containing 2.68 ± 0.08 mg gallic acid equivalents per gram of dry weight. They also measured flavonoid content and chlorogenic acid isomers. HPLC-UV analysis identified 51 ± 0.6 mg of quercetin and 0.64 mg of chlorogenic acid per 100 g of dry material.
Box-and-whisker summaries (Figure 5a–c) clearly illustrate the impact of raw material drying and extraction method on total phenolics, total flavonoids, and antioxidant activity. Median responses ranked Sox-CD > H-CD > US-CD for TPC (16.81, 9.70, 8.86 mg CGA/g DW) and Sox-CD ≥ H-CD > US-CD for TFC (2.77, 2.68, 2.11 mg QE/g DW). For AA, the order was Sox-CD > US-CD > H-CD (40.81, 24.40, and 21.07 μmol TE/g DW, respectively). Variability differed by method: IQRs were largest for US-CD, intermediate for Sox-CD, and smallest for H-CD, consistent with ultrasonication being more sensitive to parameter settings. In the case of FD material, for TPC, the medians followed the order H-FD ≥ US-FD ≥ Sox-FD (20.62, 19.68, 19.10 mg CGA/g DW), although Sox-FD reached the global maximum (22.82 mg CGA/g DW). TFC was highest for Sox-FD (3.14 mg QE/g DW), followed by US-FD (3.03) and H-FD (2.47). AA was dominated by US-FD (62.09 μmol TE/g DW), exceeding Sox-FD (43.96) and H-FD (40.96). FD treatments showed broader dispersion than controls—most notably US-FD—reflecting the impact of sonication amplitude/time.
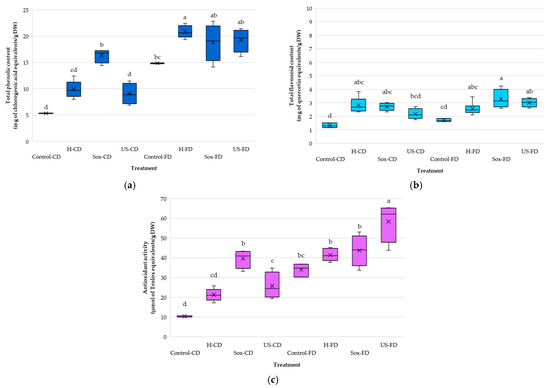
Figure 5.
Box-and-whisker summaries for rowanberry (S. aucuparia L.) extracts prepared from convectively dried (CD) or freeze-dried (FD) fruit by mechanical homogenization in ethanol (H), ultrasonication (US), or Soxhlet extraction (Sox): (a) Total phenolic content (TPC), (b) Total flavonoid content (TFC), and (c) Antioxidant activity by DPPH assay. Controls were vortex-mixed in ethanol for 2 min (Control-CD, Control-FD). Boxes = interquartile range (IQR), center line = median, whiskers = min–max, “×” = mean. Different lowercase letters (a–d) above boxes indicate significant differences among treatments within each panel (Tukey’s HSD, α = 0.05).
Relationships among TPC, TFC, and antioxidant activity were roughly linear (Figure 6). For all extracts, AA correlated strongly with TPC (Figure 6a; R = 0.860; R2 = 0.740). Conversely, AA had only a moderate relationship with TFC (Figure 6b; R = 0.511; R2 = 0.261), and TFC and TPC were moderately correlated (Figure 6c; R = 0.525; R2 = 0.276). The heatmap of Pearson coefficients (Figure 6d) summarizes these patterns, emphasizing the TPC–AA link as the strongest among the three metrics. The visual review of the scatter plots (Figure 6a–c) aligns with the univariate results: CD controls are located in the lower-left quadrant, while Soxhlet-treated samples shift toward higher TPC, TFC, and AA. In contrast, FD-US extracts are positioned in the upper-right quadrant, exhibiting the highest AA values. Interestingly, some FD-US points are above the overall AA–TPC regression line, indicating sonication of freeze-dried material can boost radical-scavenging capacity more than phenolic content alone. Overall, these findings suggest phenolics mainly drive AA in rowanberry extracts, with flavonoids playing a secondary role.
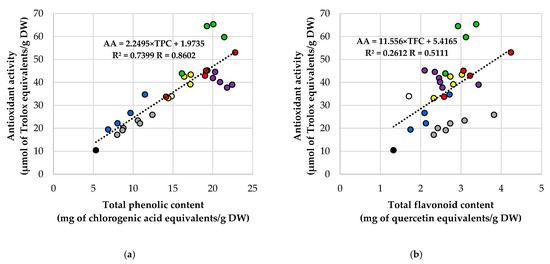
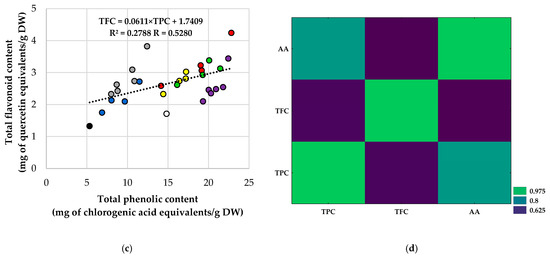
Figure 6.
Correlations among total phenolic content (TPC), total flavonoid content (TFC), and antioxidant activity (AA; DPPH assay) for rowanberry (S. aucuparia L.) extracts, i.e., (a) AA vs. TPC, (b) AA vs. TFC, (c) TFC vs. TPC, and (d) Heatmap of Pearson correlation coefficients (R) for TPC, TFC, and AA. Each point represents one extract, while the dashed line is the least-squares linear fit. Reported in-panel are the Pearson correlation coefficient (R) and the coefficient of determination (R2). Color coding for panels (a–c): black—Control-CD; white—Control-FD; grey—H-CD; purple—H-FD; dark blue—US-CD; green—US-FD; yellow—Sox-CD; red—Sox-FD. Abbreviations: CD—convectively dried; FD—freeze-dried; H—mechanical homogenization; US—ultrasonic homogenization; Sox—Soxhlet extraction.
Ward’s hierarchical clustering based on Euclidean distances of TPC, TFC, and AA divided the extracts into two main groups (Figure 7). The first group, the low-response cluster, included Control-CD, most US-CD samples (US-CD-20-2/-20-5/-80-2), the FD control, Sox-CD-4, and most H-CD conditions (H-CD-5-1/-5-2/-10-1/-10-2/-5-5). These samples generally exhibited lower TPC, TFC, and AA values. The second group consisted of the FD extracts and the more intense Soxhlet CD runs, which showed higher phenolic content and antioxidant activity. Within this group, distinct subclusters were observed, including the US-FD subcluster, which comprised US-FD-20-5, US-FD-80-2, and US-FD-80-5, all of which consistently exhibited high AA. Additionally, the “Sox” subcluster was grouped, indicating maximal TPC/TFC. The H-FD subcluster (H-FD-5-1/-5-2/-10-1/-10-2/-5-5/-10-5) formed a cohesive subgroup at intermediate linkage distances, characterized by elevated TPC and moderate AA.
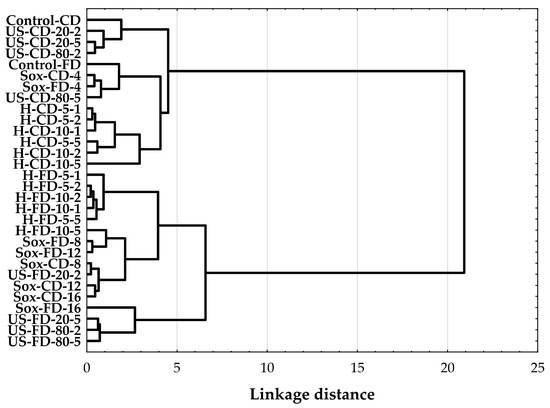
Figure 7.
Hierarchical cluster analysis (HCA) dendrogram of the compared rowanberry (S. aucuparia L.) extracts, constructed with Ward’s linkage and Euclidean distances from TPC, TFC, and DPPH antioxidant activity values. Labels denote process and material: H—mechanical homogenization; US—ultrasonic homogenization; Sox—Soxhlet; CD—convectively dried; FD—freeze-dried. Control samples were vigorously mixed in ethanol using a vortex for 2 min (Control-CD, Control-FD). Homogenization settings: 5 and 10 = 5000 and 10,000 rpm; 1, 2, 5 = minutes. Ultrasonic settings: 20 and 80 = 20% and 80% amplitude; 2 and 5 = minutes. Soxhlet settings: 4, 8, 12, 16 = number of solvent cycles.
A PCA of the correlation matrix for TPC, TFC, and AA accounted for 95.35% of the variance across the first two axes (PC1 = 76.05%, PC2 = 19.30%; Figure 8). Variable loadings showed that PC1 captures a general phenolic/antioxidant axis (TPC = −0.930; AA = −0.924; TFC = −0.751), while PC2 contrasts TFC (−0.660) with TPC (+0.255) and AA (+0.280) (Figure 8b). Scores along PC1 (Figure 8a) primarily separated samples by drying method and extraction intensity. The lowest-performing samples clustered at positive PC1—Control-CD (+3.37) and low-to-moderate CD extractions (e.g., US-CD-20-2 +2.46; H-CD +0.77 to +1.96). High-yield extracts were found at negative PC1: Sox-FD-16 (−2.88), US-FD-80-5 (−2.40), US-FD-20-5 (−2.11), US-FD-80-2 (−1.91), and H-FD-10-5 (−1.57). Therefore, freeze-drying combined with Soxhlet or ultrasonication produced the strongest shift toward phenolic/antioxidant characteristics. Scores along PC2 indicated a method-dependent trade-off within the high-TPC/AA region (negative PC1). Soxhlet-FD samples tended to have negative PC2 values (e.g., Sox-FD-16 −1.29; Sox-FD-12 −0.37), consistent with flavonoid-rich profiles. In contrast, many FD-US extracts had positive PC2 values (e.g., US-FD-80-2 +0.64; US-FD-20-5 +0.37), showing higher AA/TPC relative to TFC. CD treatments followed this pattern at lower intensities: H-CD-10-5 (−2.08) ranked lower on PC2 (more flavonoid-oriented) than other H-CD trials, while US-CD samples were closer to the PC2 midpoint.
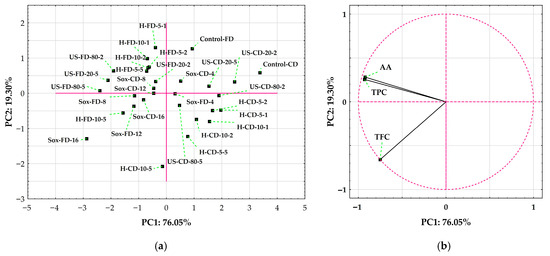
Figure 8.
Principal component analysis (PCA) of rowanberry (S. aucuparia L.) extracts based on total phenolic content (TPC), total flavonoid content (TFC), and DPPH antioxidant activity (AA). Sample codes: H—mechanical homogenization; US—ultrasonic homogenization; Sox—Soxhlet; CD—convectively dried; FD—freeze-dried. Controls were vortex-mixed for 2 min (Control-CD, Control-FD). (a) Scores plot (PC1 = 76.05%; PC2 = 19.30%) showing the distribution of individual extracts. (b) Loading circle for PC1 vs. PC2.
Freeze-drying preserves extractable phenolics and AA by suppressing polyphenol oxidase and peroxidase under low temperature/water activity and by creating a porous, fragile microstructure that enhances solvent ingress and diffusion during extraction [27,28]. Conversely, warm-air drying (~55 °C) allows a window for oxidation before complete enzyme inactivation and can promote oxidative and binding reactions that lower extractability [27]. UAE improves recovery via acoustic cavitation (cell-wall disruption, boundary-layer thinning, enhanced mass transfer) with limited thermal load over 2–5 min [29]. At the same time, Soxhlet achieves exhaustive extraction through prolonged hot-solvent cycling at ethanol reflux (~78 °C), increasing totals at the cost of higher energy/solvent inputs [30]. These mechanisms rationalize the FD-driven separation seen in PCA/HCA and the strong AA–TPC association.
FD generally maintains or increases TPC/TFC and antioxidant measures compared to hot-air drying. UAE reduces processing time and increases extraction efficiency compared with non-sonicated methods, though high power or extended exposure may lead to anthocyanin losses [31,32]. Traditional maceration with hydroethanol is a low-energy baseline but less effective than optimized green techniques in extracting total phenolics [33]. Comparative green methods such as PLE, MAE, and UAE demonstrate that adjusting parameters and using modest pre-milling or cryogrinding can achieve high phenolic content while retaining anthocyanins and maintaining vigorous antioxidant activity across multiple assays [34]. These similarities suggest that the FD-US approach described here can be applied to other phenolic-rich berries in ethanol-based extraction workflows.
The greenness of the three extraction workflows, measured with AGREEprep, showed moderate performance for mechanical homogenization and ultrasonication, with lower scores for Soxhlet (Figure 9). Mechanical homogenization in ethanol (H) and ultrasonic homogenization (US) each received a score of 0.45, while Soxhlet extraction (Sox) scored 0.35. The identical scores for H and US highlight shared benefits, including the use of a relatively safe, single solvent (ethanol), short processing times (1–5 min), operation at ambient temperature, and low solvent use—all of which positively affect several AGREEprep criteria. Ultrasonication requires some energy and may expose operators to noise, however, these drawbacks are offset by its brief duty cycle and minimal solvent use. In contrast, Soxhlet is penalized mainly for longer extraction durations and continuous heating under reflux, which increase energy consumption and solvent waste, lowering its overall score. Despite Soxhlet’s high TPC/TFC values, its environmental impact is comparatively less favorable. The AGREEprep analysis indicates that, among the options studied, H and US provide the better environmental profile. When considering both analytical performance and greenness, US stands out as a good compromise for freeze-dried samples, achieving the highest antioxidant activity with a moderate AGREEprep score. For situations where Soxhlet’s compositional benefits are needed, greener alternatives such as fewer cycle runs, smaller Soxhlet setups, improved solvent recycling, or green solvent mixtures can be employed to reduce environmental impact.
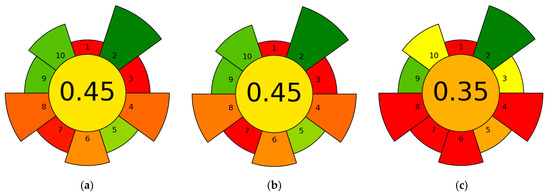
Figure 9.
AGREEprep assessment of the greenness of the three extraction workflows for rowanberry (S. aucuparia L.) fruits: (a) mechanical homogenization in ethanol (H), (b) ultrasonic homogenization (US), and (c) Soxhlet extraction (Sox).
An alternative, eco-friendly method for extracting polyphenol compounds involves using choline chloride-based natural deep eutectic solvents (NADES) and comparing their performance with that of traditional solvents. In studies with rowanberries, Makarova et al. [20] observed that 80% ethanol produced the highest total phenolic content (28.55 mg CGA/g DW). At the same time, NADES4 (choline chloride–urea, 1:2) was nearly as effective at 25.02 mg/g, and NADES2 (choline chloride–glycerol, 1:2) reached 24.51 mg/g. All of these exceeded water’s yield (16.14 mg/g) and that of other NADES variants. These findings suggest that NADESs—particularly NADES4—can extract rowanberry polyphenols almost as efficiently as ethanol, providing a more sustainable alternative to volatile organic solvents.
The study by Ioannou et al. [35] optimized UAE with a choline chloride–citric acid DES to extract aloe-rind polyphenols, then evaluated greenness with AGREEprep. On AGREEprep, the detailed method scored above 0.7 and was the greenest among literature comparators (0.11 for Soxhlet, 0.35 for stirring). The AGREEprep value was above the 0.6 “green” threshold, whereas in the current research the highest value of 0.45 was obtained, indicating the need for further modification of the protocols to improve the recovery of polyphenols from S. aucuparia fruits. Interestingly, high AGREEprep performance was driven by replacing hazardous organics with a DES, characterized by short UAE time/low energy use, lower solvent use/waste, and DES recyclability.
The AGREEprep software was also used by Marchetti et al. [36], and NADES–UAE achieved a greener sample-prep score of 0.74 compared to 0.44 for hydroethanolic extraction of bioactive compounds from industry by-product (STF231), highlighting advantages in solvent use, time, and energy. In the study by Rodríguez-Blázquez et al. [37], the Soxhlet method received a score of 0.33 in the AGREEprep assessment, primarily due to the use of n-hexane, lengthy extraction times, higher operational exposure, and difficulty in removing residues. The authors found that the UAE method was significantly more favorable for upcycling Prunus spinosa (sloe) seed residues into bioactive oils.
4. Conclusions
Freeze-drying was the key pre-treatment, consistently increasing total phenolics, flavonoids, and DPPH antioxidant activity compared to convective drying. Across extraction methods, higher process intensity generally improved responses, though extending homogenization time for freeze-dried material did not further boost antioxidant activity. On freeze-dried samples, ultrasound-assisted extraction produced the highest antioxidant activity (>58 μmol TE/g DW) across tested settings, while Soxhlet (12–16 cycles) maximized total phenolics and flavonoids (up to 22.82 mg CGA/g DW and 4.24 mg QE/g DW, respectively). Antioxidant activity was most strongly correlated with total phenolics (R = 0.860). Multivariate analysis mainly distinguished extracts by drying method and extraction intensity.
In terms of sustainability, homogenization and ultrasound each scored 0.45 on AGREEprep, higher than Soxhlet (0.35), highlighting the trade-off between yield and environmental impact. For antioxidant-focused extracts with a good ecological profile, combining freeze-drying with ultrasound-assisted extraction in ethanol (1:15 w/v; 20–80% amplitude; 2–5 min, ice-bath controlled) provides a promising balance of performance and sustainability at room temperature and short cycles, and it can be scaled up using probe or flow-through sonication. When maximizing phenolic and flavonoid yields is the primary goal, pairing freeze-drying with Soxhlet remains effective. However, solvent and energy use should be minimized through fewer cycles, smaller glassware, solvent recovery, or greener solvents. Routine rotor–stator homogenization offers fast, low-temperature extraction suitable for simplicity and high throughput.
This study used a single fruit source and season, focused on colorimetric markers (TPC, TFC, DPPH) rather than detailed phenolic profiling, and limited the parameters for each method. Ethanol (96% v/v) at 1:15 w/v was tested, without conducting life-cycle or cost analyses, and broader solvent systems and energy assessments were outside the scope. These limitations restrict the applicability to other matrices and scales.
Future research should include pilot-scale ultrasound with energy and throughput benchmarking, solvent recovery integration, AGREEprep-guided optimization toward ≥0.6 (e.g., shorter sonication, less solvent, greener solvents), exploration of DES/NADES and hydroethanolic gradients, targeted LC-MS phenolic profiling, expanded antioxidant and bioactivity tests (ABTS, FRAP, ORAC, cell-based assays), and comprehensive life-cycle and economic analyses to evaluate real-world sustainability benefits.
Supplementary Materials
The following supporting information can be downloaded at: https://www.mdpi.com/article/10.3390/separations12110305/s1, Table S1: Summary of top-performing conditions from this study and AGREEprep benchmarks from the literature. References [35,36] appear in the supplementary materials.
Author Contributions
Conceptualization, B.Z. and D.K.; methodology, B.Z.; software, B.Z.; formal analysis, B.Z.; investigation, B.Z.; resources, B.Z.; data curation, B.Z.; writing—original draft preparation, B.Z.; writing—review and editing, D.K.; visualization, B.Z.; supervision, D.K.; project administration, B.Z.; funding acquisition, D.K. All authors have read and agreed to the published version of the manuscript.
Funding
This research received no external funding.
Institutional Review Board Statement
Not applicable.
Informed Consent Statement
Not applicable.
Data Availability Statement
The original contributions presented in this study are included in the article/Supplementary Materials. Further inquiries can be directed to the corresponding author.
Conflicts of Interest
The authors declare no conflicts of interest.
Abbreviations
The following abbreviations are used in this manuscript:
| AA | Antioxidant activity |
| CD | Convective drying |
| CGA | Chlorogenic acid equivalents |
| DES | Deep eutectic solvent |
| DPPH | 2,2-diphenyl-1-picrylhydrazyl |
| DW | Dry weight |
| FD | Freeze-drying |
| H | Mechanical rotor–stator homogenization in ethanol |
| HCA | Hierarchical cluster analysis |
| HPLC–UV | High-performance liquid chromatography with ultraviolet detection |
| IQR | Interquartile range |
| LDL | Low-density lipoprotein |
| MAE | Microwave-assisted extraction |
| NADES | Natural deep eutectic solvent |
| PCA | Principal component analysis |
| PLE | Pressurized liquid extraction |
| QE | Quercetin equivalents |
| R | Pearson correlation coefficient |
| R2 | Coefficient of determination |
| SD | Standard deviation |
| Sox | Soxhlet extraction |
| TE | Trolox equivalents |
| TFC | Total flavonoid content |
| TPC | Total phenolic content |
| UAE | Ultrasound-assisted extraction |
| US | Ultrasonic homogenization |
References
- Zagoskina, N.V.; Zubova, M.Y.; Nechaeva, T.L.; Kazantseva, V.V.; Goncharuk, E.A.; Katanskaya, V.M.; Baranova, E.N.; Aksenova, M.A. Polyphenols in Plants: Structure, Biosynthesis, Abiotic Stress Regulation, and Practical Applications (Review). Int. J. Mol. Sci. 2023, 24, 3874. [Google Scholar] [CrossRef]
- Quideau, S.; Deffieux, D.; Douat-Casassus, C.; Pouységu, L. Plant Polyphenols: Chemical Properties, Biological Activities, and Synthesis. Angew. Chem. Int. Ed. Engl. 2011, 50, 586–621. [Google Scholar] [CrossRef]
- Micek, A.; Jurek, J.; Owczarek, M.; Guerrera, I.; Torrisi, S.A.; Castellano, S.; Grosso, G.; Alshatwi, A.A.; Godos, J. Polyphenol-Rich Beverages and Mental Health Outcomes. Antioxidants 2023, 12, 272. [Google Scholar] [CrossRef]
- Durand-Hulak, M.; Dugrand, A.; Duval, T.; Bidel, L.P.R.; Jay-Allemand, C.; Froelicher, Y.; Bourgaud, F.; Fanciullino, A.-L. Mapping the Genetic and Tissular Diversity of 64 Phenolic Compounds in Citrus Species Using a UPLC-MS Approach. Ann. Bot. 2015, 115, 861–877. [Google Scholar] [CrossRef]
- Gorzynik-Debicka, M.; Przychodzen, P.; Cappello, F.; Kuban-Jankowska, A.; Marino Gammazza, A.; Knap, N.; Wozniak, M.; Gorska-Ponikowska, M. Potential Health Benefits of Olive Oil and Plant Polyphenols. Int. J. Mol. Sci. 2018, 19, 686. [Google Scholar] [CrossRef]
- Jomová, K.; Hudecova, L.; Lauro, P.; Simunkova, M.; Alwasel, S.H.; Alhazza, I.M.; Valko, M. A Switch between Antioxidant and Prooxidant Properties of the Phenolic Compounds Myricetin, Morin, 3’,4’-Dihydroxyflavone, Taxifolin and 4-Hydroxy-Coumarin in the Presence of Copper(II) Ions: A Spectroscopic, Absorption Titration and DNA Damage Study. Molecules 2019, 24, 4335. [Google Scholar] [CrossRef]
- Li, Y.; Xu, Y.; Ma, X.; Le Sayec, M.; Wu, H.; Dazzan, P.; Nosarti, C.; Heiss, C.; Gibson, R.; Rodriguez-Mateos, A. (Poly)Phenol Intake, Plant-Rich Dietary Patterns and Cardiometabolic Health: A Cross-Sectional Study. Food Funct. 2023, 14, 4078–4091. [Google Scholar] [CrossRef]
- Kopustinskiene, D.M.; Jakstas, V.; Savickas, A.; Bernatoniene, J. Flavonoids as Anticancer Agents. Nutrients 2020, 12, 457. [Google Scholar] [CrossRef]
- Uddin, M.S.; Al Mamun, A.; Kabir, M.T.; Ahmad, J.; Jeandet, P.; Sarwar, M.S.; Ashraf, G.M.; Aleya, L. Neuroprotective Role of Polyphenols against Oxidative Stress-Mediated Neurodegeneration. Eur. J. Pharmacol. 2020, 886, 173412. [Google Scholar] [CrossRef]
- Serra Bonvehi, J.; Ventura Coll, F. Evaluation of Bitterness and Astringency of Polyphenolic Compounds in Cocoa Powder. Food Chem. 1997, 60, 365–370. [Google Scholar] [CrossRef]
- Gonzalo-Diago, A.; Dizy, M.; Fernández-Zurbano, P. Taste and Mouthfeel Properties of Red Wines Proanthocyanidins and Their Relation to the Chemical Composition. J. Agric. Food Chem. 2013, 61, 8861–8870. [Google Scholar] [CrossRef] [PubMed]
- Lin, H.; Tello, E.; Simons, C.T.; Peterson, D.G. Identification of Non-Volatile Compounds Generated during Storage That Impact Flavor Stability of Ready-to-Drink Coffee. Molecules 2022, 27, 2120. [Google Scholar] [CrossRef] [PubMed]
- Picos-Salas, M.A.; Heredia, J.B.; Leyva-López, N.; Ambriz-Pérez, D.L.; Gutiérrez-Grijalva, E.P. Extraction Processes Affect the Composition and Bioavailability of Flavones from Lamiaceae Plants: A Comprehensive Review. Processes 2021, 9, 1675. [Google Scholar] [CrossRef]
- Regulation (EC) No 1333/2008 of the European Parliament and of the Council of 16 December 2008 on Food Additives. Available online: https://eur-lex.europa.eu/legal-content/EN/TXT/HTML/?uri=CELEX:32008R1333&from=EN (accessed on 8 October 2025).
- Sołtys, A.; Galanty, A.; Podolak, I. Ethnopharmacologically Important but Underestimated Genus Sorbus: A Comprehensive Review. Phytochem. Rev. 2020, 19, 491–526. [Google Scholar] [CrossRef]
- Sarv, V.; Venskutonis, P.R.; Bhat, R. The Sorbus spp.-Underutilised Plants for Foods and Nutraceuticals: Review on Polyphenolic Phytochemicals and Antioxidant Potential. Antioxidants 2020, 9, 813. [Google Scholar] [CrossRef]
- Šavikin, K.P.; Zdunić, G.M.; Krstić-Milošević, D.B.; Šircelj, H.J.; Stešević, D.D.; Pljevljakušić, D.S. Sorbus aucuparia and Sorbus aria as a Source of Antioxidant Phenolics, Tocopherols, and Pigments. Chem. Biodivers. 2017, 14, e1700329. [Google Scholar] [CrossRef]
- Klensporf-Pawlik, D.; Przybylski, R. Antioxidant Activity of Selected Wild Canadian Prairie Fruits. Acta Sci. Pol. Technol. Aliment. 2015, 14, 357–366. [Google Scholar] [CrossRef]
- Aladedunye, F.; Matthäus, B. Phenolic Extracts from Sorbus aucuparia (L.) and Malus baccata (L.) Berries: Antioxidant Activity and Performance in Rapeseed Oil during Frying and Storage. Food Chem. 2014, 159, 273–281. [Google Scholar] [CrossRef]
- Makarova, A.; Özten, C.; Zieniuk, B. Utilizing Natural Deep Eutectic Solvents (NADESs) for Sustainable Phytonutrient Recovery: Optimization and Multi-Matrix Extraction of Bioactive Compounds. Appl. Sci. 2025, 15, 4843. [Google Scholar] [CrossRef]
- Kobus, Z.; Krzywicka, M.; Starek-Wójcicka, A.; Sagan, A. Effect of the Duty Cycle of the Ultrasonic Processor on the Efficiency of Extraction of Phenolic Compounds from Sorbus intermedia. Sci. Rep. 2022, 12, 8311. [Google Scholar] [CrossRef]
- Turumtay, H.; Midilli, A.; Turumtay, E.A.; Demir, A.; Selvi, E.K.; Budak, E.E.; Er, H.; Kocaimamoglu, F.; Baykal, H.; Belduz, A.O.; et al. Gram (-) Microorganisms DNA Polymerase Inhibition, Antibacterial and Chemical Properties of Fruit and Leaf Extracts of Sorbus aucuparia and Sorbus caucasica Var. Yaltirikii. Biomed. Chromatogr. 2017, 31, e3901. [Google Scholar] [CrossRef]
- Olszewska, M.A.; Michel, P. Antioxidant Activity of Inflorescences, Leaves and Fruits of Three Sorbus Species in Relation to Their Polyphenolic Composition. Nat. Prod. Res. 2009, 23, 1507–1521. [Google Scholar] [CrossRef] [PubMed]
- Aryal, S.; Baniya, M.K.; Danekhu, K.; Kunwar, P.; Gurung, R.; Koirala, N. Total Phenolic Content, Flavonoid Content and Antioxidant Potential of Wild Vegetables from Western Nepal. Plants 2019, 8, 96. [Google Scholar] [CrossRef]
- Zieniuk, B.; Groborz, K.; Wołoszynowska, M.; Ratusz, K.; Białecka-Florjańczyk, E.; Fabiszewska, A. Enzymatic Synthesis of Lipophilic Esters of Phenolic Compounds, Evaluation of Their Antioxidant Activity and Effect on the Oxidative Stability of Selected Oils. Biomolecules 2021, 11, 314. [Google Scholar] [CrossRef]
- Wojnowski, W.; Tobiszewski, M.; Pena-Pereira, F.; Psillakis, E. AGREEprep—Analytical Greenness Metric for Sample Preparation. Trends Analyt. Chem. 2022, 149, 116553. [Google Scholar] [CrossRef]
- Valadez-Carmona, L.; Plazola-Jacinto, C.P.; Hernández-Ortega, M.; Hernández-Navarro, M.D.; Villarreal, F.; Necoechea-Mondragón, H.; Ortiz-Moreno, A.; Ceballos-Reyes, G. Effects of Microwaves, Hot Air and Freeze-Drying on the Phenolic Compounds, Antioxidant Capacity, Enzyme Activity and Microstructure of Cacao Pod Husks (Theobroma cacao L.). Innov. Food Sci. Emerg. Technol. 2017, 41, 378–386. [Google Scholar] [CrossRef]
- Nowak, D.; Jakubczyk, E. The Freeze-Drying of Foods-the Characteristic of the Process Course and the Effect of Its Parameters on the Physical Properties of Food Materials. Foods 2020, 9, 1488. [Google Scholar] [CrossRef]
- Chemat, F.; Rombaut, N.; Sicaire, A.-G.; Meullemiestre, A.; Fabiano-Tixier, A.-S.; Abert-Vian, M. Ultrasound Assisted Extraction of Food and Natural Products. Mechanisms, Techniques, Combinations, Protocols and Applications. A Review. Ultrason. Sonochem. 2017, 34, 540–560. [Google Scholar] [CrossRef]
- Luque de Castro, M.D.; Priego-Capote, F. Soxhlet Extraction: Past and Present Panacea. J. Chromatogr. A 2010, 1217, 2383–2389. [Google Scholar] [CrossRef]
- Bai, X.; Zhou, L.; Zhou, L.; Cang, S.; Liu, Y.; Liu, R.; Liu, J.; Feng, X.; Fan, R. The Research Progress of Extraction, Purification and Analysis Methods of Phenolic Compounds from Blueberry: A Comprehensive Review. Molecules 2023, 28, 3610. [Google Scholar] [CrossRef]
- Varo, M.A.; Jacotet-Navarro, M.; Serratosa, M.P.; Mérida, J.; Fabiano-Tixier, A.-S.; Bily, A.; Chemat, F. Green Ultrasound-Assisted Extraction of Antioxidant Phenolic Compounds Determined by High Performance Liquid Chromatography from Bilberry (Vaccinium myrtillus L.) Juice by-Products. Waste Biomass Valorization 2019, 10, 1945–1955. [Google Scholar] [CrossRef]
- Ćujić, N.; Šavikin, K.; Janković, T.; Pljevljakušić, D.; Zdunić, G.; Ibrić, S. Optimization of Polyphenols Extraction from Dried Chokeberry Using Maceration as Traditional Technique. Food Chem. 2016, 194, 135–142. [Google Scholar] [CrossRef]
- Repajić, M.; Zorić, M.; Magnabosca, I.; Pedisić, S.; Dragović-Uzelac, V.; Elez Garofulić, I. Bioactive Power of Black Chokeberry Pomace as Affected by Advanced Extraction Techniques and Cryogrinding. Molecules 2025, 30, 3383. [Google Scholar] [CrossRef]
- Ioannou, G.D.; Ioannou, K.A.; Christou, A.; Stavrou, I.J.; Kapnissi-Christodoulou, C.P. The Utilization of an Aloe Vera Rind By-Product: Deep Eutectic Solvents as Eco-Friendly and Recyclable Extraction Media of Polyphenolic Compounds. Antioxidants 2024, 13, 162. [Google Scholar] [CrossRef] [PubMed]
- Marchetti, F.; Gugel, I.; Costa, S.; Baldisserotto, A.; Foletto, A.; Gugel, I.; Baldini, E.; Manfredini, S.; Vertuani, S. A Sustainable Approach to Valuable Polyphenol and Iridoid Antioxidants from Medicinal Plant By-Products. Antioxidants 2024, 13, 1014. [Google Scholar] [CrossRef] [PubMed]
- Rodríguez-Blázquez, S.; Fernández-Ávila, L.; Gómez-Mejía, E.; Rosales-Conrado, N.; León-González, M.E. Development of a Green Ultrasound-Assisted Method for the Extraction of Bioactive Oils from Sloe Seeds: A Sustainable Alternative to Soxhlet Extraction. Microchem. J. 2025, 218, 115364. [Google Scholar] [CrossRef]
Disclaimer/Publisher’s Note: The statements, opinions and data contained in all publications are solely those of the individual author(s) and contributor(s) and not of MDPI and/or the editor(s). MDPI and/or the editor(s) disclaim responsibility for any injury to people or property resulting from any ideas, methods, instructions or products referred to in the content. |
© 2025 by the authors. Licensee MDPI, Basel, Switzerland. This article is an open access article distributed under the terms and conditions of the Creative Commons Attribution (CC BY) license (https://creativecommons.org/licenses/by/4.0/).