Article

Synthesis and Characterization of Amorphous SiO2−FexOy Materials Starting from Iron Sulfate for Preliminary Studies of CO2 Adsorption

1
Coriolan Drăgulescu” Institute of Chemistry, Bv. Mihai Viteazul, No. 24, 300223 Timişoara, Romania
2
Faculty of Industrial Chemistry and Environmental Engineering, Politechnica University Timişoara, Victoriei Square, No. 2, 300006 Timişoara, Romania
3
Renewable Energy Research Institute, Politehnica University Timişoara, 138 Gavril Musicescu Street, 300501 Timişoara, Romania
*
Author to whom correspondence should be addressed.
Separations 2023, 10(6), 352; https://doi.org/10.3390/separations10060352
Submission received: 16 May 2023 / Revised: 8 June 2023 / Accepted: 9 June 2023 / Published: 13 June 2023
(This article belongs to the Special Issue Advances in CO2 Adsorptive Separation for CO2 Capture)

Abstract

:
The goal of this work is to investigate the effectiveness of amorphous SiO2−FexOy loaded by functionalization with Ce(SO4)2, Li2SO4, and 3-aminopropyltriethoxysilane (APTES) for CO2 adsorption. Silica and iron-based materials are gaining popularity due to their wide range of applications, such as catalysis, photocatalysis, imaging, etc.; however, there are very few studies regarding the adsorption of CO2 with the aforementioned materials. In our study, we proposed to test their ability in this direction by adding cerium sulfate and lithium sulfate. Three base materials were obtained and characterized using XRD, FTIR, RAMAN, TG, SEM, and BET followed by their functionalization with amino groups by using of the APTES precursor. The SEM images indicate an increase in size, forming clusters from 100 nm for base materials to 500 nm for functionalized materials. The results indicate a maximum CO2 adsorption of 1.58 mmol/g material for the SiO2−FexOy−Li−APTES sample.

Graphical Abstract

1. Introduction

Iron oxides with silica matrix materials are widely used in many technologies due to their properties and emerging potential applications [1,2,3]. The popularity of the iron compounds should be also attributed to their low toxicity and inexpensive costs in comparison to the rest of the widely used metals [4]. Many research studies have shown that iron compounds are very effective for the degradation of toxic substances, especially in the case of aromatic compounds [4,5,6]. One of their particular uses includes the degradation of pollutants; for example, the biodegradation of biphenyl, which is known for its stability and insolubility in water [4]. More precisely, FeCl3, Fe(NO3)3, Fe2O3, and FeSO4 solutions with the concentration of 10−4 M have shown very effective results in this field [4,5]. However, it is clear that the utility of any iron source depends solely on its properties, where those properties are highly influenced by the particle size of the iron component [1,6].
Regarding the iron precursor used for SiO2−FexOy – based materials, various sources were used [4,5]. Still, to our knowledge, FeSO4⋅7H2O – type material was never used for CO2 adsorption applications. However, interactions between iron and silica are not solely in the form of SiO2−FexOy since the preparation conditions or even the order of the component material introduction can lead to the formation of other related materials. Among them is Fe2SiO4, which is known for its usage as a refractory material, cement additive, ceramic pigment, and acid attack-resistant container, as well as for its adsorption of cation contaminants. Other important qualities pertain to the electrical properties of this material; whereas, in comparison to the cobalt orthosilicates used for rechargeable lithium batteries, Fe2SiO4 is far more suitable as an anode. Fe2SiO4 material exhibits two crystalline structures: α- Fe2SiO4, known as fayalite; and the spinel phase, γ−Fe2SiO4. The most prominent differences between these crystalline structures include their stability and magnetic properties at different temperatures and pressures. Although spinel structure is stable in a wide range of temperatures and pressures, fayalite, which is stable at room temperature, is far more useful from a magnetic point of view, exhibiting paramagnetic behavior in normal conditions and changing to antiferromagnetic below 65 K [7,8].
As regards the presence of silica in the material, it is already well known that γ−Fe2 O3 (maghemite) transforms to α−Fe2O3 (hematite) at temperatures around 350 °C; hence, the material stabilization could be achieved by incorporation in glassy, polymeric, or ceramic matrices, highlighting the role of the silica usage [1]. Alongside silica, iron-based materials have been treated with organic-related compounds such as surfactants or polymers, as well as carbon, precious metals, or oxides [9]. Hence, depending on the used material, various new applications could arise. Although iron–silica materials are used in CO2 capture, especially due to the facile magnetic recovery of iron [9] and the wide range of silica applications, improvements are still needed in this field, especially because silica has low porosity and small surface area and iron’s tendency toward oxidation, limiting the full potential of the compound. Still, it is possible to obtain mesoporous silica by using surfactants as porogenic agents, which is considered a revolutionary achievement in this field. An important task is to evaluate the properties of these materials, such as texture, shape, and morphology, and the environment in which they are developed.
The morphology of the materials is the key factor in determining the most suitable method. In this sense, Yusuf et al. points out that CaO-, MgO-, or CeO2- modified fibrous silica can improve CO2 adsorption [10], whereas the basicity of the porous adsorbent increases with the addition of metal oxides, leading to the increased selectivity and adsorption capacity of CO2 [11]. Oxides of alkaline earth metals have been proposed for the development of CO2 capture due to their high basic properties and because they act as strong adsorbents [12,13]. On the other hand, it is believed that the presence of the strong Lewis base on CeO2 or LiO2 can potentially enhance the CO2 adsorption capacity. In addition, the ability of CeO2 or LiO2 to adsorb water and/or CO2 molecules at room temperature takes place due to the oxygen vacancy [14]. Additionally, many researchers favor the use of cerium as a metal for improved CO2 adsorption capacity, such as Kanahara et al. (2019) and Slostowski et al. (2017), while several research groups show that the use of lithium in the synthesis can positively influence the adsorption capacity of CO2 [15,16,17,18,19,20]. Other related studies were undertaken by Lahuri, et al. [21], Baumann [22], Zheng et al. [23], with the aim of highlighting the importance of cerium in providing active sites for CO2 adsorption; whereas Mizunuma et al. show that the presence of lithium-based composites improved adsorption results, with a capacity over 30% of the material’s own weight [24]. In addition, Belgamwar et al. indicate that Lithium silicate is one of the best known high-temperature CO2 capture sorbents, with an adsorption capacity that achieves 35% [25]. The positive outcome in the presence of lithium was also confirmed by Hu [26] and Zhou et al. [27].
In addition to the aforementioned adsorbent materials, amines have great potential in this matter as a result of their ability to lower the gas desorption temperature [28,29,30,31,32]. From the preparation method to the structure of the resulting link, the amines with which the material surfaces are functionalized can be classified into three subclasses: impregnated amines (class I); grafted amines (class II); and in situ (class III) [28,29,33,34,35]. In situ polymerized amines (class III) represent a new class with high potential in terms of adsorption capacity and cyclic stability [28,29]. From the preparation point of view, there are plenty of possible synthesis procedures, including hydrothermal, pyrolysis, electrochemical or sol–gel. However, the sol–gel method has been proven to be the most suitable, taking into account the controllable structure, phases, dispersity, size, and homogeneity of the final product that can be achieved using this synthesis method [1,36].
In the present work, the synthesized materials were realized, starting from silica and iron oxide matrix. The obtained material was then modified by adding cerium sulfate or lithium sulfate in order to improve the relationship between the physicochemical properties and the CO2 adsorption efficiency. The main observation highlights how the presence of the two sulfates, in addition to the silica and iron oxide matrix, changes the size of the particles and influences the adsorption of CO2. In the final step of this study, the synthesized materials were functionalized with 3-aminopropyltriethoxysilane and subjected to CO2 adsorption studies.

2. Materials and Methods

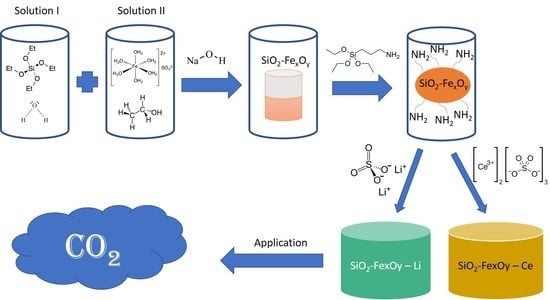
2.1. Materials Synthesis

Three samples were obtained using the sol–gel method. The main precursors used in this recipe are TEOS (Si(OC2H5)4- (SigmaAldrich)), iron sulfate (FeSO4·7H2O, (SigmaAldrich)), cerium sulfate (Ce(SO4)2, (Reactivul Bucuresti SRL)), lithium sulfate (Li2SO4, (Reactivul Bucuresti SRL)), ethanol (SC CHIMOPAR TRADING SRL), sodium hydroxide (NaOH, (Reactivul Bucuresti SRL)), and distilled water.
For the initial sample, the following steps were taken: (i) 5 mL of TEOS were used and mixed with 20 mL of distilled water for half an hour; (ii) at the same time, a solution of 4 g of FeSO4·7 H2O and 25 mL of ethanol was prepared, which was later placed on the TEOS solution (TEOS molecular ratio: FeSO4 ·7 H2O = 1:1); (iii) to obtain an alkaline medium, a concentrated solution of NaOH was made using 5 g of NaOH in 10 mL of water. From this solution, 2 mL of NaOH solution was added after another 3 h of mechanical mixing over the previously formed solution, obtaining a gel. For samples II and III, a similar process was carried out, only the precursors of cerium sulfate (0.5 g) and lithium sulfate (0.5 g) precursors, respectively, were added together with FeSO4·7 H2O in 25 mL of ethanol. The three obtained samples were denoted as SiO2−FexOy, SiO2−FexOy−Ce, and SiO2−FexOy−Li. They were dried for 24 h at 100 °C and calcined at 300 °C in an inert atmosphere for 3 h.
In order to functionalize the material, 1 g of initial material was added to a round bottom flask, over which 60 mL of toluene and 3 mL of APTES (C9H23NO3Si, 99%, Fluka) were poured. The flask content was mixed under reflux at a temperature of 120 °C for 6 h. After this, the obtained material was washed with 50 mL of methanol and dried at 80 °C for 12 h.

2.2. Materials Characterization

X-ray diffraction (XRD) was evaluated by PANalytical PW 3040/60 X’Pert PRO diffractometer (Malvern Panalytical, Malvern, UK) and Rigaku Ultima IV diffractometer (for functionalized sample), using Cu–Kα radiation in the range 2θ = 10–80°.
FT-IR spectra were recorded by using KBr pellets with JASCO FT/IR-4200 apparatus. Raman spectra were conducted with Shamrock 500i Spectrograph from ANDOR, United Kingdom. Thermogravimetric analysis was carried out between 25 and 800 °C in nitrogen and air flow at a heating rate of 10 °C/min, using an 851-LF 1100-Mettler Toledo apparatus. Surface morphology (SEM/EDX) was investigated by scanning electron microscopy, Inspect S, FEI Company. N2 adsorption desorption studies were obtained by using Quantachrome Nova 1200e. Prior to this, the samples were degassed at 80 °C for 5 h. The BET (Brunauer–Emmet–Teller) method was used to determine the surface area. The DFT (density functional theory) method was used for calculation of pore width, and the total pore volume was determined from the last point of isotherm close to 1 P/Po.
CO2 adsorption–desorption tests were carried out using the same thermogravimetric analyzer connected to a gas delivery manifold. High purity CO2 and 30% CO2 in N2 at 1 atm were used for the adsorption runs, and N2 was used as a regenerating purge gas for CO2 desorption. The measurement of the samples was performed taking 40 mg of the sample in a Pt crucible. Each sample was pretreated in flowing N2 at 150 °C, then cooled to the desired adsorption temperature (30 °C) and exposed to 30% CO2/N2 (70 mL/min) for 90 min. The adsorption capacity of the adsorbent in milligrams of CO2 per gram of adsorbent was calculated from the weight gain of the sample in the adsorption process.

3. Results and Discussion

3.1. Material Characterization
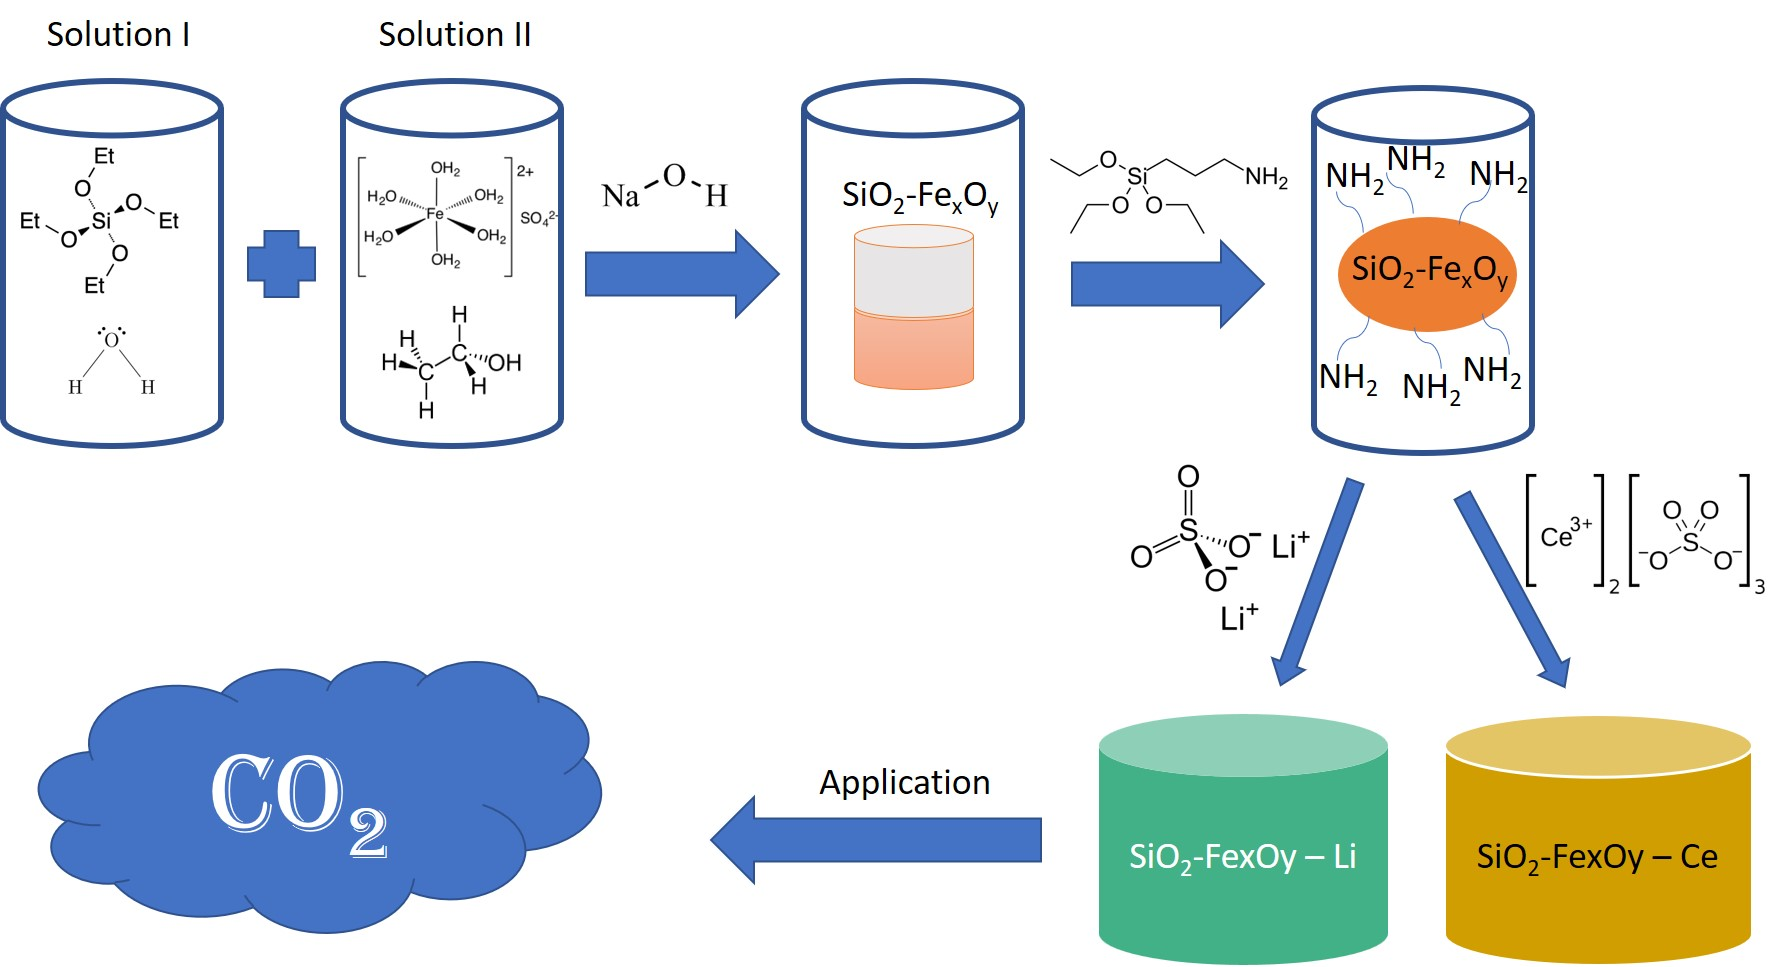
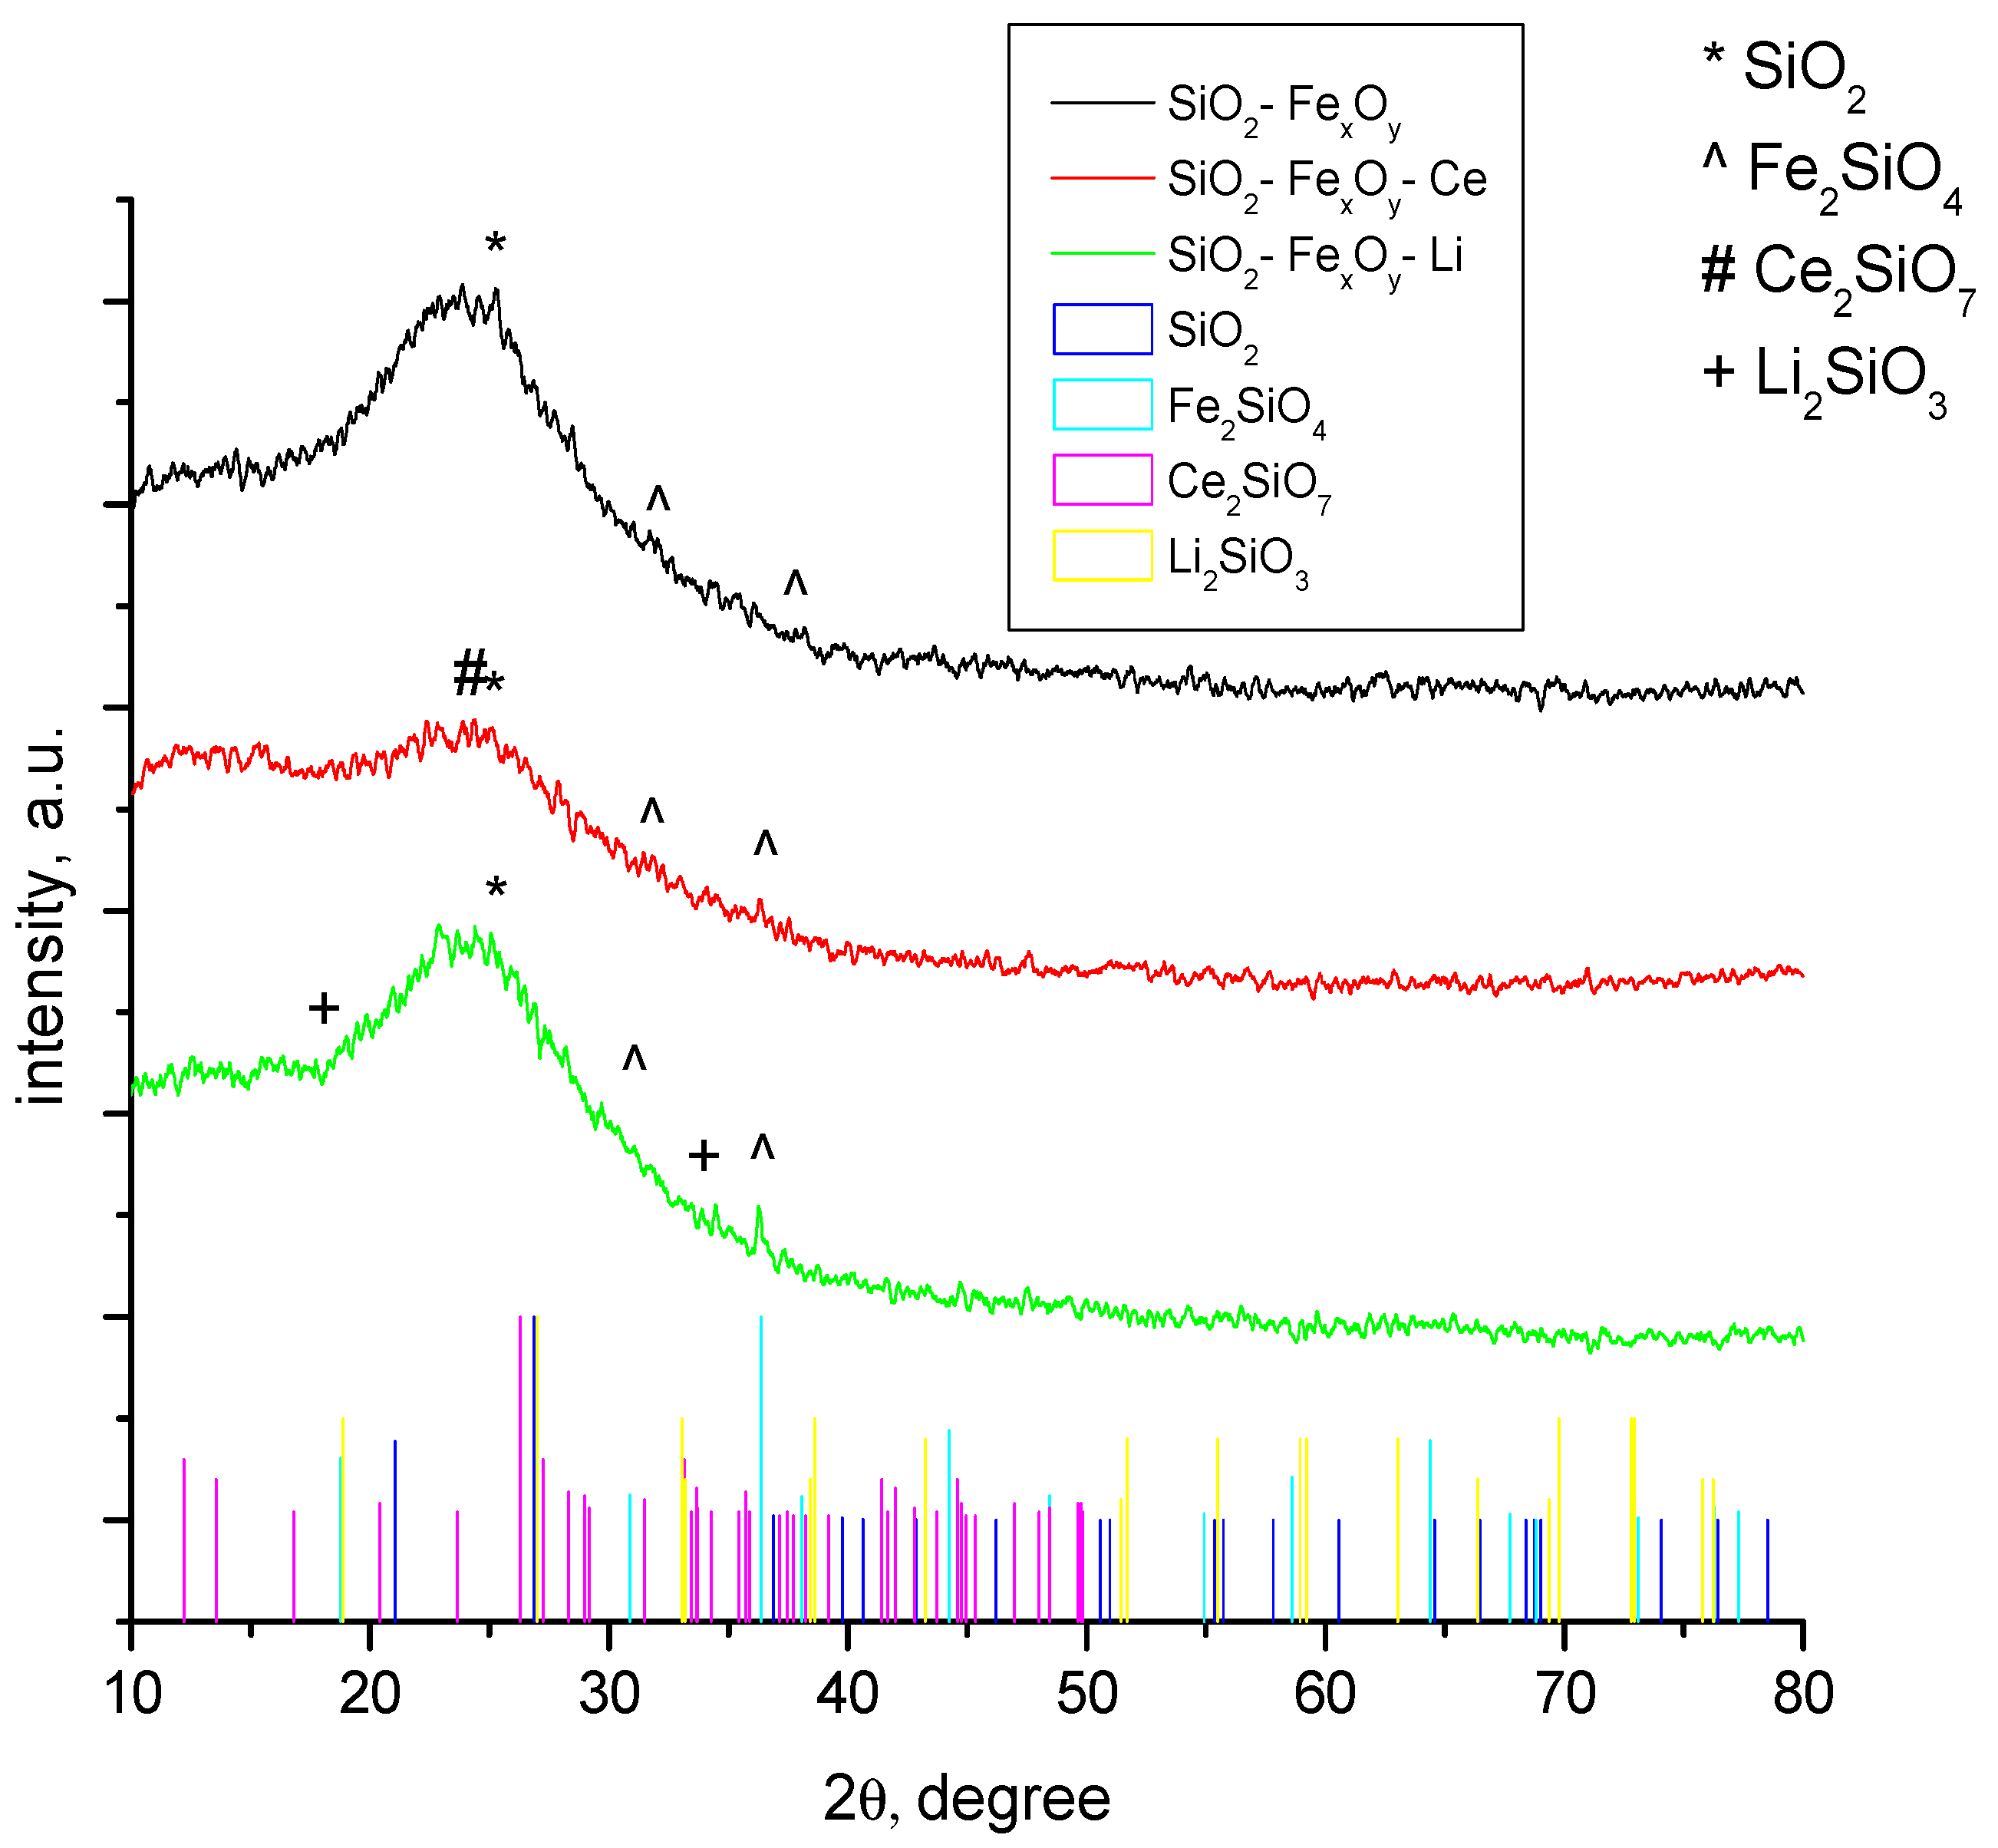
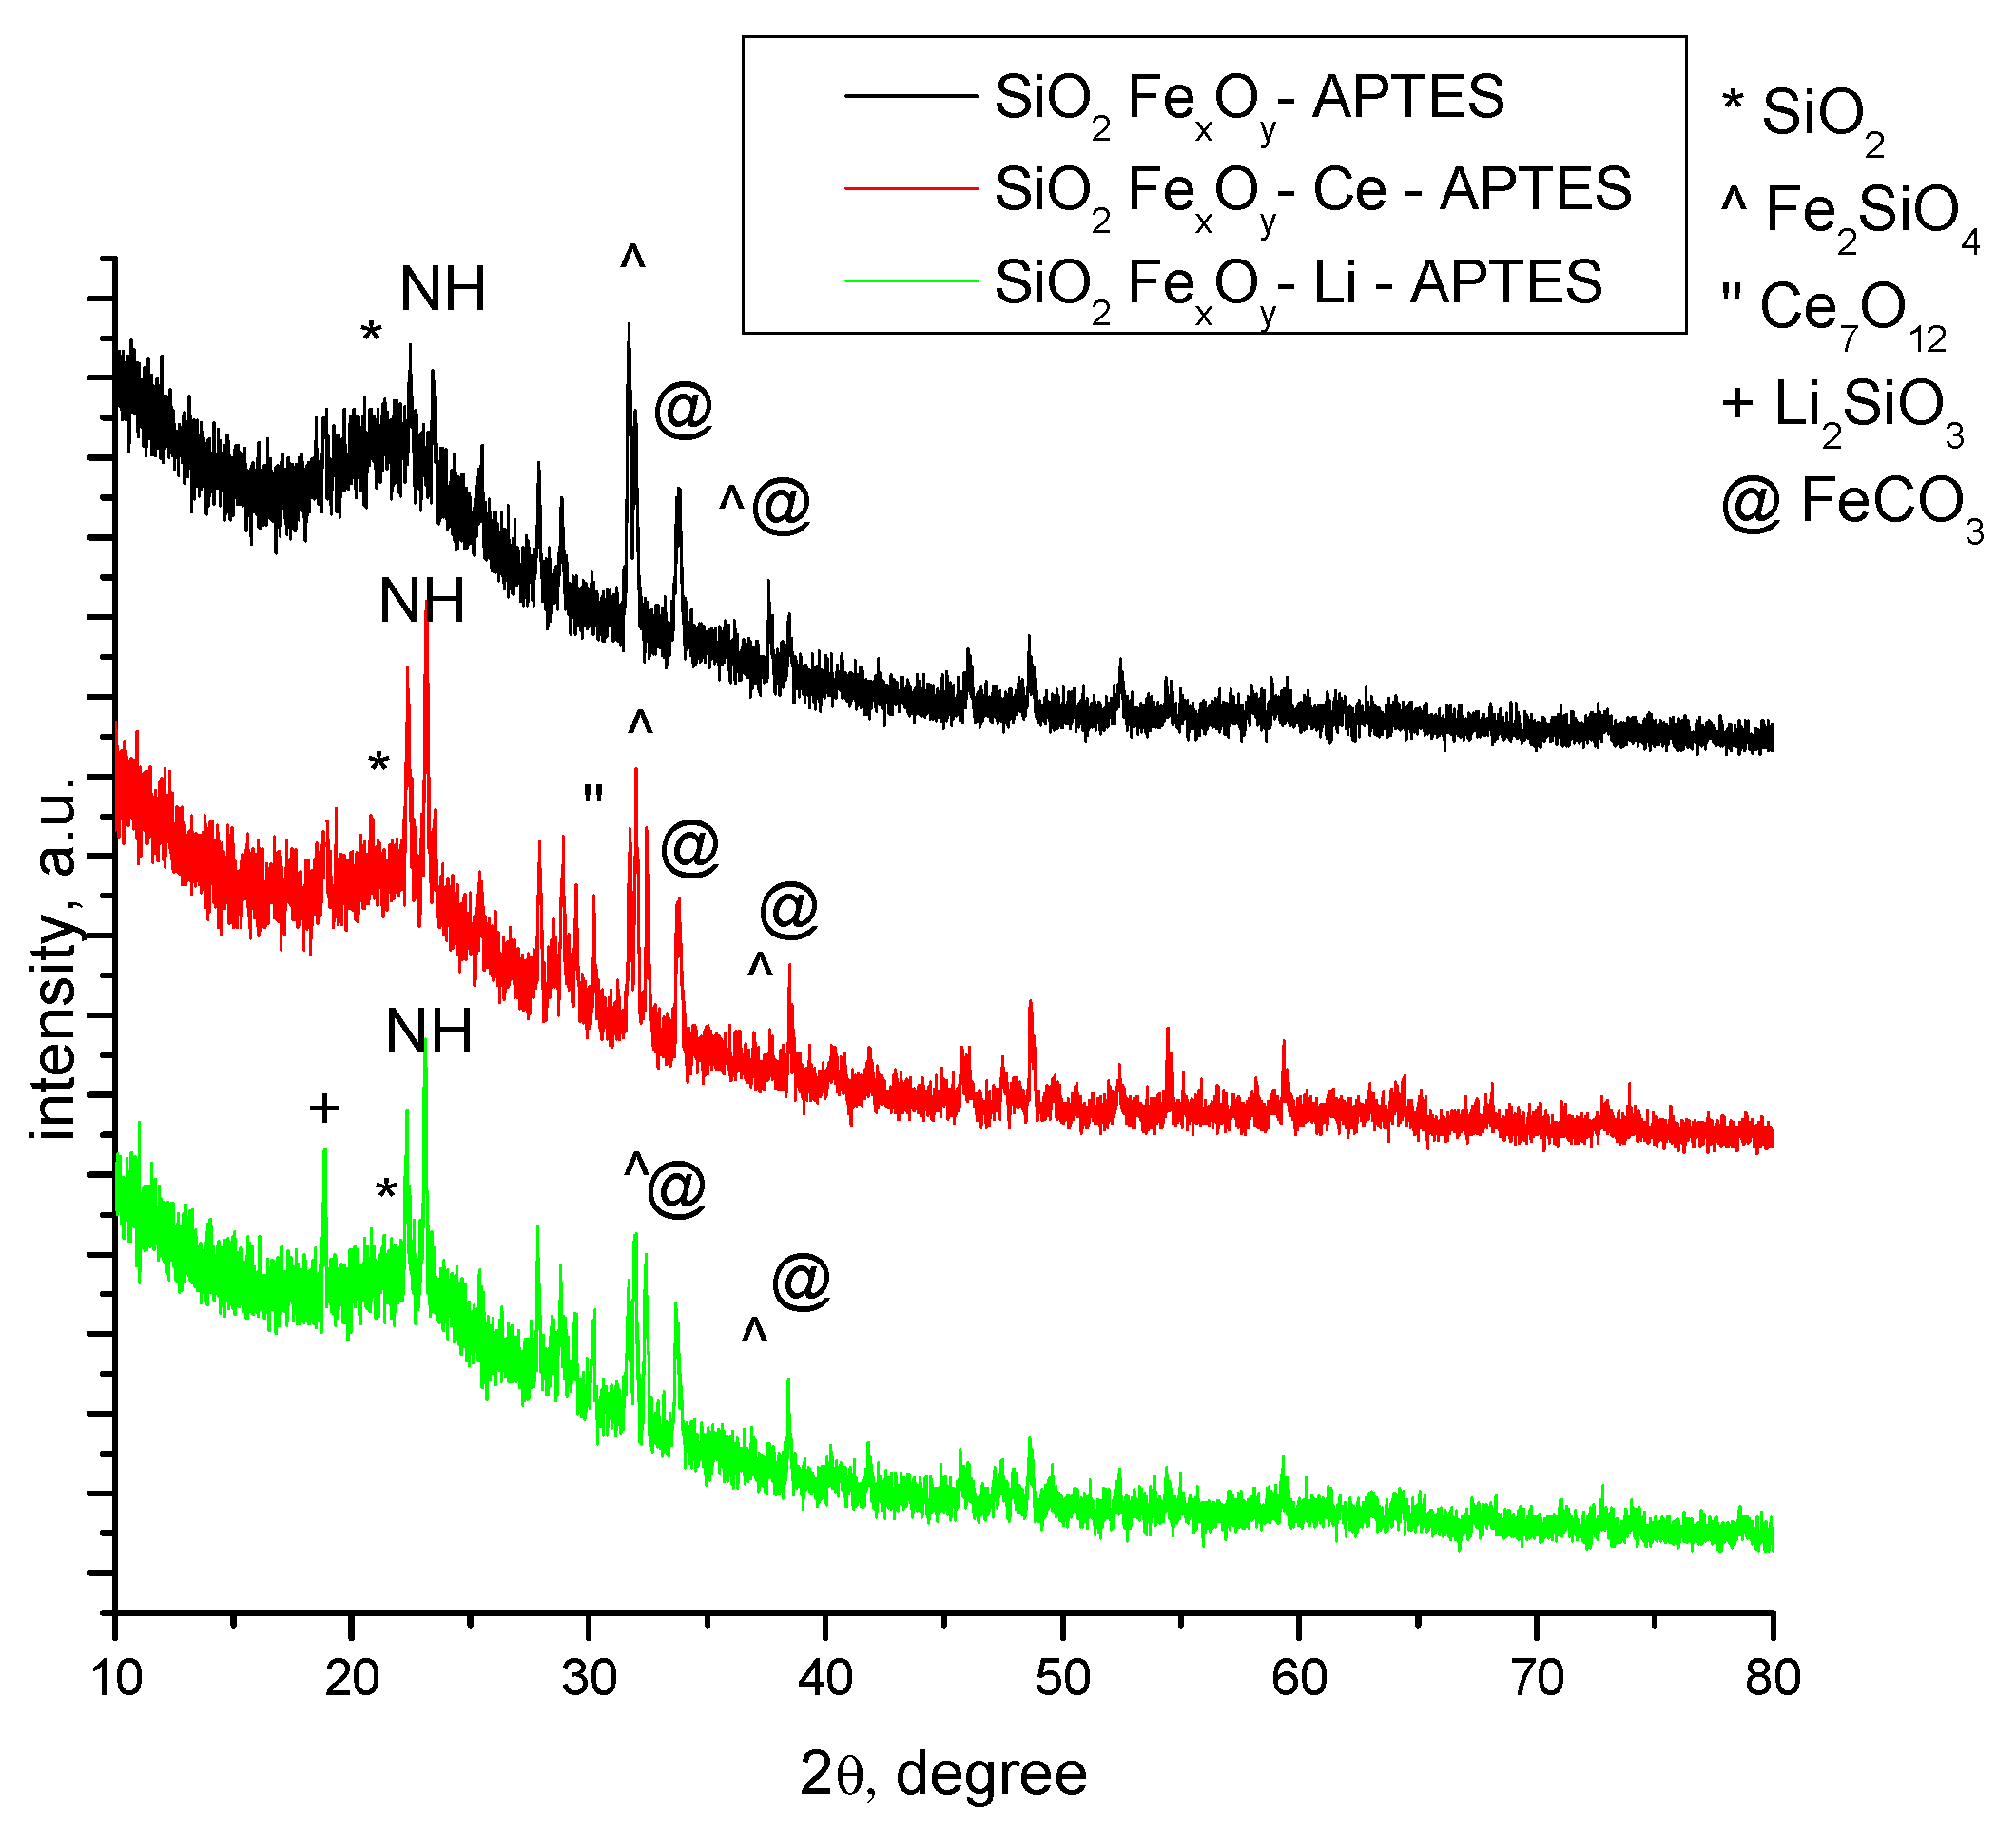
3.1.1. XRD

The structural properties of the obtained samples were identified by X-ray diffraction and presented in Figure 1. All samples analyzed and presented in Figure 1 show a strong amorphism. The data show that the material has a crystallinity of approximately 10%, being represented in majority from the SiO2 phase (01-083-2467) [37] and Fe2SiO4 (01-083-2074) [38]. In the case of the sample where cerium sulfate and lithium sulfate were introduced, the Ce2Si2O7 (00-022-0545) [39] and Li2SiO3 (00-030-0766) crystalline phases [40] were obtained. It is also observed that most of the phases have diffraction peaks that overlap, making it very difficult to be identified.
The peaks observed at 2θ = 23° are specific for amorphous silica. The peaks specific to the 3 1 1 (hkl) line obtained at 2θ = 36° indicate the formation of Fe2SiO4 which is shown for all samples. In the case of samples with cerium sulfate, we observed at 2θ = 26°, specific to 0 3 1 (hkl), that Ce2Si2O7 is formed, but it is overlapped by the amorphous silica phase. When lithium sulfate is added, the peak specific for Li2SiO3 was obtained at 2θ = 18°, specific to 1 1 0 (hkl).
The diffractograms specific for samples functionalized with APTES, SiO2−FexOy−APTES, SiO2−FexOy–Ce–APTES, and SiO2−FexOy−Li−APTES are presented in Figure 2. After functionalization, the SiO2−FexOy−APTES sample undergoes several changes as, alongside SiO2 (01-083-2467) and Fe2SiO4 (01-083-2074), the sample presents the formation of FeCO3 (00-003-0746) phase [41]. The peaks specific to FeCO3 at 2θ = 31° with 1 0 4 (hkl) were observed for all functionalized samples. Similarly, in the case of SiO2-FexOy–Li–APTES sample, we also observed the formation of FeCO3.
In sample SiO2−FexOy−Ce−APTES, we observed some important changes because Ce2Si2O7 is not present but Ce7O12 (01-071-0567) [42] was obtained. The cerium oxide obtained is observed at 2θ = 28° with 2 1 1(hkl). Still, the amorphous phase of the sample is present of about 80%.

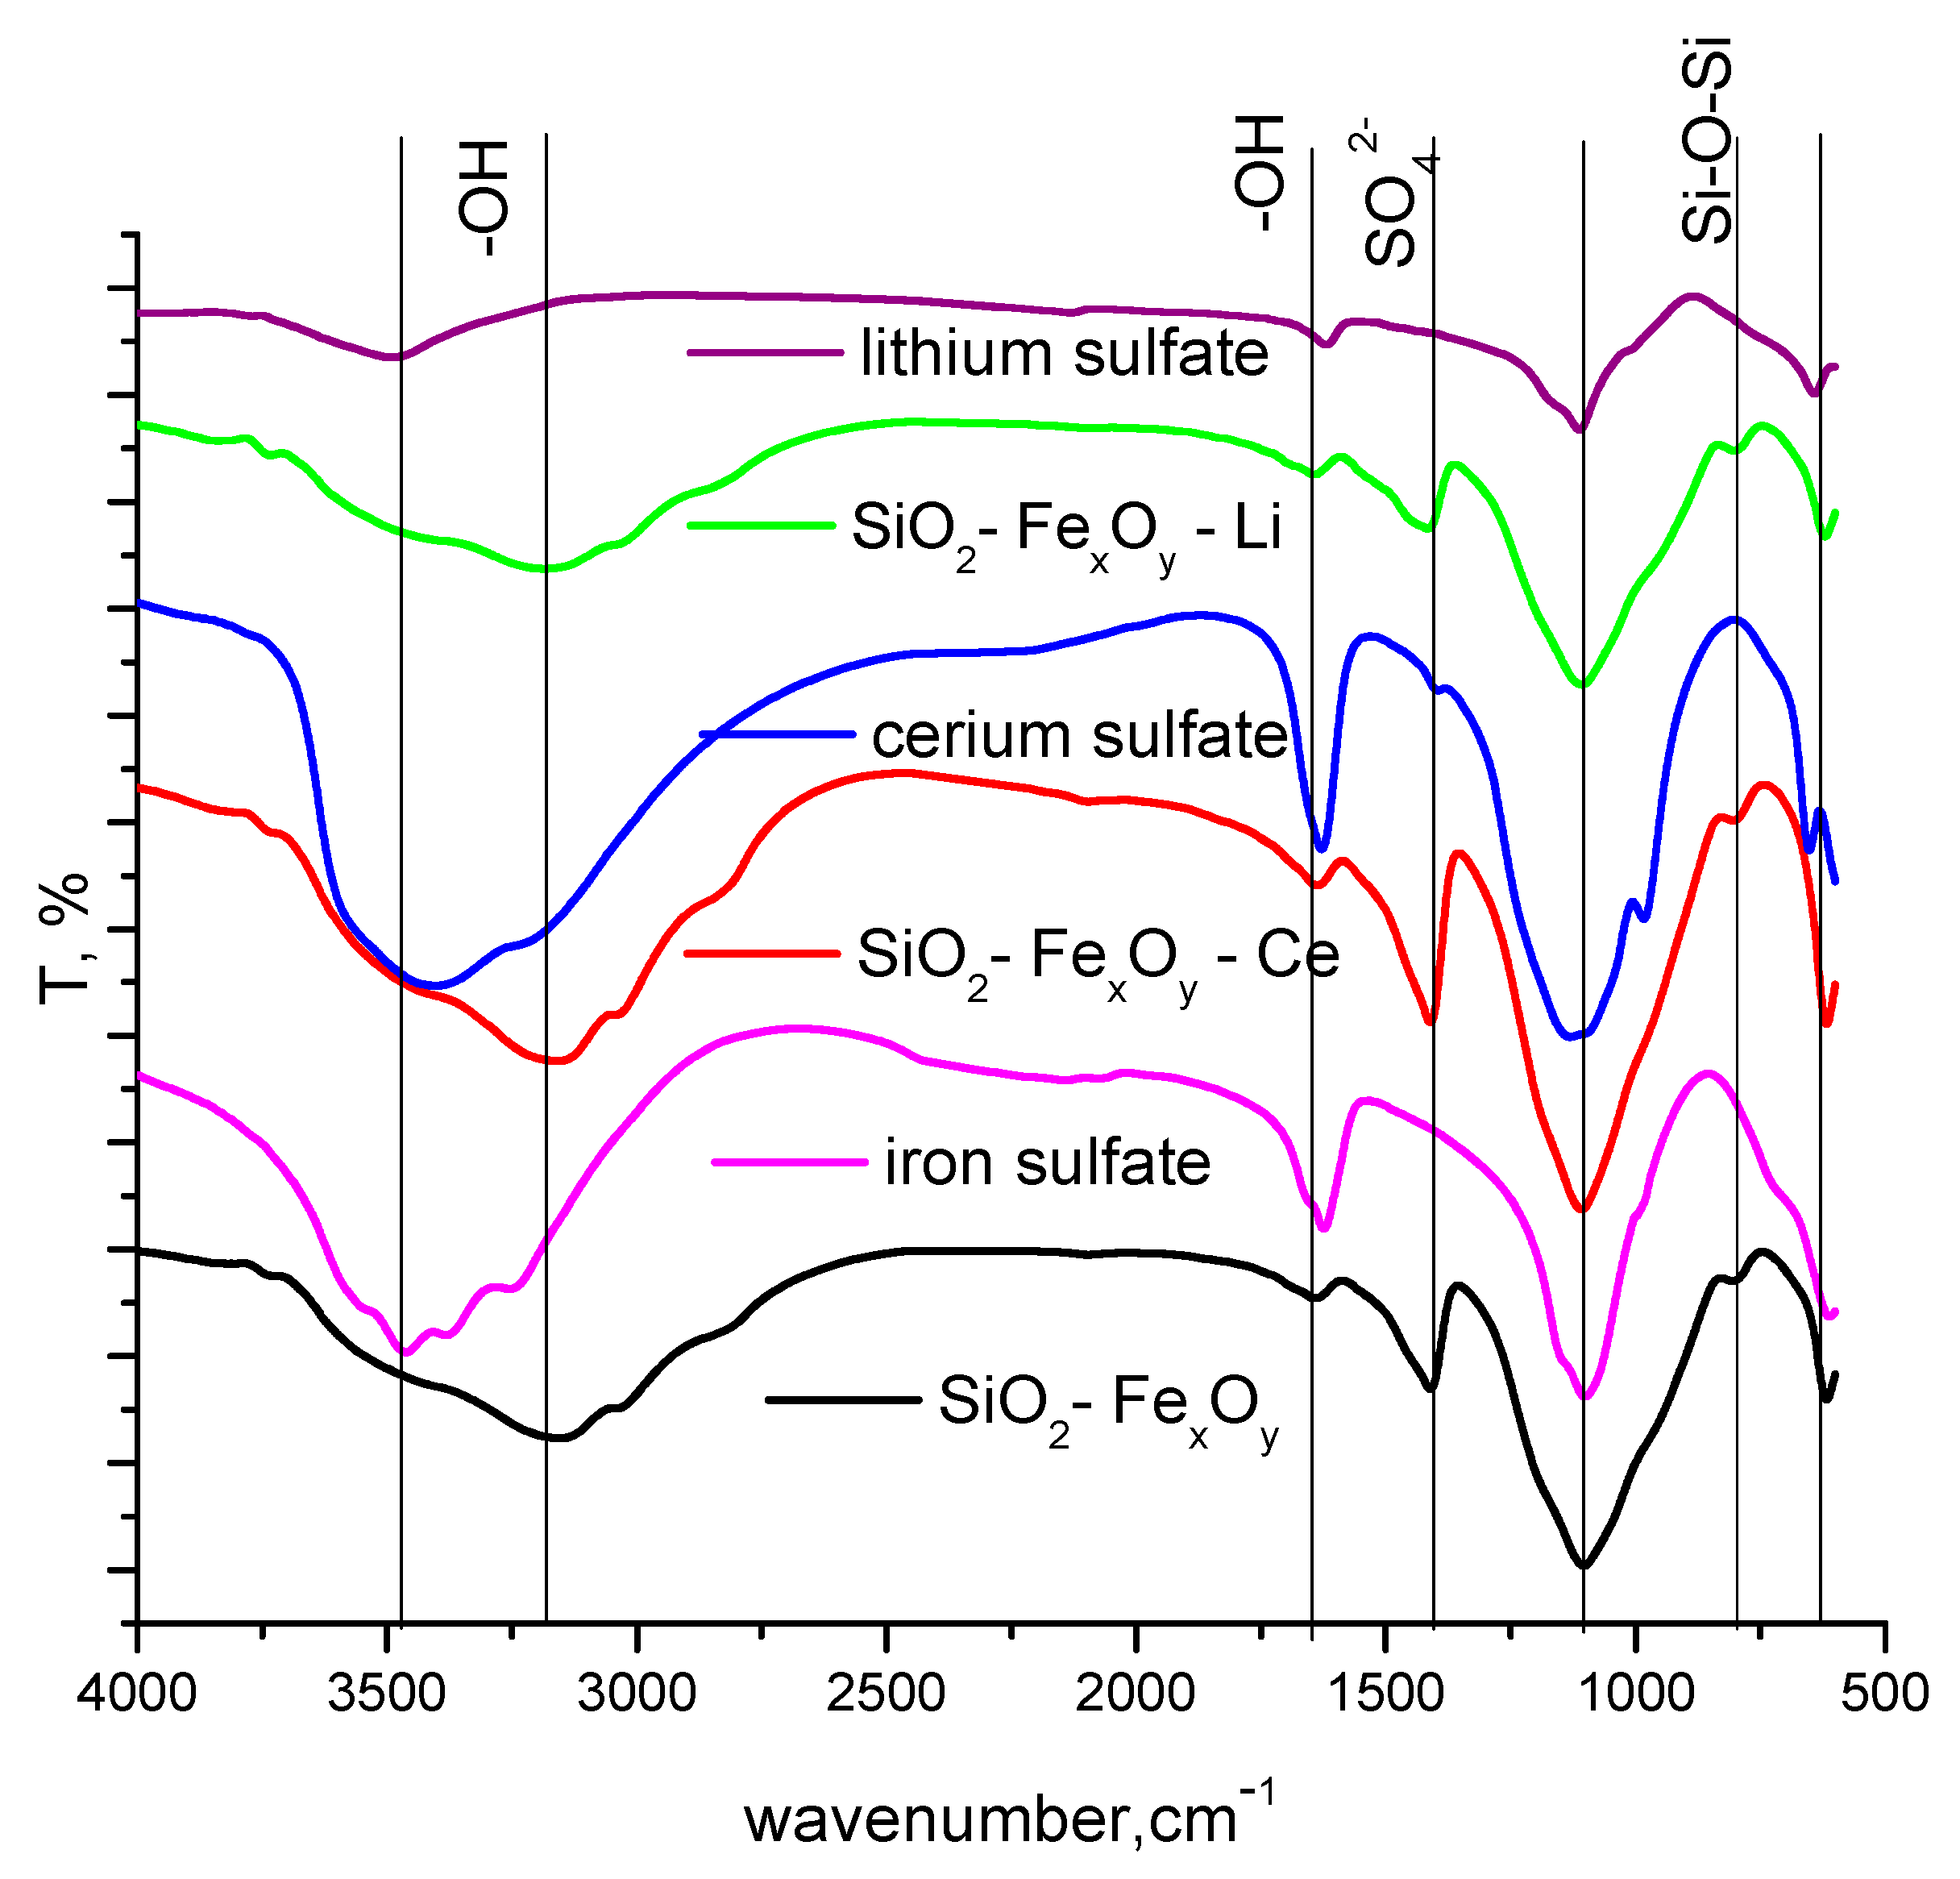
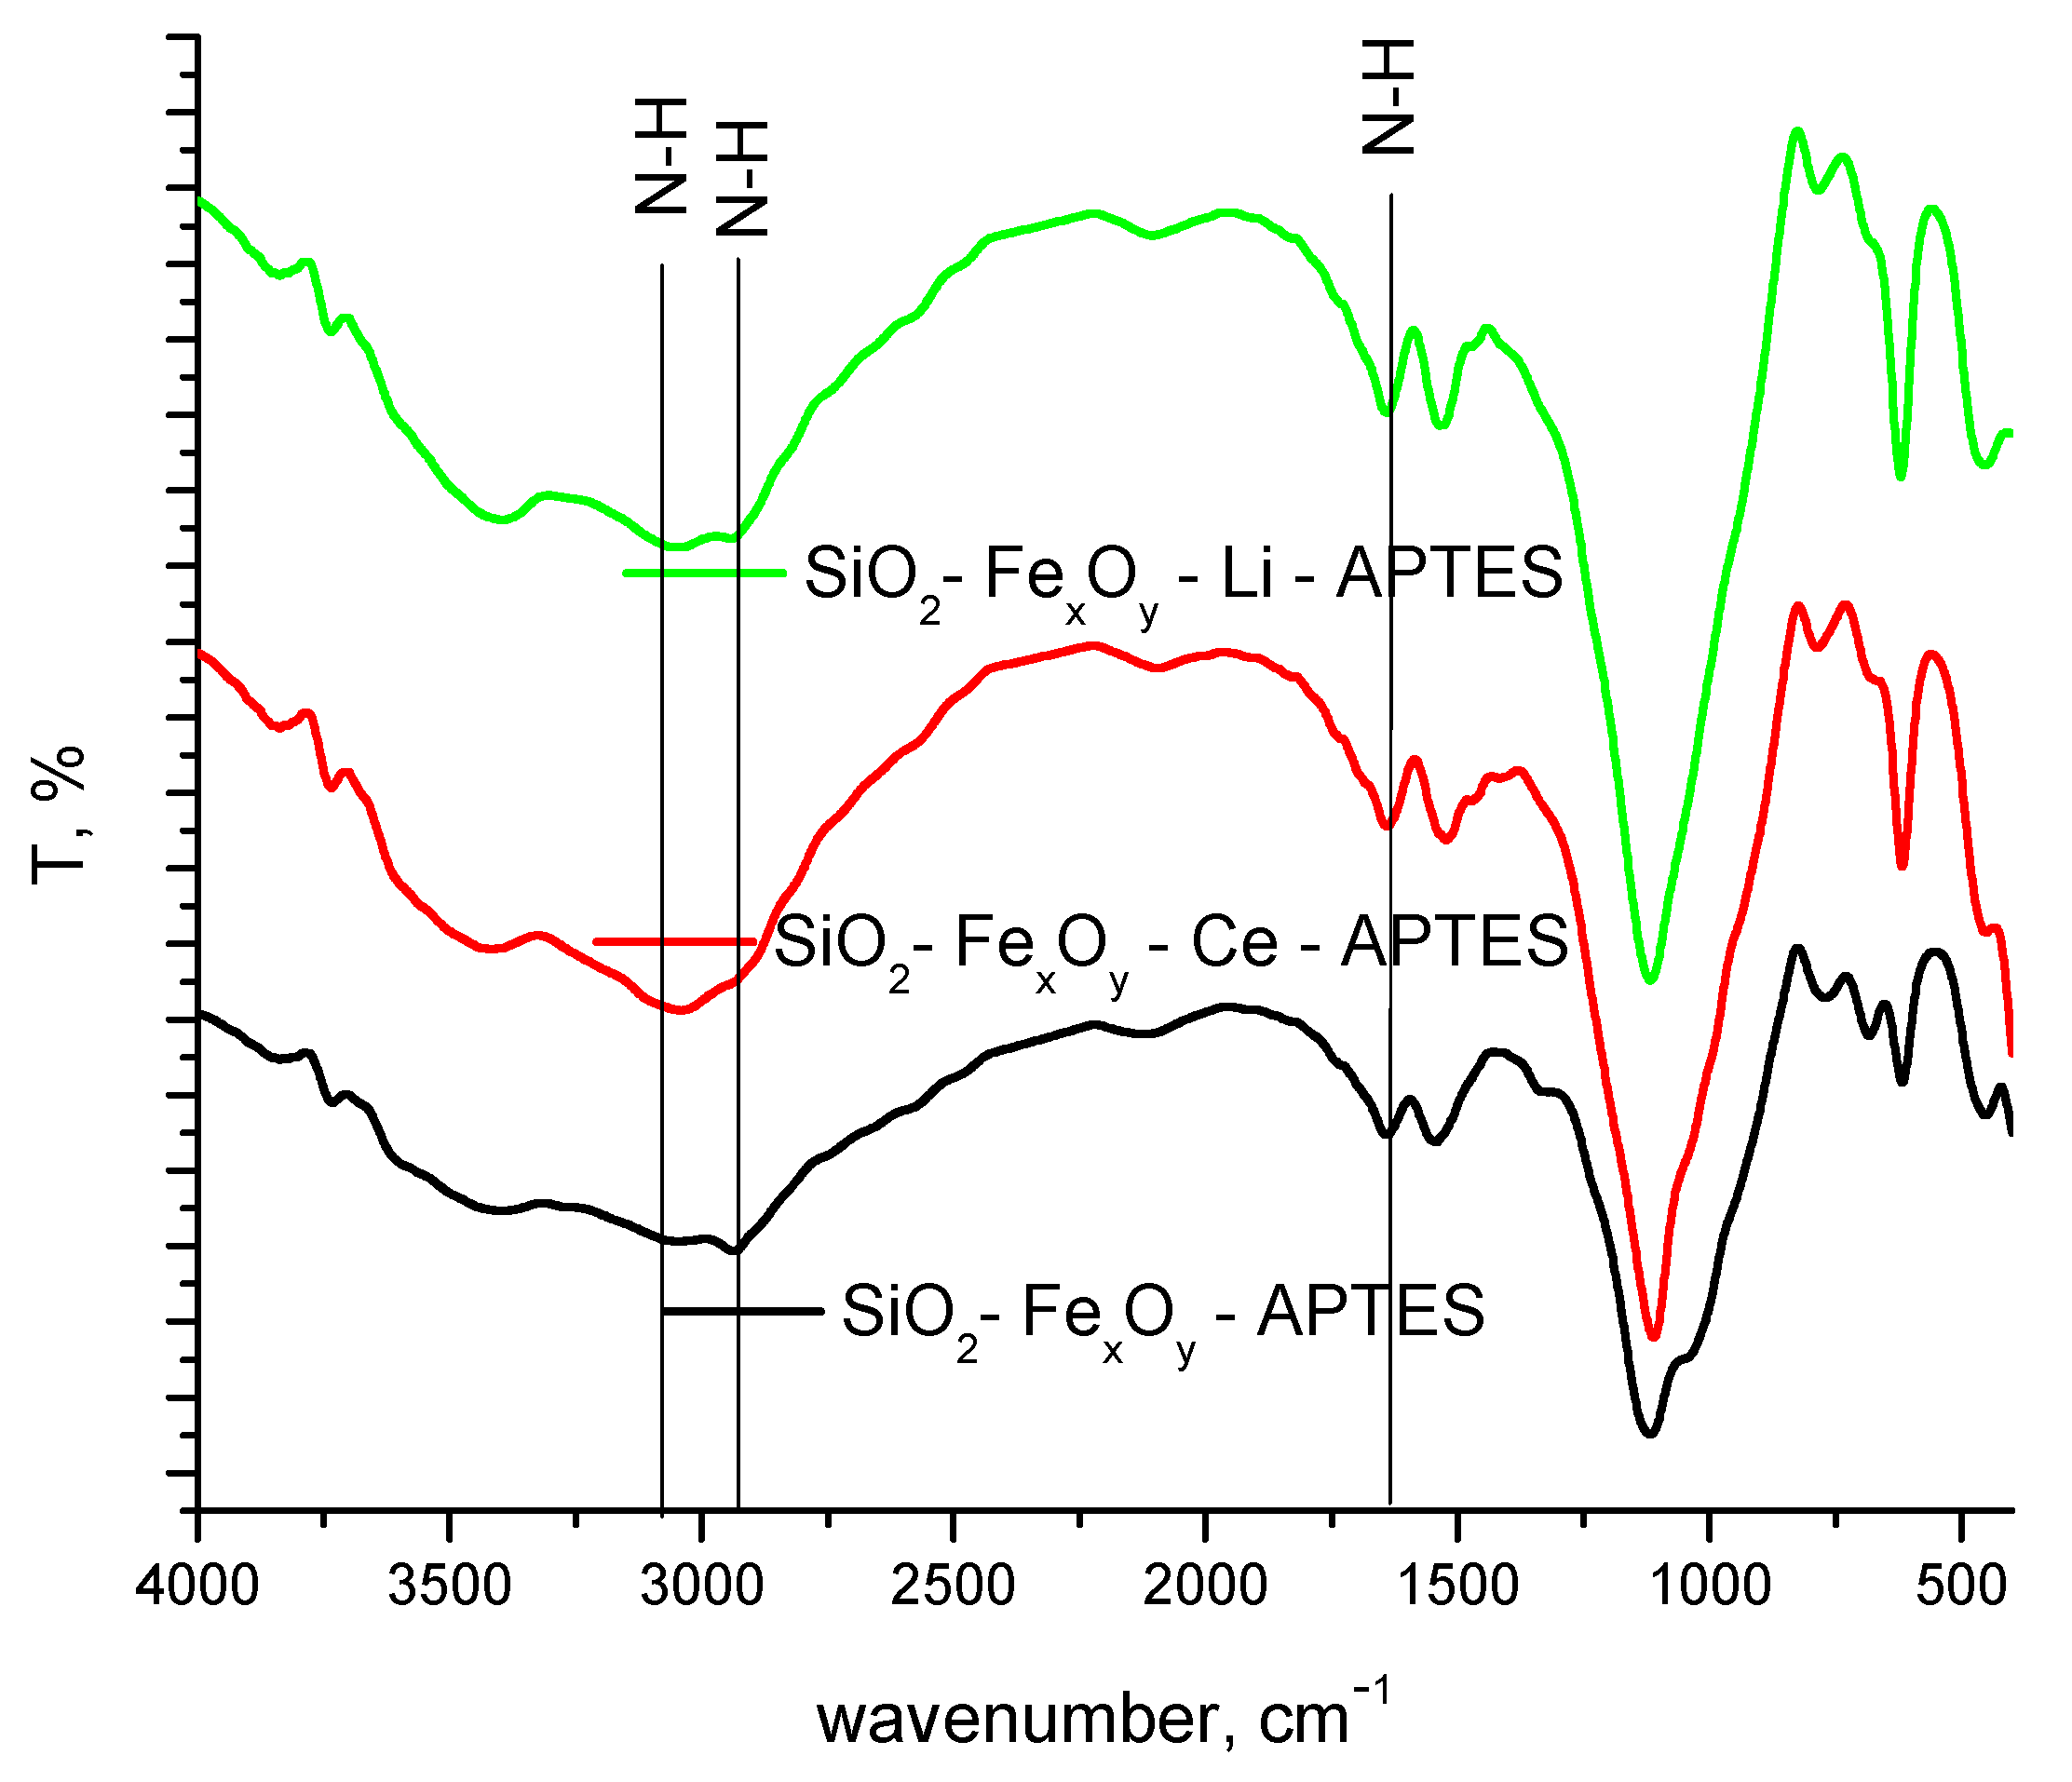
3.1.2. FT-IR Spectroscopy

The specific FT-IR bands recorded for the obtained materials are presented in Figure 3. The resulting SiO2 phase is confirmed by the presence of specific bands at 800 cm−1 and 1100 cm−1, where Si-O-Si siloxane bonds are formed. At the same time, the presence of OH species is highlighted at 3400 cm−1 and 1640 cm−1. The presence of Fe-O bonds is highlighted by the specific band at 620 cm−1. The specific bands for iron sulphate, cerium sulfate, and lithium sulfate, respectively, are present and shown in Figure 1. It can be seen that most of the bands overlap with those specific to silica and iron oxide (Fe2O3), with small shifts due to the addition of cerium and lithium sulfate. One of the main bands, SO42, also appears at 1100 cm−1, and the shifts are due to the new bonds formed with the silica matrix [43]. The specific band for SO42− can also be observed at 1430 cm−1.
From the FT-IR spectrum, the formation of specific amine bands is observed as a consequence of their functionalization (Figure 4). At 3100 and 2900 cm−1, the specific N-H stretching band is put in evidence, followed by the 1520 cm−1 specific for N-H bending band. It is observed that once cerium sulfate or lithium sulfate is introduced, hypochromic effects influence the aforementioned bands [44].

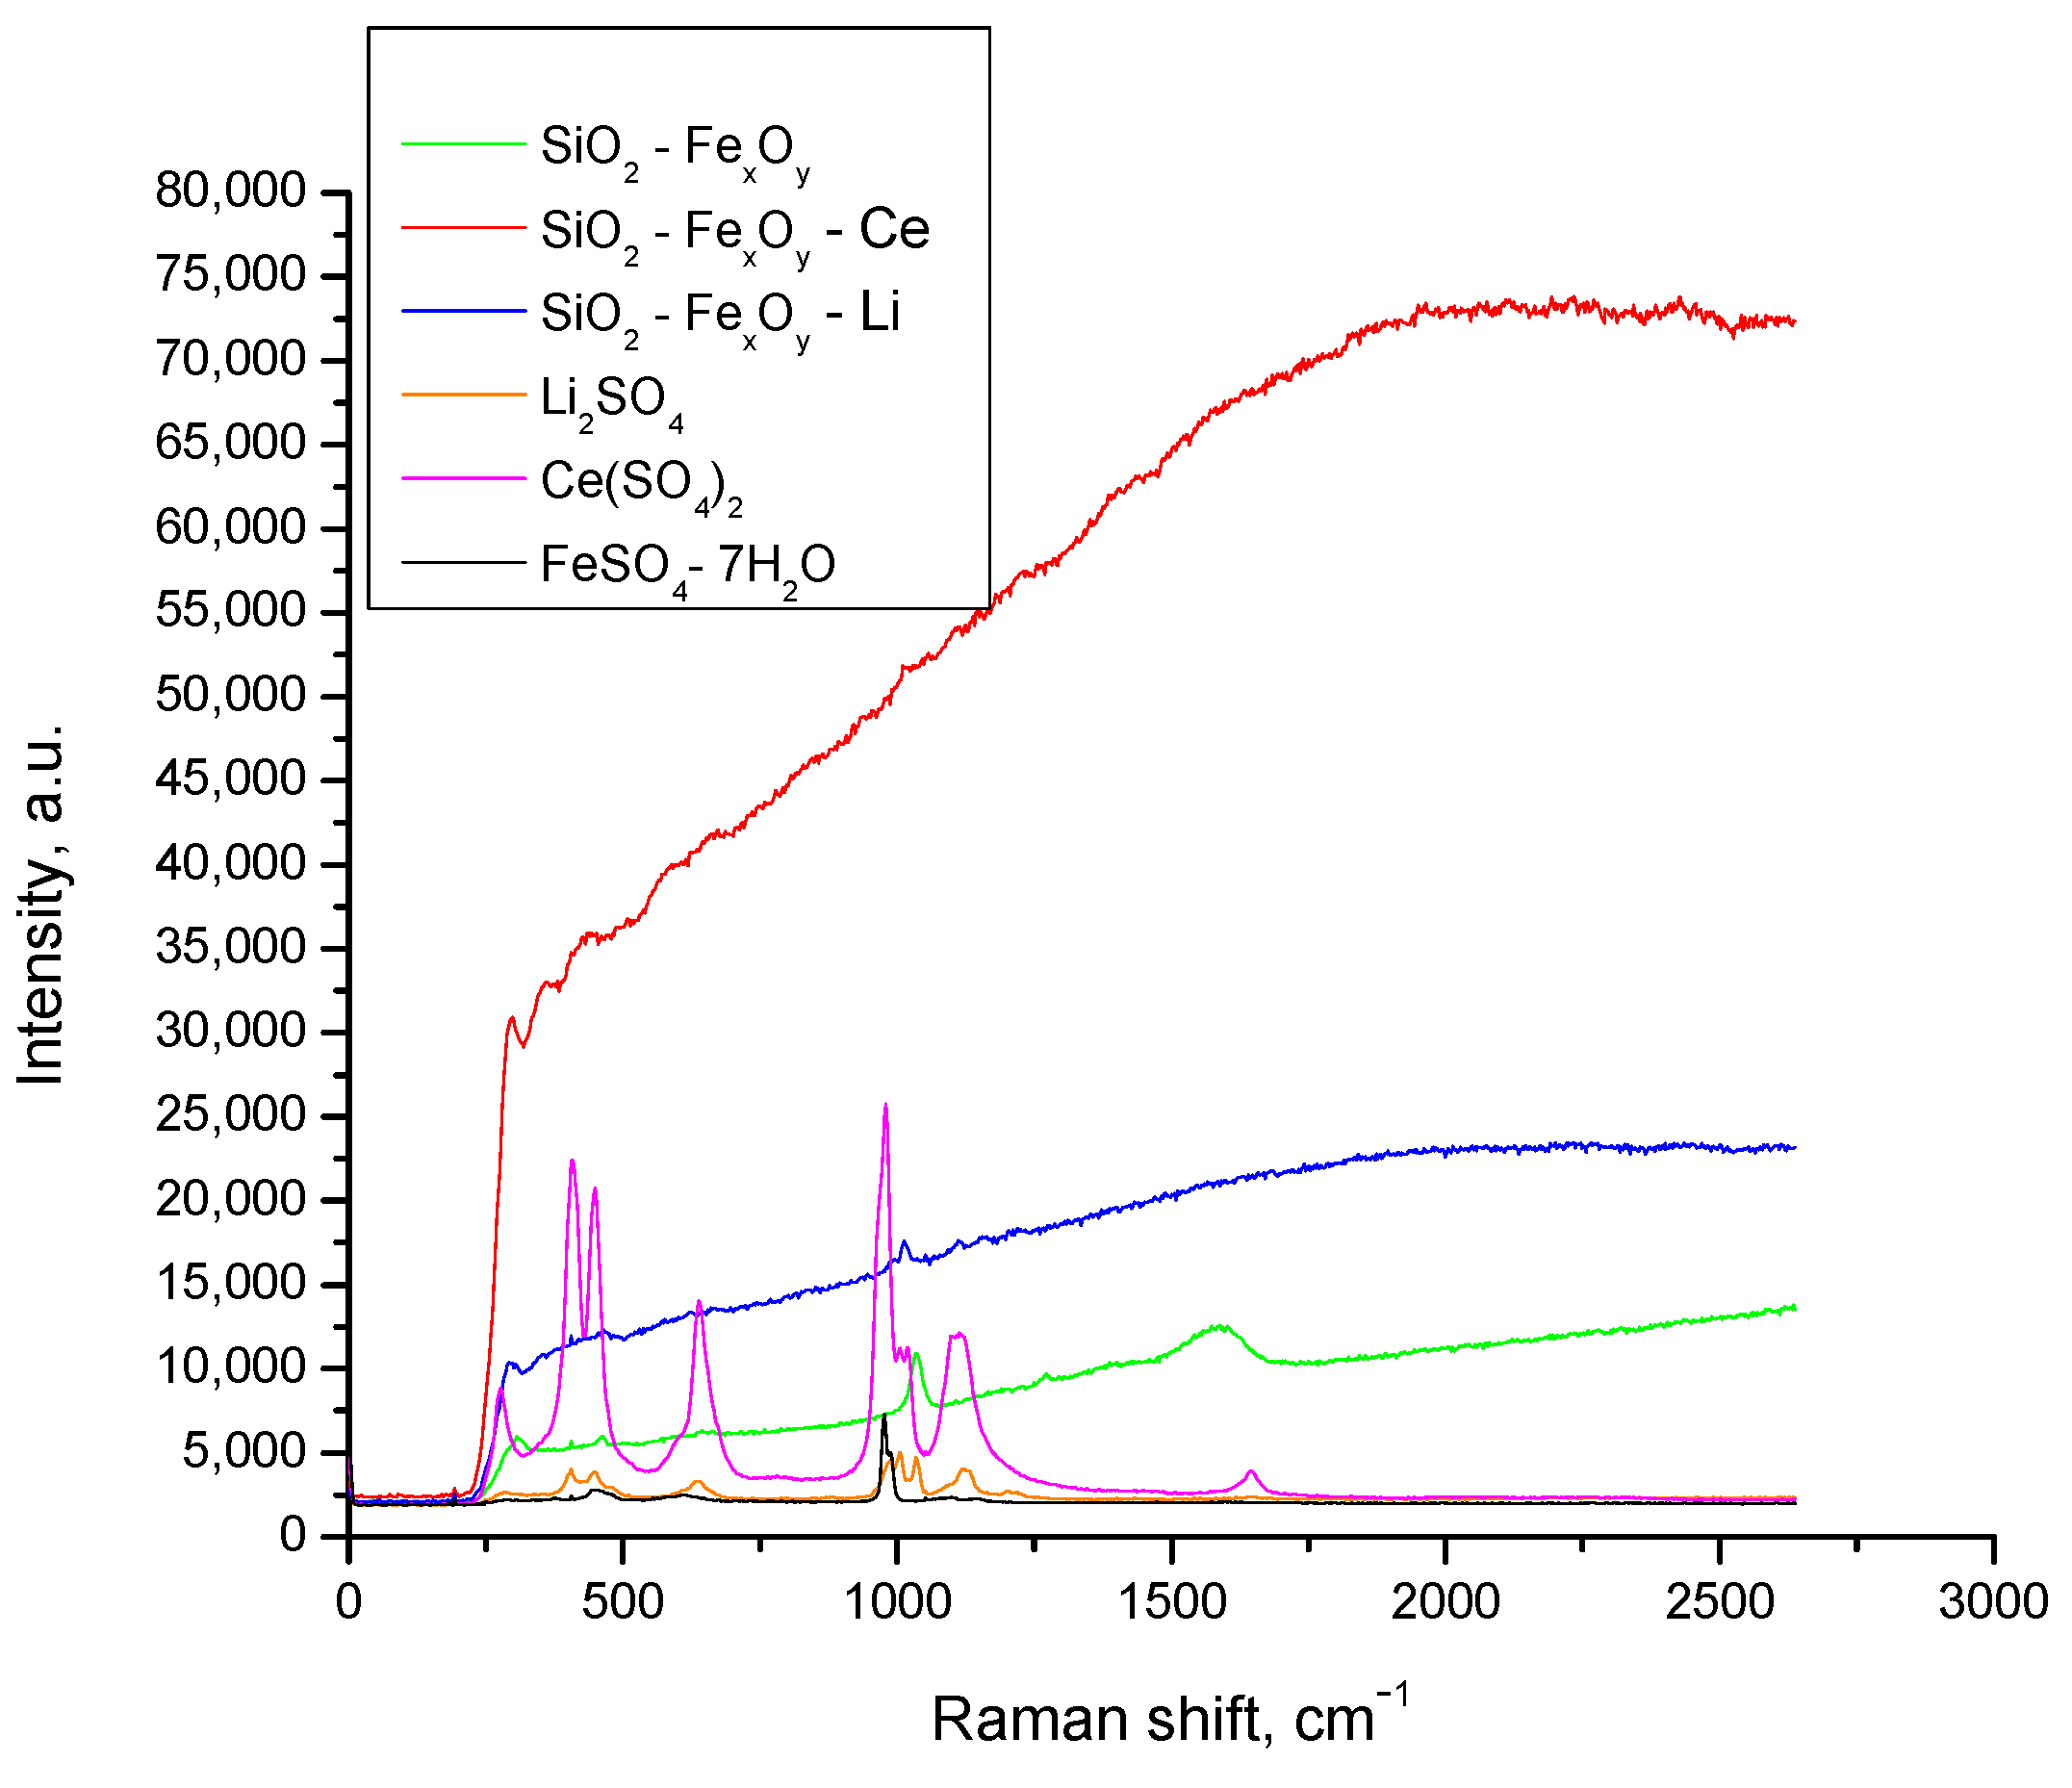
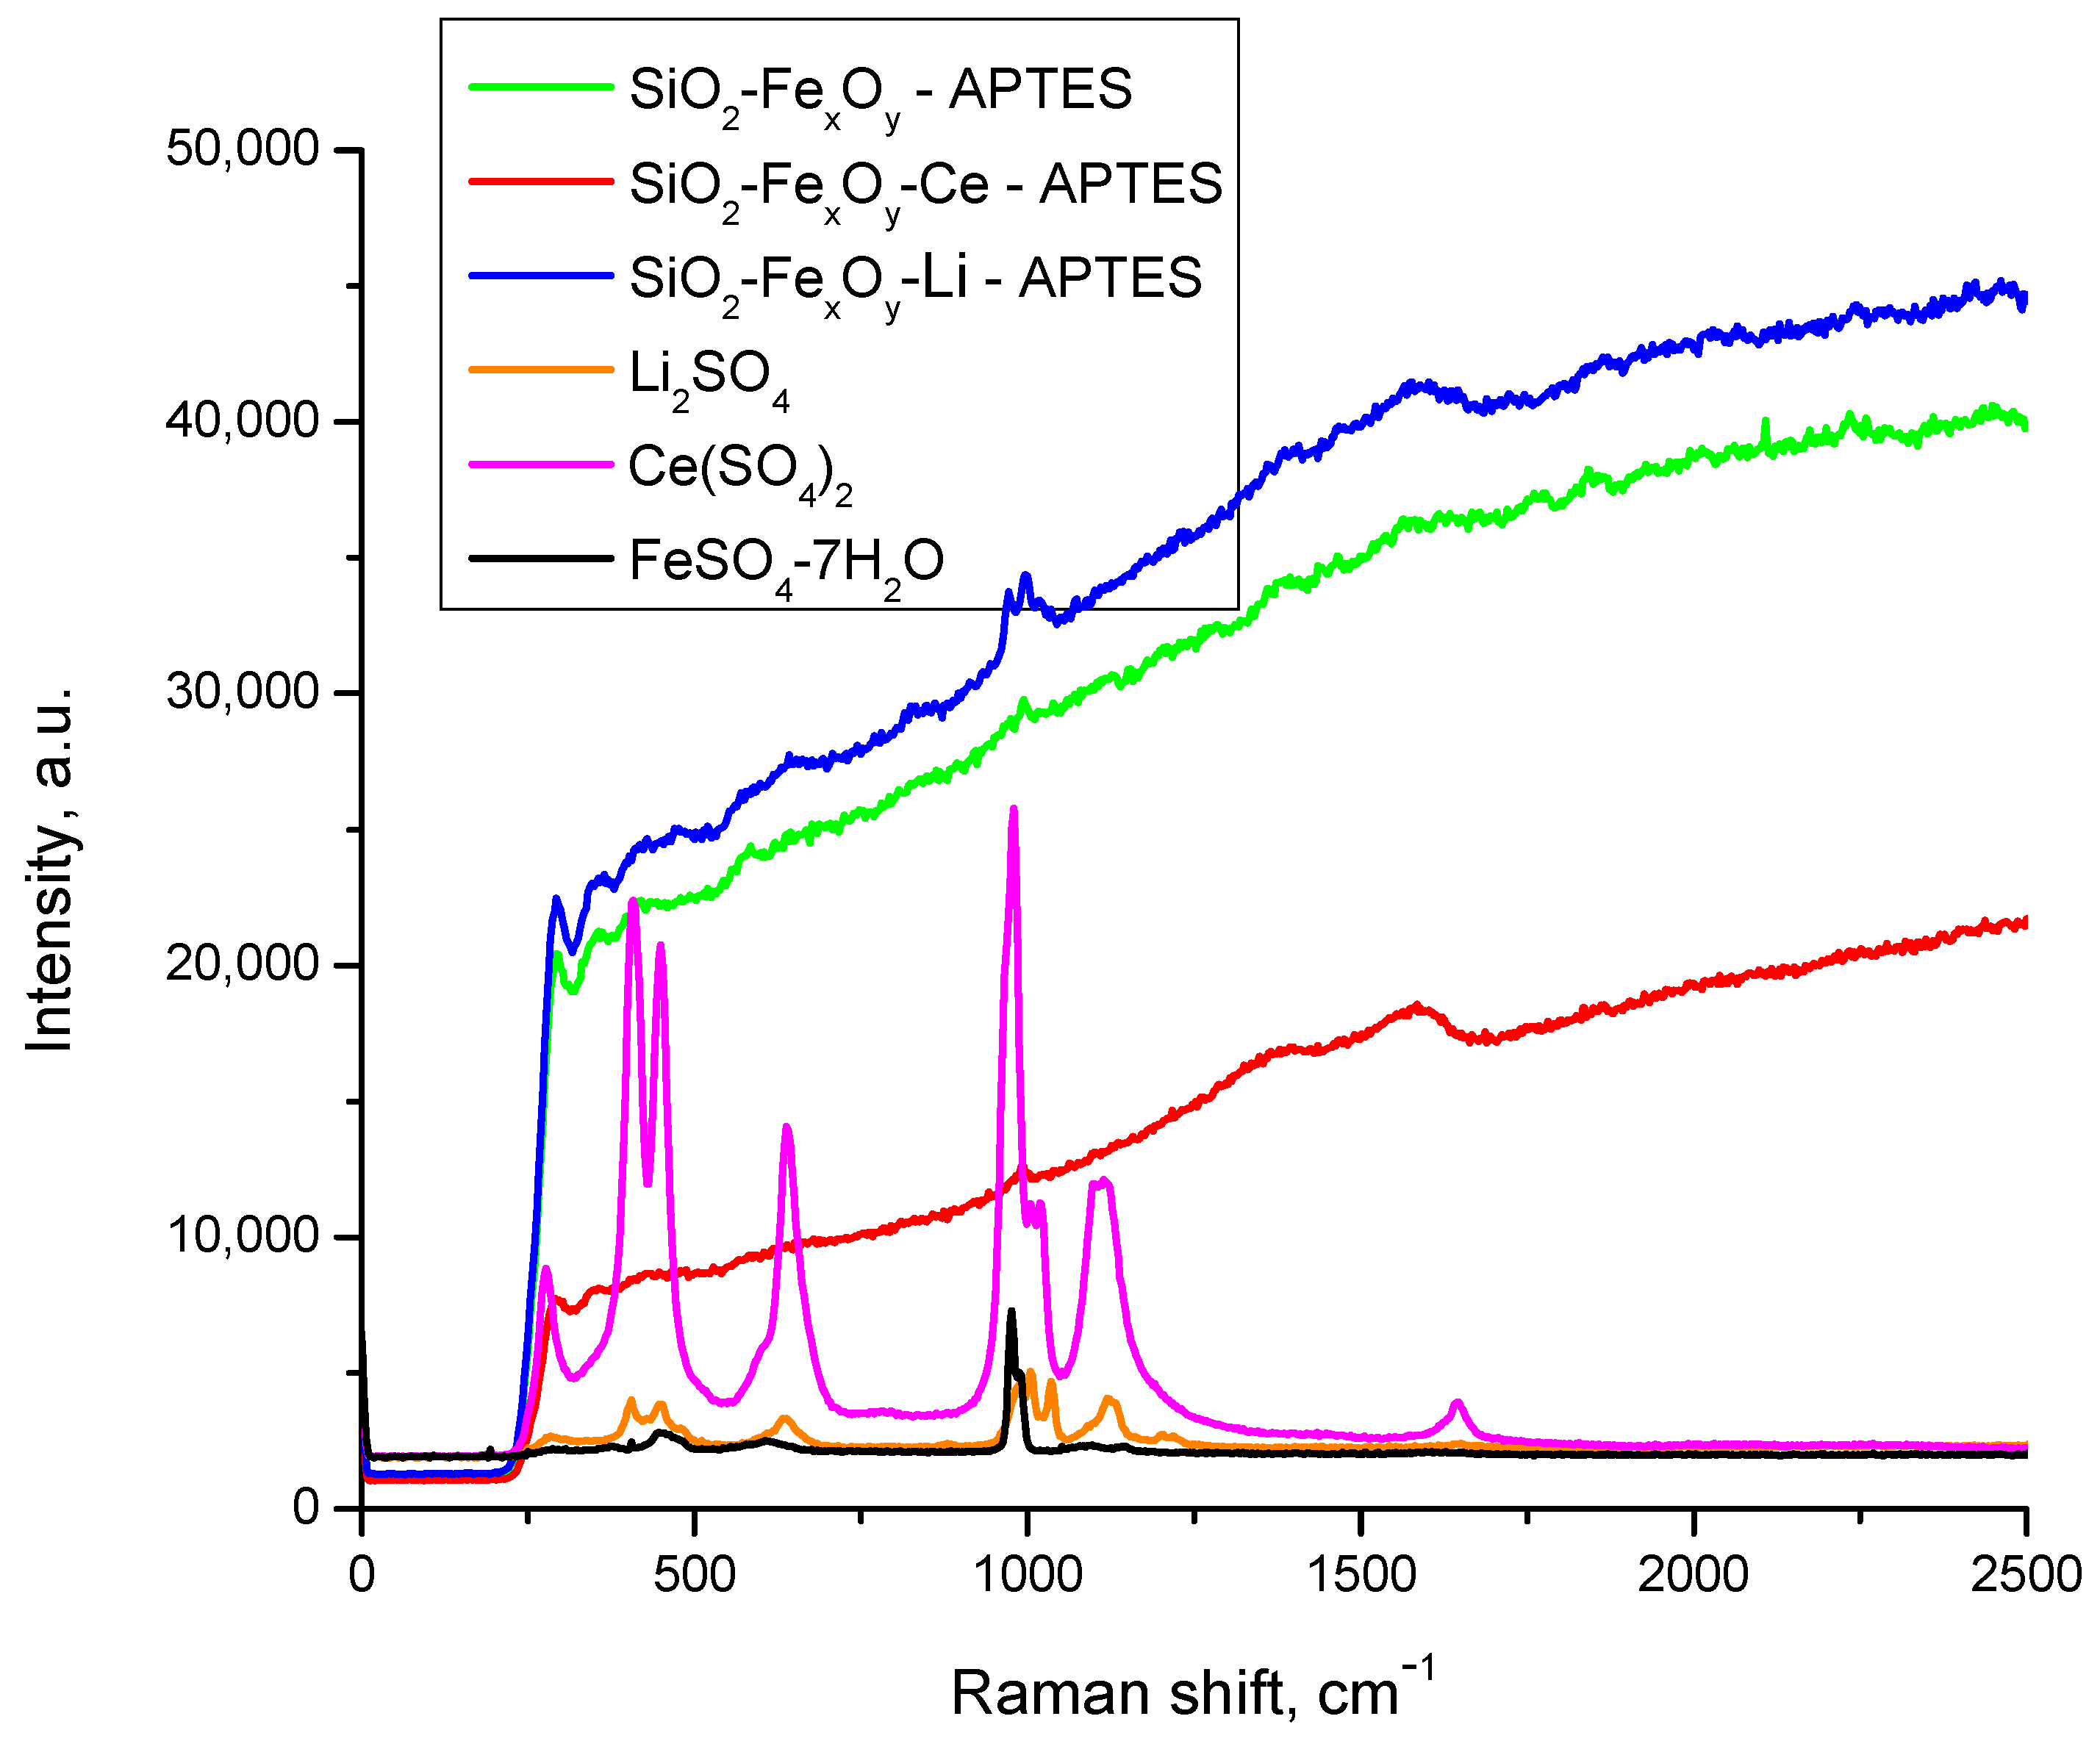
3.1.3. RAMAN Spectroscopy

The Raman spectra are presented in Figure 5. Regarding the composition of the materials, sulfate related and Si-O bonds are expected to be observed. Since Raman spectroscopy has lower accuracy regarding the metals, they are not expected to be very visible. Although, alongside Fe, other metal sources are present (Li and Ce), there are not expected to be changes between the compounds, since the metal interactions are usually weak and the added content is relatively small in concentration. The intensity of the aforementioned peaks may also vary, since some of the materials are exhibiting higher fluorescence, making it difficult to distinguish the existent bands. Spectra of the starting materials (FeSO4·7H2O, Ce(SO4)2, Li2SO4) were also included for better clarity. Since there are similarities for all compounds, in the 900–1100 cm−1 region, the vibrations characteristic for SO42− anion shows a symmetric and asymmetric S−O stretching mode. In the 450–1100 cm−1 region, due to sulfate–water interactions, a symmetric and asymmetric O−S−O bending mode takes place [45,46,47].
After the synthesis, all the materials showed increased fluorescence as a result of changes in the structure with the introduction of TEOS; however, the main peaks found in precursors are still present but slightly shifted. The changes are present due to the different water molecule and SO4 content [48], resulting in ionic association as a consequence of the water and sulfate ions interaction [47,49]. Starting from the salts in aqueous media, together with additional solvents and water, to the final step involving the crystallization of the sol–gel method, ionic association plays an important role regarding the outcome of the existent bands and their appearance [47]. It should also be mentioned, however, that that the Si-O specific peaks are in the same regions as related in previous literature [50]. Rull (1995), on the other hand points, out the presence of rototranslational modes of the polyatomic ions and water molecules [47]. This information was attributed for the Li2SO4 material; whereas, at the same time, he compared several spectra of Li2SO4 that resulted in lower intensity and increasing asymmetry with the concentration decrease. However, the low band around 380 cm−1 is presumed to belong to the Li–water stretching vibration [47], which also corresponds to the other metal-containing precursors (Ce and Fe). The influence of hydrogen or water content in the material was emphasized by Gorelik et al., whereas it is clear that the obtained spectra show different band intensities depending on their constituents [49].
A related study involving water influence was reported by Le Losq et al. (2015) regarding the hydrous alkali silicate glasses. They claimed that the increase in the ionic radius of component alkali resulted in a decrease in the O-O distances of H2O and OH-containing groups, which further led to perturbances of the assigned O-H stretching vibrations [50]. In the same study, the band near 800 cm−1 changes its intensity with the change of water content; still, its shape is not influenced, as this band may arise from vibrations involving the motion of the Si in its oxygen cage. Aside from the Si band, other bands and shoulders between 450–650 cm−1 are expected due to the water content of the glasses as well as due to the presence of different type of alkali metal.
Figure 6 shows the Raman spectra after functionalization with APTES. After the introduction of APTES in the material, the Raman spectra of the obtained compounds still show high fluorescence due to the main content of Si-O in the material, which also exhibits preponderant amorphic crystallinity, resulting in reduced clarity of some regions regarding the presence or absence of the specific peaks. However, there are some small changes observed after the introduction of APTES, the main difference being the presence of the NH2 peak, which is expected to be seen in multiple regions—1650–1550 cm−1 and 1370–1000 cm−1 (deformation vibrations)—together with a NH3 rocking vibration at 950–590 cm−1. The fact that present frequencies are lower due to the coordination and subsequent weakening of the N- H bond should be highlighted [51]. The aforementioned bands are visible in the spectra, hence more as a “shoulder” due to the fluorescence effect.

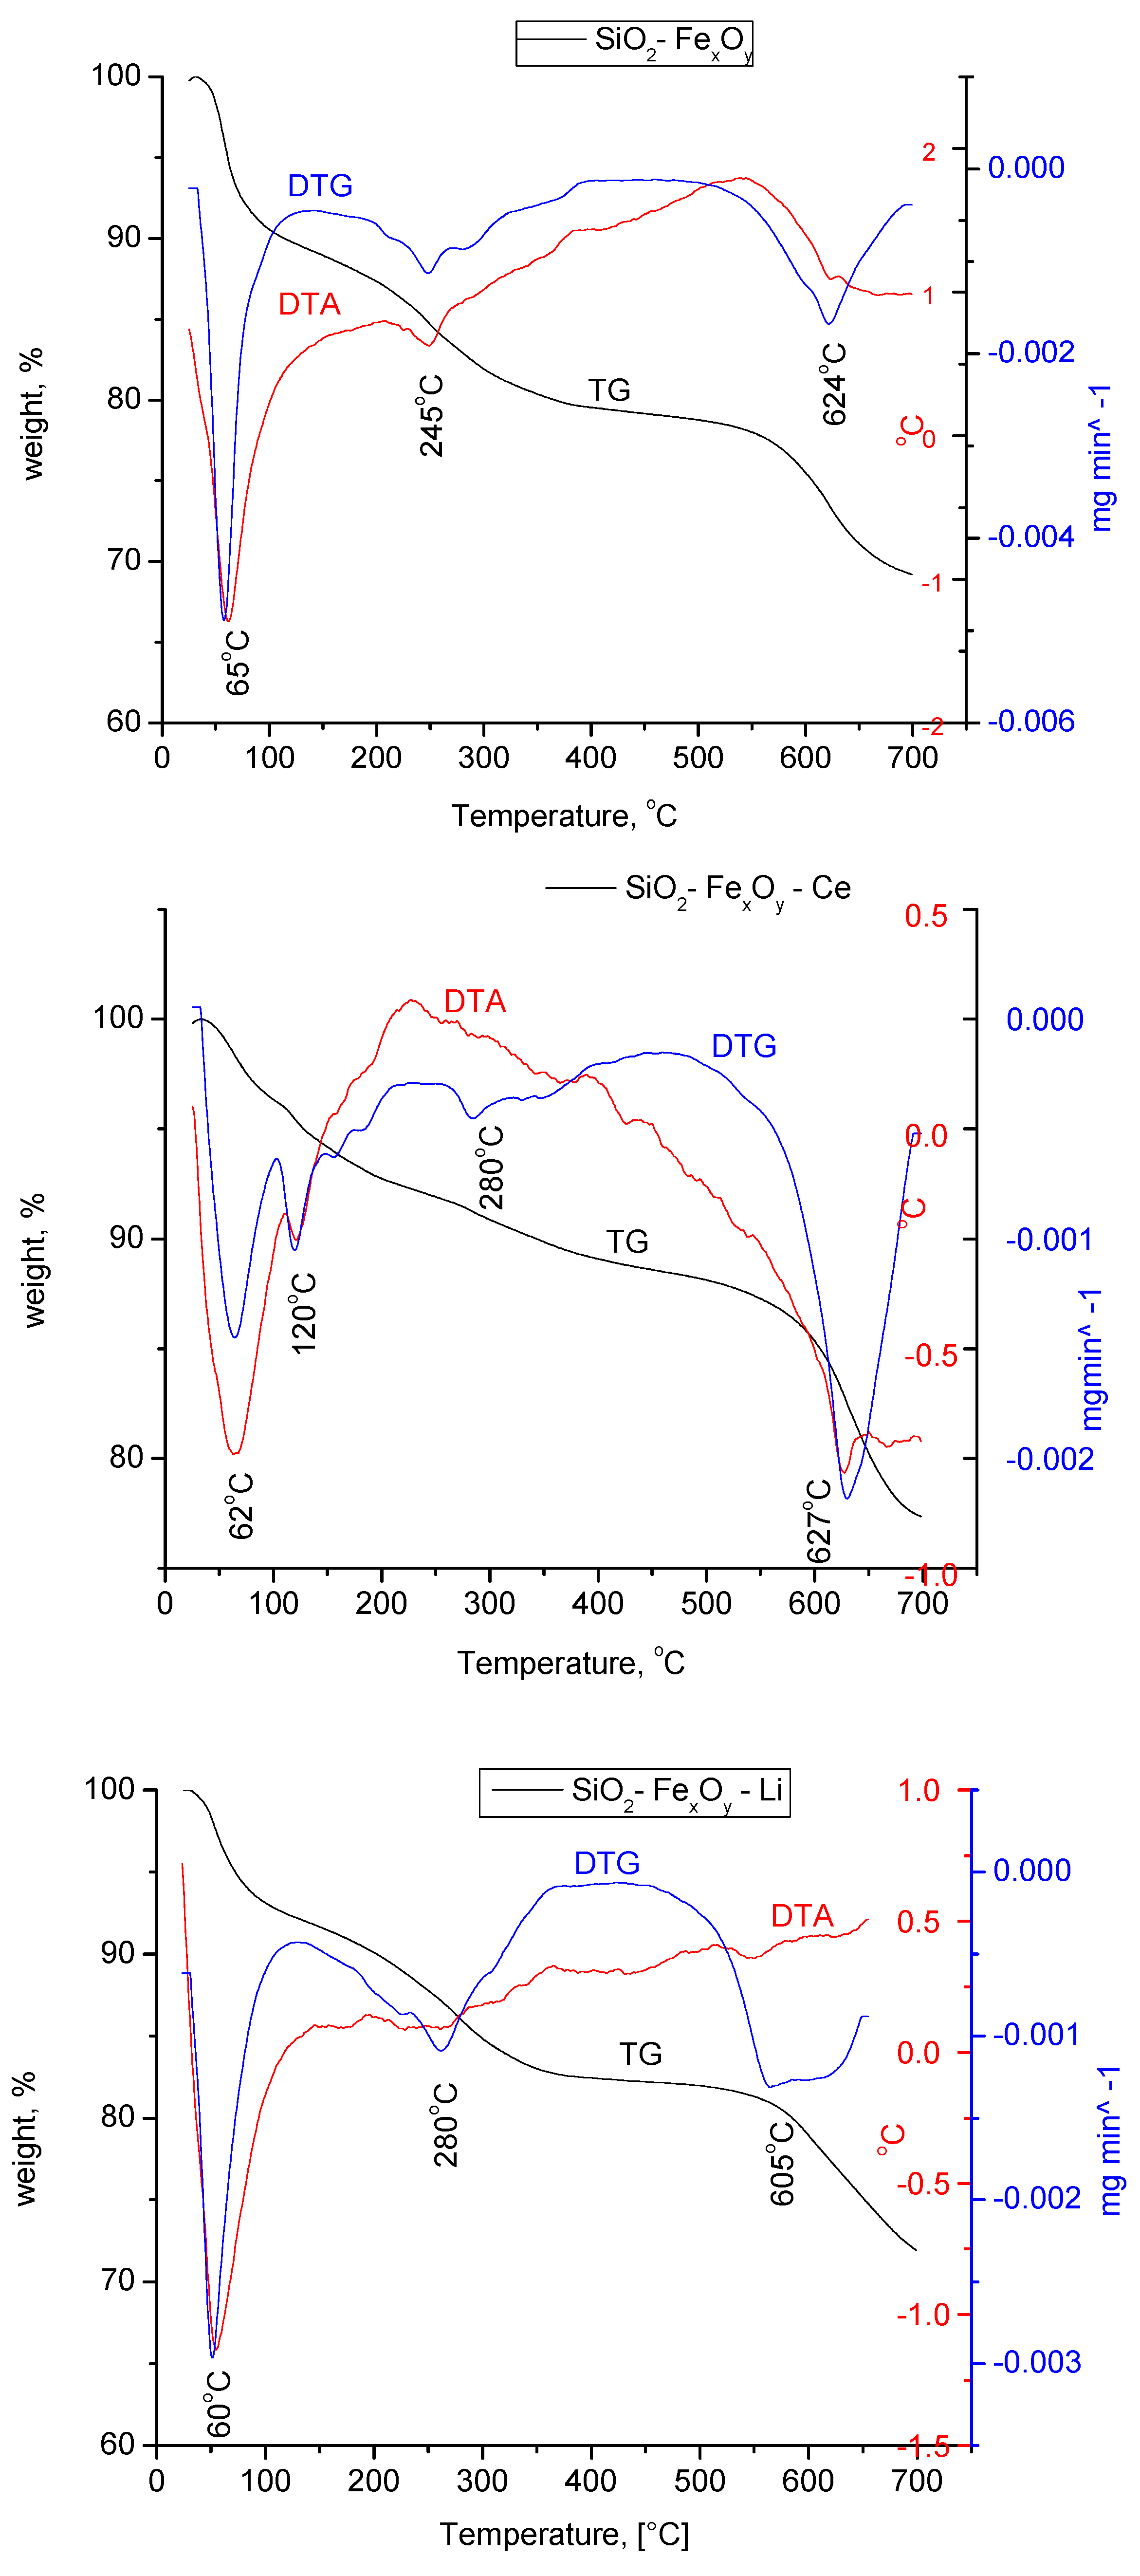
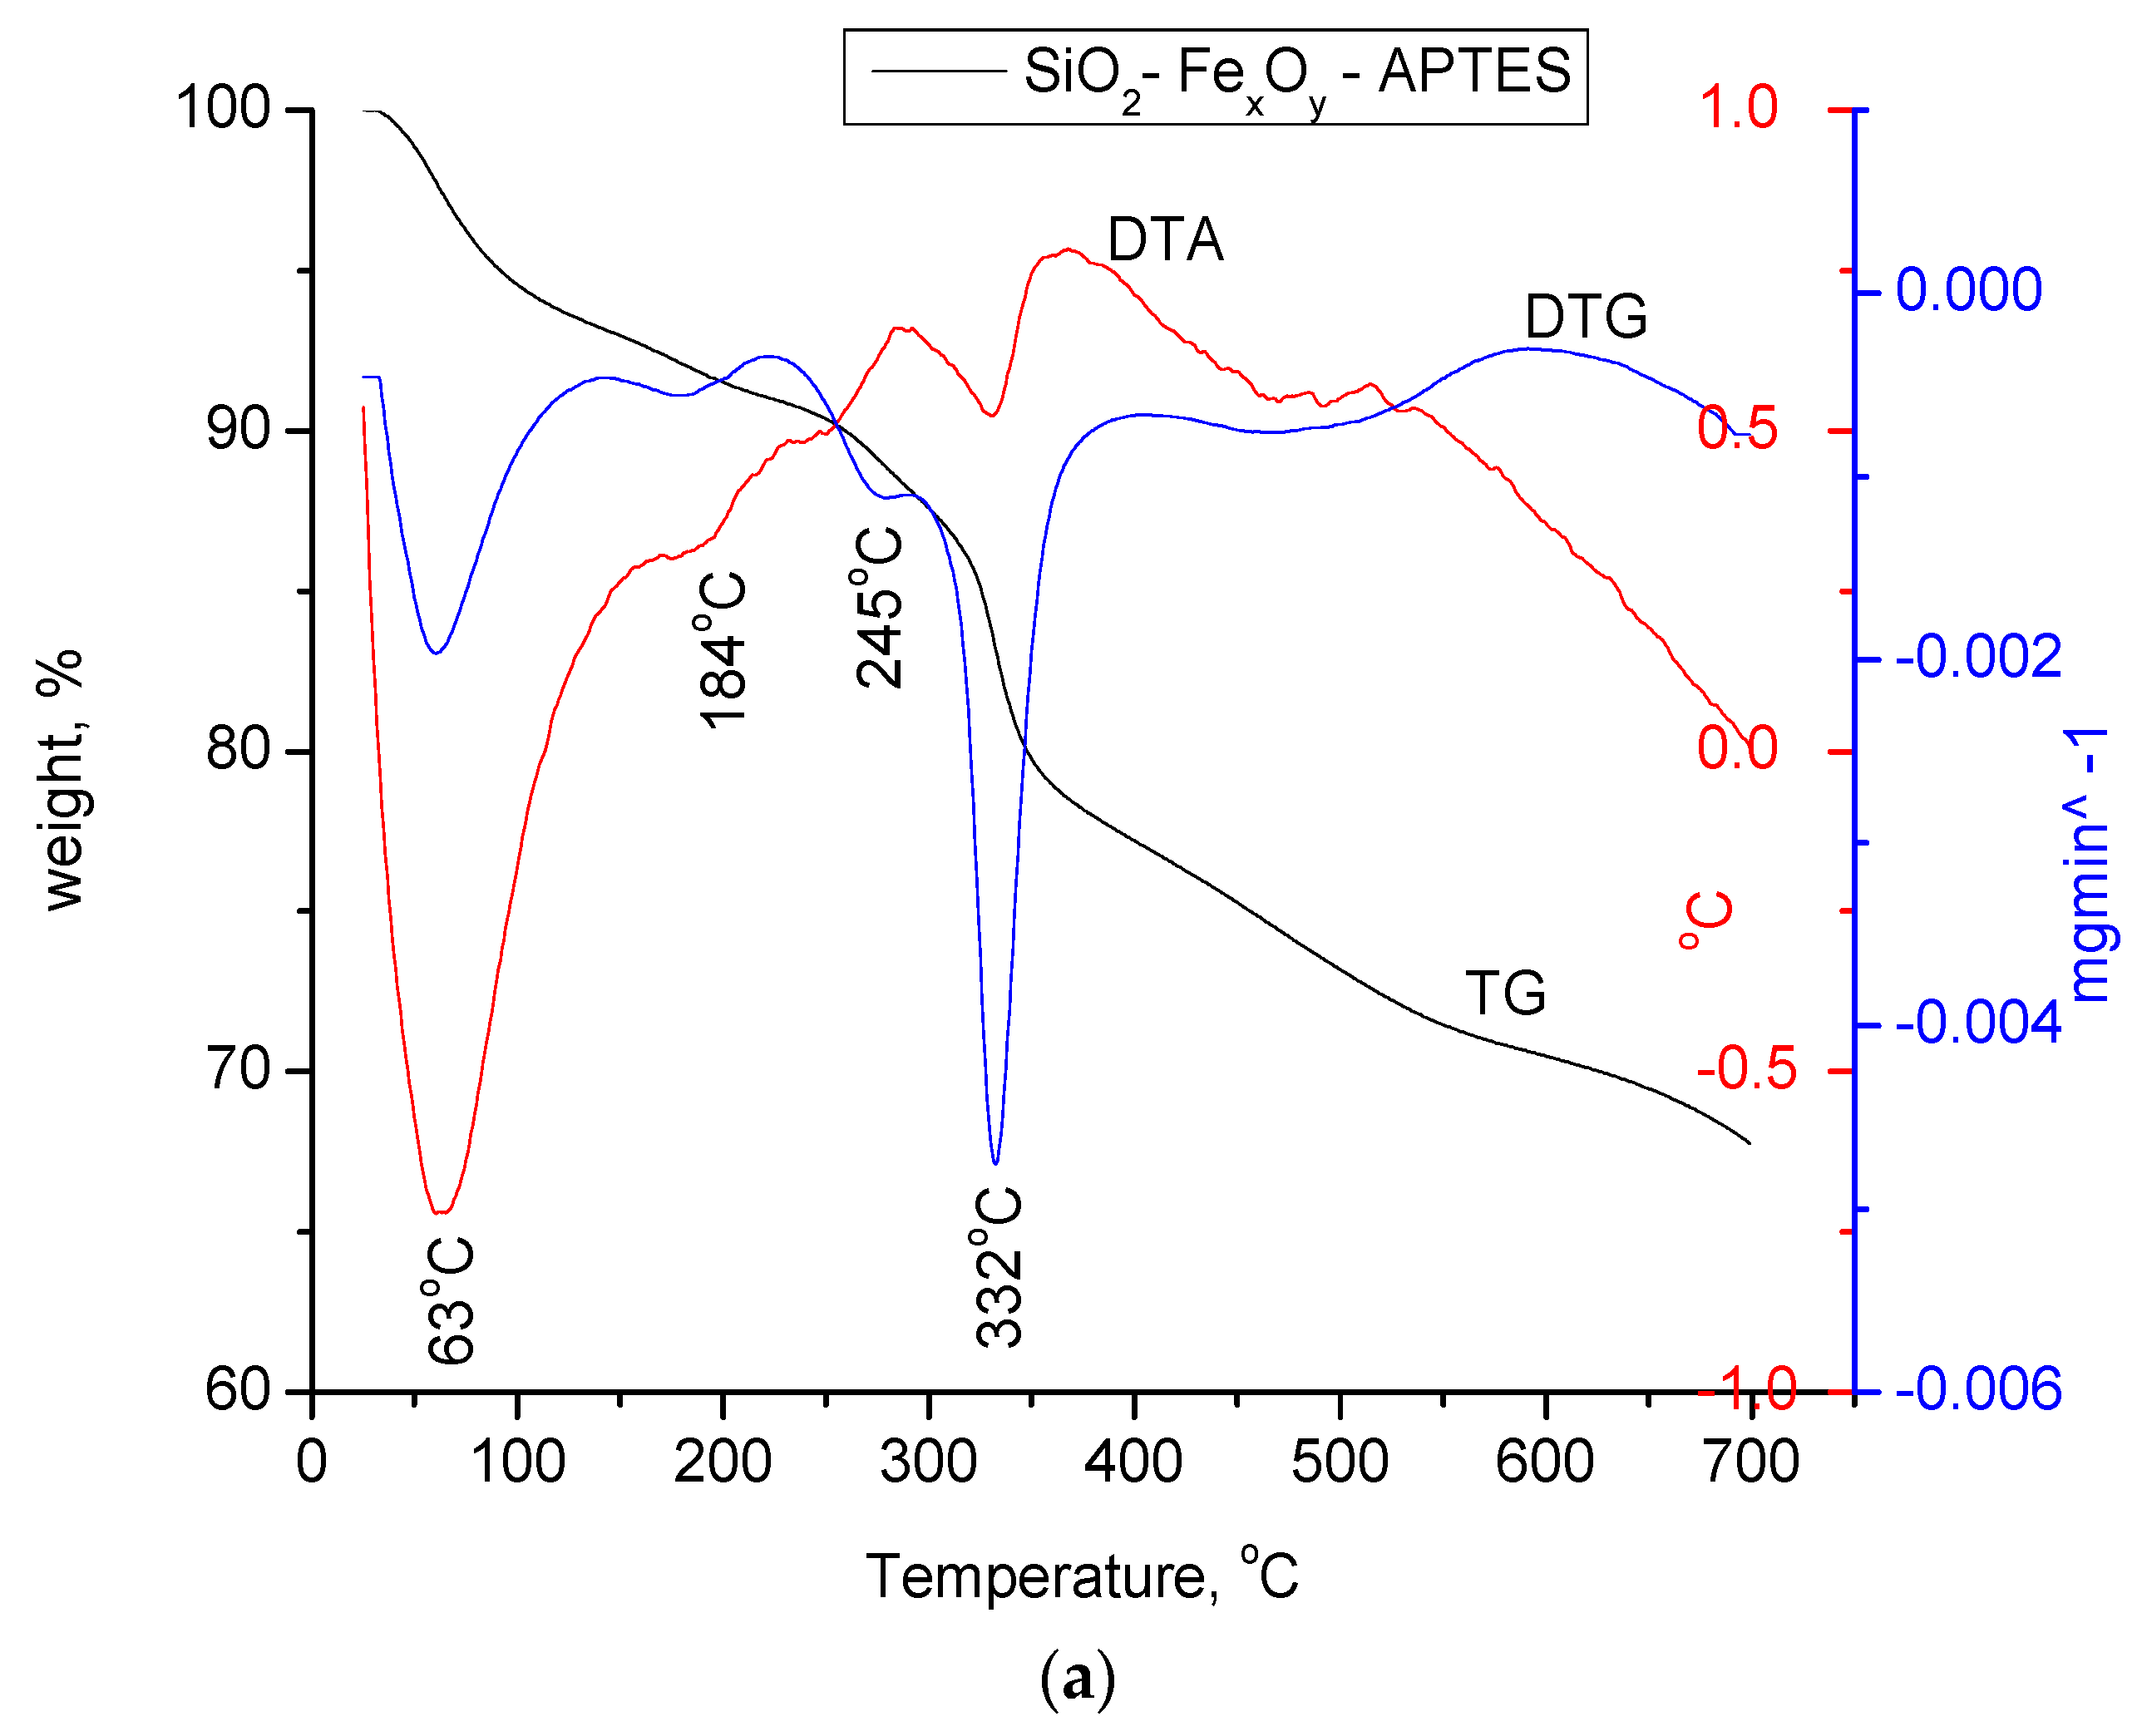
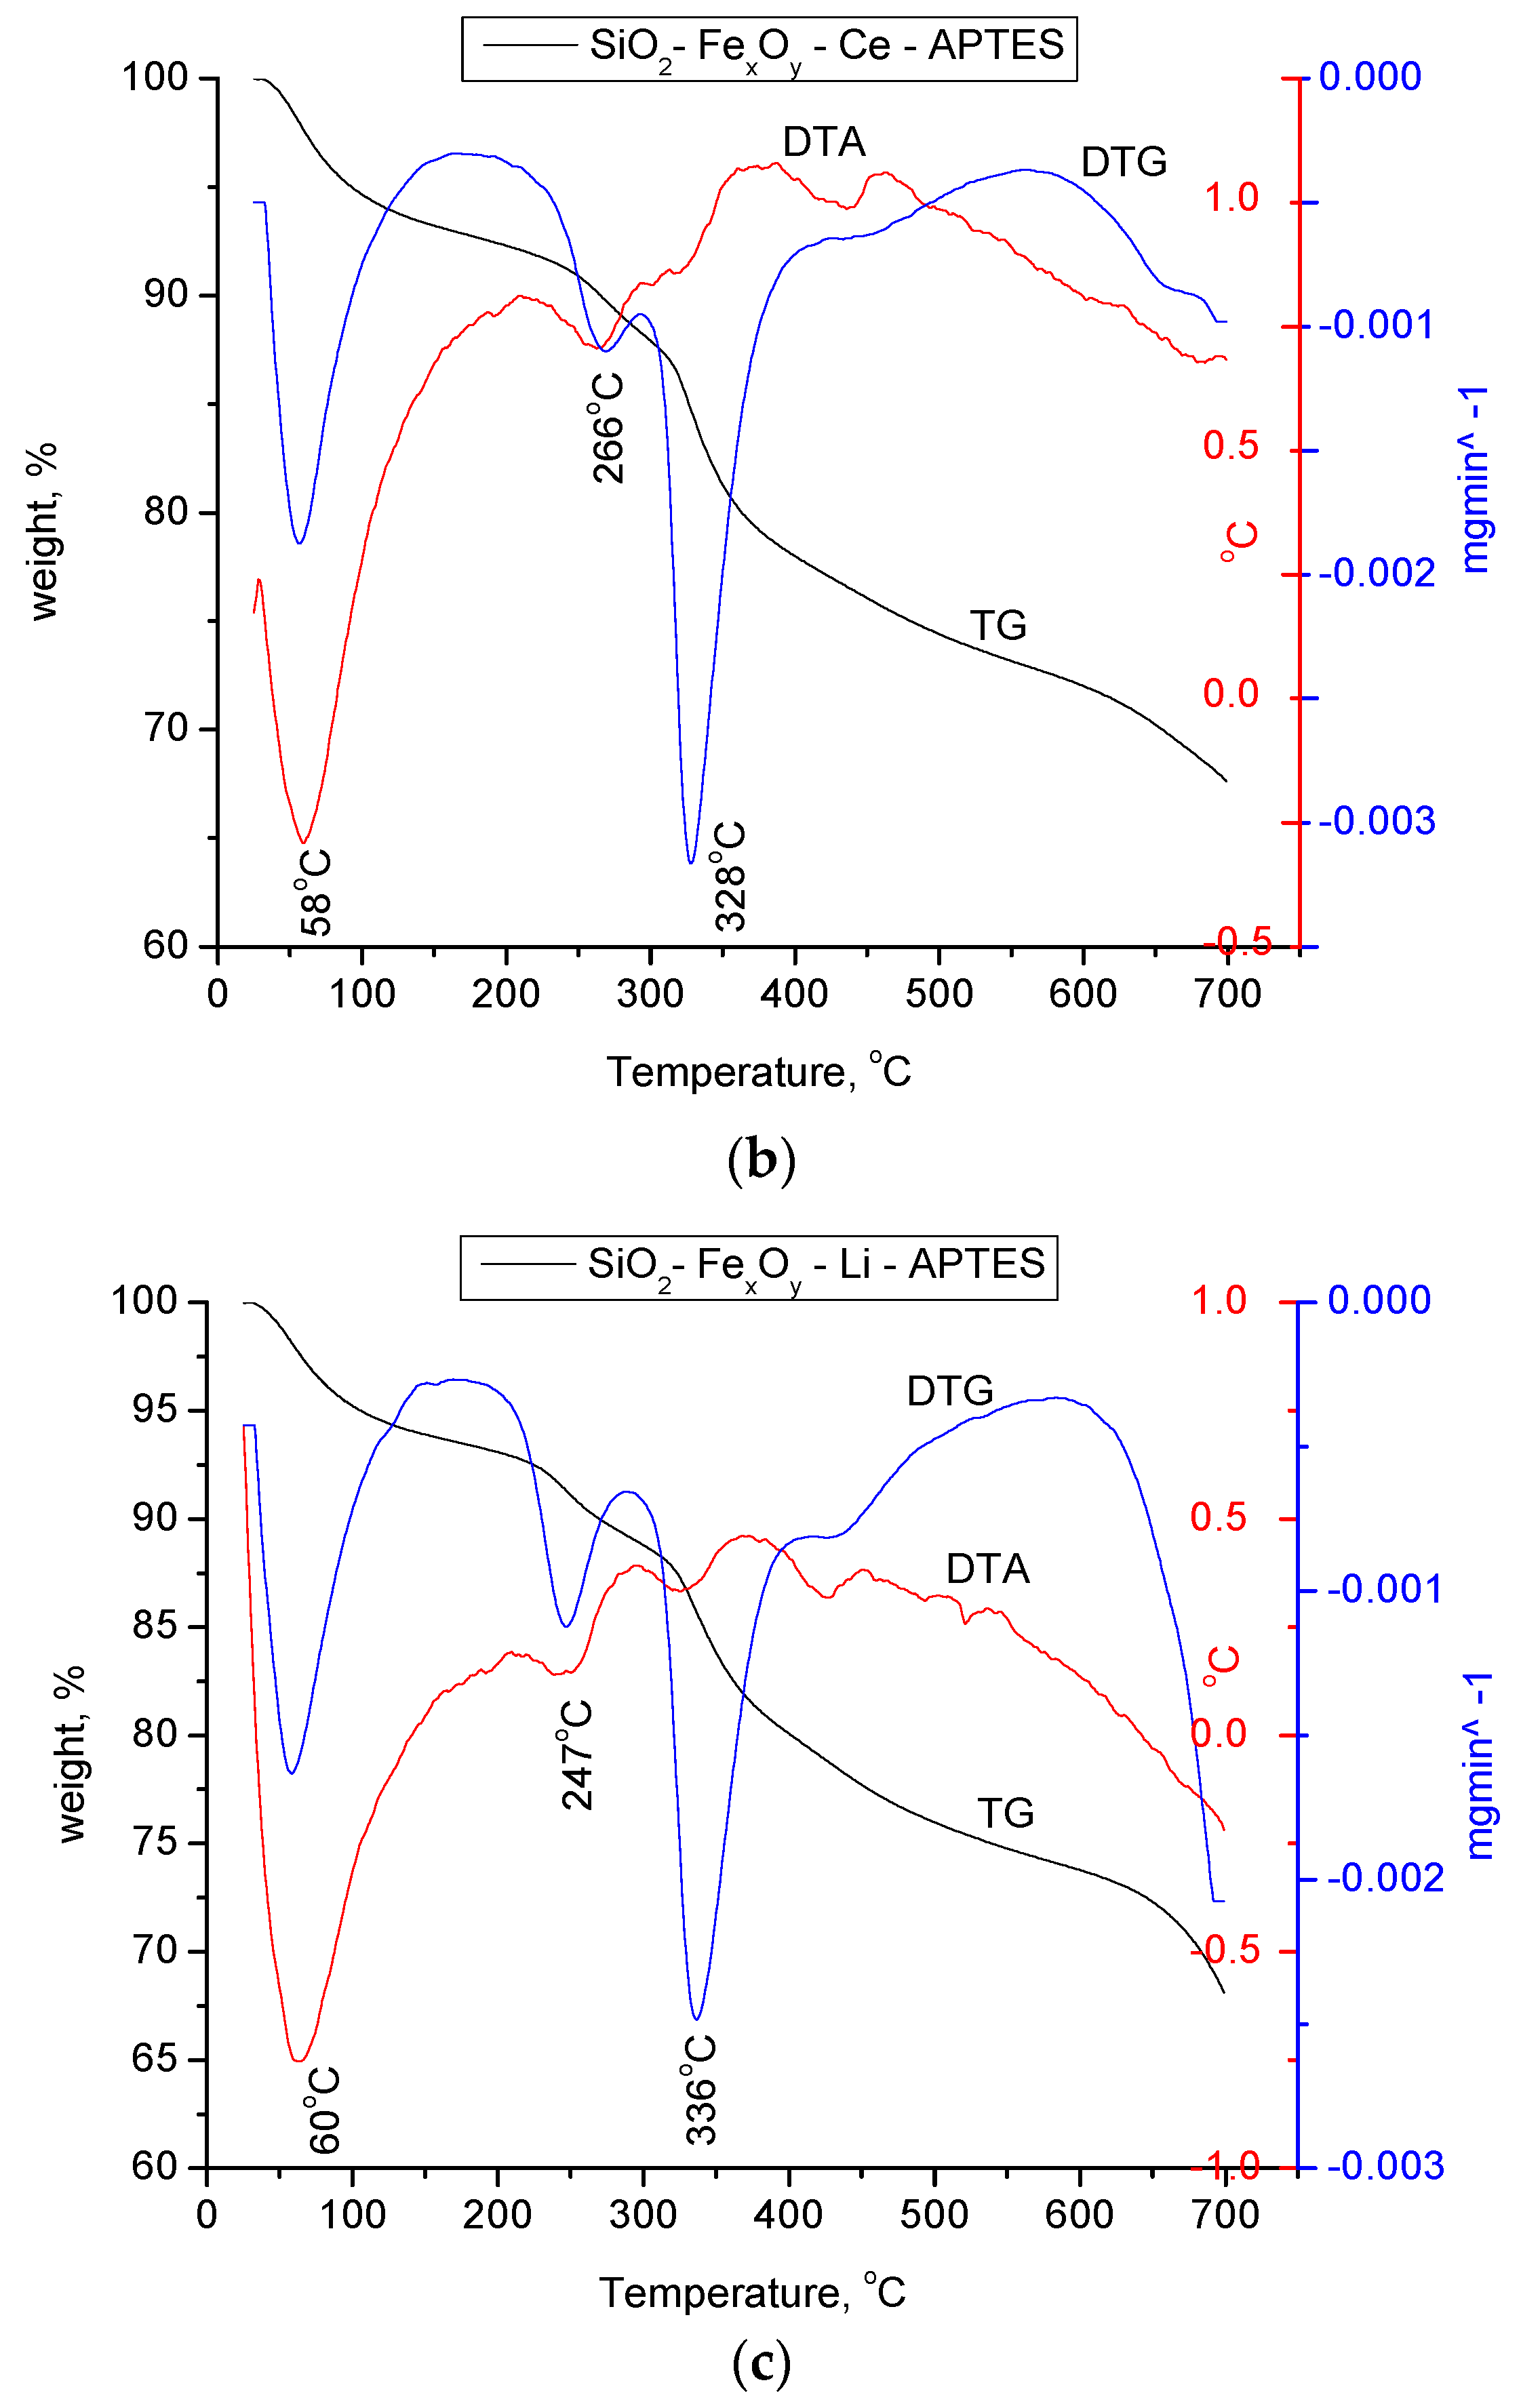
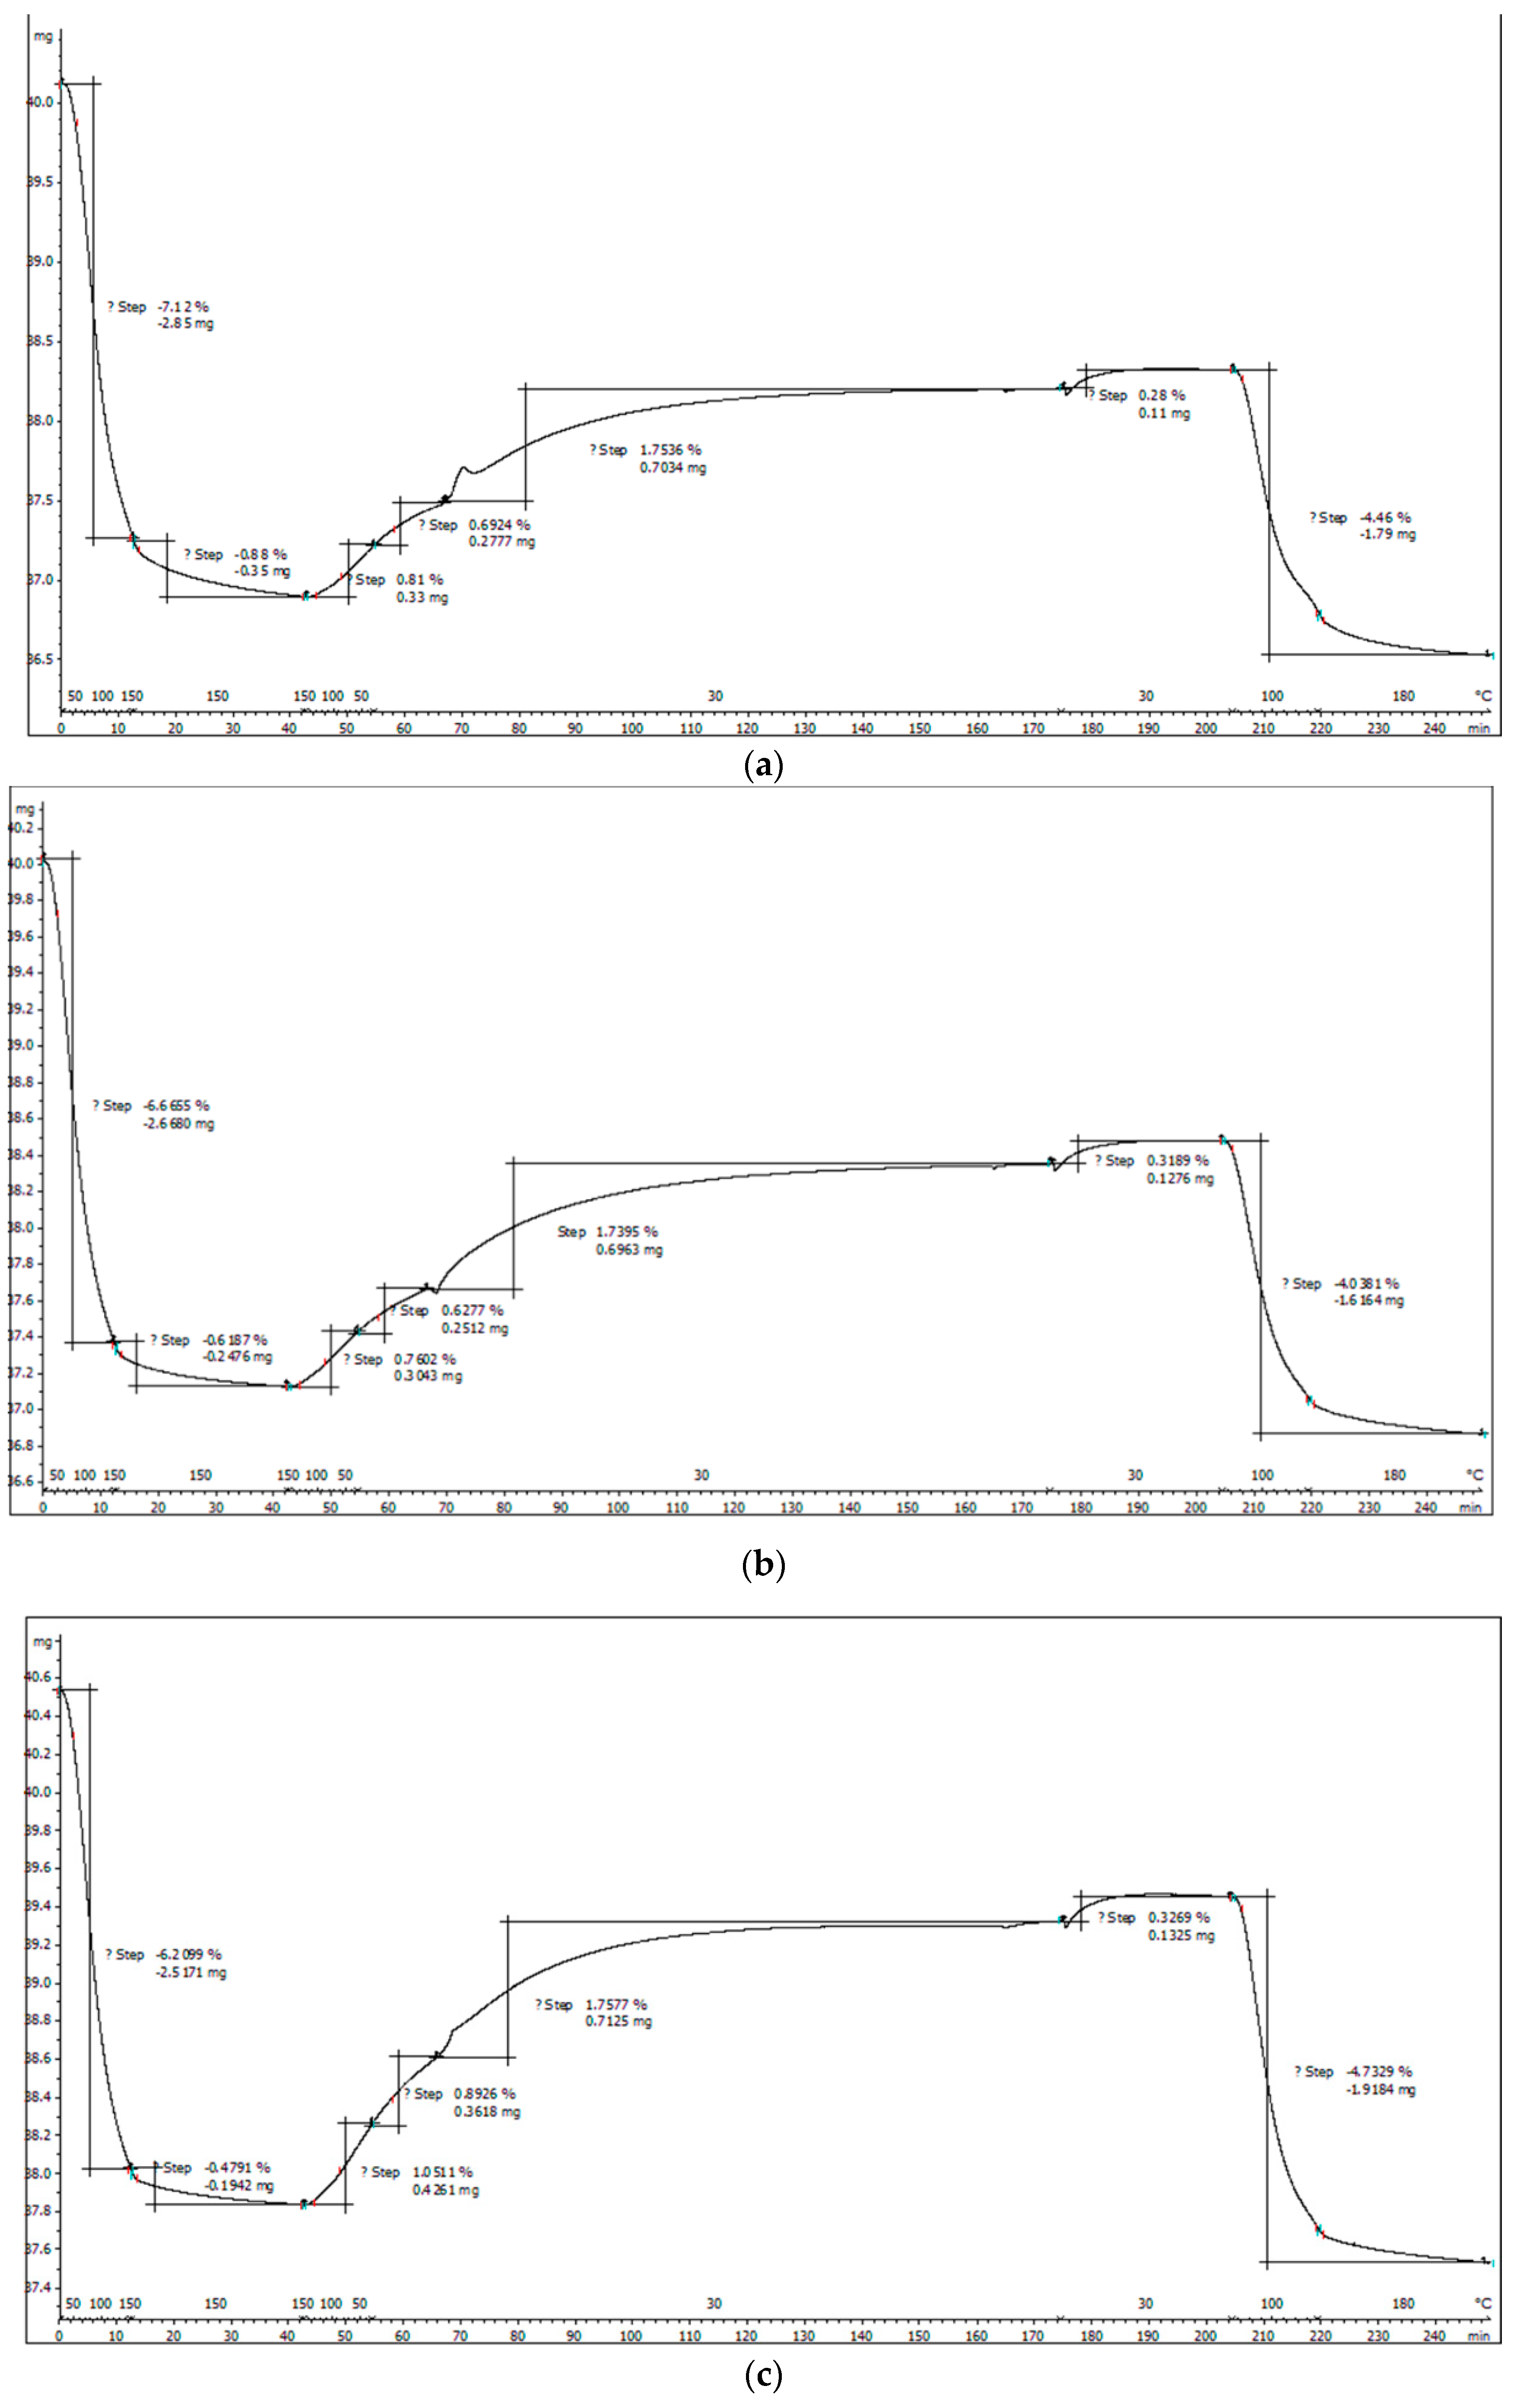
3.1.4. Thermogravimetric Analysis

From Figure 7, we can pursue the stability and structural changes that occur in the synthesized materials. It can be seen that the basic sample, SiO2−FexOy, indicates a total loss of 30%. The decomposition of the material takes place in four stages. The first part of the process indicates a mass loss of 4.8% in the range of 25–150 °C specific to the physically adsorbed water and corresponding to an endothermic process at 65 °C. In the case of samples with a cerium base, a second endothermic process take place at 120 °C, which is specific to a second loss of water molecules.
According to the Fe sulfate decomposition reactions [52], it is observed that the material keeps losing water up to temperatures of 300 °C. Thus, we can state that the endothermic process at 245 °C is specific to all chemically closely bound water. Exposed processes are specific to the silica in the material.
70−100 °C:
FeSO4 6H2O → FeSO4·4H2O + 2H2O;
95−190 °C:
FeSO4·4H2O → FeSO4·H2O + 3H2O;
245−310 °C:
FeSO4·H2O → FeSO4 + H2O.
In the last stage of decomposition, the material shows two prominent endothermic processes specific to the decomposition of iron sulfate and its transformation into α−Fe2O3 according to the reactions:
525−650 °C:
6FeSO4 → Fe2(SO4)3 + 2Fe2O3 + 2SO2;
625−710 °C:
Fe2(SO4)3 → Fe2O3 + 3SO2 + 3/2O2.
The specific mass loss in the temperature range 450–700 °C can also be attributed to the oligomeric siloxanes, assuming that the Si–O and Si–C bonds reorganize [53].
It is observed that after the introduction of cerium sulfate and lithium sulfate, the material shows important structural changes, having a total loss of 22% and 28%, respectively. The changes that take place in materials show the transformation of cerium sulfate and lithium sulfate into cerium silicates and lithium silicates, respectively, which is also confirmed by XRD analysis.
In Figure 8a–c, the materials functionalized with APTES were thermally analyzed in nitrogen atmosphere and compared to the initial nonfunctionalized samples.
For amino-functionalized samples, two endothermic processes at 63 and 184 °C are observed in the temperature range of 25 to 200 °C, specifically for the physically adsorbed water on silica as the base material. As in the case of the initial non-functionalized samples, the material keeps losing water up to temperatures of 300 °C which takes place in accordance with the decomposition reactions of Fe sulfate hexahydrate. For all three samples, the mass loss in the temperature range of 280–420 °C is attributed to the thermal decomposition of the aminopropyl functional group, which is highlighted by the endothermic effects located between 328 and 336 °C.

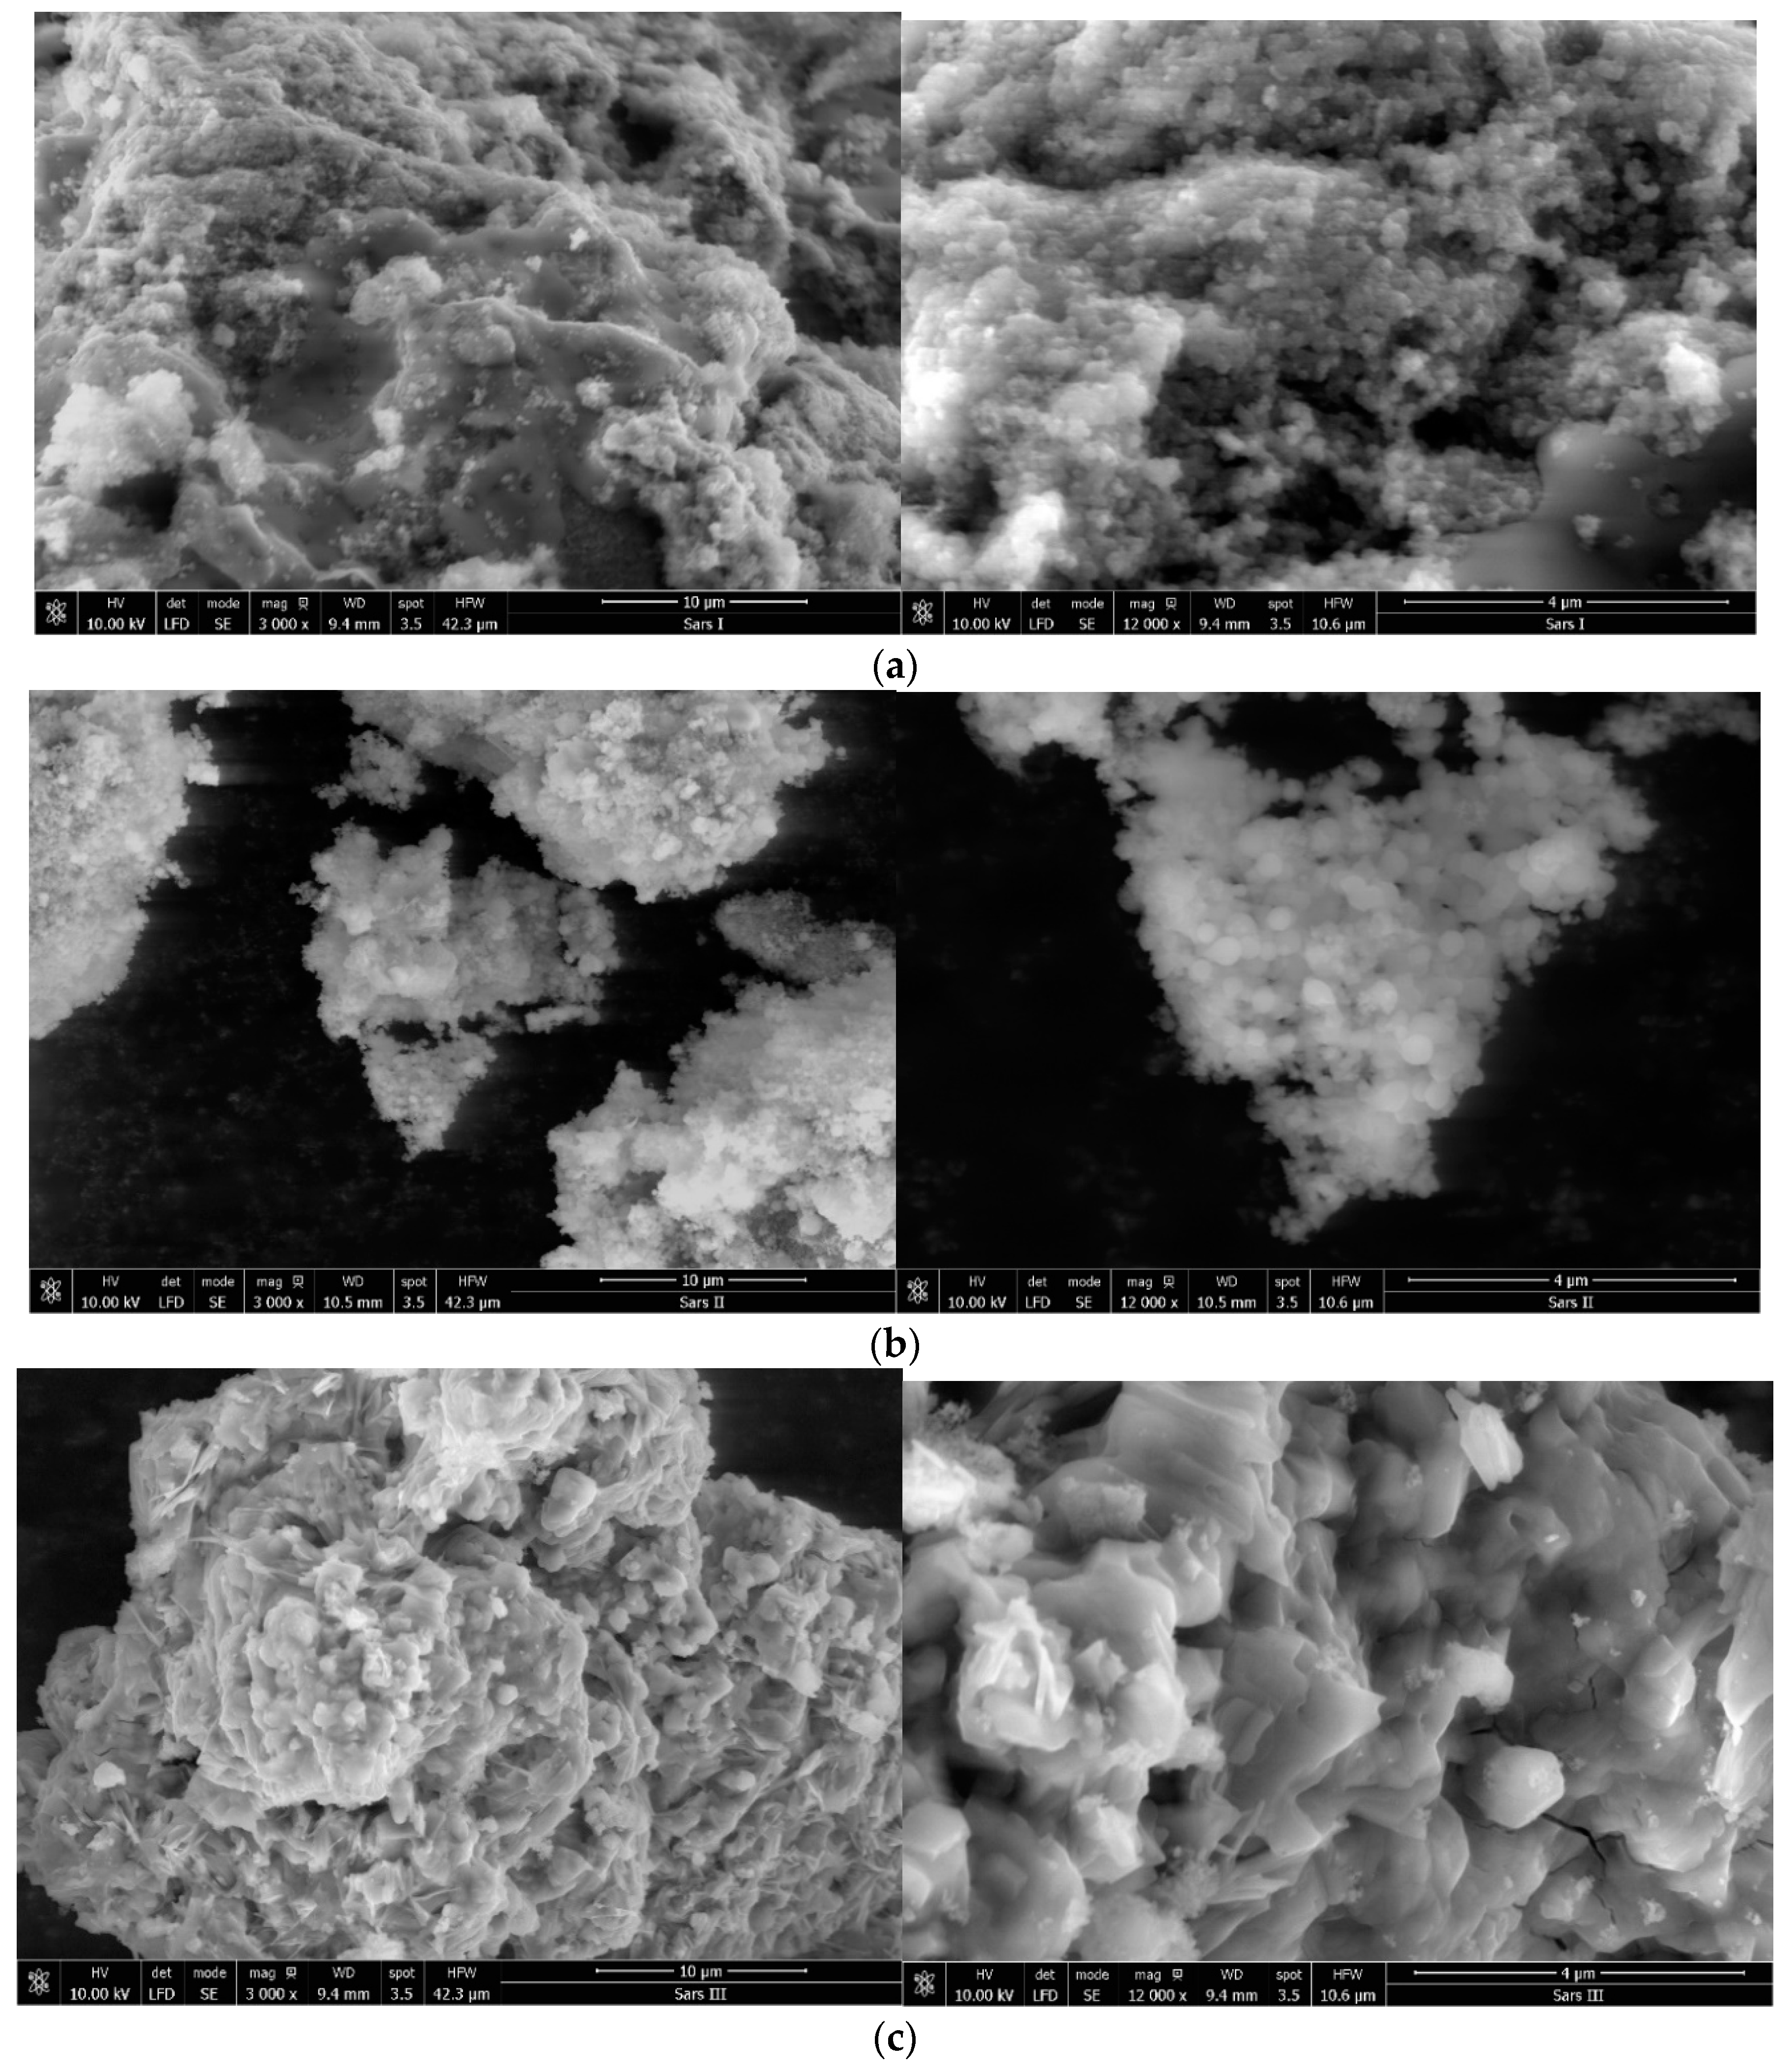
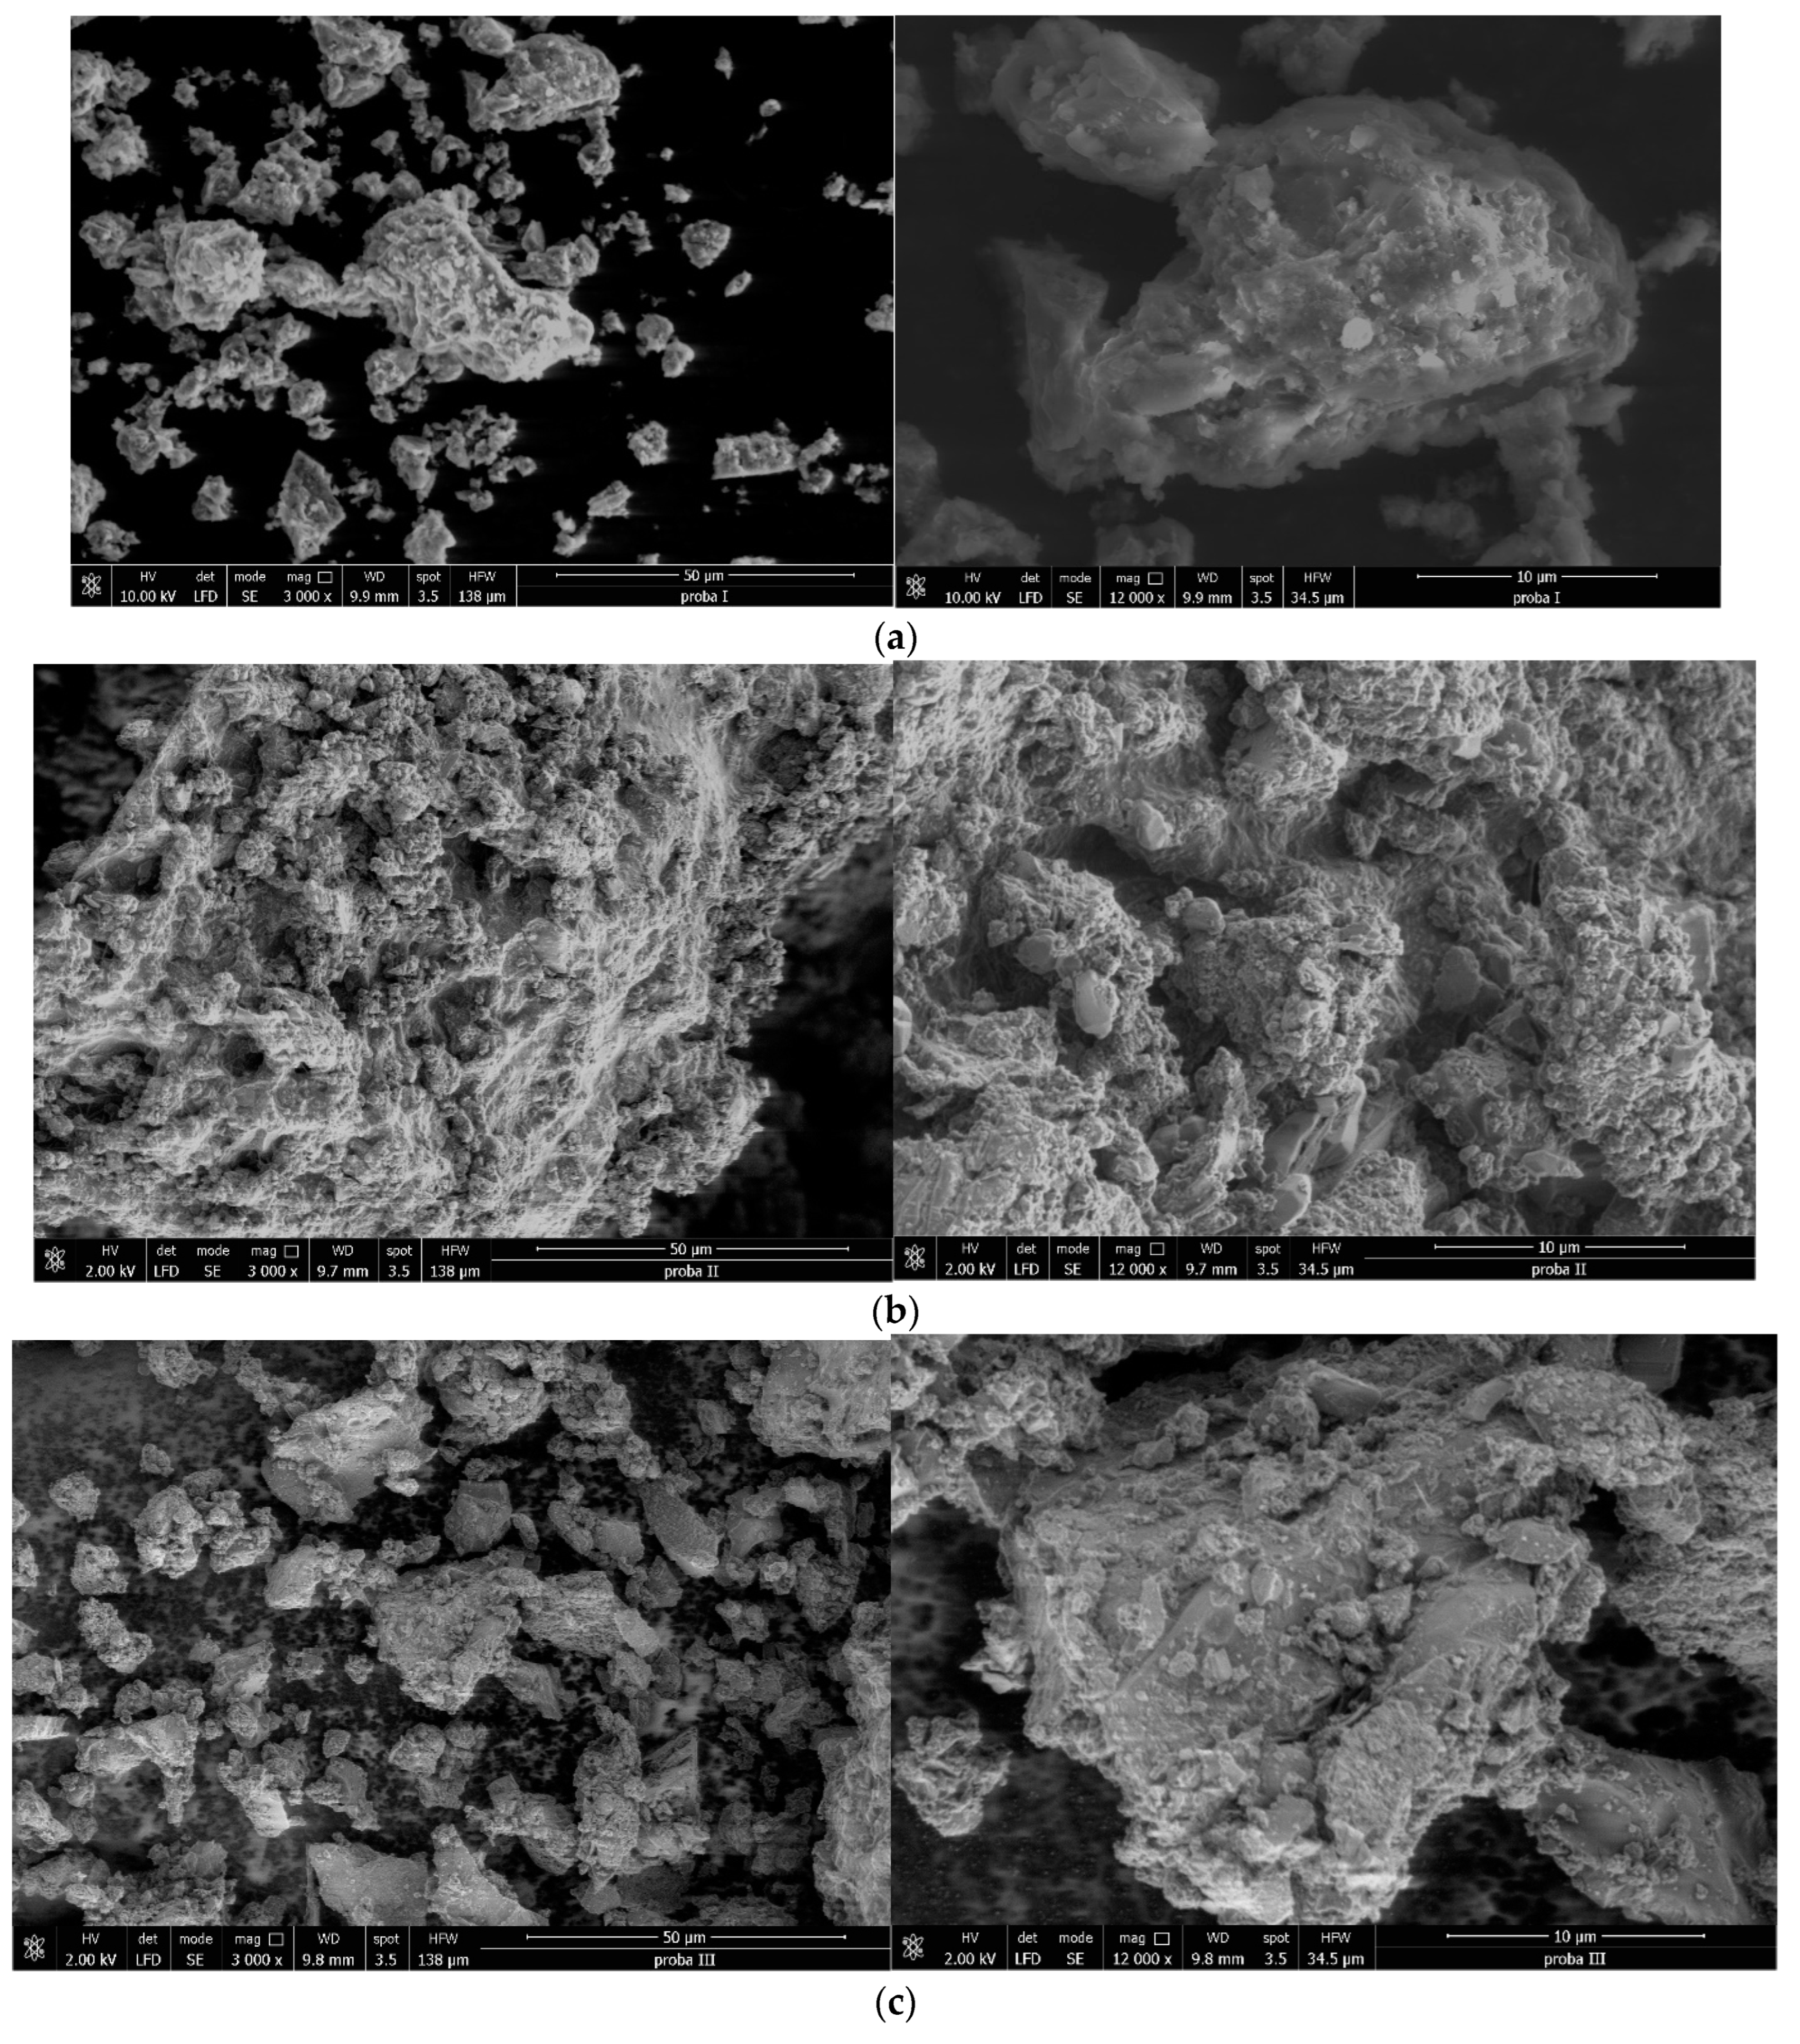
3.1.5. SEM (Scanning Electron Microscopy) Images

In Figure 9, the morphology of the materials is studied by SEM images using different magnifications: more specifically, 3000× and 12,000×.
In Figure 9a, the materials indicate that micrometric clusters are formed. It can be seen that by increasing the magnification from 3000× up to 12,000×, the shape of the particles becomes spherical. The size of the spheres is around 90 nm.
After the introduction of cerium sulfate, some changes in the structure can be observed (Figure 9b). In this case, it is noticed at 12,000× magnification that the size of the spheres increases to 100 nm, but at the same time, smaller size clusters are formed.
Therefore, after the addition of lithium sulfate, a more pronounced change in structure is detected (Figure 9c). The shape of the particles indicates overlapping plates. This material forms larger and more compact clusters.
Subsequently, the SEM images for the functionalized samples are presented in Figure 10a–c.
After the functionalization of the samples, a change in the structure can be observed. The larger clusters no longer show spherical shapes or plates. In this case, the particle size indicates a value of approximately 500 nm. Thus, we can conclude that the material presents higher rugosity after functionalization.
After adding cerium sulphate, the sample SiO2−FexOy−Ce−APTES indicates that the rugosity of sample starts to decrease, and the material is more compact. The lithium sulfate addition changes the structure of sample SiO2−FexOy−Li−APTES; it becomes more rugous, and the particles are much smaller (around 300 nm).
The cerium presence influences the morphology of the material, leading to much more spherically shaped particles, as suggested by Cardillo et al. (2013) [54]. They explain this change as a result of hindering crystal growth due to the appearance of the secondary phases of Ce-containing material. Chibison et al. (2022) suggest that the phase transition from octahedral to spherical in the case of cerium-based nanoparticles is due to the increase in their particle size [55]. Other information regarding this matter suggest that Fe-based materials doped with a transition metal or species from Group IV have an impact on the morphology; more precisely, the Si doped with iron oxide developed round-shaped particles [56]. Given this, it is clear that both Si and Ce led to the spherical morphology of the final compound.
In the case of Li, the more lamellar appearance can be attributed to the use of specific lithium-based precursor. A related example in this direction is the use of CH3COO-Li, which presented lamellar formations in comparison to the Li-OH and Li2CO3 that maintained the initial round shape of the particles [57]. Lithium content may also play an important role in the morphological change of the material since it was observed that with the increasing lithium content, particle’s size also increases. The appearance of larger crystalline blocks or palettes on the surface is also an indicator of crystal growth as a consequence of lithium in the composition [58,59].

3.1.6. Energy Dispersive Spectroscopy (EDS)

Figure S1a–c shows the EDS measurements for the obtained materials. The absence of the Li element in the EDS spectra is due to the small amount that was unable to be detected.
The EDS of the SiO2−FexOy sample indicates that the structure contains the specific elements: Si, Fe, and O. The presence of S in all materials indicates that S-O bonds are still present, as confirmed by FTIR and Raman spectroscopy. Even if the Li presence could not be detected due to the low concentration used in synthesis, the FT-IR and Raman spectroscopy show that important changes takes place in the material.
After the functionalization of the samples, a change in the EDS spectra can be observed. So, from the EDS images presented in Figure S2a–c, the existence of amino groups in the samples is confirmed by the presence of nitrogen peaks and the increased values of carbon peaks.
As in the previous case, lithium is absent from the material because of the low concentration.

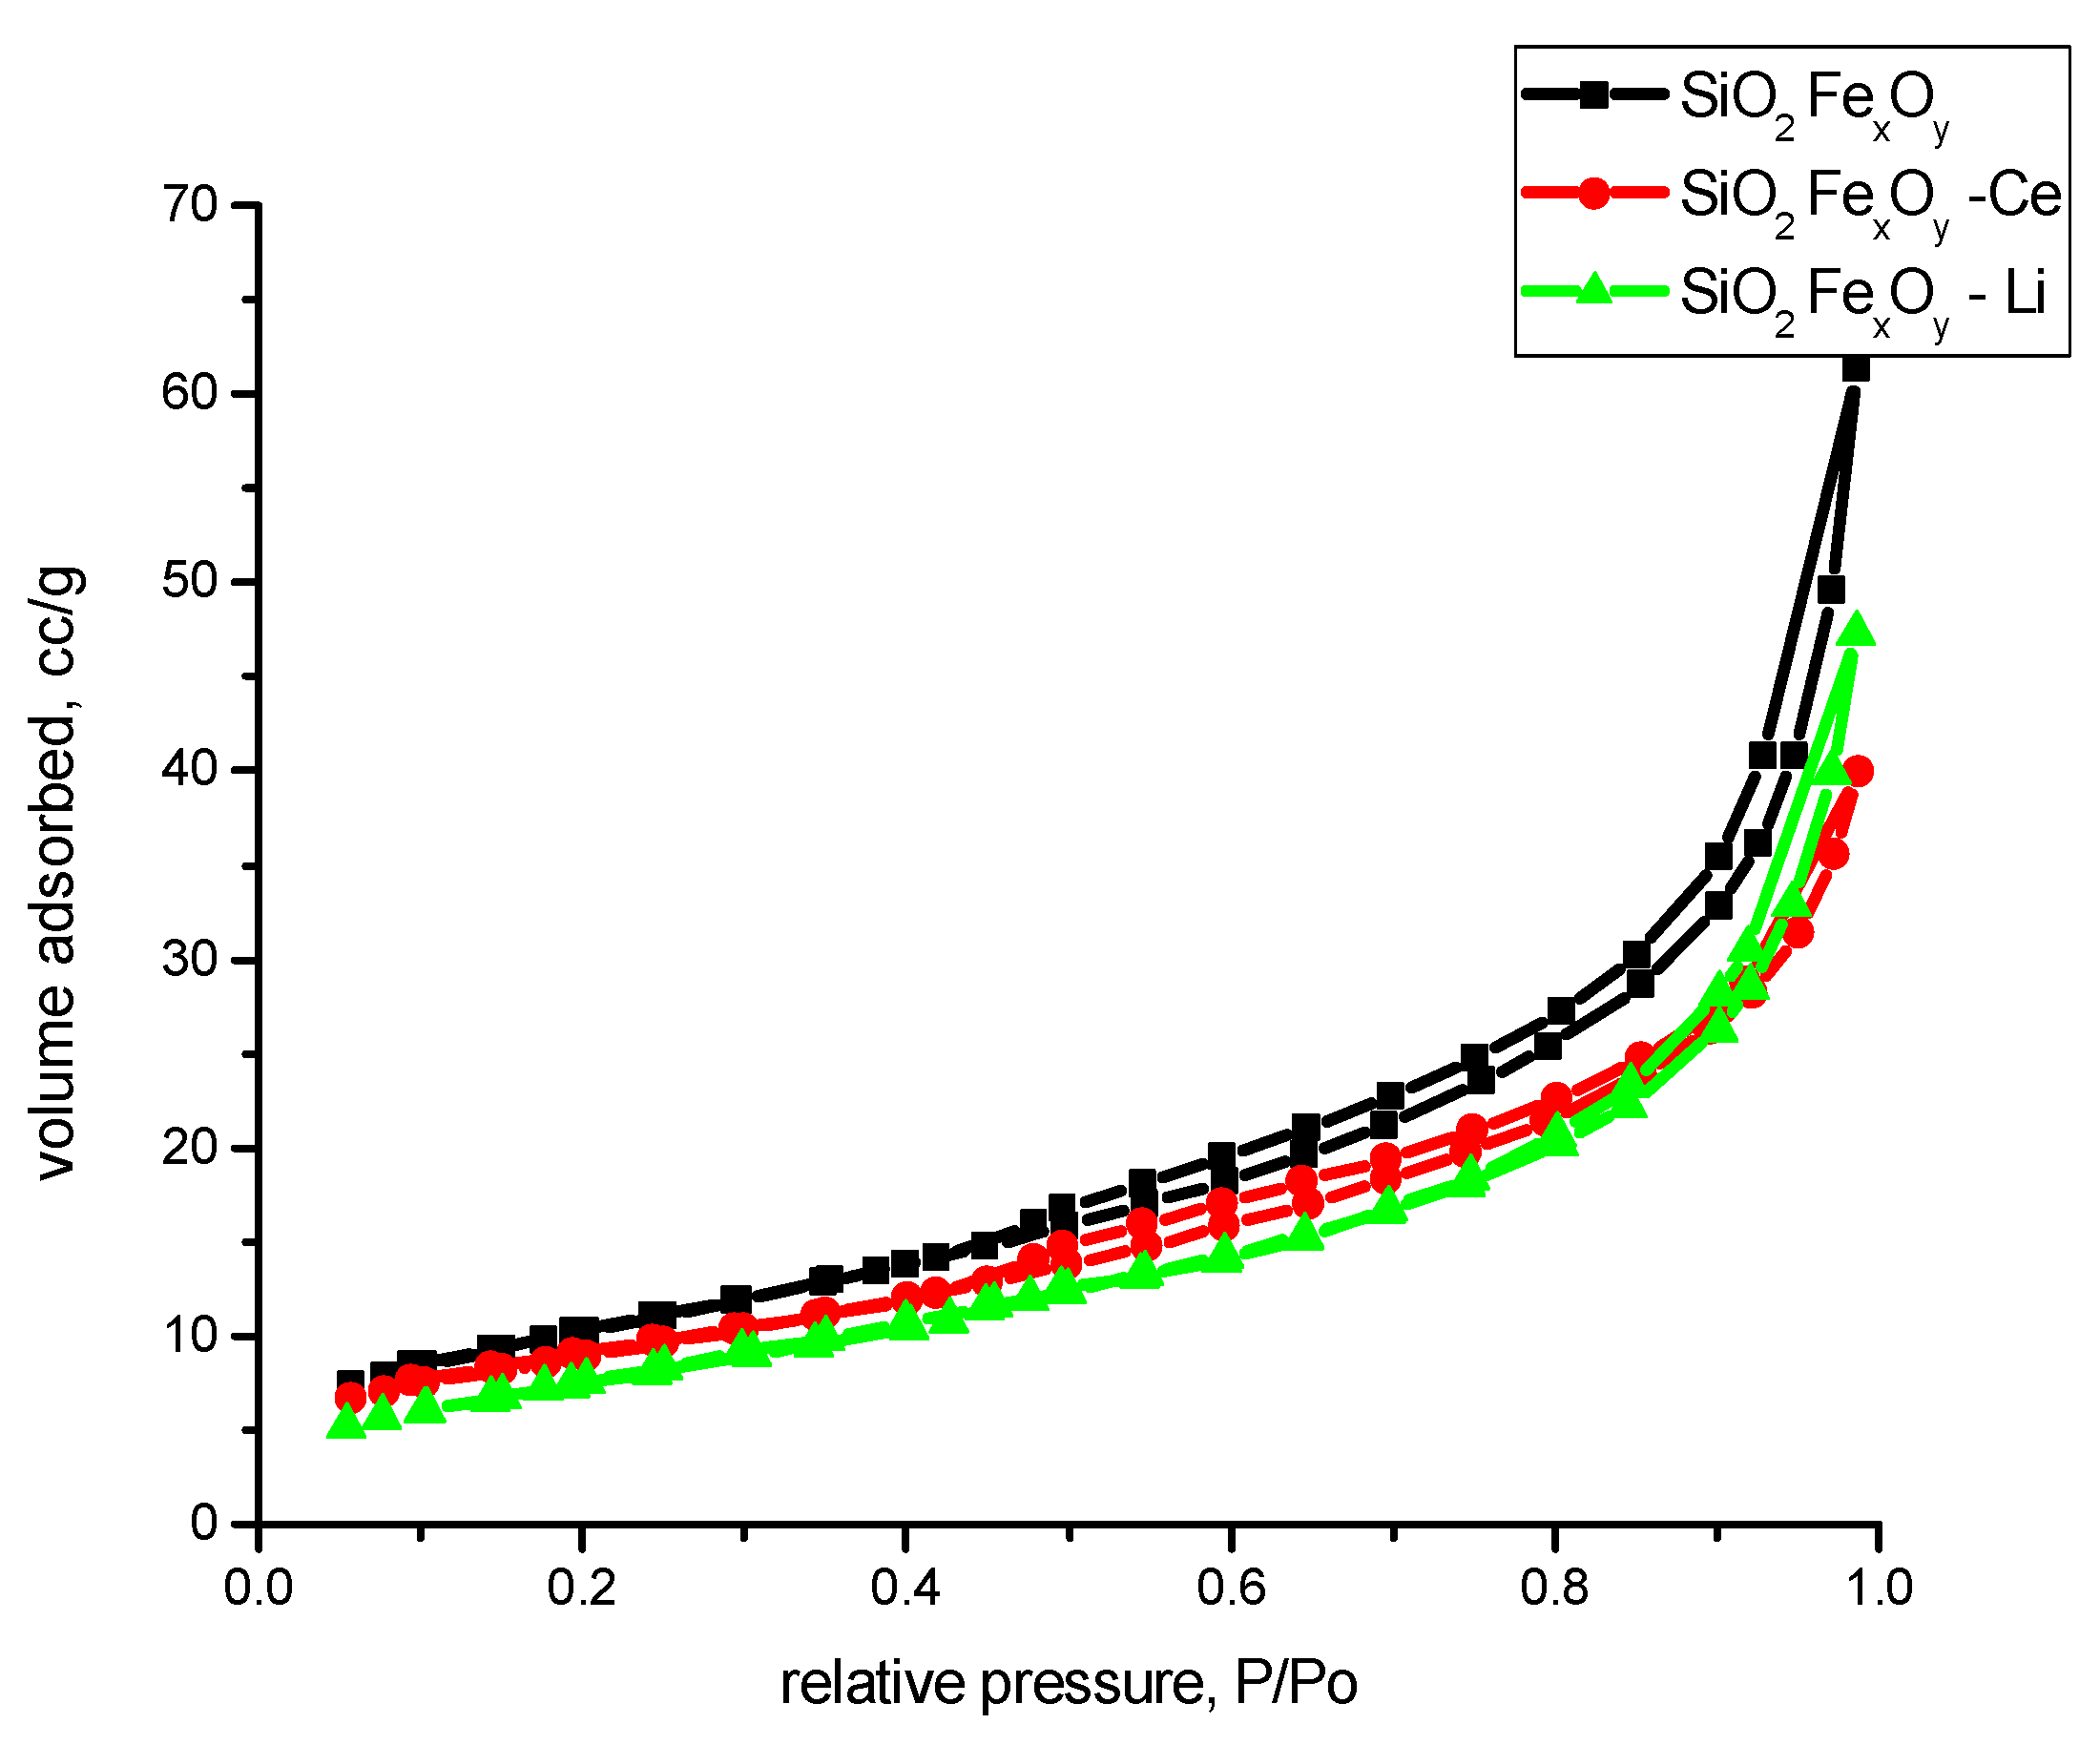
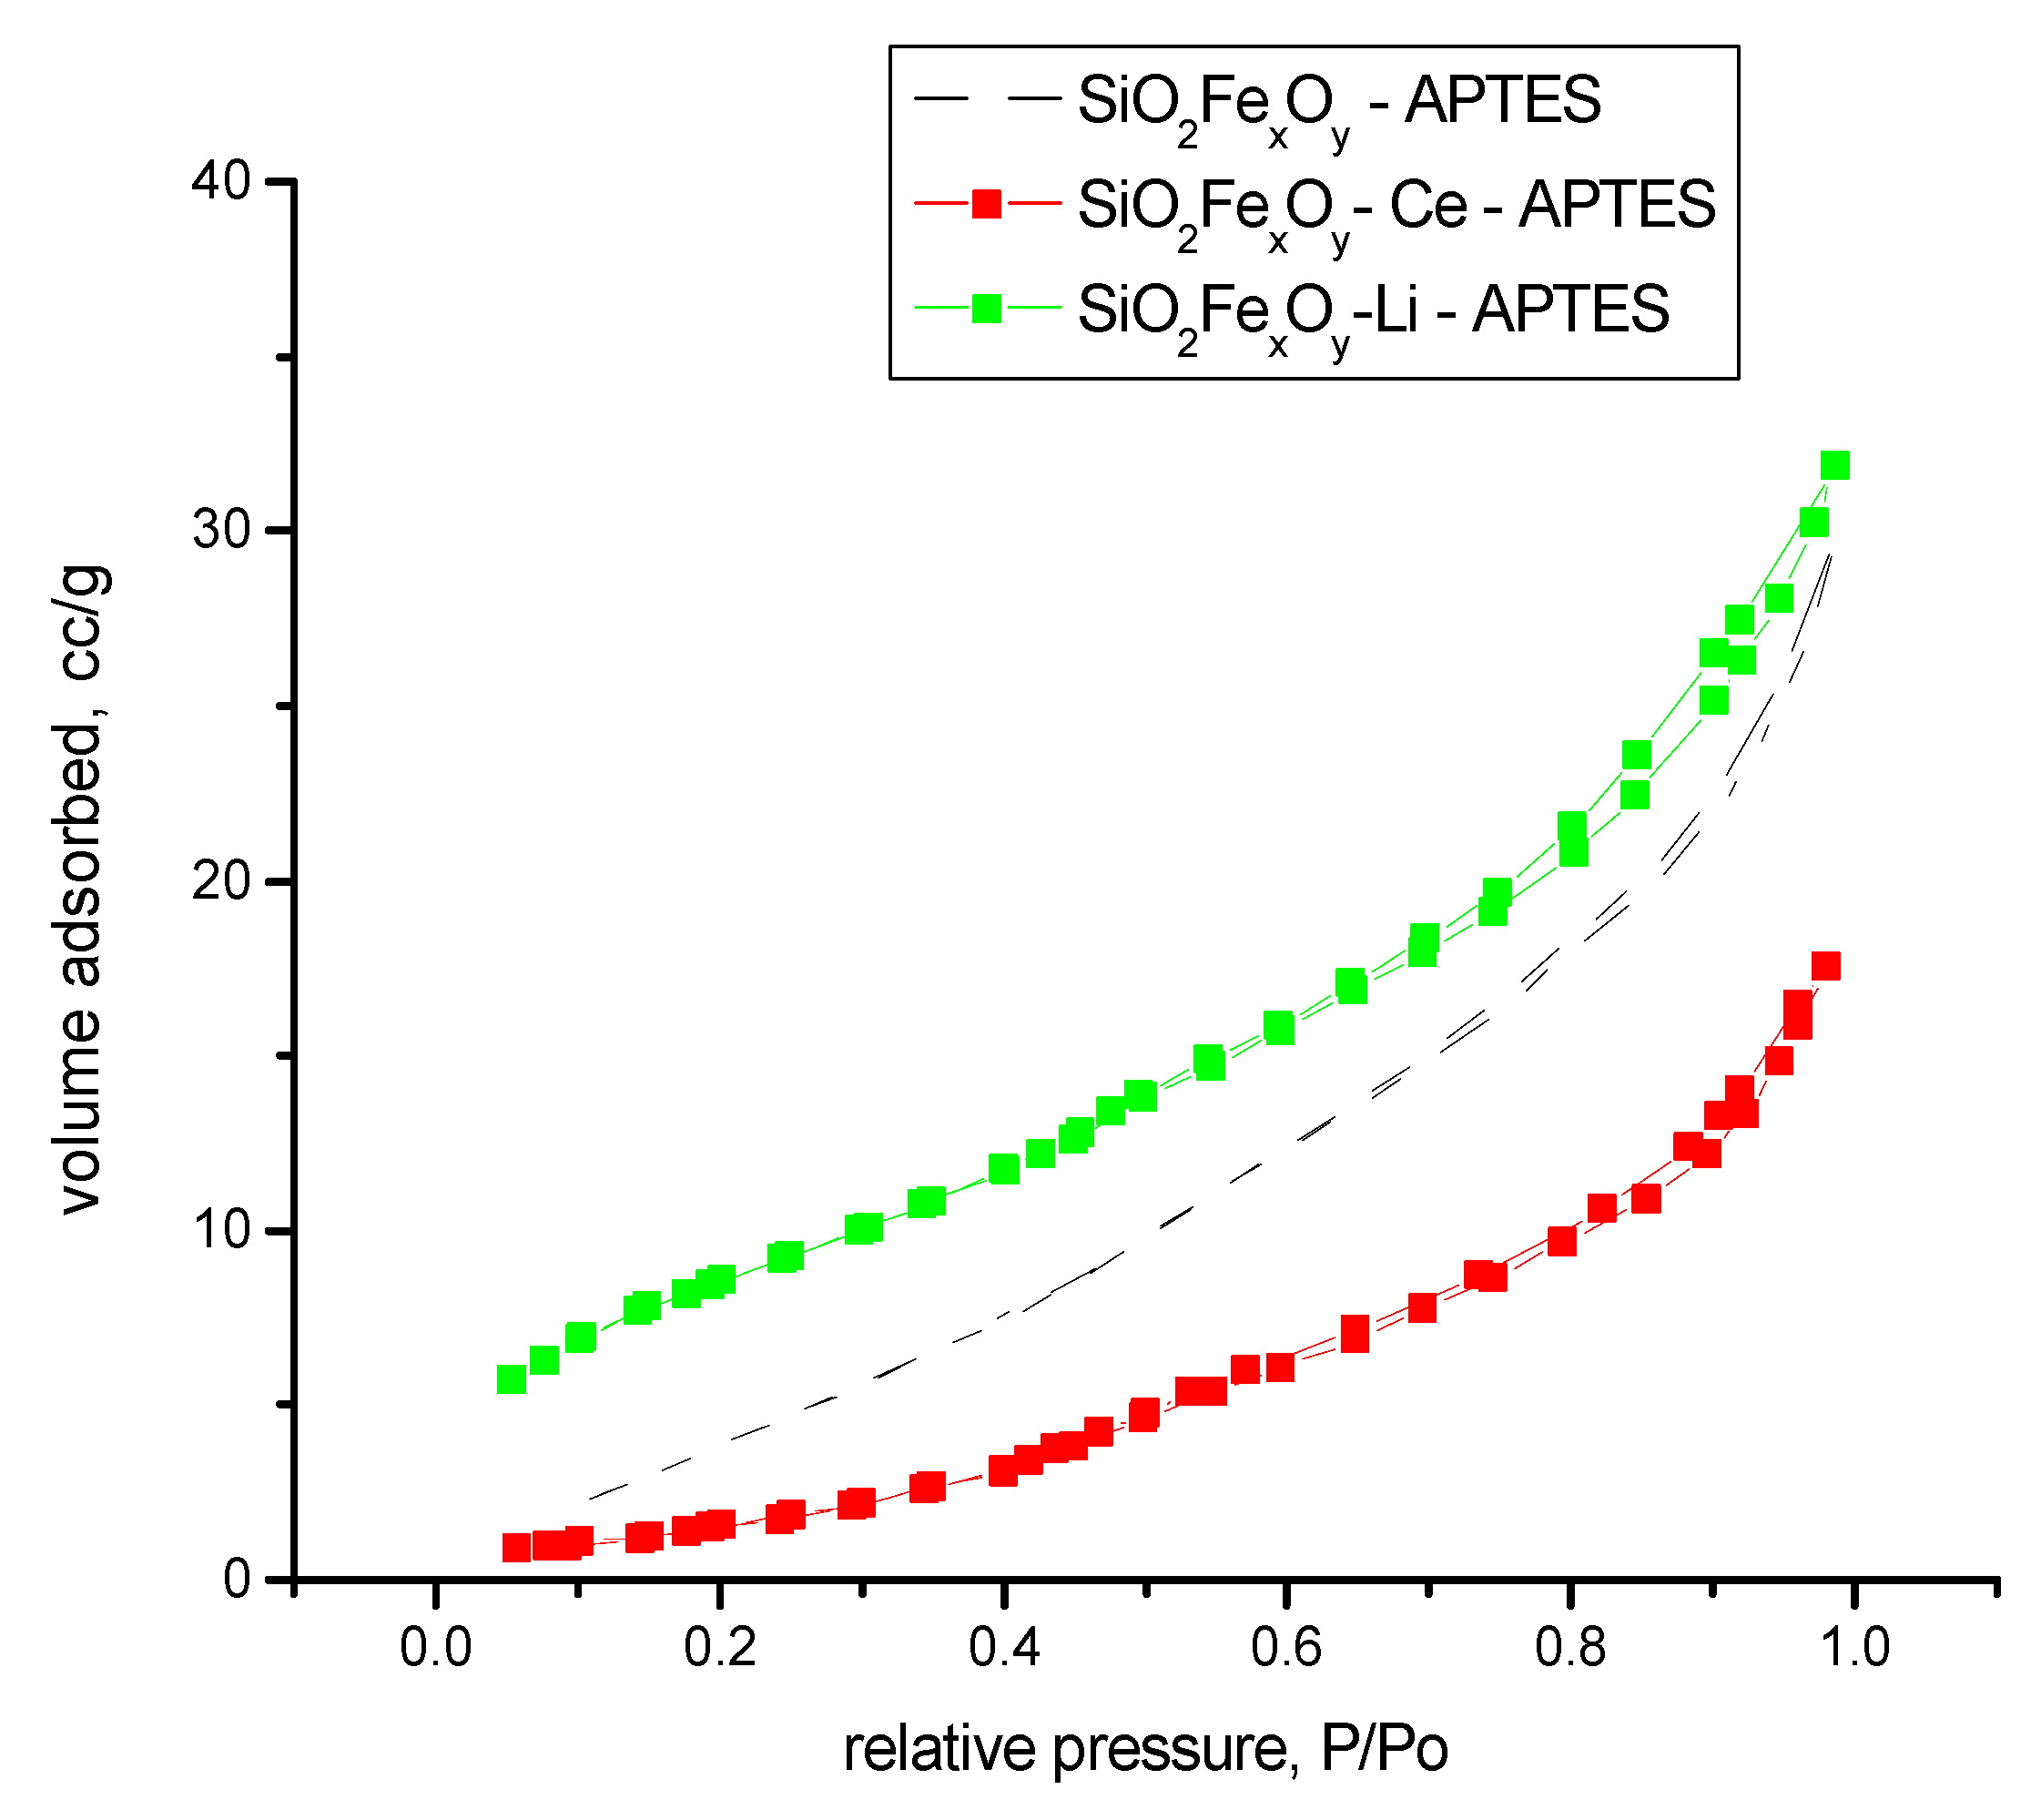
3.1.7. N2 Adsorption Desorption Isotherms

In order to follow the textural properties of the material, we presented the nitrogen adsorption–desorption isotherms in Figure 11. From their analysis, following the IUPAC criteria [60], it appears that all materials present nitrogen adsorption–desorption isotherms of type II. Due to the presence of hysteresis, we can presume that in addition to type II isotherm, the material also presents type IV isotherm with hysteresis H3 specific to non-rigid aggregates of plate-like particles or materials that contain macropores in their network.
Table 1 shows the textural properties of the materials.
From the literature, the FHH method indicates that when the value is near 2, the rugosity of the sample is 2D; and when the value is near 3, the rugosity of the sample is more 3D. In our case, the samples indicate that the surface of the samples is somewhere between, albeit a little more in 3D aspect. The highest rugosity is obtained for sample SiO2-FexOy-Ce. Figure 12 shows the nitrogen adsorption of samples after functionalization. From Figure 12, we can observe that after functionalization, the materials are changed in structure, becoming more nonporous. By comparing with the IUPAC, we observed that materials tend to be type II isotherms.
The obtained results of textural parameters are presented in Table 2.
The results indicate that after functionalization, the amines groups create new pores, resulting in smaller surfaces areas.

3.2. Application, CO2 Adsorption Process

As we mentioned in the Experimental Section, the CO2 adsorption–desorption process was carried out by temperature-programmed desorption (TPD) method [61] using a thermogravimetric analyzer. The ratio between the amino groups grafted on the support and the silica as the base material can be calculated from the TG–DTG curves. The values of the NH2/SiO2 ratios for the three functionalized samples fall within the range of 0.4–0.45. The CO2 adsorption–desorption process using thermogravimetry was studied using the prepared samples grafted with amine. It should be emphasized that samples not functionalized with APTES are NOT active for CO2 capture (adsorption).
Figure 13a–c shows the adsorption process of CO2 for the functionalized materials.
In Figure 13a–c, we depict the steps by which the sample is prepared and then exposed to the adsorption–desorption processes as follows:
  • The sample is heated in nitrogen at 150 °C for 30 min. This stage consists of cleaning the surface of the sample of organic impurities or ambient CO2 and bringing the sample to constant mass.
  • The temperature is lowered to the desired adsorption temperature—in our case, 30 °C—and it is maintained for another 15 min in the N2 atmosphere.
  • The adsorption stage lasts 90 min, during which the sample is exposed to a 30% CO2/N2 gas mixture (70 mL/min).
  • After the end of the adsorption, the sample is kept in N2 for another 30 min to remove physically adsorbed CO2.
  • The desorption process of chemosorbed CO2 on amine-grafted adsorbents takes place from 30 to 180 °C, with a heating rate of 10 °C/min and an isotherm of 30 min at 180 °C.
The main parameters of the adsorption–desorption process are as follows: CO2 adsorption capacity for a certain adsorbent measured in mmol of CO2 per gram of adsorbent; and adsorption efficiency for a certain adsorbent measured in mmol CO2/mmol NH2). The first parameter can be calculated from the increase in sample weight during the CO2 adsorption process. Adsorption efficiency is also an important parameter that provides information about the adsorption performance given by the amino groups grafted onto the support.
The results obtained at 30 °C for the functionalized samples are shown in Table 3. Therefore, the CO2 adsorption capacity for the three adsorbents has very close values between 1.53–1.58 mmol of CO2 per gram of adsorbent. On the other hand, the efficiency of amino groups is higher for sample SiO2-FexOy–Li-APTES, having a value of 0.26 mmol CO2/mmol NH2 compared to 0.21 for sample SiO2-FexOy-APTES.
For similar materials, the adsorption capacity was compared, and the results presented in Table 4. It could be seen that the values of adsorption capacity for our samples are comparable to, or even higher than, other adsorbent materials from the literature.
The modifications to the surface chemistry of the silica porous materials by incorporating the basic organic groups (various amines) increase CO2 adsorption capacity. The interaction of CO2 with the amine groups in a water-free environment gives rise to carbamates via the formation of the CO2-amine zwitterion, such as R-NH2+COO.
Overall, this reaction requires two amine groups per CO2 molecule, i.e., adsorption efficiency, defined as the CO2/N molar ratio, equal to 0.5. The chemical interaction between CO2 and amine (APTES) can be expressed as follows [34,35]:
R-NH2 + CO2 = R-NH2+COO
R-NH2+COO + R-NH2 = R-NHCOO + RNH3+.
While during the desorption of CO2, regeneration of grafted mesoporous silica is expressed as follows:
R-NH-COO + R-NH3+ + Heat = CO2 + 2R-NH2.
The formation of the carbamate involves equilibrium of the reaction and is, therefore reversible. It is also important to point out that while this mechanism corresponds to chemisorption, physisorption also takes place at higher partial pressures.

4. Conclusions

A total of six silica- and iron sulfate-based samples were obtained by the sol–gel method, while three of them were improved with cerium sulfate and lithium sulfate, and the other three were functionalized using the amino-APTES precursor. The TG, FTIR, and EDX results confirmed the successful functionalization. From the SEM images, it can be seen that the particle size of around 100 nm increased significantly to approximately 500 nm after functionalization. Before functionalization, the adsorption tests indicated that the samples do not adsorb CO2. After functionalization, a lower adsorption rate was observed with iron sulfate addition, whereas the test results for the functionalized sample containing lithium sulfate improved to a value of 0.26 mmol CO2/mmol NH2 compared to 0.21 for the basic functionalized sample.

Supplementary Materials

The following supporting information can be downloaded at: https://www.mdpi.com/article/10.3390/separations10060352/s1, Figure S1a: EDS images for the SiO2-FexOy sample; Figure S1b: EDS images for the SiO2-FexOy–Ce sample; Figure S1c: EDS images for the sample SiO2-FexOy–Li; Figure S2a: EDS images for the sample SiO2-FexOy–APTES; Figure S2b: EDS images for sample SiO2-FexOy–Ce-APTES; Figure S2c: EDS images for the SiO2-FexOy–Li–APTES.

Author Contributions

Conceptualization, C.I. and A.P.; formal analysis, C.I., B.P., and N.N.; investigation, C.I., B.P., N.N., and A.P.; writing—original draft preparation, C.I., B.P., and N.N.; writing—review and editing, C.I. and A.P. All authors have read and agreed to the published version of the manuscript.

Funding

This research was funded by Romanian Academy Project No. 4.

Conflicts of Interest

The authors declare no conflict of interest. The funders had no role in the design of the study; in the collection, analyses, or interpretation of data; in the writing of the manuscript; or in the decision to publish the result.

References

  1. Răileanu, M.; Crișan, M.; Petrache, C.; Crișan, D.; Jitianu, A.; Zaharescu, M.; Predoi, D.; Kuncser, V.; Filoti, G. Sol-Gel FexOy–SiO2 Nanocomposites. Rom. J. Phys. 2005, 50, 595–606. [Google Scholar]
  2. Predoi, D.; Crisan, O.; Jitianu, A.; Valsangiacom, M.C.; Raileanu, M.; Crisan, M.; Zaharescu, M. Iron oxide in a silica matrix prepared by the sol–gel method. Thin Solid Films 2007, 515, 6319–6323. [Google Scholar] [CrossRef]
  3. Ali, Z.; Andreassen, J.-P.; Bandyopadhyay, S. Fine-Tuning of Particle Size and Morphology of Silica Coated Iron Oxide Nanoparticles. Ind. Eng. Chem. Res. 2023, 62, 4831–4839. [Google Scholar] [CrossRef]
  4. Wannoussa, W.; Masy, T.; Lambert, S.D.; Heinrichs, B.; Tasseroul, L.; Al-Ahmad, A.; Weekers, F.; Thonart, P.; Hiligsmann, S. Effect of Iron Nanoparticles Synthesized by a Sol-Gel Process on Rhodococcus erythropolis T902.1 for Biphenyl Degradatio. J. Water Resour. Prot. 2015, 7, 264–277. [Google Scholar] [CrossRef] [Green Version]
  5. Santos, E.C.; Jacques, R.J.S.; Bento, F.M.; Peralba, M.C.R.; Selbach, P.A.; Sa, E.L.; Camargo, F.A. Anthracene Biodegradation and Surface Activity by an Iron-Stimulated Pseudomonas sp. Bioresour. Technol. 2008, 99, 2644–2649. [Google Scholar] [CrossRef] [PubMed]
  6. Chorao, C. Investigation of Rhodococcus Rhodochrous Metabolism in Photo- and Bio-Degradation of 2-aminobenzothiazol: Effect of Cell Immobilisation and Role of Iron. Ph.D. Thesis, University Blaise Pascal, Clermont-Ferrand, France, 2008. Available online: http://tel.archives-ouvertes.fr/tel-00731145 (accessed on 15 May 2023).
  7. Da Silva, M.T.P.; Barbosa, F.; Morales Torre, M.; Villarroel-Rocha, J.; Sapag, K.; Pergher, S.; Braga, T. Synthesis of Fe2SiO4-Fe7Co3 Nanocomposite Dispersed in the Mesoporous SBA-15: Application as Magnetically Separable Adsorbent. Molecules 2020, 25, 1016. [Google Scholar] [CrossRef] [Green Version]
  8. Geiger, C.A.; Grodzicki, M.; Dachs, E. An analysis of the magnetic behavior of olivine and garnet substitutional solid solutions. Am. Mineral. 2019, 104, 1246–1255. [Google Scholar] [CrossRef] [Green Version]
  9. Pereira, C.; Pereira, A.M.; Quaresma, P.; Tavares, P.B.; Pereira, E.; Araújo, J.P.; Freire, C. Superparamagnetic γ-Fe2O3@SiO2 nanoparticles: A novel support for the immobilization of [VO(acac)2]. Dalton Trans. 2010, 39, 2842. [Google Scholar] [CrossRef]
  10. Yusof, S.M.; Othaman, R.; Setiabudi, H.D.; Teh, L.P. Modified fibrous silica for enhanced carbon dioxide adsorption: Role of metal oxides on physicochemical properties and adsorption performance. J. Solid-State Chem. 2021, 294, 121845. [Google Scholar] [CrossRef]
  11. Gunathilake, C.; Jaroniec, M. Mesoporous calcium oxide-silica and magnesium oxide-silica composites for CO2 capture at ambient and elevated temperatures. J. Mater. Chem. A 2019, 4, 10914–10924. [Google Scholar] [CrossRef]
  12. Miyamoto, M.; Hamajima, A.; Oumi, Y.; Uemiya, S. Effect of basicity of metal doped ZrO2 supports on hydrogen production reactions. Int. J. Hydrogen Energy 2018, 43, 730–738. [Google Scholar] [CrossRef]
  13. Ho, K.; Jin, S.; Zhong, M.; Vu, A.T.; Lee, C.H. Sorption capacity and stability of mesoporous magnesium oxide in post-combustion CO2 capture. Mater. Chem. Phys. 2017, 198, 154–161. [Google Scholar] [CrossRef]
  14. Slostowski, C.; Marre, S.; Dagault, P.; Babot, O.; Toupance, T.; Aymonier, C. CeO2 nanopowders as solid sorbents for efficient CO2 capture/release processes. J. CO2 Util. 2017, 20, 52–58. [Google Scholar] [CrossRef] [Green Version]
  15. Yoshikawa, K.; Kaneeda, M.; Nakamura, H. Development of Novel CeO2-based CO2 adsorbent and analysis on its CO2 adsorption and desorption mechanism. Energy Procedia 2017, 14, 2481–2487. [Google Scholar] [CrossRef]
  16. Kanahara, K.; Matsushima, Y. Adsorption and Desorption Properties of CO2 on CeO2 Nanoparticles Prepared via Different Synthetic Routes. J. Electrochem. Soc. 2019, 166, B978. [Google Scholar] [CrossRef]
  17. Seggiani, M.; Puccini, M.; Vitolo, S. Alkali promoted lithium orthosilicate for CO2 capture at high temperature and low concentration. Int. J. Greenh. Gas Control. 2013, 17, 25. [Google Scholar] [CrossRef]
  18. Costagliola, M.A.; Prati, M.V.; Perretta, G. Post combustion CO2 capture with calcium and lithium hydroxide. Sci. Rep. 2022, 12, 10518. [Google Scholar] [CrossRef]
  19. Vallace, A.; Brooks, S.; Coe, C.; Smith, M.A. Kinetic Model for CO2 Capture by Lithium Silicates. J. Phys. Chem. C 2020, 124, 20506. [Google Scholar] [CrossRef]
  20. Yan, X.; Li, Y.; Ma, X.; Zhao, J.; Wang, Z. Performance of Li4SiO4 Material for CO2 Capture: A Review. Int. J. Mol. Sci. 2019, 20, 928. [Google Scholar] [CrossRef] [Green Version]
  21. Lahuri, A.H.; Khai, M.L.N.; Rahim, A.A.; Nordin, N. Adsorption Kinetics for CO2 Capture using Cerium Oxide Impregnated on Activated Carbon. Acta Chim. Slov. 2020, 67, 570–580. [Google Scholar] [CrossRef]
  22. Baumann, N.; Lan, J.; Iannuzzia, M. CO2 adsorption on the pristine and reduced CeO2 (111) surface: Geometries and vibrational spectra by first principles simulations. J. Chem. Phys. 2021, 154, 094702. [Google Scholar] [CrossRef]
  23. Zheng, X.; Hu, L.; Zhu, J.; He, J.; Liu, X. Effect of the dispersion behavior of cerium oxygen species on CO2 adsorption performance. J. Environ. Chem. Eng. 2022, 10, 106986. [Google Scholar] [CrossRef]
  24. Mizunuma, M.; Tsuda, M.; Maruo, Y.Y.; Nakagaki, T. CO2 capture system using lithium silicate for distributed power supply. Energy Procedia 2013, 37, 1194–1201. [Google Scholar] [CrossRef] [Green Version]
  25. Belgamwar, R.; Maity, A.; Das, T.; Chakraborty, S.; Vinod, C.P.; Polshettiwar, V. Lithium silicate nanosheets with excellent capture capacity and kinetics with unprecedented stability for high-temperature CO2 capture. Chem. Sci. 2021, 12, 4825–4835. [Google Scholar] [CrossRef] [PubMed]
  26. Hu, Y.; Fu, R.; Liu, W.; Yao, D.; Yan, S. Lithium-based ceramics in nonsilicates for CO2 capture: Current status and new trends. J. Mater. Chem. A 2022, 10, 1706–1725. [Google Scholar] [CrossRef]
  27. Zhou, L.; Niu, Z.; Jin, X.; Tang, L.; Zhu, L. Effect of Lithium Doping on the Structures and CO2 Adsorption Properties of Metal-Organic Frameworks HKUST-1. ChemistrySelect 2018, 3, 12865–12870. [Google Scholar] [CrossRef]
  28. Sanz-Perez, E.S.; Murdock, C.R.; Didas, S.A.; Jones, C.W. Direct capture of CO2 from ambient air. Chem. Rev. 2016, 116, 11840–11876. [Google Scholar] [CrossRef]
  29. Qi, G.; Fu, L.; Giannelis, E. Sponges with covalently tethered amines for high-efficiency carbon capture. Nat. Commun. 2014, 5, 5796. [Google Scholar] [CrossRef] [Green Version]
  30. Rosu, C.; Pang, S.H.; Sujan, A.R.; Sakwa-Novak, M.A.; Ping, E.W.; Jones, C.W. Effect of Extended Aging and Oxidation on Linear Poly (propylenimine)-Mesoporous Silica Composites for CO2 Capture from Simulated Air and Flue Gas Streams. ACS Appl. Mater. Interfaces 2020, 12, 38085. [Google Scholar] [CrossRef]
  31. Didas, S.A.; Choi, S.; Chaikittisilp, W.; Jones, C.W. Amine–oxide hybrid materials for CO2 capture from ambient air. Acc. Chem. Res. 2015, 48, 2680. [Google Scholar] [CrossRef]
  32. Mohamedali, M.; Ibrahim, H.; Henni, A. Imidazolium based ionic liquids confined into mesoporous silica MCM-41 and SBA-15 for carbon dioxide capture. Microporous Mesoporous Mater. 2020, 294, 109916. [Google Scholar] [CrossRef]
  33. Gelles, T.; Lawson, S.; Rownaghi, A.A.; Rezaei, F. Recent advances in development of amine functionalized adsorbents for CO 2 capture. Adsorption 2020, 26, 5. [Google Scholar] [CrossRef]
  34. Sreenivasulu, B.; Gayatri, D.V.; Sreedhar, I.; Raghavan, K.V. A journey into the process and engineering aspects of carbon capture technologies. Renew. Sustain. Energy Rev. 2015, 41, 1324–1350. [Google Scholar] [CrossRef]
  35. Sanz-Perez, E.S.; Dantas, T.C.M.; Arencibia, A.; Calleja, G.; Guedes, A.P.M.A.; Araujo, A.S.; Sanz, R. Reuse and recycling of amine-functionalized silica materials for CO2 adsorption. Chem. Eng. J. 2017, 308, 1021–1033. [Google Scholar] [CrossRef]
  36. Huang, L.; Huang, X.; Yan, J.; Liu, Y.; Jiang, H.; Zhang, H.; Tang, J.; Liu, Q. Research progresses on the application of perovskite in adsorption and photocatalytic removal of water pollutants. J. Hazard. Mater. 2023, 442, 130024. [Google Scholar] [CrossRef]
  37. Ianăşi, C.; Picioruş, M.; Nicola, R.; Ciopec, M.; Negrea, A.; Nižňanský, D.; Len, A.; Almásy, L.; Putz, A.-M. Removal of cadmium from aqueous solutions using inorganic porous nanocomposites. Korean J. Chem. Eng. 2019, 36, 688–700. [Google Scholar] [CrossRef]
  38. Finger, L.W.; Hazen, R.M.; Yagi, T. Year Book; Carnegie Inst.: Washington, DC, USA, 1977; Volume 76, p. 504. [Google Scholar]
  39. Felsche, J.; Hirsiger, W. The polymorphs of the rare-earth pyrosilicates R.E.2Si2O7, [R.E.: La, Ce, Pr, Nd, Sm]. J. Less Common Met. 1969, 18, 131. [Google Scholar] [CrossRef]
  40. Law, A. University Sheffield, Sheffield, UK. Private Communication.
  41. Dow Chemical Co. Midland, MI, USA. Private Communication.
  42. Ray, S.P.; Cox, D.E. Terbium Oxides. III. X-Ray Diffraction Studies of Several Stable Phases. J. Solid State Chem. 1975, 15, 333. [Google Scholar] [CrossRef]
  43. Ivanovskia, V.; Petruševskia, V.M.; Gundeb, M.K. The IR reflectance spectra of the ν3(SO42−) and ν4(SO42−) band regions of some Tutton salts using polarized radiation: Testing the model dielectric function. Spectrochim. Acta Part A Mol. Biomol. Spectrosc. 2005, 61, 67. [Google Scholar] [CrossRef]
  44. Xie, M.; Liu, Y.; Deng, Z. Influence of substituents on IR spectrum of aromatic amines in different solvents. Guang Pu Xue Yu Guang Pu Fen Xi= Guang Pu 2000, 20, 819–821. (In Chinese) [Google Scholar]
  45. Aliev, A.R.; Gafurov, M.M.; Akhmedov, I.R. Raman spectra of lithium sulfate crystal in strong electric fields. Chem. Phys. Lett. 2002, 353, 270–274. [Google Scholar] [CrossRef]
  46. Varghese, S.; Subrahmanyam, A.; Hariharan, K. Temperature-dependent Raman spectra of quenched lithium sulfate. In AIP Conference Proceedings; AIP Publishing: Long Island, NY, USA, 2020. [Google Scholar] [CrossRef]
  47. Rull, F. Raman Spectroscopic Study of the Ion Association of Lithium Sulfate Aqueous Solutions. Z. Für Nat. A 1995, 50, 292–300. [Google Scholar] [CrossRef] [Green Version]
  48. Aliev, A.R.; Akhmedov, I.R.; Kakagasanov, M.G.; Aliev, Z.A. Raman Spectra of Polycrystalline Lithium Sulfate, Sodium Sulfate, and Potassium Sulfate in the Pretransition Temperature Range Lower the Structural Phase Transition. Phys. Solid State 2019, 61, 1464–1470. [Google Scholar] [CrossRef]
  49. Gorelik, V.S.; Bi, D.; Voinov, Y.P.; Vodchits, A.I.; Gorshunov, B.P.; Yurasov, N.I.; Yurasova, I.I. Raman spectra of lithium compounds. J. Phys. Conf. Ser. 2017, 918, 012035. [Google Scholar] [CrossRef] [Green Version]
  50. Le Losq, C.; Mysen, B.O.; Cody, G.D. Water and magmas: Insights about the water solution mechanisms in alkali silicate melts from infrared, Raman, and 29Si solid-state NMR spectroscopies. Prog. Earth Planet. Sci. 2015, 2, 22. [Google Scholar] [CrossRef] [Green Version]
  51. Matusoiu, F.; Negrea, A.; Ciopec, M.; Duteanu, N.; Negrea, P.; Svera, P.; Ianasi, C. Molybdate Recovery by Adsorption onto Silica Matrix and Iron Oxide Based Composites. Gels 2022, 8, 125. [Google Scholar] [CrossRef]
  52. Socrates, G. Infrared and Raman Characteristic Group Frequencies: Tables and Charts, 3rd ed.; John Wiley & Sons: Hoboken, NJ, USA, 2004; p. 368. [Google Scholar]
  53. Masset, P.; Poinso, J.Y.; Poignet, J.C. TG/DTA/MS Study of the thermal decomposition of FeSO4·6H2O. J. Therm. Anal. Calorim. 2006, 83, 457–462. [Google Scholar] [CrossRef]
  54. Putz, A.-M.; Wang, K.; Len, A.; Plocek, J.; Bezdicka, P.; Kopitsa, G.P.; Khamova, T.V.; Ianăşi, C.; Săcărescu, L.; Mitróová, Z.; et al. Mesoporous silica obtained with methyltriethoxysilane as co-precursor in alkaline medium. Appl. Surf. Sci. 2017, 424, 275. [Google Scholar] [CrossRef] [Green Version]
  55. Cardillo, D.; Konstantinov, K.; Devers, T. The effects of cerium doping on the size, morphology, and optical properties of α-hematite nanoparticles for ultraviolet filtration. Mater. Res. Bull. 2013, 48, 4521–4525. [Google Scholar] [CrossRef]
  56. Chibisov, A.N.; Pugachevskii, M.A.; Kuzmenko, A.P.; Than, M.M.; Kartsev, A.I. Effect of morphology and size on the thermodynamic stability of cerium oxide nanoparticles: Experiment and molecular dynamics calculation. Nanotechnol. Rev. 2022, 11, 620–624. [Google Scholar] [CrossRef]
  57. Liu, J.; Liang, C.; Zhang, H.; Tian, Z.; Zhang, S. General Strategy for Doping Impurities (Ge, Si, Mn, Sn, Ti) in Hematite Nanocrystals. J. Phys. Chem. C 2012, 116, 4986–4992. [Google Scholar] [CrossRef]
  58. Cao, K.; Shen, T.; Wang, K.; Chen, D.; Wang, W. Influence of different lithium sources on the morphology, structure and electrochemical performances of lithium-rich layered oxides. Ceram. Int. 2017, 43, 8694–8702. [Google Scholar] [CrossRef]
  59. Gao, S.; Zhang, Y.; Zhang, H.; Song, D.; Shi, X.; Zhang, L. The effect of lithium content on the structure, morphology and electrochemical performance of Li-rich cathode materials Li1+x(Ni1/6Co1/6Mn4/6)1−xO2. New J. Chem. 2017, 41, 10048–10053. [Google Scholar] [CrossRef]
  60. Thommes, M.; Kaneko, K.; Neimark, A.V.; Olivier, J.P.; Rodriguez-Reinoso, F.; Rouquerol, J.; Sing, K.S.W. Physisorption of gases, with special reference to the evaluation of surface area and pore size distribution (IUPAC Technical Report). Pure Appl. Chem. 2015, 87, 1051–1069. [Google Scholar] [CrossRef] [Green Version]
  61. Jia, L.; Cheng, P.; Yu, Y.; Chen, S.; Wang, C.; He, L.; Nie, H.; Wang, J.; Zhang, J.; Fan, B.; et al. Regeneration mechanism of a novel high-performance biochar mercury adsorbent directionally modified by multimetal multilayer loading. J. Environ. Manag. 2023, 326, 116790. [Google Scholar] [CrossRef]
  62. Singh, J.; Bhunia, H.; Basu, S. CO2 adsorption on oxygen enriched porous carbon monoliths: Kinetics, isotherm and thermodynamic studies. J. Ind. Eng. Chem. 2018, 60, 321–332. [Google Scholar] [CrossRef]
  63. Kaur, B.; Gupta, R.K.; Bhunia, H. Chemically activated nanoporous carbon adsorbents from waste plastic for CO2 capture: Breakthrough adsorption study. Microporous Mesoporous Mater. 2019, 282, 146–158. [Google Scholar] [CrossRef]
  64. Chanapattharapol, K.C.; Krachuamram, S.; Youngme, S. Study of CO2 adsorption on iron oxide doped MCM-41. Microporous Mesoporous Mater. 2017, 245, 8–15. [Google Scholar] [CrossRef]
  65. Anyanwu, J.-T.; Wang, Y.; Yang, R.T. Amine-grafted Silica Gels for CO2 Capture Including Direct Air Capture. Ind. Eng. Chem. Res. 2020, 59, 7072–7079. [Google Scholar] [CrossRef]
  66. Guha, N.; Gupta, A.K.; Chatterjee, S.; Krishnan, S.; Singh, M.K.; Rai, D.K. Environmentally benign melamine functionalized silica-coated iron oxide for selective CO2 capture and fixation into cyclic carbonate. J. CO2 Util. 2021, 49, 101575. [Google Scholar] [CrossRef]
  67. Muchan, P.; Saiwan, C.; Nithitanakul, M. Investigation of adsorption/desorption performance by aminopropyltriethoxysilane grafted onto different mesoporous silica for post-combustion CO2 capture. Clean Energy 2020, 4, 120–131. [Google Scholar] [CrossRef] [Green Version]
  68. Raganati, F.; Alfe, M.; Gargiulo, V.; Chirone, R.; Ammendola, P. Isotherms and thermodynamics of CO2 adsorption on a novel carbon-magnetite composite sorbent. Chem. Eng. Res. Des. 2018, 134, 540. [Google Scholar] [CrossRef]
Figure 1. XRD samples for SiO2−FexOy, SiO2−FexOy−Ce, and SiO2−FexOy−Li.
Separations 10 00352 g001
Figure 2. XRD samples after functionalization with APTES.
Separations 10 00352 g002
Figure 3. FT-IR spectra for SiO2−FexOy, SiO2−FexOy−Ce, and SiO2−FexOy−Li.
Separations 10 00352 g003
Figure 4. FT-IR spectra of samples functionalized with APTES.
Separations 10 00352 g004
Figure 5. Raman spectra for SiO2−FexOy, SiO2 FexOy−Ce, and SiO2−FexOy−Li.
Separations 10 00352 g005
Figure 6. Raman spectra of samples functionalized with APTES.
Separations 10 00352 g006
Figure 7. Thermogravimetric analysis for SiO2 FexOy, SiO2−FexOy−Ce, and SiO2−FexOy−Li samples in nitrogen.
Separations 10 00352 g007
Figure 8. (a) Thermogravimetric analysis of the SiO2−FexOy−APTES sample. (b) Thermogravimetric analysis for the SiO2−FexOy−Ce−APTES. (c) Thermogravimetric analysis for sample SiO2−FexOy−Li−APTES.
Separations 10 00352 g008aSeparations 10 00352 g008b
Figure 9. (a) SEM images for sample SiO2−FexOy at 3000× (left) and 12,000× (right). (b) SEM images for sample SiO2−FexOy−Ce at 3000× (left) and 12,000× (right). (c) SEM images for sample SiO2−FexOy−Li at 3000× (left) and 12,000× (right).
Separations 10 00352 g009
Figure 10. (a) SEM images for sample SiO2−FexOy−APTES at 3000× (left) and 12,000× (right). (b) SEM images for sample SiO2−FexOy−Ce−APTES at 3000× (left) and 12,000× (right). (c) SEM images for sample SiO2−FexOy−Li−APTES at 3000× (left) and 12,000× (right).
Separations 10 00352 g010
Figure 11. Nitrogen adsorption–desorption isotherms of the samples SiO2-FexOy, SiO2-FexOy-Ce, and SiO2-FexOy-Li.
Separations 10 00352 g011
Figure 12. Nitrogen adsorption–desorption isotherms for samples functionalized.
Separations 10 00352 g012
Figure 13. (a) TGA data for adsorption of CO2 for sample SiO2−FexOy−APTES. (b) TGA data for the adsorption of CO2 for sample SiO2−FexOy−Ce−APTES. (c) TGA data for adsorption of CO2 for sample SiO2−FexOy−Li−APTES.
Separations 10 00352 g013
Table 1. Textural parameters for samples SiO2−FexOy, SiO2−FexOy−Ce, and SiO2−FexOy−Li.
Sample NameSurface Area, BET Method, m2/gPore Width, DFT Method, nmAverage Pore Diameter, nm Total Pore Volume, cc/gFHH Method, D
SiO2−FexOy385.0910.030.09502.5942
SiO2−FexOy−Ce335.087.590.06182.6478
SiO2−FexOy−Li293.779.980.07332.5770
Table 2. Textural parameters of SiO2−FexOy−APTES, SiO2−FexOy−Ce−APTES, and SiO2−FexOy−Li−APTES functionalized.
Sample NameSurface Area, BET Method, m2/gPore Width, DFT Method, nmAverage Pore Diameter, nm Total Pore Volume, cc/gFHH Method, D
SiO2−FexOy−APTES123.675.260.04572.6731
SiO2−FexOy−Ce−APTES910.7012.520.00922.5322
SiO2−FexOy−Li−APTES 163.654.380.05932.6448
Table 3. The amounts of CO2 adsorbed at 30 °C by the synthesized adsorbents.
No.SampleTemp
[ºC]
nCO2/g SiO2−FexOy
[mmol/g SiO2-FexOy]
nCO2/nNH2
[mmol/mmol]
1.SiO2−FexOy−APTES301.550.218
2.SiO2−FexOy−Ce−APTES301.530.226
3.SiO2−FexOy−Li−APTES301.580.260
Table 4. Comparison for CO2 adsorption capacity of different adsorbents.
Sample Surface Area, m2/gAdsorption Capacity (mmol/g)References
Fibrous silica 6180.54[10]
Ce-fibrous silica3910.58[10]
Silica monoliths 760 0.52[62]
Carbon monoliths 12251.6[62]
porous carbons from PET16901.31[63]
CB-FM157~1 [64]
Silica gels 3090.773[65]
FS 23.480.324[66]
FSNM12.930.48[66]
APTES_MCM-41 58.1 1.01[67]
APTES_SBA-1520.1 1.75[67]
MCM-41/FeO14530.87[68]
Disclaimer/Publisher’s Note: The statements, opinions and data contained in all publications are solely those of the individual author(s) and contributor(s) and not of MDPI and/or the editor(s). MDPI and/or the editor(s) disclaim responsibility for any injury to people or property resulting from any ideas, methods, instructions or products referred to in the content.

