Article

A Fixed-Bed Column with an Agro-Waste Biomass Composite for Controlled Separation of Sulfate from Aqueous Media

by
Mostafa Solgi
,
Bernd G. K. Steiger
and
Lee D. Wilson
*,†
Department of Chemistry, University of Saskatchewan, Saskatoon, SK S7N 5C9, Canada
*
Author to whom correspondence should be addressed.
These authors contributed equally to this work.
Separations 2023, 10(4), 262; https://doi.org/10.3390/separations10040262
Submission received: 10 March 2023 / Revised: 12 April 2023 / Accepted: 13 April 2023 / Published: 17 April 2023

Abstract

:
An agro-waste composite with a pelletized form was prepared and characterized via IR and 13C solids NMR spectroscopy. Thermal gravimetry analysis (TGA) was used to study the weight loss profiles, while SEM images provided insight on the biocomposite morphology, along with characterization of the sulfate adsorption properties under equilibrium and dynamic conditions. The sulfate monolayer adsorption capacity (qe = 23 mg/g) of the prepared agro-waste pellets was estimated from the adsorption isotherm results by employing the Langmuir model, and comparable fitting results were obtained by the Freundlich model. The dynamic adsorption properties were investigated via adsorption studies with a fixed bed column at pH 5.2. The effects of various parameters, including flow rate, bed height and initial concentrations of sulfate, were evaluated to estimate the optimal conditions for the separation of sulfate. The experimental data of the breakthrough curves were analyzed using the Thomas and Yoon–Nelson models, which provided satisfactory best-fits for the fixed bed kinetic adsorption results. The predicted adsorption capacities for all samples according to the Thomas model concur with the experimental values. The optimum conditions reported herein afford the highest dynamic adsorption capacity (30 mg/g) as follows: 1100 mg/L initial sulfate concentration, 30 cm bed height and 5 mL/min flow rate. The breakthrough time was measured to be 550 min. This study contributes to a strategy for controlled separation of sulfate using a sustainable biocomposite material that is suitable for fixed-bed column point-of-use water treatment systems.

Graphical Abstract

1. Introduction

Sulfate is a ubiquitous waterborne contaminant that contributes to water salinity worldwide, and which also affects the quality of safe drinking water (500 mg/L EPA limit) [1]. Elevated sulfate has been identified as a water security issue for agricultural irrigation or livestock operations in the province of Saskatchewan that is located in the Western Canada Sedimentary Basin, due to geological weathering and/or anthropogenic activities such as mining [2,3,4]. A poignant example of sulfate contamination with wide environmental ramifications can be highlighted in case of the Florida Everglades ecosystem through agricultural fertilizer run-off events, where methyl mercury production was linked to elevated sulfate in aquifers [5]. Conventional treatment methods for reducing water salinity include reverse osmosis (RO), ion exchange resins and biological sulfur removal, with variable efficiency and water treatment costs [6,7]. This trend has inspired the development of cost-effective and sustainable remediation strategies [8,9,10,11]. In contrast with membrane-based separations, adsorption-based processes offer a cost-effective removal strategy, especially for sustainable and renewable adsorbent materials [12,13,14]. The field of unconventional bioadsorbents has received greater attention due to efforts to address the United Nations Sustainable Development Goal 6 (UN-SDG6) for clean water and sanitation [12,15]. A crucial point concerning the efficacy of employing adsorbents in a real setting relates to their practical utility, especially for column filtration processes. Therefore, the morphology of the adsorbent material can pose limitations on the practical utility for wider deployment in pollutant-removal applications. For the case of beads and pellet-based systems, these adsorbent morphologies possess lower surface area and adsorption capacity versus powdered materials. The limited surface area of pelletized adsorbents must be addressed to increase their efficiency for practical applications. In particular, the development of bioadsorbents has received greater attention, since renewable materials offer cost advantages over conventional synthetic resins. Common and prevalent waste materials (e.g., from black liquor) are lignin and lignin-derived materials from (agro-)waste as bioadsorbents for cation [16,17] or anion contaminants [18].
In recent years, significant research interest in the conversion of low-value by-products (without extractive or fractionation procedures) into high-value composites for various applications has emerged, which includes biocomposites for water and wastewater treatment [10,14,19].
Agriculturally intensive regions of Saskatchewan produce a large acreage of crops along with equally large amounts of low-value, non-food agro-wastes, such as straw, oat hulls, etc. A selected list of pellet or bead type adsorbent systems for pollutant removal is given in Table 1.
Synthetic procedures for adsorbent preparation can vary significantly from washing and slight modification (Gubitosa et al. [22], Mohamed et al. [24]) with low capital input per kg adsorbent to more sophisticated and intensive treatment (Hamidon et al. [23]; Wang et al. [21]). Although these adsorbents may not reach the adsorption capacities of powdered adsorbents (ca. 500 mg/g for methylene blue and 625 mg/g for lead species by cow-dung-derived active carbon [26]), the benefits of other types of adsorbent morphology (e.g., beads, pellets, granules) include the ease-of-use and efficient column separation of pollutants from contaminated water sources, as compared to powdered materials [20,27].
Solgi et al. [12] reported the preparation of biocomposite pellet systems that contain chitosan (with and without surface modification) via crosslinking and/or calcium imbibing for sulfate removal. More recent developments have focused on cost reduction through agro-waste incorporation and their utility for removal of pollutants such as cations [20,21]. Further studies are required to establish the suitability of such agro-waste systems for the design of low-cost bioadsorbents for addressing sulfate removal, relative to higher cost systems such as chitosan-based pellets. Thus, the primary goal of this study was to evaluate pellets of a ternary biocomposite (kaolinite + chitosan + torrefied wheat straw) for efficacious sulfate separation from wastewater streams. Furthermore, it is posited that this study will demonstrate the utility of such pelletized biocomposite adsorbents for facile point-of-use separation of sulfate anions under dynamic fixed bed conditions.

2. Materials and Methods

Chitosan (low molecular weight, ca. 87% deacetylation degree) was obtained from the Pilot Plant Corp. at the University of Saskatchewan (Saskatoon, SK, Canada). Kaolinite (spectroscopic grade), KBr (FT-IR grade, 99%+), NaCl (ACS grade), barium chloride anhydrous (99.9%+) were obtained from Sigma-Aldrich (Oakville, ON, Canada). Glacial acetic acid (99.7%), NaOH (97%), HCl (36.5%), sodium sulfate anhydrous (ACS Grade, 99%+), glycerol and isopropanol were received from Fisher Scientific (Ottawa, ON, Canada). Wheat straw was torrefied at 220 °C for 8 min by the College of Engineering torrefaction plant at the University of Saskatchewan (Saskatoon, SK, Canada). The two-stage plant consists of two horizontal screw-driven moving beds, with a single drying/preheating stage and a torrefaction stage. The plant has a throughput of 10 kg of material per hour. A full description of the plant, including the process flow diagram was reported by Campbell [28]. Water (Millipore from Sigma Aldrich, Oakville, ON, Canada) was used for the synthesis and solution preparation, which had a resistivity of 18.2 MOhm·cm.

2.1. Adsorbent Preparation

Kaolinite and chitosan powder were used without additional grinding or treatment. To obtain the composite with 60% torrefied wheat straw content (WS60), the following procedure was followed: Torrefied wheat straw (WS) was ground and sieved through a combined sieving of coarse and fine powders (ca. 65 wt.% with particle size below 425 µm, and ca. 35 wt.% with particle size below 150 µm). The pelletized adsorbents were prepared in 10 g batches by mixing 6 g ground torrefied wheat straw, 1 g kaolinite powder, 3 g chitosan powder, and mixed with ca. 15–20 mL 0.5 M acetic acid (aq) to yield an extrudable paste. The blended paste was loaded into a glass syringe (5 mm extruding diameter). The extruded material (diameter = 5 mm) was cut into ca. 5–7 mm long pellets and dried for 24 h at room temperature. Subsequently, the pellets were washed in 250 mL 0.5 M NaOH solution for 16 to 24 h with occasional swirling of the quiescent solution. Then, neutralization was performed via washing in multiple steps with Millipore water until a pH 7–8 was reached.

2.2. Sulfate Concentration Determination and Adsorption Experiments

Sulfate concentration was determined via a turbidity method adapted from the Indian Standard 3025 method that employs BaCl2 and UV-VIS for concentration determination via turbidity formation [29]. Briefly, sodium sulfate solutions were prepared with Millipore water and an aliquot added to a 25 mL flask, where also 1.25 mL conditioning reagent (HCl (aq), isopropyl alcohol, glycerol, NaCl) was added to control the size uniformity of the resulting barium sulfate precipitate [30,31]. Herein, ca. 100 mg of BaCl2 was used for each sample analysis. The wavelength was set to 420 nm (Thermo Fisher Scientific Spectronic 200E). Adsorption isotherms were analyzed by fitting of the experimental results to the Langmuir and Freundlich isotherm models [32,33]. Dynamic adsorption experiments were conducted using a variable flow rate peristaltic pump (Fisherbrand 0.4—85.0 mL/min; Fishersci, Waltham, MA, USA).
For the equilibrium adsorption capacity, ca. 100 mg of pellets were used in 10 mL solution with varying initial sulfate concentration (C0) from 200 to 2100 mg/L. By comparison, for the dynamic adsorption studies, a glass column and peristaltic pumps were used with a bed height that changed in accordance with the amount of adsorbent, as described by Solgi et al. [13].
Sulfate desorption experiments were conducted after the adsorption process with subsequent washing with Millipore water to remove sulfate-laden water from the column from the exhausted material. NaCl (aq) was chosen to avoid extreme pH conditions (acidic/basic), due to potential pellet instability. Firstly, a 0.5 M NaCl (aq) solution was used to desorb sulfate and the pumping ceased once the measured sulfate concentration in the effluent stopped decreasing after the initial rise. Secondly, a 1.0 M NaCl (aq) was used to test for additional desorption and the measurements ceased after the measured sulfate concentration decreased or remained negligible. Thirdly, a 2.0 M NaCl (aq) solution was employed to strip the remaining sulfate from the column to evaluate whether any sulfate remained, and measurements stopped after the sulfate concentration in the effluent ceased to decline after the initial rise.

2.3. Materials Characterization

2.3.1. Thermogravimetric Analysis (TGA)

The weight loss profiles of the composites were carried out using a Q50 TA Instruments thermogravimetric analyzer (TA Instruments, New Castle, DE, USA). Samples were equilibrated in an open aluminum pan at 30 °C for 5 min to allow for equilibration prior to heating at 5 °C/min up to 500 °C.

2.3.2. FT-IR Spectroscopy

The FT-IR spectra were recorded using a Bio-Rad FTS-40 (Bio-Rad Laboratories, Inc., Hercules, CA, USA) in reflectance mode. Dry samples were mixed with FT-IR grade KBr in a 1:10 weight ratio (sample: KBr) and thoroughly mixed. The diffuse reflectance infrared Fourier transform (DRIFT) spectra were measured at 22 °C, over a spectral range of 400–4000 cm−1 with a resolution of 4 cm−1. A minimum of 128 scans were recorded and background correction was obtained with KBr as the background matrix; all reported spectra were normalized.

2.3.3. 13C Solids NMR Spectroscopy

13C NMR spectra were obtained with a 4 mm DOTY CP-MAS probe and a Bruker AVANCE III HD spectrometer operating at 125 MHz (1H frequency at 500.13 MHz). The 13C CP/TOSS (Cross Polarization with Total Suppression of Spinning Sidebands) spectra were obtained at a sample spinning speed of 7.5 kHz, a 1H 90⁰ pulse of 5 µs, and a contact time of 2.0 ms with a ramp pulse on the 1H channel. For all 13C NMR spectra, ca. 2500 scans were accumulated with a recycle delay of 1 s, along with a 50 kHz SPINAL-64 decoupling sequence during acquisition. 13C NMR chemical shifts were referenced to adamantane at 38.48 ppm (low field signal), where all spectra were normalized.

2.3.4. Acid Stability

The synthetic conditions showed that the morphology of WS60 appeared to remain stable in aqueous media above pH 6.5. Hence, the stability below pH 6.5 was also evaluated. The lower bound pH condition tested for the adsorption studies was selected near pH 5. In addition, a pH of 1.85 was tested to gain insight as to the stability of the materials under acidic pH, such as acid mine drainage conditions [34,35,36]. An acetate buffer (0.03 M) was used for pH 5 and HCl (aq) solution was used to adjust the solution to pH 1.85 prior to adding to the sorbent materials.

2.3.5. Mechanical Characteristics

Tension tests of the composites were performed to evaluate the Young’s modulus. The measurements were conducted using a Mark-10 Force Test Stand, ESM 1500LC. A 500 N load cell and Mark-10 Model5i digital force indicator was used. An elongated (ca. 5 cm) specimen was put between two parallel tensile jaw grips (large-model G1100). From the slope of the obtained stress-strain curve, Young’s modulus was calculated. All measurements were performed in triplicate with a calculated standard deviation. Stress is defined as the ratio of the applied load (F) in Newtons (N)) to the original cross-sectional area (S; mm²) of a sample (F/S; N/mm² or MPa) while strain can be described as the elongation (Δl/l) of the material (l represents the original length of the material). The equation for Young’s modulus (MPa) is defined according to Equation (1):
E = F l S Δ l

2.3.6. SEM Imaging

A Jeol JSM-6010LV (Tokyo, Japan) scanning electron microscope (SEM) with a tungsten filament source (accelerated voltage, 10 kV) was used for analyzing the surface morphology. The sample was gold coated prior to SEM imaging (Edwards S150B sputter coater; Crawley, UK). The instrument was used under a high vacuum imaging mode using a secondary electron image (SEI) detector. A slow scan mode (60 s−1) was used for all images.

2.3.7. Moisture Uptake and Density

For estimation of the moisture uptake, a relative humidity (RH) chamber with 97% RH (saturated potassium sulfate) was used and the pellets were placed inside. The weight was measured before exposure to the 97% RH and after 96 h within the chamber after reaching constant weight. The wt.% was calculated as the ratio of Δwt/(initial-wt). For density measurements, the physical dimensions of the pellets before and after exposure to 97% RH were measured (digital caliper with ±0.005 mm error; balance with ±0.1 mg error). Herein, six measurements for estimating the length and diameter were performed per pellet/experiment, and triplicate measurements were performed for each experiment.

3. Results and Discussion

In noted in Section 1 above, the overall goal of this study relates to the preparation of a pelletized agro-waste biocomposite adsorbent (WS60) over a suitable composition range and to evaluate the utility of WS60 for the separation of sulfate from water in a fixed bed column system. Based on the composition of the WS60 pelletized biocomposite (Table 2), several complementary characterization techniques were employed: IR/13C NMR spectroscopy, TGA, SEM imaging and mechanical properties. The sulfate adsorption properties were characterized under batch conditions at equilibrium and under kinetic conditions in a fixed bed column to gain insight on the optimal parameters to achieve controlled sulfate separation. Accordingly, the materials characterization and various parameters related to the fixed bed column studies were evaluated (initial sulfate concentration, flow rate, and column bed height), as described in the sections below.

3.1. FT-IR Spectral Characterization

FT-IR spectroscopy can be used to identify characteristic chemical groups, where changes in the spectral intensity and spectral band width may indicate chemical interactions between different groups (e.g., H-bonding). The composite and respective precursors were analyzed (Figure 1) by IR spectroscopy.
In Figure 1, kaolinite only shows characteristic peaks around 3700–3500 cm−1 (-OH groups) and SiO4 tetrahedral stretching around 1109 cm−1, Si-O-stretching around 1024 cm−1, Al-OH bending (918 cm−1) as well as Si-O-bending (532 cm−1) [37]. By contrast, chitosan shows broad -NH and -OH bands near 3500 cm−1, with a C-H band around 2800 cm−1 [38,39]. A sharp band near 1665 cm−1 indicates the presence of amine groups, combined with the characteristic C-O band around 1160 and 1120 cm−1 [39,40]. In contrast to chitosan, torrefied wheat straw shows no evidence of amine groups, but a band near 1730 cm−1, indicates a contribution due to ketones, potentially from lignocellulosic constituents as a result of the torrefaction process [41].
The WS60 composite exhibits no such identifiable signal around 1730, whereas the band at 1670 cm−1 corresponds to the N-H bending of chitosan. The skeletal C-O-C asymmetric stretching around 1050 cm−1 is observed as well as C-O vibrational bands near 1140 and 1120 cm−1, which indicate potential H-bonding between torrefied wheat straw and the additive components (chitosan and kaolinite). Furthermore, the presence of kaolinite was confirmed through the observed sharp bands around 3700 cm−1 [37,42].

3.2. 13C Solid State NMR Spectroscopy

To further investigate the composition of the pellets, solids NMR spectroscopy was used to probe the structural features and local environment of the carbon framework of the composite using 13C NMR nuclei of the organic fraction (wheat straw and chitosan) in the solid state (Figure 2).
In Figure 2, the spectra display prominent features of the polysaccharide fraction (50 to 110 ppm region) for wheat straw and chitosan, which are preserved in the ternary composite material [24,25]. Chitosan revealed sharp NMR bands around 175 ppm (C=O from the acetyl moiety) and 23 ppm (-CH3 group of the acetyl moiety). The carbohydrate framework between 50 and 110 ppm was observed for all constituents, whereas wheat straw had additional signals between 115 and 155 ppm that are indicative of ligneous materials (aromatic and/or unsaturated components), which can also be identified in WS60, albeit significantly abated. The upfield signal (ca. 30 ppm) observed for WS60 and torrefied wheat straw suggest that methylene carbons are adjacent to multiple C-O/C=O groups. These results concur with the greater upfield shift of the –CH3 group for chitosan [43].

3.3. Thermogravimetric Analysis

Analysis of the TGA profiles of materials can highlight their thermal stability and differences in the decomposition profiles, as shown by the inset in Figure 3. The weight loss profile or derivative weight loss profile (DTG) can be used to evaluate changes in the relative thermal stability of the precursors and the corresponding WS60 composite material (Figure 3).
In Figure 3, it can be observed that the differential analysis profile (DTG) profile of chitosan shows a sharp decomposition event near 300 °C, while torrefied wheat straw has a thermal event with an earlier onset temperature near 220–250 °C. The latter may relate to residual hemi-cellulosic constituents, while another thermal event near 350 °C relates to cellulosic components (in contrast to chitosan). After composite formation, the decomposition devolved into a broad overlapping peak with an onset temperature near 200 °C with lower stability compared to pristine torrefied wheat straw [44]; this concurs with the presence in chitosan and torrefied wheat straw of incorporated additives that contain O-based functional groups.

3.4. Mechanical Characteristics and Acid Stability

To briefly assess the mechanical characteristics (crucial to storage and transportation) pertinent to column applications of the adsorbent materials, several physical and mechanical properties are listed in Table 2.
The WS60 ternary composite exhibits a higher Young’s modulus (ca. 1447 MPa) compared to the chitosan pellets (characterized elsewhere [45]), indicating a beneficial contribution from the lignocellulosic wheat straw additive. Upon complete hydration of WS60 by exposure to moisture at 100% humidity), the Young’s modulus decreased to ca. 100 mPa. The WS60 composite has a density of 1.29 g/cm3 that occurs through blending to yield a dense composite material. It can be postulated that fibrous additives enhance the adhesion of components with a higher Young’s modulus compared to pure chitosan blends.
The WS60 composite was stable with decreasing pH until pH 5; a loss of chitosan was observed below pH 4.5–5, with partial dissolution at pH 1.85. This trend indicates that the composition of the material provides sufficient cohesion despite protonation of the amine-groups of chitosan, which aid in the dissolution of chitosan under acidic conditions that are prevalent in typical wastewater [25].

3.5. SEM Imaging

To develop a better understanding of the surface morphology of the WS60 composite pellet system, SEM imaging at variable magnification was carried out, as illustrated in Figure 4.
The coarse domains of the composite are visible at low magnification (Figure 4a,b), which can be attributed to the wheat straw particles and their elongated/fibrous shape. The distribution of the incorporated particles in the chitosan/kaolinite matrix is rather homogenous, which may account for the relative stability and resilience of pellets towards acidic conditions down to pH 5.

3.6. Equilibrium Adsorption and Sorbent Selection

3.6.1. Selection and Equilibrium Adsorption Experiment

The composition of 60% torrefied wheat straw was chosen for this study due to its relatively high agro-waste content and the presence of chitosan uniformly incorporated throughout the matrix [46]. A preliminary test showed that sulfate adsorption at pH 5.2 was considerably higher than at pH 6.5, due to greater protonation of the active amine-groups of chitosan. Therefore, pH 5.2 was selected for the experimental conditions. A pellet dosage of approximately 100 mg/10 mL was chosen for carrying out the batch equilibrium isotherm study [47]. The applicable sulfate concentration range (100–2100 mg/L) for equilibrium and column adsorption properties were evaluated as a baseline condition. Regarding the isotherm profiles in Figure 5, the Freundlich and Langmuir isotherm models are commonly used to characterize adsorption properties of adsorbent-adsorbate systems. The Freundlich model is an empirical model that enables characterization of heterogeneous adsorption sites, but it does not enable estimation of the adsorption capacity. The Langmuir model assumes strict monolayer adsorption onto homogeneous sites [48].
The adsorption profile of the sulfate uptake by the WS60 pelletized adsorbent reveals a sharp initial increase that approaches saturation of the adsorption sites near a residual equilibrium sulfate concentration (Ce) of 1000 mg/L. Fitting of the experimental data to the Freundlich (K = 9.7, n = 8.2; R² = 0.964) and the Langmuir (qe = 22.9 mg/g; R² = 0.959) models yields comparable goodness-of-fit results [32,33]. Although the dosage of the adsorbent can drastically influence the adsorption capacity due to the presence or absence of abundant adsorption sites [49], the profile reveals the viability and general adsorbent efficacy. Based on the isotherm studies, it can be posited that the adsorbent surface offers heterogeneous adsorption sites with a defined monolayer adsorption profile.
The adsorption profile of WS60 indicated the potential for anion exchange according to the chemisorption-like isotherm, as denoted by the sharp rise in uptake capacity at relatively low concentration. WS60 reveals sulfate adsorption properties even at low concentrations (below 500 mg/L), unlike other chitosan-based sorbent materials [50]. The promising removal efficiency of sulfate even at high concentrations by the pelletized WS60 adsorbent would reduce the toxicity of sulfate at levels that exceed 500 mg/L through such adsorption-based separation. This was further evaluated via dynamic adsorption studies that employed a fixed-bed column setup (Section 3.7).

3.6.2. Regeneration

Regeneration of adsorbent materials is a critical parameter for gauging the practical utility and cost-effectiveness of materials for practical applications. Aqueous NaCl was selected as the regenerant at neutral pH, in contrast to a NaOH washing solution. The use of acidic solutions for washing was avoided since it would lead to dissolution of the WS60 pellet material, due to protonation and solubilization of chitosan (pKa = 6.3). To simulate a process that is relevant for regeneration, the spent column was washed with water after exhaustion and then subjected to the lowest NaCl concentration with incremental levels of NaCl to evaluate the role of the regenerant (NaCl) concentration.
The regeneration (Figure 6) with 0.5 M NaCl (aq) resulted in partial sulfate desorption. Subsequent washing with 1.0 M NaCl (aq) did not result in release of the residual adsorbed sulfate, whereas a concentration of 2.0 M (aq) resulted in complete desorption of residual sulfate.
It can be surmised that sulfate at the labile surface sites of the adsorbent can be desorbed with 0.5 M NaCl solution, whereas less labile sulfate at the micropore sites may require a regenerant solution with greater ionic strength (2 M NaCl vs. 1 M NaCl) to fully regenerate the material. However, the use of elevated salt concentrations has a destabilizing effect on the mechanical stability of the pellet matrix, which renders the regenerated materials unsuitable for further use. The limited desorption with 0.5 M NaCl further indicates the utility of WS60 as single-use material, obviating any additional unit operations after the regeneration steps. This trend in desorption and WS60 pellet stability concurs with the role of chitosan as a binding agent, in conjunction with the role of acetic acid in maintaining the pellet microstructure, as reported previously for such ternary composite pellet systems [25].

3.7. Fixed-Bed Column Adsorption Experiments

To investigate the performance of the WS60 ternary composite pellets for the uptake of sulfate from water, the adsorption experiments were performed under dynamic conditions in a glass column with a diameter of 20 mm and a bed height of 50 mm. The pH of the sulfate solution in all adsorption experiments was held constant at pH 5.2 by using sodium acetate buffer (0.03 M). The lower part and the upper part of the column were packed with glass beads to prevent any movement of the granular WS60 adsorbent within the column. Additionally, this afforded a uniform flow rate within the column. The WS60 pellets were pre-soaked in Millipore water for 24 h to avoid the presence of bubble formation around the surface of the pellets during the adsorption process and to enable maximum swelling under equilibrium hydration conditions. The sulfate solution was pumped in an upward direction through the column (bottom to top) by employing a peristaltic pump to prevent any channeling. When the residual sulfate ions reached the head of the column, 2 mL samples were collected at variable time intervals to estimate the sulfate concentration of the effluent. As the sulfate concentration of the effluent reached equilibrium with the influent during the adsorption experiments, the influent flow to the column inlet was stopped. To assess the fixed bed parameters of the sulfate adsorption onto WS60, breakthrough curves were constructed. The profile is illustrated in a plot of the concentration ratio of sulfate in the effluent to the influent (Ct/C0) against time (t, min). The breakthrough point (tb) is the time required for Ct/C0 to reach 5%, and the exhaustion point (ts) occurs when adsorbents become saturated at Ct/C0 equal to 95%. Parameters of the dynamic adsorption can be calculated by the following equations.
Total   adsorption   capacity ,   q total   ( mg / g )   q t o t a l = Q C 0 1000 t = 0 t = t t o t a l 1 C t C 0 d t
  Treated   volume   at   breakthrough   point ,   V b   ( mL ) :   V b = Q · t b
Treated   volume   at   exhaustion   point ,   V s   ( mL ) : V s = Q · t s
Fixed - bed   adsorption   capacity   at ,   q e   ( mg / g )   q e = q t o t a l M
      Percentage   removal   of   sulfate ,   R ( % ) : R % = q t o t a l m t o t a l × 10
qtotal (mg) is the total amount of adsorbed ions, mtotal (mg) is the total amount of sulfate ions which were fed into the column during the adsorption process, Vb (mL) and Vs (mL) are the treated amount of simulated groundwater at breakthrough and exhaustion points, respectively, qe (mg/g) is the maximum adsorption capacity, R(%) is the percentage removal of sulfate, C0 (mg/L) and Ct (mg/L) are the sulfate concentrations of the initial influent and at time t (min), respectively. M (g) is the amount of adsorbent, and Q (mg/L) is the volumetric flow rate.

3.7.1. Effect of Initial Sulfate Concentration

The amount of sulfate ions during continuous adsorption depends mainly on the concentration of SO42− in its sodium salt form that flows into the column. Hence, an investigation of different initial sulfate concentrations is essential for the study of dynamic adsorption processes. In this research, various initial sulfate concentrations (500, 1100, and 2100 mg/L) were tested at a constant bed height of 40 cm, with a flow rate of 2 mL/min, and a pH of 5.2 (0.03 M sodium acetate buffer). According to Figure 7, most of the SO42− ions were adsorbed onto the pellets and Ct/C0 was equal to zero before 60 min of the reaction when the initial sulfate concentration was 500 mg/L. As the fresh sulfate influent solution migrated into the column and active sites on the pellets become occupied by adsorbed SO42−, the Ct/C0 ratio increased gradually until it reached 1. The latter condition indicates that the pellets were fully saturated with adsorbed sulfate ions. This phenomenon is related to the fact that at a constant bed height the number of active sites on the surface of the pellets remains constant. As the initial concentration of SO42− was increased, the active sites became saturated earlier in the kinetic profile, which led to a shorter breakthrough time and exhaustion time. For instance, the exhaustion time decreased from 1020 min to 740 min when the sulfate concentration of the influent was increased from 500 to 2100 mg/L. The trend was similar for 1100 and 2100 mg/L sulfate but with a steeper slope, as shown in Figure 7. A parallel trend was observed by Solgi et al. for sulfate uptake [13], and also by Chen et al. for mercury adsorption onto dendrimer-grafted polyacrylonitrile fibers (PANF-TU) in a fixed bed column at variable initial concentrations (50, 100, and 150 mg/L) that employed a constant inflow rate (10 mL/min), and bed depth (5 cm), at pH 6 [51].

3.7.2. Effect of Flow Rate

Figure 8 illustrates the breakthrough profiles for sulfate adsorption variable flow rates (mL/min): 2, 5, and 8 mL/min. Other operating parameters such as bed height (30 cm), initial sulfate concentration (1100 mg/L) and pH (5.2) were held constant. As noted in Figure 8, the breakthrough profiles shifted toward the origin when the flow rate increased from 2 to 8 mL/min, and the WS60 pellets became more rapidly saturated. In Table 3, the breakthrough parameters indicate an increase in the flow rate from 2 mL/min to 8 mL/min, which led to a decrease in the exhaustion time from 780 min to 360 min. Additionally, the adsorption capacity significantly increases from 38 to 60.2 mg/g when the flow rate increases from 2 to 5 mL/min. This can occur when a higher level of sulfate encounters the pellets at higher inlet flow rates, which results in greater adsorption capacity over a shorter time [24]. Greater inlet flow rates lead to higher adsorption capacity, where a higher flow rate is more favorable for fixed-bed adsorption, but if the flow rate increases beyond a specific value, it may lower the adsorption capacity. This occurs because of poor contact time between the adsorbate and the adsorbent, which was observed herein as the flow rate increased from 5 to 8 mL/min, where the dynamic adsorption capacity decreased from 60.2 to 59.0 mg/g. Based on these trends, the most favorable flow rate in this study was at 5 mL/min.

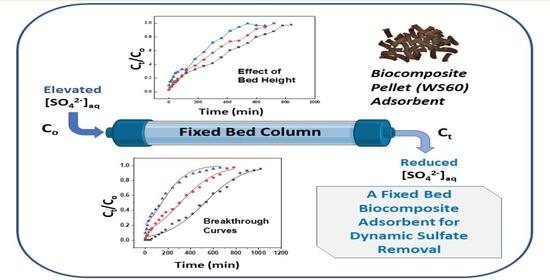
3.7.3. Effect of Bed Height

According to a previous report during a dynamic adsorption process, the breakthrough time and exhaustion time generally increase as the bed height increases, where the other operating parameters are held constant. In turn, this results in the treatment of more contaminated water [52,53], which occurs for two main reasons. Firstly, more active sites would be available for the target anions with the column as the packed bed length increases, where adsorbent saturation occurs over a longer interval. Secondly, the contact time between adsorbate and adsorbent increases as the adsorbent bed height increases, where the ions within the fixed-bed column have more time to adsorb onto the active adsorbent sites. To investigate the role of bed height on breakthrough profiles, various bed heights (20, 30, and 40 cm) were examined, while other operating parameters (flow rate, pH, and initial sulfate concentration) were held constant at 2 mL/min, pH 5.2, and 1100 mg/L, respectively. In Figure 9, the observed breakthrough profiles showed dissimilar behavior according to the common S-shaped profiles, where the ratio of Ct/C0 is equal to zero at the beginning of the process, which goes to 1 gradually as the adsorption process proceeds.
In Table 3, the breakthrough times for all the bed height conditions occur before the first samples were collected from the outlet, where greater bed depth values are suggested for adsorption of sulfate by the WS60 composite pellet. As the bed height increases from 20 cm to 30 cm, the adsorption capacity decreases from 45.7 to 38 mg/g. This is due to the inverse relation between adsorption capacities with the dosage of adsorbent. This inverse trend continues by increasing the bed height to 40 cm. Although the higher bed height has a positive effect on the mass transfer zone, it results in an attenuation of the column performance of the dynamic adsorption process with a greater adsorbent dosage.

Thomas Model

The Thomas model is a popular second-order kinetic model utilized in the field of dynamic adsorption studies. It offers valuable insights into the theoretical adsorption capacity and adsorption rate constant within a fixed-bed column. The model is defined by Equation (7), which allows for precise calculations and predictions [54]:
C t C 0 = 1 1 + e x p K T h Q q T h m C 0 Q t
KTh is the Thomas rate constant (mL/min.mg), Q is the volumetric inflow rate (mL/min), qTh is the theoretical adsorption capacity by the Thomas model (mg/g), m is the amount of packed adsorbent in the column (g), C0 is the concentration of adsorbate (mg/L) in the influent, Ct is the concentration (mg/L) of adsorbate in the effluent at a variable time, t.

3.7.4. Modeling of the Fixed-Bed Adsorption Results for Sulfate by the WS60 Pellet System

The fixed-bed experimental data at different operating parameters were applied and the predicted breakthrough curves and the calculated parameters for the Thomas model (Equation (6)) are presented in Figure 10a–c and Table 4. The relatively high values of the regression coefficient factor (R2) for all the tests indicated that the model favorably described the sulfate adsorption onto WS60.
The rate constant estimated by the Thomas model decreases constantly as the initial concentration of sulfate increases (Table 4), which relates to the higher driving force at elevated sulfate concentrations [55]. Moreover, Kth has an inverse relation with bed height, where the rate constant increases from 0.0058 to 0.0077 mL g−1 min−1 as the bed height decreases from 40 cm to 20 cm. Similar trends were noted at variable flow rates (Figure 8). By comparing the maximum adsorption capacity of sulfate onto WS60 with qTh derived from the Thomas model (see Table 4), the model provides reliable parameter estimates for the dynamic adsorption of sulfate.

Yoon–Nelson Model

The Yoon–Nelson equation is a simple mathematical model that accounts for the adsorption breakthrough behavior of a fixed-bed column in terms of the rate constant and the required time for 50% adsorbate breakthrough. This model is built on the theory of adsorbate probability which accounts for the adsorption probability of each adsorbate; this decreases in proportion to the probability of the bound adsorbate attaching to the adsorbent, including adsorbate breakthrough. Although this is a simple model with limited column parameters, it requires less computational time, and a key advantage relates to the absence of characteristic parameters of the adsorbent and adsorbate, which may pose limitations for this model [56]. The non-linear form of the Yoon–Nelson model is defined by Equation (8):
C t C 0 = 1 1 + e x p K Y N τ t
C0 (mg/L) and Ct (mg/L) are the initial concentration of sulfate and outlet concentration of sulfate at time t (min), respectively. kYN (min−1) is the rate constant of the Yoon–Nelson model and τ (min) is the time required for the sulfate concentration to reach twice its initial value (Ct/C0 = 0.5) [57].
The kinetic results were fitted to the non-linear form of the Yoon–Nelson model and the predicted breakthrough curves and parameters are presented in Figure 11a–c and Table 4, respectively. In Table 4, the value of R2 > 0.96 for all experiments; this indicates that the data can be predicted reliably by the Yoon–Nelson model. When the flow rate increases from 2 to 8 mL/min, the kYN increases from 0.0071 min−1 to 0.0140 min−1. As the flow rate increases from 2 to 8 mL/min, the required time for reaching 50% of the breakthrough (τ) decreases from 263.4 min to 61.5 min. This is related to a lower residence time of the sulfate ions on the fixed-bed column at higher flow rate [58]. As stated above, more active sites on the adsorbent surface of WS60 are available for the adsorbate as the bed height increases. Thus, the sulfate ions have a longer residence time in the column due to longer time intervals. In turn, the resulting time for reaching to the halfway mark of the breakthrough curve increases.

3.7.5. Error Analysis

In order to determine which kinetic model better describes the behavior of breakthrough curves, several error functions including the sum squares of error (SSE), coefficient of regression (R2) and chi square test (χ2) were employed (Table 5) [59].
S S E = i = 1 n ( C t C 0 e x p C t C 0 c a l ) 2
R 2 = 1 i = 1 n ( C t C 0 e x p C t C 0 c a l ) 2 i = 1 n ( C t C 0 e x p ) 2 ( i = 1 n C t C 0 e x p ) 2 / n
χ 2 = i = 1 n ( C t C 0 e x p C t C 0 c a l ) 2 C t C 0 c a l
Both models are in good concordance with the experimental data, where no appreciable differences were found for the goodness-of-fit between the Thomas and Yoon–Nelson models. The error analysis showed a good fit between the calculated and the experimental data (R² > 0.97) with low error values (SSE; χ2), as shown in Table 5.

4. Conclusions

In this study, a unique, low-cost agro-waste biocomposite pellet system was prepared that contains 60% torrefied wheat straw, and the sulfate adsorption properties were characterized under dynamic and equilibrium adsorption conditions. The sulfate adsorption capacity of the pelletized biocomposite at equilibrium conditions approaches 23 mg/g at pH 5.2, according to the Langmuir model. Structural destabilization of the pellet in 2 M NaCl solution was noted upon adsorbent regeneration, which highlights the pellet utility as a single point-of-use adsorbent material under these conditions.
Under dynamic conditions, the exhaustion time, with respect to the initial sulfate concentration decreases from 1020 min (500 mg/L) to 740 min (2100 mg/L). An increase in the flow rate shifts the breakthrough curves to shorter times with an increase in flow rate from 2 mL/min to 8 mL/min. This shifts the exhaustion time towards the origin with an increasingly steeper slope. The optimum flow rate was found to be 5 mL/min, where an increase in flow rate yielded an increase in the adsorption capacity (up to 60.2 mg/g). Greater flow rates did not lead to further increase in dynamic adsorption capacities. The optimum conditions reported herein resulted in a maximum dynamic adsorption capacity (30 mg/g), as follows: 1100 mg/L initial sulfate concentration, 30 cm bed height and 5 mL/min flow rate, where the breakthrough time was estimated at 550 min. The Yoon–Nelson and Thomas models confirm an excellent uptake efficiency at low sulfate concentrations, which is a critical parameter for such point-of-use remediation in sulfate- laden water.
This study investigated a low-cost and sustainable pelletized biocomposite derived from agro-waste material with minimal synthetic modification and chemical inputs. Furthermore, a praxis-oriented evaluation of dynamic adsorption parameters yielded an improved understanding of the sulfate adsorption properties under slightly acidic (pH 5.2) conditions. The pelletized biocomposites present a facile and versatile adsorbent material for point-of-use treatment of sulfate-laden water through adsorptive separation of sulfate via a fixed bed column filtration system.

Author Contributions

Conceptualization, L.D.W.; methodology, L.D.W.; investigation, B.G.K.S. and M.S.; data curation, M.S.; writing—original draft preparation, B.G.K.S. and M.S.; writing—review and editing, B.G.K.S., L.D.W. and M.S.; supervision, L.D.W.; funding acquisition, L.D.W. All authors have read and agreed to the published version of the manuscript.

Funding

This research was funded by the Ministry of Agriculture and the Canadian Agriculture Partnership, through the Agriculture Development Fund (Project #20170247). B.G.K.S. acknowledges the partial scholarship support provided by the University of Saskatchewan for this research. The APC was funded by the Separations Editorial Office of MDPI.

Institutional Review Board Statement

Not applicable.

Informed Consent Statement

Not applicable.

Data Availability Statement

Not applicable.

Acknowledgments

Richard Evitts is acknowledged for provision of a sample of torrefied wheat straw for this study.

Conflicts of Interest

The authors declare no conflict of interest.

References

  1. Environmental Protection Agency. Drinking Water Advisory: Consumer Acceptability Advice and Health Effects Analysis on Sulfate. Available online: https://www.epa.gov/sites/production/files/2014-09/documents/support_cc1_sulfate_healtheffects.pdf (accessed on 11 April 2023).
  2. Mossop, G.D.; Shetsen, I. Introduction to the Geological Atlas of the Western Canada Sedimentary Basin. Available online: https://ags.aer.ca/reports/atlas-of-the-western-canada-sedimentary-basin (accessed on 11 April 2023).
  3. Banks, P.J.; Banks, J.C. Relationship between Soil and Groundwater Salinity in the Western Canada Sedimentary Basin. Environ. Monit. Assess. 2019, 191, 761. [Google Scholar] [CrossRef]
  4. Feist, M.; Elford, C.; Bailey, P.; Campbell, J. A Review of Dugout and Well Water Tested for Livestock Quality in Southern Saskatchewan. Available online: https://pubsaskdev.blob.core.windows.net/pubsask-prod/106044/106044-Technical_Report_on_South_Saskatchewan_Water_Quality_-_March_2018.pdf (accessed on 11 April 2023).
  5. Bates, A.L.; Orem, W.H.; Harvey, J.W.; Spiker, E.C. Tracing Sources of Sulfur in the Florida Everglades. J. Environ. Qual. 2002, 31, 287–299. [Google Scholar] [CrossRef]
  6. Darbi, A.; Viraraghavan, T.; Jin, Y.-C.; Braul, L.; Corkal, D. Sulfate Removal from Water. Water Qual. Res. J. 2003, 38, 169–182. [Google Scholar] [CrossRef]
  7. Lee, D.-J.; Liu, X.; Weng, H.-L. Sulfate and Organic Carbon Removal by Microbial Fuel Cell with Sulfate-Reducing Bacteria and Sulfide-Oxidising Bacteria Anodic Biofilm. Bioresour. Technol. 2014, 156, 14–19. [Google Scholar] [CrossRef]
  8. Singh, N.B.; Nagpal, G.; Agrawal, S.; Rachna. Water Purification by Using Adsorbents: A Review. Environ. Technol. Innov. 2018, 11, 187–240. [Google Scholar] [CrossRef]
  9. Pincus, L.N.; Rudel, H.E.; Petrović, P.V.; Gupta, S.; Westerhoff, P.; Muhich, C.L.; Zimmerman, J.B. Exploring the Mechanisms of Selectivity for Environmentally Significant Oxo-Anion Removal during Water Treatment: A Review of Common Competing Oxo-Anions and Tools for Quantifying Selective Adsorption. Environ. Sci. Technol. 2020, 54, 9769–9790. [Google Scholar] [CrossRef]
  10. Hamad, H.N.; Idrus, S. Recent Developments in the Application of Bio-Waste-Derived Adsorbents for the Removal of Methylene Blue from Wastewater: A Review. Polymers 2022, 14, 783. [Google Scholar] [CrossRef]
  11. Desbrières, J.; Guibal, E. Chitosan for Wastewater Treatment. Polym. Int. 2018, 67, 7–14. [Google Scholar] [CrossRef]
  12. Crini, G.; Lichtfouse, E.; Wilson, L.D.; Morin-Crini, N. Conventional and Non-Conventional Adsorbents for Wastewater Treatment. Environ. Chem. Lett. 2019, 17, 195–213. [Google Scholar] [CrossRef]
  13. Solgi, M.; Tabil, L.G.; Wilson, L.D. Modified Biopolymer Adsorbents for Column Treatment of Sulfate Species in Saline Aquifers. Materials 2020, 13, 2408. [Google Scholar] [CrossRef]
  14. Zhou, H.; Margenot, A.J.; Li, Y.; Si, B.; Wang, T.; Zhang, Y.; Li, S.; Bhattarai, R. Phosphorus Pollution Control Using Waste-Based Adsorbents: Material Synthesis, Modification, and Sustainability. Crit. Rev. Environ. Sci. Technol. 2022, 52, 2023–2059. [Google Scholar] [CrossRef]
  15. UNESCO. Water Security and the Sustainable Development Goals, 1st ed.; Lim, K., Makarigakis, A.K., Sohn, O., Lee, B., Eds.; UNESCO: Paris, France, 2019. [Google Scholar]
  16. Elhafez, S.E.A.; Hamad, H.A.; Zaatout, A.A.; Malash, G.F. Management of Agricultural Waste for Removal of Heavy Metals from Aqueous Solution: Adsorption Behaviors, Adsorption Mechanisms, Environmental Protection, and Techno-Economic Analysis. Environ. Sci. Pollut. Res. 2017, 24, 1397–1415. [Google Scholar] [CrossRef]
  17. Ali, R.; Elsagan, Z.; AbdElhafez, S. Lignin from Agro-Industrial Waste to an Efficient Magnetic Adsorbent for Hazardous Crystal Violet Removal. Molecules 2022, 27, 1831. [Google Scholar] [CrossRef]
  18. Hamad, H.A.; AbdElhafez, S.E.; Elsenety, M.M.; Sorour, M.K.; Amin, N.K.; Abdelwahab, O.; El-Ashtoukhy, E.-S.Z. Fabrication and Characterization of Functionalized Lignin-Based Adsorbent Prepared from Black Liquor in the Paper Industry for Superior Removal of Toxic Dye. Fuel 2022, 323, 124288. [Google Scholar] [CrossRef]
  19. Kheilkordi, Z.; Mohammadi Ziarani, G.; Mohajer, F.; Badiei, A.; Varma, R.S. Waste-to-Wealth Transition: Application of Natural Waste Materials as Sustainable Catalysts in Multicomponent Reactions. Green Chem. 2022, 24, 4304–4327. [Google Scholar] [CrossRef]
  20. Jung, K.-W.; Jeong, T.-U.; Kang, H.-J.; Ahn, K.-H. Characteristics of Biochar Derived from Marine Macroalgae and Fabrication of Granular Biochar by Entrapment in Calcium-Alginate Beads for Phosphate Removal from Aqueous Solution. Bioresour. Technol. 2016, 211, 108–116. [Google Scholar] [CrossRef]
  21. Wang, Y.; Su, J.; Ali, A.; Chang, Q.; Bai, Y.; Gao, Z. Enhanced Nitrate, Manganese, and Phenol Removal by Polyvinyl Alcohol/Sodium Alginate with Biochar Gel Beads Immobilized Bioreactor: Performance, Mechanism, and Bacterial Diversity. Bioresour. Technol. 2022, 348, 126818. [Google Scholar] [CrossRef]
  22. Gubitosa, J.; Rizzi, V.; Cignolo, D.; Fini, P.; Fanelli, F.; Cosma, P. From Agricultural Wastes to a Resource: Kiwi Peels, as Long-Lasting, Recyclable Adsorbent, to Remove Emerging Pollutants from Water. The Case of Ciprofloxacin Removal. Sustain. Chem. Pharm. 2022, 29, 100749. [Google Scholar] [CrossRef]
  23. Hamidon, T.S.; Adnan, R.; Haafiz, M.K.M.; Hussin, M.H. Cationic Surfactant-Modified Cellulose Nanocrystal/Alginate Hydrogel Beads for Enhanced Adsorptive Removal of 4-Chlorophenol from Wastewater. J. Polym. Environ. 2022, 30, 5024–5048. [Google Scholar] [CrossRef]
  24. Mohamed, M.H.; Udoetok, I.A.; Solgi, M.; Steiger, B.G.K.; Zhou, Z.; Wilson, L.D. Design of Sustainable Biomaterial Composite Adsorbents for Point-of-Use Removal of Lead Ions From Water. Front. Water 2022, 4, 739492. [Google Scholar] [CrossRef]
  25. Steiger, B.G.K.; Zhou, Z.; Anisimov, Y.A.; Evitts, R.W.; Wilson, L.D. Valorization of Agro-Waste Biomass as Composite Adsorbents for Sustainable Wastewater Treatment. Ind. Crops Prod. 2023, 191, 115913. [Google Scholar] [CrossRef]
  26. Iwuozor, K.O.; Emenike, E.C.; Aniagor, C.O.; Iwuchukwu, F.U.; Ibitogbe, E.M.; Okikiola, T.B.; Omuku, P.E.; Adeniyi, A.G. Removal of Pollutants from Aqueous Media Using Cow Dung-Based Adsorbents. Curr. Res. Green Sustain. Chem. 2022, 5, 100300. [Google Scholar] [CrossRef]
  27. Jo, J.-Y.; Choi, J.-H.; Tsang, Y.F.; Baek, K. Pelletized Adsorbent of Alum Sludge and Bentonite for Removal of Arsenic. Environ. Pollut. 2021, 277, 116747. [Google Scholar] [CrossRef] [PubMed]
  28. Campbell, W.A. Adaptive Torrefaction of Stem Biomass in a Horizontal Moving Bed with Normalized Direct Measurement of Quality Characteristics. Ph.D. Thesis, University of Saskatchewan, Saskatoon, SK, Canada, 2018. Available online: http://hdl.handle.net/10388/11637 (accessed on 11 April 2023).
  29. IS 3025; (Part 24): Method of Sampling and Test (Physical and Chemical) for Water and Wastewater, Part 24: Sulphates (First Revision). Bureau of Indian Standards (BIS): Delhi, India, 2003.
  30. Morais, I.P.A.; Tóth, I.V.; Rangel, A.O.S.S. Turbidimetric and Nephelometric Flow Analysis: Concepts and Applications. Spectrosc. Lett. 2006, 39, 547–579. [Google Scholar] [CrossRef]
  31. Croker, D.M.; Kelly, D.M.; Horgan, D.E.; Hodnett, B.K.; Lawrence, S.E.; Moynihan, H.A.; Rasmuson, Å.C. Demonstrating the Influence of Solvent Choice and Crystallization Conditions on Phenacetin Crystal Habit and Particle Size Distribution. Org. Process Res. Dev. 2015, 19, 1826–1836. [Google Scholar] [CrossRef]
  32. Langmuir, I. The Adsorption of Gases on Plane Surfaces of Glass, Mica and Platinum. J. Am. Chem. Soc. 1918, 40, 1361–1403. [Google Scholar] [CrossRef]
  33. Freundlich, H.M.F. Über Die Adsorption in Lösungen. Z. Phys. Chem. 1906, 57, 385–470. [Google Scholar] [CrossRef]
  34. Runtti, H.; Tolonen, E.-T.; Tuomikoski, S.; Luukkonen, T.; Lassi, U. How to Tackle the Stringent Sulfate Removal Requirements in Mine Water Treatment—A Review of Potential Methods. Environ. Res. 2018, 167, 207–222. [Google Scholar] [CrossRef]
  35. Fernando, W.A.M.; Ilankoon, I.M.S.K.; Syed, T.H.; Yellishetty, M. Challenges and Opportunities in the Removal of Sulphate Ions in Contaminated Mine Water: A Review. Miner. Eng. 2018, 117, 74–90. [Google Scholar] [CrossRef]
  36. Hong, S.; Cannon, F.S.; Hou, P.; Byrne, T.; Nieto-Delgado, C. Adsorptive Removal of Sulfate from Acid Mine Drainage by Polypyrrole Modified Activated Carbons: Effects of Polypyrrole Deposition Protocols and Activated Carbon Source. Chemosphere 2017, 184, 429–437. [Google Scholar] [CrossRef]
  37. Jozanikohan, G.; Abarghooei, M.N. The Fourier Transform Infrared Spectroscopy (FTIR) Analysis for the Clay Mineralogy Studies in a Clastic Reservoir. J. Pet. Explor. Prod. Technol. 2022, 12, 2093–2106. [Google Scholar] [CrossRef]
  38. Lim, S.-H.; Hudson, S.M. Synthesis and Antimicrobial Activity of a Water-Soluble Chitosan Derivative with a Fiber-Reactive Group. Carbohydr. Res. 2004, 339, 313–319. [Google Scholar] [CrossRef]
  39. Eddya, M.; Tbib, B.; EL-Hami, K. A Comparison of Chitosan Properties after Extraction from Shrimp Shells by Diluted and Concentrated Acids. Heliyon 2020, 6, e03486. [Google Scholar] [CrossRef]
  40. Paluszkiewicz, C.; Stodolak, E.; Hasik, M.; Blazewicz, M. FT-IR Study of Montmorillonite–Chitosan Nanocomposite Materials. Spectrochim. Acta Part A Mol. Biomol. Spectrosc. 2011, 79, 784–788. [Google Scholar] [CrossRef]
  41. Santoni, I.; Callone, E.; Sandak, A.; Sandak, J.; Dirè, S. Solid State NMR and IR Characterization of Wood Polymer Structure in Relation to Tree Provenance. Carbohydr. Polym. 2015, 117, 710–721. [Google Scholar] [CrossRef]
  42. Hospodarova, V.; Singovszka, E.; Stevulova, N. Characterization of Cellulosic Fibers by FTIR Spectroscopy for Their Further Implementation to Building Materials. Am. J. Anal. Chem. 2018, 9, 303–310. [Google Scholar] [CrossRef]
  43. Karunarathna, M.S.; Smith, R.C. Valorization of Lignin as a Sustainable Component of Structural Materials and Composites: Advances from 2011 to 2019. Sustainability 2020, 12, 734. [Google Scholar] [CrossRef]
  44. Emiola-Sadiq, T.; Zhang, L.; Dalai, A.K. Thermal and Kinetic Studies on Biomass Degradation via Thermogravimetric Analysis: A Combination of Model-Fitting and Model-Free Approach. ACS Omega 2021, 6, 22233–22247. [Google Scholar] [CrossRef]
  45. Anisimov, Y.A.; Steiger, B.G.K.; Cree, D.E.; Wilson, L.D. Moisture Content and Mechanical Properties of Bio-Waste Pellets for Fuel and/or Water Remediation Applications. J. Compos. Sci. 2023, 7, 100. [Google Scholar] [CrossRef]
  46. Mohamed, M.H.; Udoetok, I.A.; Wilson, L.D. Animal Biopolymer-Plant Biomass Composites: Synergism and Improved Sorption Efficiency. J. Compos. Sci. 2020, 4, 15. [Google Scholar] [CrossRef]
  47. Esmaeili, H.; Foroutan, R.; Jafari, D.; Aghil Rezaei, M. Effect of Interfering Ions on Phosphate Removal from Aqueous Media Using Magnesium Oxide@ferric Molybdate Nanocomposite. Korean J. Chem. Eng. 2020, 37, 804–814. [Google Scholar] [CrossRef]
  48. Kalam, S.; Abu-Khamsin, S.A.; Kamal, M.S.; Patil, S. Surfactant Adsorption Isotherms: A Review. ACS Omega 2021, 6, 32342–32348. [Google Scholar] [CrossRef] [PubMed]
  49. Sumesh, K.; Saikrishnan, G.; Pandiyan, P.; Prabhu, L.; Gokulkumar, S.; Priya, A.; Spatenka, P.; Krishna, S. The Influence of Different Parameters in Tribological Characteristics of Pineapple/Sisal/TiO2 Filler Incorporation. J. Ind. Text. 2022, 51, 8626S–8644S. [Google Scholar] [CrossRef]
  50. Steiger, B.G.K.; Wilson, L.D. Modular Chitosan-Based Adsorbents for Tunable Uptake of Sulfate from Water. Int. J. Mol. Sci. 2020, 21, 7130. [Google Scholar] [CrossRef]
  51. Chen, C.; Chen, Z.; Shen, J.; Kang, J.; Zhao, S.; Wang, B.; Chen, Q.; Li, X. Dynamic Adsorption Models and Artificial Neural Network Prediction of Mercury Adsorption by a Dendrimer-Grafted Polyacrylonitrile Fiber in Fixed-Bed Column. J. Clean. Prod. 2021, 310, 127511. [Google Scholar] [CrossRef]
  52. Bacelo, H.; Santos, S.C.R.; Ribeiro, A.; Boaventura, R.A.R.; Botelho, C.M.S. Antimony Removal from Water by Pine Bark Tannin Resin: Batch and Fixed-Bed Adsorption. J. Environ. Manag. 2022, 302 Pt B, 114100. [Google Scholar] [CrossRef]
  53. Egbosiuba, T.C.; Abdulkareem, A.S. Highly Efficient As-Synthesized and Oxidized Multi-Walled Carbon Nanotubes for Copper(II) and Zinc(II) Ion Adsorption in a Batch and Fixed-Bed Process. J. Mater. Res. Technol. 2021, 15, 2848–2872. [Google Scholar] [CrossRef]
  54. Du, L.; Yang, J.; Xu, X. Highly Enhanced Adsorption of Dimethyl Disulfide from Model Oil on MOF-199/Attapulgite Composites. Ind. Eng. Chem. Res. 2019, 58, 2009–2016. [Google Scholar] [CrossRef]
  55. Basu, M.; Guha, A.K.; Ray, L. Adsorption of Lead on Lentil Husk in Fixed Bed Column Bioreactor. Bioresour. Technol. 2019, 283, 86–95. [Google Scholar] [CrossRef]
  56. Chatterjee, S.; Mondal, S.; De, S. Design and Scaling up of Fixed Bed Adsorption Columns for Lead Removal by Treated Laterite. J. Clean. Prod. 2018, 177, 760–774. [Google Scholar] [CrossRef]
  57. Luo, X.; Yuan, J.; Liu, Y.; Liu, C.; Zhu, X.; Dai, X.; Ma, Z.; Wang, F. Improved Solid-Phase Synthesis of Phosphorylated Cellulose Microsphere Adsorbents for Highly Effective Pb2+ Removal from Water: Batch and Fixed-Bed Column Performance and Adsorption Mechanism. ACS Sustain. Chem. Eng. 2017, 5, 5108–5117. [Google Scholar] [CrossRef]
  58. Kutty, S.R.M.; Almahbashi, N.M.Y.; Nazrin, A.A.M.; Malek, M.A.; Noor, A.; Baloo, L.; Ghaleb, A.A.S. Adsorption Kinetics of Colour Removal from Palm Oil Mill Effluent Using Wastewater Sludge Carbon in Column Studies. Heliyon 2019, 5, e02439. [Google Scholar] [CrossRef] [PubMed]
  59. Jha, D.; Haider, M.B.; Kumar, R.; Shim, W.G.; Marriyappan Sivagnanam, B. Batch and Continuous Adsorptive Desulfurization of Model Diesel Fuels Using Graphene Nanoplatelets. J. Chem. Eng. Data 2020, 65, 2120–2132. [Google Scholar] [CrossRef]
Figure 1. FT-IR spectra of chitosan, kaolinite, torrefied wheat straw and the WS60 biocomposite pellet material.
Separations 10 00262 g001
Figure 2. 13C solids NMR spectra of chitosan, torrefied wheat straw and the WS60 pellet material, where the inset shows an expansion of the 160–110 ppm spectral range.
Separations 10 00262 g002
Figure 3. Differential thermal analysis (DTG) of chitosan, kaolinite, torrefied wheat straw and the WS60 ternary composite material. Normalized TGA profiles are provided for reference in the inset.
Separations 10 00262 g003
Figure 4. SEM images of the prepared WS60 composite pellet with variable magnification: (a) 25×, (b) 30×, (c) 50×, (d) 100×, (e) 500× and (f) 5000×.
Separations 10 00262 g004
Figure 5. Isotherm adsorption studies of WS60 composite pellet and sodium sulfate at pH 5.2 after a 24 h equilibration period.
Separations 10 00262 g005
Figure 6. Desorption test to evaluate regeneration of the composite material with 0.5 M NaCl colution and subsequent use of 1.0 M and 2.0 M NaCl solution to attain an in-depth desorption profile for sulfate stripping.
Separations 10 00262 g006
Figure 7. Breakthrough curve for the adsorption of sulfate onto WS60 composite pellet at different initial sulfate concentrations. Bed depth, 40 cm; flow rate, 2 mL/min; pH 5.2 (0.03 M sodium acetate buffer).
Separations 10 00262 g007
Figure 8. The effect of inlet flow rate on the adsorption of sulfate by WS60 in a fixed-bed column. Bed height, 30 cm; pH 5.2, with 0.03 M sodium acetate buffer; inlet sulfate concentration, 1100 mg/L.
Separations 10 00262 g008
Figure 9. The effect of bed height on the adsorption of sulfate by WS60 in a fixed-bed column. Flow rate, 2 mL/min; pH 5.2 (0.03 M sodium acetate buffer); inlet sulfate concentration, 1100 mg/L.
Separations 10 00262 g009
Figure 10. Breakthrough curves predicted by the Thomas Model under variable conditions: (a) variable bed heights, (b) variable initial sulfate concentration and (c) different inflow rates.
Separations 10 00262 g010
Figure 11. Predicted breakthrough curves by the Yoon–Nelson Model. (a) variable bed height conditions, (b) variable inflow rate, and (c) variable initial sulfate concentration.
Separations 10 00262 g011
Table 1. Non-powdered adsorbents derived from agro-waste sources for contaminant removal.
CitationAdsorbent Material
(Pellets or Beads)
ContaminantCapacity
(mg/g)
Year
Jung et al. [20]Alginate/BiocharPhosphate1582016
Solgi et al. [13]Chitosan/Ca-ChitosanSulfate472020
Wang et al. [21] *Alginate/Corncob Char/BacteriaNitrate/phenol/Mn(II)95/73/94 *2022
Gubitosa et al. [22]Kiwi PeelCiprofloxacin402022
Hamidon et al. [23]Nanocellulose Beads4-Chlorophenol652022
Mohamed et al. [24]Agro-Waste/ChitosanLead1.92022
Steiger et al. [25]Agro-Waste/ChitosanMethylene Blue1352023
* Note: The contaminant removal in this study is stated as removal in % (not as mg/g capacity).
Table 2. Mechanical and physicochemical properties of the WS60 biocomposite pellets.
Sample
ID
Young’s
Modulus
(E, MPa; Dry)
Young’s Modulus
(E, MPa; Wet)
Density
(ρ, g/cm3)
Moisture Uptake
(wt.%)
WS601447 ± 64102 ± 101.29 ± 0.03340 ± 9
Table 3. Breakthrough parameters for the adsorption of sulfate onto WS60 under variable conditions, with pH 5.2 (sodium acetate buffer, 0.03 M).
#C0
(mg/L)
Z
(cm)
Q
(mL/min)
ts
(min)
qe
(mg/g)
1500402102026.1
2110040274038.7
3210040254039.5
4110020262045.7
5110030278038.0
6110030555060.2
7110030836059.0
Table 4. Predicted parameters of Yoon–Nelson and Thomas models, and model deviations for sulfate adsorption onto WS60.
C0
(mg/L)
Z
(cm)
Q
(mL/min)
Thomas ModelYoon–Nelson Model
kTH
(mL g−1 min−1)
qTH
(mg/g)
R2kYN
(min−1)
τ
(min)
R2
5004020.011926.10.9890.0059522.40.989
11004020.005835.60.9800.0064307.70.981
21004020.004436.60.9760.0092144.70.976
11002020.007742.00.9900.0085190.90.990
11003020.006046.10.9780.0071263.40.978
11003050.006857.40.9730.0083212.70.977
11003080.012054.30.9500.014061.50.960
Table 5. Error analysis for both Thomas and Yoon–Nelson model.
C0
(mg/L)
Z
(cm)
Q (mL/min)Thomas ModelYoon–Nelson Model
kTH
(mL g−1 min−1)
qTH
(mg/g)
R2SSEχ2kYN
(min−1)
τ
(min)
R2SSEχ2
5004020.011926.10.9890.030.0010.0059522.40.9890.030.001
11004020.005835.60.9800.040.0020.0064307.70.9810.040.002
21004020.004436.60.9760.030.0020.0092144.70.9760.030.002
11002020.007742.00.9900.030.0010.0085190.90.9900.020.001
11003020.006046.10.9780.050.020.0071263.40.9780.050.003
11003050.006857.40.9730.040.030.0083212.70.9770.030.002
11003080.012054.30.9500.040.030.014061.50.9600.030.002
Disclaimer/Publisher’s Note: The statements, opinions and data contained in all publications are solely those of the individual author(s) and contributor(s) and not of MDPI and/or the editor(s). MDPI and/or the editor(s) disclaim responsibility for any injury to people or property resulting from any ideas, methods, instructions or products referred to in the content.

