Abstract
Iron oxidase was proposed to be the initial electron acceptor from the ferrous ion in the iron oxidation of the Acidithiobacillus genus for metal bioextraction; however, its most fundamental property of direct ferrous oxidation kinetics remains undetermined due to the confusion of reaction monitor method. Here, a recombinant iron oxidase from Acidithiobacillus ferridurans Riv11 was constructed, expressed, purified, characterized, and further used to investigate the kinetics and mechanism of ferrous oxidation. This protein is more stable in an acid solution than in a neutral solution. An infrared characteristic peak around 1050 cm−1 of the [Fe4S4] cluster was identified. The [Fe4S4] cluster does not affect the secondary structure of protein, but plays an important role in the stability of protein and strongly absorbs the intrinsic fluorescence of protein, resulting in a great loss of the fluorescence emission. The protein has far more absorbance than those of the iron ions in solution in the visible region; therefore, the maximum difference absorbance around 500 nm between the oxidized and reduced states of protein can be used to monitor the reaction of ferrous oxidation. Accordingly, the kinetic rate constant of the reaction was determined. Bioinformatics analysis and molecular simulation further revealed the underlying molecular mechanism that ferrous ions approach the protein at the edge of a large hydrophobic surface patch nearest to the [Fe4S4] cluster from a direction far from all positively charged residues, which enough enables an efficient electron transfer.
1. Introduction
Metal bioextraction (biometallurgy) is a technology that extracts valuable metals, e.g., Cu, Au, U, Zn, Ni, and Co, from ores through the use of microorganisms [1,2,3,4,5,6,7], and became one of the most important industrial methods of processing low-grade complex refractory ores [1,2,3,8], so the concerned microorganisms and proteins drew tremendous attention [9,10]. The bacteria of the Acidithiobacillus genus are the most used and famous microorganisms in this technology due to their capabilities of iron and sulfur oxidation to decompose ores in an extremely acidic bioleaching environment full of various toxic metal ions [9,10,11,12,13,14]. Iron oxidase is present in the iron-oxidazing bacteria of the Acidithiobacillus genus and plays a vital role in their ferrous biooxidation [9,10,11,15,16,17,18,19,20,21]. In 1986, Fry et al. reported that an iron–sulfur protein from A. ferrooxidans participates in the oxidation of ferrous ions [15]. Then, Fukumori et al. purified and identified this protein [16], and Kusano et al. cloned and sequenced the gene for it from the A. ferrooxidans strain Fe1 and called it iron oxidase, or Iro for short [17]. Thereafter, the iron oxidase from the A. ferrooxidans strain BRGM was purified and characterized [18], the recombinant iron oxidase from A. ferrooxidans strain Fe1 was further successfully expressed in E. coli, and its mutations and stabilization were also investigated [20,21]. The iron oxidase precursor from A. ferrooxidans consists of 90 amino acid residues, including a 37-residue signal peptide. The mature iron oxidase harbors a [Fe4S4] cluster and is a member of the high redox potential iron–sulfur protein (HiPIP) family of ferredoxins [22,23,24].
HiPIPs are usually found in purple phototrophic bacteria as periplasmic electron carriers between the bc1 complex and either the photosynthetic reaction center complex or a terminal oxidase, and form a class of small proteins (6–10 kDa) with an iron–sulfur cluster undergoing a one-electron reaction between [Fe4S4]3+ and [Fe4S4]2+ [23,24]. Acidithiobacillus are non-phototrophic bacteria; therefore, the role of iron oxidase in these bacteria is different from the role of the HiPIPs in the phototrophic bacteria. The iron oxidase from A. ferrooxidans was proposed to be the first electron acceptor for oxidation of ferrous ion to ferric ion in several alternative models of the electron transfer chain between ferrous ion and oxygen [9,10,15,16,17,18]. The produced ferric ion is a potent oxidant for attacking sulfide ores, resulting in the decomposition of the ores, and consequently, the release of their metal ions into the acidic mine solution for extraction purposes, which constitutes the core mechanism of mineral bioleaching [1,3,8]. Recently, more and more whole genomic sequences of bacteria in the Acidithiobacillus genus were sequenced [12,13,14], a diversity of iron oxidases were further found to be widely present in the iron-oxidazing bacteria of the Acidithiobacillus genus [12,13], and some alternative roles of iron oxidase were also proposed [12,13,14,25].
However, till now, all understanding of iron oxidase was limited to that from A. ferrooxidans, and particularly, as an enzyme that acts on ferrous ion, the most fundamental property of direct ferrous oxidation reaction kinetics of iron oxidase remains undetermined due to the unestablishing of the reaction monitor method. Most spectral properties of iron oxidase are derived from the [Fe4S4] in protein [22], which can be formally represented by the combination of the ferric ion (Fe3+) and ferrous ion (Fe2+), with the oxidized state containing 3Fe3+Fe2+ and the reduced state having Fe3+3Fe2+ [26]. As a result, in many properties, iron oxidase is inevitably overlapped and entangled with the substrate of Fe2+ and the product of Fe3+, which makes the task of monitoring this reaction very confusing and unintuitive. Therefore, a comprehensive understanding of the properties of iron oxidase needs to be carried out so as to find an appropriate reaction monitor method for the investigation of the ferrous oxidation reaction kinetics and further uncover the underlying molecular mechanism.
This study aims to investigate the direct kinetics and molecular mechanism of the ferrous oxidation of iron oxidase. Here, a recombinant iron oxidase from Acidithiobacillus ferridurans Riv11 [13,27] was constructed, expressed, and purified. After a comprehensive investigation of the properties of the protein, the maximum difference absorbance around 500 nm between the oxidized and reduced states of the protein was selected to monitor the reaction of ferrous oxidation. The kinetic rate constant of electron transfer from the ferrous ion to the protein was determined. Bioinformatics analysis and molecular simulation provided a deep insight into the properties of the protein and further revealed the underlying molecular mechanism of ferrous oxidation.
This work extends the understanding of iron oxidase, establishes a research method for the kinetics of iron oxidase, reveals an enzymic molecular mechanism of iron oxidase, lays a foundation for potential applications of the protein in enzymology, biosensor, genetic engineering, etc., and finally contributes to uncovering the whole mechanism of ferrous oxidation of the bacteria of Acidithiobacillus and improving the bioleaching efficiency of the important industrial application of metal bioextraction.
2. Materials and Methods
2.1. Gene Synthesis, Expression, and Purification of Recombinant Iron Oxidase
A. ferridurans is an important iron-oxidazing species of the Acidithiobacillus genus and was frequently reported to be used in the bioleaching of low-grade uranium ores [27,28,29] [x]. This species has the greater tolerances to high-concentration iron and extreme acidity, and greater propensity of growth on hydrogen as the sole electron donor compared to other species. The strain Riv11 of A. ferridurans was isolated from acidic iron-rich water [27,28,29] and its whole genome was sequenced and deposited in the public sequence database of NCBI (Accession #: JABBDS000000000) [13]. A gene-encoding iron oxidase (Figure S1, gene locus HF668_06170, GeneBank accession WP_215878501) was found to be present in the genome, whose protein sequence has an identity of 74.44% to the iron oxidase from A. ferrooxidans strain Fe1 (Figure S2). Therefore, this iron oxidase from A. ferridurans strain Riv11 is a good candidate for investigating the direct kinetics and molecular mechanism of the ferrous oxidation of iron oxidase.
The iron oxidase from A. ferridurans Riv11 was selected as the target protein. The prokaryotic protein expression strategy in vitro of E. coli [30] and the nickel affinity chromatography purification method were adopted [31]. The recombinant iron oxidase was made up of the mature iron oxidase (amino acids 38–90) and an N-terminal His-tag (MHHHHHHG) that helps protein purification by nickel affinity chromatography. The gene sequence of it was regenerated by codon optimization according to the amino acid sequence using the GenSmart™ Codon Optimization tool and adding ligase sequences of the NdeI restriction site at the 5′-terminal and the HindIII restriction site at the 3′-terminal, respectively, as shown in Text S1, and then putting into direct synthesis (GenScript Biotech Corporation). The synthesized sequence was inserted into the HindIII and NdeI restriction sites in the pET-30a expression vector using the Gibson Assembly method (New England Biolabs), generating the plasmid of pET-30a::Iro. The constructed plasmid was finally transformed into E. coli strain BL21 competent cells for expression purposes. Plasmid isolated from the culture of the expression strain was further confirmed by electrophoresis on a 0.9% agarose gel stained with ethidium bromide and custom sequencing for the correct sequence.
The E. coli BL21 (DE3) with pET-30a::Iro plasmid was grown in Luria–Bertani (LB) medium containing 50 mg/L kanamycin at 37 °C. When the culture reached an OD600 of 0.8–1.0, the cells were induced with 0.5 mM isopropyl β-D-1-thiogalactopyranoside (IPTG) for 16 h at 15 °C with 220 rpm shaking for the overexpression of the recombinant iron oxidase from A. ferridurans Riv11. The cells were harvested by centrifugation, resuspended in lysis buffer (20 mM phosphate pH 8.0, 300 mM NaCl containing 30 mM imidazole), and lysed by a sonicator or microfluidizer. Cell debris was removed by centrifugation at 39,000× g for 30 min at 4 °C. The supernatant was loaded on a pre-equilibrated nickel affinity column (GE Healthcare, Chicago, IL, USA) [31]. This column filled with a resin containing nickel ions (Ni2+) that were immobilized by covalently attached nitrilotriacetic acid (NTA) in advance. The recombinant protein was engineered to have six consecutive histidine residues (HisTag) on the amino terminus. The immobilized nickel ions have a high-affinity binding to the six consecutive histidine residues, giving a highly selective adsorption to the recombinant protein. The tight association between the Ni-NTA resin and the HisTag allows contaminants to be easily washed away under stringent conditions, yet the bound proteins can be gently eluted by competition with imidazole. The column was washed with 100 column volumes of lysis buffer and eluted with a linear gradient from 30 to 300 mM imidazole over ten column volumes using elution buffer (20 mM phosphate pH 8.0, and 300 mM NaCl containing 300 mM imidazole). The protein fractions were identified by absorbance at 280 nm, and purity was analyzed by Tricine (16.5%) sodium dodecyl sulfate-polyacrylamide gel electrophoresis (SDS-PAGE) stained with Coomassie blue. Pure protein fractions were pooled and dialyzed against a dialysis buffer of 10 mM phosphate pH 8.0, 300 mM NaCl. A protein sample was incubated with a five-fold excess of both Na2S and Fe(NH4)2(SO4)2 in the presence of dithiothreitol, leading to the complete reconstruction of holoprotein, which was further characterized following gel filtration chromatography. Protein samples were subsequently desalted in an Amicon 1.5 K molecular weight cutoff spin concentrator (Millipore, Burlington, MA, USA), and the dialysis buffer added 10 mM EDTA exchange at least three times to remove any trace metals. The protein sample was finally dialyzed against a solution of HCl pH 2.0, 300 mM NaCl for research purposes and stored with 30% glycerol at −20 °C until needed. Iron assays were performed by the colorimetric method [32], and sulfide content was determined according to Siegel [33].
Purified protein was oxidized with sodium hexachloroiridate (Na2IrCl6) and desalted to obtain its oxidized [Fe4S4]3+ state, and reduced with sodium dithionite (Na2S2O4) and desalted to obtain its reduced [Fe4S4]2+ state [34]. For the preparation of apo protein, the solution of holo protein was diluted to a concentration of 1 mg/mL. A solution of 7.6 M guanidine hydrochloride was added dropwise with stirring to achieve a final concentration of 5 M, and this solution was cooled to 4 °C. A solution of 12 N HCl was added to a final concentration of 0.5 N, and the brown or dark green solution immediately turned pink and finally became colorless. This clear solution was agitated under Ar flow for 30 min and neutralized with a concentrated Tris-base solution to pH 7.0. The obtained apo protein was exchanged by Amicon ultrafiltration into pH 7.0 distilled water three times, and subsequently, the solution of HCl pH 2.0, and 300 mM NaCl was exchanged several times. The various desired concentrations and desalinations of the protein samples were achieved via ultrafiltration in an Amicon 1.5 K molecular weight cutoff spin concentrator (Millipore). The concentrations of the protein were determined by using the Bradford method, by optical absorption at 280 nm according to its extinction coefficient [22], or by optical absorption using an ε388 of 18,000 M−1cm−1 for the holo protein [34].
2.2. Analytical Methods
The molecular mass of protein was determined using an UltraXex™ TOF/TOF spectrometer (Bruker Daltonics, Billerica, MA, USA) equipped with a nitrogen laser (337 nm) and operated in reflector/delay extraction mode. An accelerating voltage of 25 kV was used for this study. The matrix-assisted laser desorption/ionization time-of-flight mass spectrometry (MALDI-TOF-MS) result was obtained in a linear positive mode from m/z 2500 to 10,000 using α-cyano-4-hydroxy-cinnamic acid (a saturated solution in 50% acetonitrile with 0.1% trifluoroacetic acid) as the ultraviolet (UV)-absorbing matrix. Theoretical molecular mass was calculated with the Compute pI/Mw tool from the Expasy Proteomics Server of the Swiss Institute of Bioinformatics (SIB). Electronic paramagnetic resonance (EPR) spectra were recorded at 100 K on a JES-FA200 spectrometer using the settings parameters of 1 min sweep time, 9.195 GHz frequency, and 0.998 Mw intensity. Fourier transform infrared (FTIR) spectroscopy was performed on a NEXUS 670 FTIR spectrometer (Thermo Nicolet, Madison, WI, USA) after the protein samples were freeze-dried into solids. Circular dichroism (CD) spectra were carried out at 25 °C using a Jasco J810 spectropolarimeter. The far-UV spectra of the proteins were measured from 190 to 260 nm. Instrument settings: response 1 s, speed 50 nm/min, an average of four scans, and path length 1 mm. The data were processed by subtracting the buffer spectrum. Differential scanning calorimetry (DSC) experiments were performed on a Nano-DSC calorimeter (TA Instruments-Waters LCC, New Castle, DE, USA). The collected DSC data were analyzed using Nano Analyze software. The DSC endothermic peak of protein denaturation was fitted by the two-state scale model after subtracting the buffer baseline. According to the fit results, a heat capacity curve with information regarding denaturation temperature (Tm) and calorimetric enthalpy (ΔH) was obtained. The fluorescence spectra were collected at 25 °C on an F-38 luminescence spectrometer (GANGDONG SCI&TECH. Co., Ltd., Tianjin, China) at operating parameters of excitation lit width of 2.5 nm, emission lit width of 10 nm, and photomultiplier tube (PMT) voltage of 400 volts. UV-visible (UV-Vis) spectral scanning was performed on a Techcomp UV-2300 spectrophotometer.
2.3. Kinetic Measurement between Oxidized Iron Oxidase and Ferrous Ion
Kinetic experiments were carried out on an SX 20 stopped-flow spectrometer (Applied PhotoPhysics Ltd., Leatherhead, UK). It was used in single mixing mode and the reactions were monitored using absorption detection at 500 nm. Samples of the oxidized iron oxidase and the ferrous ion at various concentrations were all prepared in identical degassed anaerobic solutions of HCl pH 2.0, 300 mM NaCl. Reactions were initiated by mixing equal volumes of ferrous ion and the oxidized iron oxidase solutions directly in the stopped-flow machine. Each reaction was permitted to proceed to between 95% and 98% completion. The concentration of the oxidized iron oxidase in the reaction system was 0.5 mM after being immediately mixed, and the concentrations of ferrous ion were at 1, 2, 4, 6, 8, and 10 mM, respectively, after being immediately mixed. The concentrations of ferrous ion were in 10-fold or greater excess than those of the protein, ensuring a pseudo-first-order condition and allowing the concentrations of ferrous ion to be treated as constants during the experiments. The baseline was measured with the protein solution mixed with an equal volume of blank solution in the mixing syringe. Each trace was determined in quadruplicate. All temperatures were maintained at 25 °C. The kinetic measurement adopts the pseudo-first-order rate model method [35].
2.4. Bioinformatics Analysis and Molecular Simulation
All the sequences for bioinformatics analysis can be obtained from the public NCBI Genebank (https://www.ncbi.nlm.nih.gov (accessed on 7 October 2023)). The sequence similarity search was conducted using BLAST (www.ncbi.nlm.nih.gov/blast/ (accessed on 7 October 2023)). Sequence alignment and phylogenetic analysis were carried out on Clustal Omega (https://www.ebi.ac.uk/Tools/msa/clustalo/ (accessed on 7 October 2023)). Signal peptide prediction was performed on SignalP (www.cbs.dtu.dk/services/SignalP/ (accessed on 7 October 2023)). The hydrophobicity analysis for amino acid residues is based on the hydrophobicity values in the Kyte and Doolittle hydrophobicity values [36]. The net charge of amino acid residues at different pH conditions is computed according to the initial pKa values for standard amino acids [37]. Protein structure modeling and molecular simulations were accomplished by Insight II and CHARMm software (Accelrys Inc., San Diego, CA, USA). The visualizations of molecular models were carried out using PyMOL (Schrödinger Inc., New York, NY, USA, https://pymol.org (accessed on 7 October 2023)) or Discover Studio 4.0 (Accelrys Inc., San Diego, CA, USA) software. The structure (PDB number 1ISU) of the HiPIP from Rhodocyclus tenuis [24] was obtained from RCSB PDB (https://www.rcsb.org/ (accessed on 7 October 2023)) and used as the template to predict the initial structure of the iron oxidase by the Modeler program. The [Fe4S4]3+ cluster was then added to build the holoprotein model by hand. The protein was added with hydrogen atoms at a pH of 2.0. Then, a 2 nm layer of water molecules was encompassed to the holoprotein by using the TIP3P model. This model system was optimized by several procedures of molecular simulation. The final protein model was assessed by ProStat and Profile3D and served as the initial model of the protein for the molecular interaction simulation.
For the molecular simulation of the interaction between iron oxidase and ferrous ion, a simulated box of 60 Å × 60 Å × 60 Å was used. A three-dimensional periodic boundary condition was adopted. The modeled molecule of iron oxidase was first set in the center of the box, then twenty ferrous ions ([Fe(H2O)6)]2+) and sulfate ions (SO42−) were randomly added into the box. Sodium and chloride ions were also put in to neutralize the system and the ionic strength was set to 0.3 M. The ions are modeled by a potential proposed by Beglov and Roux [38]. The rest of the box was then filled with water molecules by the TIP3P model. The protein was kept fixed during the simulation. The potential parameters are used from the CHARMM force field. Electrostatic interactions were measured by the shifted potential with a cutoff distance of 11 Å. Bonds containing hydrogen were kept rigid using the RATTLE method with a geometric tolerance of 10−6. The short-range nonbonded interactions were measured by a switched potential with a switching function reaching zero at a distance of 11 Å and starting at 10 Å. The starting velocity of each atom was assigned from a Maxwell–Boltzmann distribution. The molecular dynamics (MD) simulation was performed in a NVT ensemble at 300 K. The Berendsen method was adopted to keep the system temperature constant. A heat bath was coupled with the system using a coupling time of 0.1 ps and performed with a time step of 1 fs over a period of 1 ns. The distances of all ferrous ions to the iron oxidase during the simulation when stable were monitored and the contact sites of the protein by all ferrous ions at each time were counted. The contact configuration of the ferrous ion with the iron oxidase with the highest contact frequencies was selected as the interaction model for the analysis of electron transfer from ferrous ion to iron oxidase.
3. Results
3.1. Expression and Purification of Recombinant Iron Oxidase from A. ferridurans Riv11
The expression systems in vitro of the E. coli BL21 hosting vector pET-30a::Iro plasmid for the recombinant iron oxidase from A. ferridurans Riv11 was built. The plasmid was extracted and checked with enzyme-digested agarose gel electrophoresis analysis (Figure 1a) and an electrophoretic band corresponding to the length of the target gene was present, indicating the success of the gene ligated into the plasmid. This plasmid was further sequenced between the T7 and T7-terminal sites and confirmed that the sequence construction was completely correct.
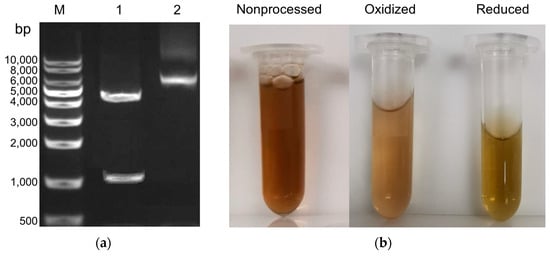
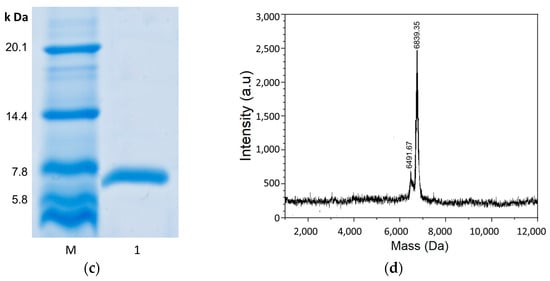
Figure 1.
Expression, purification, and characterization of the recombinant iron oxidase from A. ferridurans. (a) Agarose gel electrophoresis analysis. Lane M, nucleic acid length mark. Lane 1, the plasmid digested with HindIII and NdeI endonucleases, has two bands from top to bottom corresponding to the remaining plasmid and the target gene, respectively. Lane 2, the constructed pET-30a::Iro plasmid, has three bands from top to bottom: the linear, relaxed, and superhelical fractures of the plasmid, respectively. The target gene band position agrees well with the length of the digested sequence containing the iro gene. (b) Visual observation of the purified proteins. Purified protein was reduced with sodium dithionite (Na2S2O4) and desalted to obtain its reduced form, and oxidized with sodium hexachloroiridate (Na2IrCl6) and desalted to obtain its oxidized form. (c) Tricine SDS-PAGE (16.5%) analysis of the purified proteins. Mark is an ultra low molecular weight marker. (d) MALDI-TOF-MS of the recombinant wild protein.
The expression of the iron oxidase in E. coli BL21 was performed at different IPTG concentrations and temperatures, and proteins were all obtained in very high yield at all tested conditions of 0.4–1.0 mM IPTG and 15–37 °C. The six-His-Tag added to the N-termial of the protein greatly accelerated the protein purification process and enabled one-step affinity chromatography. The final protein yield after affinity chromatography was above 4.0%. The purities of the purified proteins were examined by SDS-PAGE, and single bands corresponding to the 7 kDa protein were observed with >95% purity (Figure 1c), which was in line with the deduced molecular mass of the protein. The protein samples were dialyzed against a solution of 10 mM phosphate pH 8.0, 300 mM NaCl and a solution of HCl pH 2.0, 300 mM NaCl. It appeared that this protein is more stable in an acid solution than in a neutral solution. This protein can be stored at 4 °C in a solution of pH 2.0 for one month without appreciable degradation, while in a solution of pH 8.0 for one week, it produces obvious precipitates.
The iron oxidase eluted from the nickel column was brownish (Figure 1b), indicating that the iron–sulfur cluster was assembled into protein even when the protein was generated in E. coli. The purified protein was further treated by the procedure of iron–sulfur cluster assembly in vitro, but no discernible spectral and MALDI-TOF-MS differences before and after the treatment were found, indicating that the iron–sulfur cluster was assembled into protein in E. coli completely. The iron and sulfide contents of the final purified protein were analyzed. The iron content was 3.87 ± 0.18 µmol/µmol protein and the sulfide content was 3.85 ± 0.22 µmol/µmol protein. These results indicate that the protein contains a single [Fe4S4] cluster. The MALDI-TOF-MS of the recombinant iron oxidase (Figure 1d) demonstrated a large peak at 6838.94 Da and a minor peak at 6491.30 Da. The mass of the large peak is rightly in line with the theoretical average molecular mass of the iron oxidase with the His-tag in the N-terminal plus a [Fe4S4] prothetic group so it corresponds to the holoprotein. While the mass of the minor peak is rightly consistent with the theoretical average molecular mass of the iron oxidase with the His-tags in the N-terminal, it corresponds to the apo protein. The decreased 351.64 Da mass was in agreement with the loss of the [Fe4S4] cluster. During the MALDI-MS process, the protein sample must be mixed with acids and undergo strong laser high-temperature vaporization desorption, which can easily cause the disruption of their labile cofactors or prothetic groups. The stability of the apo, oxidized, and reduced iron oxidases was tested. The holo proteins were obviously more stable than the apo protein. The holo proteins could be stored in acidic conditions at 4 °C for a long time, while it is very easy for apo protien to form precipitates.
3.2. Characterizations of the Iron Oxidase
The oxidized and reduced iron oxidase were obtained, both were also brownish and cannot be visually distinguished (Figure 1b). The EPR spectra of the reduced and oxidized iron oxidase are shown in Figure 2a. The protein in its reduced state shows no EPR activity, while in its oxidized state, it exhibits a typical S = 1/2 EPR signal, indicating the presence of the [Fe4S4]3+ cluster. The CD spectra of the oxidized and reduced proteins are shown in Figure 2c, which are very in line with those of the Iro protein from A. ferrooxidans [20]. However, both of the oxidized and reduced states showed nearly identical spectra, indicating that redox state changes had no effects on the secondary structure of the protein.
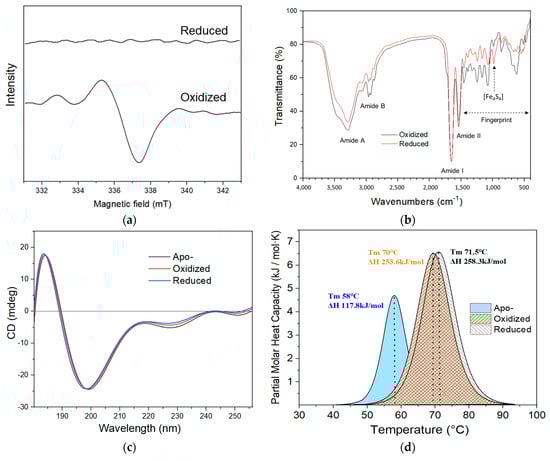
Figure 2.
Characterizations of the iron oxidase from A. ferridurans. (a) EPR spectra of oxidized and reduced proteins. (b) FTIR spectra of oxidized and reduced proteins. (c) CD spectra of apo, oxidized, and reduced proteins. (d) DSC of apo, oxidized, and reduced proteins. The protein samples were prepared in HCl pH 2.0, 300 mM NaCl.
The FTIR spectra of the oxidized and reduced forms of iron oxidase are shown in Figure 2b. The spectra show a common shape of protein spectrum with the characteristic absorption bands such as amide A, B, I, II, and so on, and are nearly same in the amide I and II bands, indicating that the change between the oxidized and reduced states of this protein hardly alters the secondary-structure conformation of the protein. Our previous study of rusticyanin also exhibited similar shapes and characteristic absorptions [39]. The most obvious difference between the spectra of the oxidized and reduced iron oxidase is in the region range from 1450 to 400 cm−1, which can be taken as a characteristic fingerprint of conformational change to define the transient states of the protein [39]. A previous study of Clostridial ferredoxin reported that the infrared absorbance peak at 1050 cm−1, which was quite prominent in native ferredoxin, was absent in apoferredoxin [32]. The infrared peak at 1050 cm−1 was also observed in the FTIR spectra of the oxidized and reduced iron oxidases. The ferredoxin and the iron oxidase both contain an iron–sulfur cluster, so the peak at 1050 cm−1 in the iron oxidase may also be relative to the [Fe4S4] cluster. However, this is the first report on the FTIR characterization of iron oxidase, so no comparable information is available at present.
Differential scanning calorimetry of the apo, oxidized, and reduced iron oxidases is shown in Figure 2d, the protein in all states showed only an obvious typical endothermic peak corresponding to the two-state transformation between folding and unfolding proteins, although the holo protein harbors an extra [Fe4S4] cluster. The thermal denaturation of apo protein is obviously lower in midpoint temperature (Tm) and smaller in enthalpy (ΔH) than that of oxidized and reduced proteins, while the thermal denaturations of oxidized and reduced proteins were nearly identical. The thermal denaturation results are very consistent with the above stability observations of the apo and holo proteins. The thermal stabilities of the oxidized and reduced iron oxidases are also consistent with their natural physiological existence in cells. These results are similar to those of iron oxidase from mesophilic A. ferrooxidans and lower than those of HiPIP1 and HiPIP2 from thermophilic A. caldus [35]. For ordinary temperatures, it was reported that bovine serum albumin (BSA) exhibited a typical two-state thermally induced unfolding with an unfolding enthalpy (ΔH) of 134 kcal/mol (562.8 kJ/mol) and a midpoint of denaturation (Tm) centered at 59 °C [40].
3.3. Fluorescence Analysis of Iron Oxidase and Its Bioinformatics Insights
The three-dimensional fluorescence spectra of apo, oxidized, and reduced iron oxidases are shown in Figure 3a, Figure 3b, and Figure 3c, respectively. The belts in the diagonal area of these figures are Rayleigh scattering belts, which mainly result from the elastic scattering of excitation light, so the wavelength on the excitation axis is equal to that on the emission axis. The fluorescence regions are present in the lower areas of the diagonal belts, and their emission wavelength is longer than their exit wavelength. The apo protein of iron oxidase exhibited a general 3D fluorescence spectrum of protein with an intense fluorescence region of excitation from 250 to 300 nm and emission from 300 to 400 nm. The observable fluorescence of oxidized and reduced iron oxidase are mainly present in the region of excitation from 250 to 300 nm and emission from 300 to 400 nm, while there is no detectable fluorescence in the spectral absorbance band centered at 388 nm of the iron–sulfur cluster. The fluorescence of oxidized and reduced iron oxidases were narrow and very weak compared to those of apo protein. The fluorescence difference between oxidized and reduced proteins was difficult to discern due to the intense Rayleigh scattering background caused by the iron–sulfur cluster, while the fluorescence of apo protein was very easy to observe in the same detection condition and protein concentration.
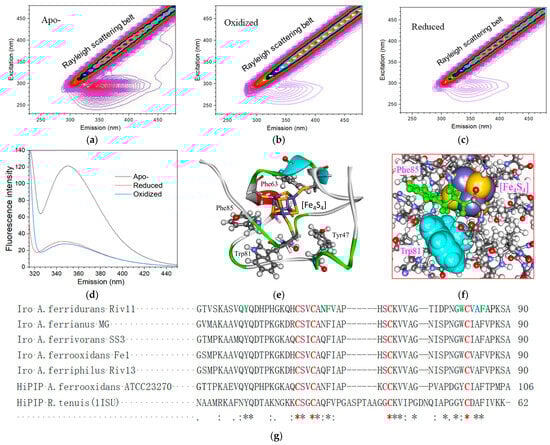
Figure 3.
Fluorescence analysis of iron oxidase from A. ferrianus and its bioinformatics insights. (a) Three-dimensional fluorescence spectrum of apo protein of iron oxidase. (b) Three-dimensional fluorescence spectrum of oxidized iron oxidase. (c) Three-dimensional fluorescence spectrum of reduced iron oxidase. (d) Steady-state fluorescence emission spectra of oxidized and reduced iron oxidase and its apo protein at an excitation wavelength of 295 nm. (e) The intrinsic protein fluorescence residues in iron oxidase. (f) The residue environment of tryptophan in iron oxidase. (g) The sequence alignment of mature proteins of iron oxidase and HiPIP from A. ferridurans and other various sources. HiPIP: high redox potential iron sulfur protein; Iro: iron oxidase. All the sequences can be obtained from the NCBI Genebank (https://www.ncbi.nlm.nih.gov (accessed on 7 October 2023)) and their accession codes are as follows: Iro A. ferridurans Riv11:WP_215878501; Iro A. ferrianus MG:WP_239058863; Iro A. ferrivorans SS3:AEM47577; Iro A. ferrooxidans Fe1:CAA40594; Iro A. ferriphilus Riv13:WP_215860796; HiPIP A. ferrooxidans ATCC23270:ACK79288; and HiPIP R. tenuis(1ISU):P33678.Residues conserved in all sequences are marked with an *. Residues not conserved in all sequences but conserved in some sequences are marked with (:) or (.) based on the degree of conservation. The cysteine residues ligating the [Fe4S4] cluster are red. The intrinsic protein fluorescence residues are in green.
The steady-state fluorescence emission spectra of apo, oxidized, and reduced proteins at an excitation wavelength of 295 nm were further performed to investigate their fluorescence differences (Figure 3d). The fluorescence excitation wavelength of 295 nm can eliminate the fluorescence contribution from amino acids other than tryptophan. The fluorescence emission spectrum of apo protein exhibited a strong broad band centered at 350 nm, while the fluorescence spectra of the oxidized and reduced proteins showed a very weak band around 344 and 346 nm, respectively.
The intrinsic fluorescence of proteins arises from the aromatic amino acid residues of tryptophan, tyrosine, and phenylalanine. For insights into the fluorescence effects of iron oxidase, a bioinformatics of molecular structure modeling and fluorescence residue analysis of the protein was carried out. When searched in the PDB with the sequence of iron oxidase from A. ferridurans Riv11, the structure of HiPIP from Rhodocyclus tenuis (PDB number 1ISU) had the highest hit with identities of 38.46%, so this structure was selected as the template to build the molecular model. Based on the structure template of 1ISU and the sequence alignment, a reliable structure of the iron oxidase from A. ferridurans Riv11 was modeled (Figure 3e). This structure is composed of three strands of antiparallel β-pleated sheets, two short α-helical segments, one small helix near the N-terminus, and harboring a [Fe4S4] cluster buried in the protein interior inaccessible to solvent. This protein contains four intrinsic fluorescence residues: one tryptophan (Trp81), one tyrosine (Tyr47), and two phenylalanines (Phe 63 and Phe 85). Three fluorescence residues of Tyr47, Phe 63, and Phe 85 are directly contacted with the [Fe4S4] cluster and comprise the most key components of the hydrophobic pocket of the iron–sulfur cluster. One remaining fluorescence residue of Trp81 is also very close to the [Fe4S4] cluster, although indirectly separated from the cluster by Phe85 and a peptide main chain (Figure 3e,f).
Trp81 is located in a site rooted from the middle of the center strand of the protein with its next residue of Cys82 ligated to the [Fe4S4] cluster, surrounded by a total of six amino acid residues from five strands, and with the top of its aromatic cycle exposed to solvent (Figure 3f). Trp81 has the strongest fluorescence effect among the four fluorescence residues. The environment of Trp81 suggests that the variations in the protein can be easily reflected in the residue, which is very in line with the above facts that either the large fluorescence difference between holo and apo proteins or the small fluorescence difference between oxidized and reduced proteins is observable in the fluorescence spectra of iron oxidase at 295 nm excitation.
The sequence alignments and phylogenetic analysis of iron oxidase and HiPIP from Acidithiobacillus and R. Tenuis (1ISU) were performed (Figure 3g and Figures S1–S3). The sequences of iron oxidase from Acidithiobacillus are highly conserved; the identities among the proteins from A. ferrivorans, A. ferrianus, A. ferrooxidans, and A. ferriphilus are all higher than 84% although the identity between the proteins from A. ferridurans and A. ferrooxidans is only 77.36%. A total of four cysteine residues was found to be present in the iron oxidase from A. ferridurans Riv11, which further confirmed that the protein harbors only one [Fe4S4] cluster, and the fact that these cysteine residues are conserved in all aligned protein sequences suggests they play an irreplaceable role in the binding of the [Fe4S4] cluster. Three fluorescence residues of Tyr47, Phe 63, and Phe 85 directly contacted by the cluster are also conserved in the proteins of either iron oxidase or HiPIP, indicating their critical role in stabilizing the cluster. The fluorescence residue of Trp81 is only conserved in iron oxidase, but mutated to tyrosine in HiPIP, presumably attributed to its indirect contact with the cluster. However, the amino acid residues at the Trp81 site are all aromatic residues, suggesting the important role of aromaticity in this site.
3.4. Spectral Difference Analysis of Oxidized and Reduced Iron Oxidase and Ferric and Ferrous Ion
To monitor this reaction, the spectral differences of oxidized and reduced iron oxidase and ferric and ferrous ions were investigated. The UV-visible spectra of oxidized and reduced iron oxidase are shown in Figure 4a. The spectrum of oxidized protein contained a broad band with maximum visible absorption at 388 nm with an absorption coefficient of 18 mM−1cm−1. The spectrum of reduced protein exhibited a weak decrease in absorbance in most regions compared to the oxidized protein; however, they were nearly identical in the region around 388 nm. The difference spectrum (oxidized minus reduced) between oxidize and reduced iron oxidase is presented in the inset of Figure 4a, which shows a maximum difference at 500 nm with a difference absorption coefficient of 2 mM−1cm−1 and some isosbetic points at 300,388 and 415 nm. The difference spectrum of HiPIP from Rhodoferax fermentans also showed an isosbestic point at 388 nm [41].
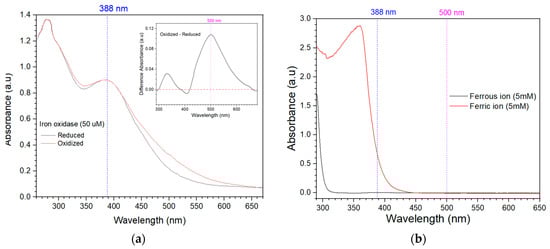
Figure 4.
UV–Vis scanning of iron oxidase and iron ion in their oxidized and reduced states. (a) UV–Vis scanning of oxidized and reduced forms of iron oxidase at a concentration of 50 μM, spectra are normalized at 300 nm to account for small differences in protein concentrations that obscure the spectral changes. The inset is the difference in spectrum between oxidized and reduced forms of iron oxidase. (b) The absorption curves of ferric ions and ferrous ions at a concentration of 5 mM.
The UV-visible spectra of ferrous and ferric ions at 5 mM are shown in Figure 4b. Ferrous ion shows no spectral absorbance activity when its scanning wavelength is greater than 320 nm. While ferric ion shows strong absorbance when its scanning wavelength is greater than 320 nm, it also shows a quick decrease as the wavelength increases and this absorbance reaches near zero when the wavelength is greater than 445 nm. The measured extinction coefficient of ferric ion at 388 nm is about 0.1322 mM−1cm−1, which is two orders of magnitude lower than that of iron oxidase at 388 nm and even one order of magnitude lower than that of the difference spectrum between oxidized and reduced forms of iron oxidase at 500 nm.
3.5. Electron Transfer from Ferrous Ion to Iron Oxidase
The enzymatic reaction of ferrous oxidation of iron oxidase is a one-electron-transfer reaction between ferrous ion and the oxidized protein to produce ferric ion and the reduced protein with the iron–sulfur cluster in the protein undergoing a change from [Fe4S4]3+ to [Fe4S4]2+ as given by Equation (1),where Iro[Fe4S4]3+ represents the oxidized iron oxidase and Iro[Fe4S4]2+ represents the reduced iron oxidase.
Iro[Fe4S4]3+ + Fe2+ = Iro[Fe4S4]2+ + Fe3+
The kinetics for the oxidation of Fe2+ by oxidized iron oxidase to produce Fe3+ can be described as Equation (2), where [Iro[Fe4S4]3+] is the concentration of oxidized iron oxidase, [Fe2+] is the concentration of Fe2+, and k2nd is the forward second-order reaction rate constant.
−d[Iro[Fe4S4]3+]/dt = k2nd × [Fe2+] × [Iro[Fe4S4]3+]
To obtain the k2nd, the pseudo-first-order reaction model was used [21]. The concentrations of Fe2+ were kept in 10-fold or greater excess compared to the iron oxidase concentration, ensuring pseudo-first-order conditions and allowing the concentration of Fe2+ to be taken as constant in the experiment. Then, Equation (2) was simplified to Equation (3), in which k1st is equal to the second-order rate constant k2nd times the concentration of Fe2+ (constant).
−d[Iro[Fe4S4]3+]/dt = k1st × [Iro[Fe4S4]3+]
Based on the above spectral difference analysis, the difference in absorbance at 500 nm between oxidized and reduced states of iron oxidase was used as the probe to monitor the concentration change of the oxidized iron oxidase during the reaction. When the absorbance change (A0 − At) is proportional to the concentration change of oxidized iron oxidase (d[Iro[Fe4S4]3+]), the solution for the differential Equation (3) can be expressed as Equation (4), where A0, At, and A∞ are the absorbances at time 0, t, and ∞, respectively, and k1st is the value of exponential fit for the absorbance change.
(A0 − At) = (A0 − A∞) × exp(−k1st × t)
Figure 5a shows the time course of absorbance at 500 nm in the presence of various concentrations of Fe2+ and the oxidized iron oxidase. A typical pseudo-first-order behavior of exponential decay for each trace was observed. When each trace independently was fitted by Equation (4), all the data were well fit by the theoretical lines, and then the k1st for different concentrations of Fe2+ were obtained. Figure 5b shows the dependence of the k1st for the oxidation of Fe2+ by oxidized iron oxidase. The k1st obtained by linear fitting is plotted vs. the concentrations of Fe2+, where a good linear relationship between them is showed.
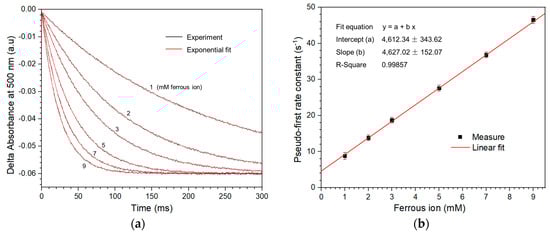
Figure 5.
Measurement of the kinetic rate constant for electron transfer from Fe2+ to iron oxidase. (a) The time course of the absorbance variations at 500 nm after the oxidized iron oxidase is mixed with different concentrations of Fe2+. All reactions were kept in the identical solution conditions of HCl pH 2.0, 300 mM NaCl at 25 °C. The starting concentrations of the reaction system after mixing were as follows: the oxidized iron oxidase, 30 μM and Fe2+, 1, 2, 3, 5, 7, and 9 mM, respectively. The k1st for different concentrations of Fe2+ were given by the parameter of exponential fit to each trace data. The theoretical fits are in red, and the data are in black. (b) Dependence of k1st for the oxidation of Fe2+ by iron oxidase. The k1st obtained with exponential fitting from (a) is plotted vs. the concentrations of Fe2+. The k2nd is obtained by the slopes of the linear fit. Each error bar is the standard deviation for three times.
The time courses of various concentrations of Fe2+ oxidized by oxidized iron oxidase all showed an evident exponential decay behavior of pseudo-first-order kinetic with a fit R-square >99%, as shown in Figure 5a. The dependence of k1st upon different concentrations of Fe2+ was highly linear; the obtained second-order rate constant was about 4.6 × 10³ M−1s−1 (Figure 5b).
3.6. Molecular Simulation and Bioinformatics Analysis of the Interaction between Iron Oxidase and Ferrous Ion
The molecular simulation for the interaction between iron oxidase and ferrous ion in a similar protein physiological condition of water solution of pH 2.0 and 300 mM NaCl was carried out and a most frequent contact configuration of ferrous ion to iron oxidase was obtained and selected as the final interaction model, as shown in Figure 6a. In this configuration, the ferrous ion ([Fe(H2O)6)]2+) approached the protein on a surface consisting of Asn62, Ala84, and Ala86. These residues are directly contacted by [Fe4S4] and constitute the shortest pathway for the cluster to reach a solution. The distance between the Fe atom in the ferrous hexahydrate complex [Fe(H2O)6)]2+ and the nearest Fe atom in [Fe4S4] was 8.99 Å (Figure 6b). The interaction energy between iron oxidase and ferrous ions was analyzed. The electrostatic, van der Waals, and total interaction energies for the interaction were −23, −9 and −31 kJ mol−1, respectively.
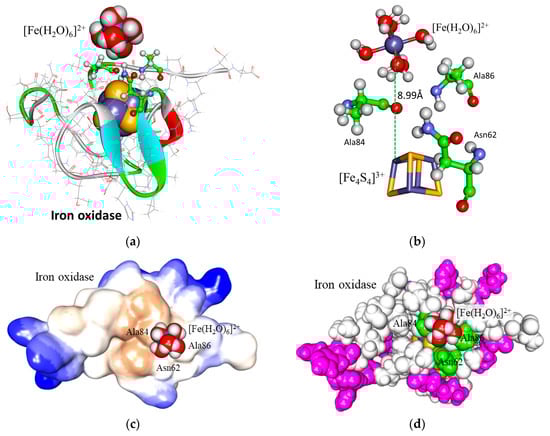
Figure 6.
Molecular simulation for the interaction between iron oxidase and ferrous ion. (a) The simulation interaction configuration of the ferrous ion and the protein. For clarity, water molecules and other ions are not shown. The CPK space-filled representation is for ferrous ion and for the [Fe4S4] cluster in the element color; the structure of protein is displayed by backbone solid ribbon; the line representation is for amino acid residues; the stick and ball representation is for contact residues with ferrous ion. (b) The contact site of the ferrous ion with the surface of iron oxidase. The stick and ball representation is for the hexahydrate complex of ferrous ion and the contact residues to it. The stick representation is for the [Fe4S4] cluster. (c) Hydrophobic surface analysis for the interaction area of the ferrous ion with the iron oxidase. The hydrophobic property of the molecular surface was rendered according to the level, with a hydrophobicity spectrum ranging from the most hydrophobicity in brown to the most hydrophilicity in blue. (d) Charge surface analysis for the interaction area of ferrous ions with iron oxidase. All of the molecular models are in CPK space-filled representation. The positive-charged residues are in purple, the contact residues are in green, the other residues in the protein are in white, and the [Fe4S4] cluster is in element color.
The hydrophobic surface analysis of the iron oxidase was performed (Figure S5 and Table S1). Most of the surface of the protein was composed of some highly hydrophilic large patches mixed with a few small hydrophobic fragments. However, an obvious large hydrophobic patch was also found on the surface of the protein. The most frequent contact site for ferrous ions was rightly at the edge of the hydrophobic patch (Figure 6c).
The charge analysis of the iron oxidase was also carried out (Table S1 and Figure 6d). This protein totally contains 2 negatively charged residues of 2 aspartic acids, 14 positively charged residues of 4 glutamic acids, and 10 histidines, 1 N-terminal, and 1 C-termianl that all have hydrogen with its association or disassociation depending on the pH value (Table S1). When in an extremely acidic condition (pH 2.0), they are all associated with a hydrogen, so each of the 2 aspartic acids and 1 C-termianl were charged 0, while each of the 4 glutamic acids, 10 histidines, and 1 N-terminal were charged +1, resulting in a total of 13 positive charges. The oxidized iron oxidase has a [Fe4S4]3+ cluster of three positive charges and four cysteines of one negative charge covalently ligating to the cluster, leading to a total of one negative charge. Therefore, the total net charges of the protein in pH 2.0 are 12 positive charges, which in a whole is a considerable amount of repulsion to ferrous ions with 2 positive charges. Fortunately, 7 of the 12 positive charges are concentrated on the N-terminal His-tag (6 histidines and 1 N-terminal) and the other charges are distributed throughout the protein (Figure S5). The surface charge analysis for the ferrous ion contact site further showed that the surrounding ferrous ion contact site is without charged amino acid residues and all residues with positive charge are far from this region (Figure 6d), which makes it possible for the ferrous ion with two positive charges to approach the protein with many net positive charges.
4. Discussion
In this study, the iron oxidase from A. ferridurans Riv11 was constructed, expressed, and purified. After a comprehensive investigation of the properties of this protein, the monitor method for the reaction of ferrous oxidation of the protein was found and then the kinetic rate constant was determined. Bioinformatics analysis and molecular simulation further revealed the underlying molecular mechanism of ferrous oxidation.
The expression of the protein can be performed in a yield with a broader range of conditions than those of the previously reported recombinant Iro protein from A. ferrooxidans Fe1 [32,39] and HiPIPs from various sources [19,20]. The difference between them is that the construction of the expression system of our protein adopted a strategy of codon optimization and gene synthesis, while the encoding genes of the previously reported proteins were all directly cloned from the genomes of their biological sources. Therefore, the codon optimization should be responsible for the more efficient expression of our protein. In addition, the gene sequence obtained from gene synthesis is completely independent from the biological source. It is indicating that the strategy of codon optimization and gene synthesis is a very good and convenient strategy for expression of the proteins similar to the iron oxidase.
The iron and sulfide content assays and the MALDI-TOF-MS analysis confirmed that the [Fe4S4] cluster of the protein was well assembled into protein even when the protein was produced in E. coli. Although E. coli is a neutrophile and encodes no apparent HiPIPs protein, previously reported active HiPIPs from acidophilic A. ferrooxidans [19] and thermophilic A. caldus [39] were successfully generated in this bacterium, and the iron–sulfur cluster can be correctly assembled and ligated into the binding site of the protein [19]. This protein in an acid solution is more stable than that in neutral solution, which is rightly in line with the extremely acidic periplasm environment that the protein is physiologically located in. The holo proteins were obviously more stable than the apo protein, indicating that the [Fe4S4] cluster plays an important role in the stability of the protein. It was also very in line with the DSC results of the protein that the thermal denaturation of apo protein is obviously lower in midpoint temperatures and smaller in enthalpy than those of oxidized and reduced proteins, while the thermal denaturations of oxidized and reduced proteins were nearly identical.
Iron oxidase was proposed to be the initial electron acceptor from the ferrous ion in the iron oxidation of the Acidithiobacillus genus; however, as an enzyme that acts on the ferrous ion, the most fundamental property of the direct ferrous oxidation reaction kinetics of iron oxidase remains undetermined due to the confusion and non-intuition in the reaction monitor method. In order to find an appropriate monitor method for the reaction kinetics, a comprehensive investigation of the protein was carried out. This protein in its reduced state shows no EPR activity, while in its oxidized state, it exhibits a typical EPR signal. The Iro protein from A. ferrooxidans and other HiPIPs from various sources also showed similar EPR signals [15,16,17,18,19,20,21,23,24]. It seems that EPR can well show the transform between the oxidized and reduced states of protein. However, EPR was recorded in the very cold temperature of 100 K that all of the samples are in a solid state. In addition, EPR is a magnetic resonance technique derived from a magnetic moment of unpaired electrons. During the reaction of ferrous oxidation of the protein, as given by Equation (1), the oxidized protein with EPR signal transforms into the reduced protein with no EPR signal, while the ferrous ion with no EPR signal transforms into the ferric ion with the EPR signal, so that they are mixed together in the reaction and difficult to be distinguish by using EPR. Therefore, EPR is not suitable for the monitoring of the reaction. The FTIR spectra of oxidized and reduced forms of the protein were investigated, the most obvious difference between the spectra was in the fingerprint region, and a characteristic peak of the iron–sulfur cluster was first identified in both forms of the protein. However, the FTIR spectra are obtained in freeze-dried protein samples so it is difficult to straightforwardly use for the detection of change between the redox states of the protein. The CD spectra of the apo, oxidized, and reduced forms of protein were near identical, indicating that the [Fe4S4] cluster does not affect the secondary structure of the protein. Therefore, CD is insensitive and difficult for the monitor of the reaction. The DSC analysis of the protein indicated that the [Fe4S4] cluster can significantly increase the thermal denaturation temperature and enthalpy, and greatly contributes to the stability of the protein. However DSC is a destructive analysis method, so it is obviously not suitable for the monitor of the reaction.
The 3D fluorescence spectra of the apo, oxidized, and reduced forms of the protein were investigated. The weak fluorescence of the oxidized and reduced forms compared to apo protein suggest that the iron–sulfur cluster can strongly absorb the fluorescence produced by the intrinsic fluorescence residues, causing an obvious decrease in total emission. The view is also supported by the fact that the fluorescence distribution of the apo protein is highly overlapped with the spectral absorbance band centered at 388 nm of the holo protein. The low fluorescence of the oxidized and reduced forms of the protein compared to the apo protein in the steady-state fluorescence emission spectra were very in line with those in 3D fluorescence spectra and further confirmed that an efficient energy transfer from the tryptophan residue to the [Fe4S4] cluster occurs. Several heme proteins were also found to be the low quantum yield of tryptophan fluorescence due to the efficient energy transfer from the tryptophan residues to the heme group [42]. The peak position of the tryptophan fluorescence emission spectrum is indicative of the nature of the environment and the dielectric constant of the medium around it. The observed emission maxima of the holo proteins around 345 nm thus indicate that the environment of the tryptophan residue in the protein is relatively polar. However, the band for the apo protein shows a red shift compared to the native form, suggesting that the removal of the [Fe4S4] cluster increases the polarity of the environment of tryptophan residues. This agrees with the reported fluorescence spectra of HiPIP [43]. The close relationship of the fluorescence residues to the [Fe4S4] cluster revealed the underlining reason for the large fluorescence changes after the loss of the cluster. Therefore, the fluorescence spectrum also makes it difficult to monitor the reaction of the ferrous oxidation of protein due to the very weak fluorescence caused by the strong energy transfer of the [Fe4S4] cluster. However, the FTIR, DSC, and fluorescence spectra of the apo, oxidized, and reduced forms of protein were first investigated in the studies of iron oxidase, and many new features and properties of it were disclosed, which broadly extends the understanding of iron oxidase.
The UV-visible spectra of oxidized and reduced forms of the protein showed a broad characteristic absorbance at 388 nm and an obvious absorbance decrease in the visible region (420–650 nm) with the maximum difference at 500 nm from the oxidized state to the reduced state. These UV-visible spectra were typical for proteins containing the [Fe4S4] cluster [12]. The absorbance difference provides a possibility for the monitoring of the reaction of ferrous oxidation of the protein. However, the spectral property of the protein are derived from the [Fe4S4] in protein [22], which is overlapped and entangled with that of the substrate of Fe2+ and the product of Fe3+, causing the monitoring of the reaction in this way to be very confusing and unintuitive. Therefore, a comparative investigation of the UV-Vis spectra between the protein and iron ions was performed. The comparison results reveal that the protein has far more absorbance than those of the iron ions in solution in the visible region, so that, in the reaction of ferrous oxidation by iron oxidase, the absorbance change at 500 nm between ferrous and ferric ions can be completely overlooked compared to that between oxidized and reduced iron oxidase. Therefore, the maximum difference absorbance area around 500 nm between oxidized and reduced iron oxidase can be used to monitor the reaction. It also was supported by the previous report that the maximum absorbance change around 500 nm was successfully used on the monitoring of the kinetics of oxidation and reduction in HiPIPs at pH 7.0 with non-physiological reactants of Fe(CN)63−, Co(phen)33+ and Fe(EDTA)2−, and so on [44].
Based on the monitoring of the most difference absorbance at 500 nm, the second-order kinetic rate constant of electron transfer from the ferrous ion to the oxidized iron oxidase was successfully determined through the pseudo-first-order reaction model method. The time courses of absorbance at 500 nm for various concentrations of ferrous ions oxidized by the oxidized iron oxidase all exhibited a clear exponential decay behavior of pseudo-first-order kinetics with a fit R-square > 99% (Figure 5a), further confirming that the monitoring method of the most difference absorbance is right and appropriate. It was reported that the second-order rate constants of Chromatium HiPIP at pH 7.0 by the oxidations of Fe(CN)63−, Co(phen)33+, and Fe(EDTA)2− were (2.0 ± 0.1) × 103, (2.8 ± 0.1) × 103, and (1.6 ± 0.1) × 103 M−1s−1, respectively [21]. The second-order rate constant of the ferrous ion by the oxidation of the iron oxidase in our determination was about 2–3 times faster than those of the reported Chromatium HiPIP, although they were in different solution conditions and reaction directions. Moreover, the kinetic rate of ferrous oxidation by the protein is also obviously faster than that of rusticyanins previously reported [39]. Therefore, our result well supports the view that the iron oxidase plays a role as the initial electron receptor from the ferrous ion in the ferrous biooxidation of the microorganism. It was also reported in A. ferrooxidans that in the presence of cytochrome c-552, rusticyanin was rapidly reduced by iron oxidase with a ferrous ion of pH 3.5 with a Km value of 42.5 μM and Vmax value of 38.3 (mol of rusticyanin reduced/mol of iron oxidase)/s [16]. However, this identification method of enzymic activity greatly depended on the downstream electron acceptor enzymes, e.g., cytochrome c-552 and rusticyanin, which are generally very difficult to obtain or even uncertain. Therefore, it is difficult to compare our result directly with it. In fact, the rusticyanin was not the downstream enzyme of the electron acceptor for iron oxidase in the subsequent reports [12,13,14,25]. Comparatively, our method of the kinetic rate constant determination focuses on the direct interaction between the ferrous ion and the oxidized iron oxidase and is independent on the downstream enzymes of the electron acceptor, so it is very easy and applicable for the investigation of the enzymic activity of iron oxidase. Recently, with the development of high-throughput sequencing technology, more and more whole genomic sequences of bacteria in the Acidithiobacillus genus were sequenced [12,13,14], and iron oxidase was found to be widely present in the iron-oxidizing bacteria of the Acidithiobacillus genus with a single copy or multi-copies [13], and several alternative roles of this protein were also proposed [12,13,14,25]. Our method of the kinetic rate constant determination can greatly help to identify or determine a particular role of an iron oxidase in each different bacterium source and finally contributes to uncovering the whole mechanism of the ferrous oxidation of the bacterium.
A. ferridurans strain Riv11 is an extremely acidophilic, Gram-negative bacterium from an extremely acidic environment full of various high-concentration toxic metal ions [13,27]. The iron oxidase from this bacterium is located in the periplasmic space of the cell, which is also confirmed by the fact that the precursor of this protein includes a 37-residue signal peptide (Figure S1). Therefore, the physiological condition of this protein is also extremely acidic and has high ionic strength. In this condition, ferrous and ferric ions are very soluble and present in the forms of hexahydrate complexes of [Fe(H2O)6)]2+ and [Fe(H2O)6)]3+, respectively; and all of the negatively charged residues in the protein will be associated with hydrogen, resulting in an obvious charge change of the whole protein molecule compared to the neutrality condition. Accordingly, the molecular simulation for the interaction between iron oxidase and ferrous ion was carried out and a most frequent contact configuration of the ferrous ion to the iron oxidase was obtained. In this configuration, ferrous ions approach the protein at the edge of a large hydrophobic surface patch nearest to the [Fe4S4] cluster from a direction far from all positively charged residues.
This interaction configuration very well interpretates the molecular mechanism of the ferrous oxidation of iron oxidase. Firstly, the distance between the ferrous ion and the [Fe4S4] cluster in the iron oxidase is only around 9 Å. It was reported that when the distance between the electrode surface and the protein electroactive center reaches 14 Å or less, direct electron transfer between the electrode and the protein could be effectively generated [45]. The distance between ferrous ion and iron oxidase is far shorter than that between the electrode surface and the protein electroactive center, so the electron transfer occurring between the ferrous ion and the protein is very sufficient. Secondly, in the theory of electron tunneling, the overlap of the wave functions of the redox centers increases as the dielectric constant of the medium decreases [22]. As a result, electron transfer takes place with greater facility through hydrophobic (nonpolar) regions of protein than hydrophilic ones. The ferrous ions approach the protein rightly near a large hydrophobic surface patch, which facilitates electron transfer. It was proposed that the faster rate of oxidation of HiPIP by Co(phen)3+ vs. Fe(CN)63− was due to the direct attack of the cluster by Co(phen)3+ through a hydrophobic region on the HiPIP surface [46]. Thirdly, the surrounding ferrous ion contact site is without charged amino acid residues, and all residues with positive charge are far from this region, but a net negative charge from the [Fe4S4]3+ cluster has an attractive effect on the ferrous ion with two positive charges, which makes ferrous ions approach the protein at this site in an obvious high frequency. From the potential energy contributions, it also can be seen that local electrostatic interaction is most responsible for the high frequency of ferrous ion contact with protein in this direction and site. It is further suggested that the ferrous oxidation of this protein undergoes outer-sphere electron transfer, with electrostatic interactions playing a role in the rate constant for electron transfer. Previous studies established that the net protein charge is not a dominant factor in the reaction mechanism [46]. It was also reported that electrostatics play a role in the kinetics of oxidation and reduction in HIPIP, but do not appear to correlate with the net protein charge [26,47]. Totally, the above three aspects are interlinked so that enough enables an efficient electron transfer. Furthermore, the molecular simulation and bioinformatics analysis result is rightly in line with the kinetics experimental result of the fast rate constant. Redox proteins can be used in electrochemical detection and electrocatalysis [48,49]. It was reported that genetic engineering and overexpression were successfully performed on some proteins of bioleaching microorganisms to improve their mineral bioleaching efficiency [50,51]. The uncovered molecular mechanism lays a foundation for the potential applications of the protein in biosensors, enzymology, genetic engineering, etc.
5. Conclusions
In this study, the recombinant iron oxidase from A. ferridurans was constructed, expressed, purified, characterized, and further used to investigate the kinetics and mechanism of ferrous oxidation. The strategy of codon optimization and gene synthesis is very good and convenient for the expressions of this protein. The [Fe4S4] cluster of the protein can be well assembled into protein when the protein is generated in E. coli. This protein is more stable in an acid solution than in a neutral solution. An infrared characteristic peak around 1050 cm−1 of the [Fe4S4] cluster was identified. The [Fe4S4] cluster does not affect the secondary structure of the protein, but plays an important role in the stability of the protein and can obtain an efficient energy transfer from the fluorescence residues, so causes a great loss of the intrinsic fluorescence. The protein has far more absorbance than those of the iron ions in the solution in the visible region; therefore, the maximum difference absorbance around 500 nm between the oxidized and reduced states of protein can be used to monitor the reaction of ferrous oxidation. The kinetic rate constant of electron transfer from a ferrous ion to iron oxidase was first determined through the pseudo-first-order reaction model by the monitor of the most difference absorbance of protein. Bioinformatics analysis and molecular simulation provided a deep insight into the properties of the protein and further revealed the underlying molecular mechanism of ferrous oxidation, that ferrous ions approach the protein at the edge of a large hydrophobic surface patch nearest to the [Fe4S4] cluster from a direction far from all positively charged residues, which enough enables an efficient electron transfer.
Supplementary Materials
The following supporting information can be downloaded at: https://www.mdpi.com/article/10.3390/separations10110554/s1, Text S1. The regenerated and synthesized nucleotide gene sequence of the recombinant iron oxidase from A. ferridurans Riv11.; Table S1. Amino acid composition and property analysis of the recombinant iron oxidase from A. ferridurans Riv11. Figure S1. The multiple sequence alignment for the wild proteins of iron oxidase and HiPIP from various sources. Figure S2. The percent identity matrix for the sequences of iron oxidase and HiPIP from various sources. Figure S3. The phylogenetic tree for the sequences of iron oxidase and HiPIP from various sources. Figure S4. The hydrophobic surface analysis of iron oxidase from A. ferridurans. Figure S5. The surface charge analysis of recombinant iron oxidase from A. ferridurans.
Author Contributions
Conceptualization, Y.L.; methodology, Y.L., J.H., X.S., R.L., K.W. and X.Z.; software, Y.L., X.S., J.H. and R.L.; validation, R.Y., W.Z. and L.S.; formal analysis, Y.L., J.H., X.S. and R.L.; investigation, J.H., X.S., R.L., K.W. and Y.T.; resources, Y.L., G.Q., X.W., W.Z., Y.L. and L.S.; data curation, J.H., K.W., X.S. and Y.T.; writing—original draft preparation, Y.L., X.S., W.B.; writing—review and editing, Y.L., X.S. and W.B.; visualization, Y.L., J.H. and X.S.; supervision, Y.L.; project administration, Y.L.; funding acquisition, Y.L. and X.Z. All authors have read and agreed to the published version of the manuscript.
Funding
This research was funded by the Changsha Municipal Natural Science Foundation (No. kq2202084), Hunan Provincial Natural Science Foundation of China (No. 2019JJ40367, No. 2015JJ2186), National Natural Science Foundation of China (No. 51274268, No. 50904080), China Postdoctoral Science Foundation (No. 2013M540643, No. 2014T70791).We are also grateful for resources from the High Performance Computing Center of Central South University.
Data Availability Statement
The data presented in this study are available on request from the corresponding author.
Conflicts of Interest
The authors declare no conflict of interest.
References
- Kaksonen, A.H.; Boxall, N.J.; Gumulya, Y.; Khaleque, H.N.; Morris, C.; Bohu, T.; Cheng, K.Y.; Usher, K.M.; Lakaniemi, A.-M. Recent progress in biohydrometallurgy and microbial characterisation. Hydrometallurgy 2018, 180, 7–25. [Google Scholar] [CrossRef]
- Castro, L.; Blazquez, M.L.; Gonzalez, F.; Munoz, J.a. Biohydrometallurgy for Rare Earth Elements Recovery from Industrial Wastes. Molecules 2021, 26, 6200. [Google Scholar] [CrossRef] [PubMed]
- Schippers, A.; Hedrich, S.; Vasters, J.; Drobe, M.; Sand, W.; Willscher, S. Biomining: Metal Recovery from Ores with Microorganisms. In Geobiotechnology I: Metal-Related Issues; Advances in Biochemical Engineering-Biotechnology; Schippers, A., Glombitza, F., Sand, W., Eds.; Springer: Berlin/Heidelberg, Germany, 2014; Volume 141, pp. 1–47. [Google Scholar]
- Roberto, F.F.; Schippers, A. Progress in bioleaching: Part B, applications of microbial processes by the minerals industries. Appl. Microbiol. Biotechnol. 2022, 106, 5913–5928. [Google Scholar] [CrossRef] [PubMed]
- Sand, W.; Schippers, A.; Hedrich, S.; Vera, M. Progress in bioleaching: Fundamentals and mechanisms of microbial metal sulfide oxidation—Part A. Appl. Microbiol. Biotechnol. 2022, 106, 6933–6952. [Google Scholar] [CrossRef]
- Abashina, T.; Vainshtein, M. Current Trends in Metal Biomining with a Focus on Genomics Aspects and Attention to Arsenopyrite Leaching—A Review. Microorganisms 2023, 11, 186. [Google Scholar] [CrossRef] [PubMed]
- Jones, S.; Santini, J.M. Mechanisms of bioleaching: Iron and sulfur oxidation by acidophilic microorganisms. Essays Biochem. 2023, 67, 685–699. [Google Scholar] [CrossRef] [PubMed]
- Sand, W.; Gehrke, T.; Jozsa, P.G.; Schippers, A. (Bio) chemistry of bacterial leaching—Direct vs. indirect bioleaching. Hydrometallurgy 2001, 59, 159–175. [Google Scholar] [CrossRef]
- Chen, J.; Liu, Y.; Diep, P.; Mahadevan, R. Genetic engineering of extremely acidophilic Acidithiobacillus species for biomining: Progress and perspectives. J. Hazard. Mater. 2022, 438, 129456. [Google Scholar] [CrossRef]
- Amouric, A.; Brochier-Armanet, C.; Johnson, D.B.; Bonnefoy, V.; Hallberg, K.B. Phylogenetic and genetic variation among Fe(II)-oxidizing acidithiobacilli supports the view that these comprise multiple species with different ferrous iron oxidation pathways. Microbiology 2011, 157, 111–122. [Google Scholar] [CrossRef]
- Nunez, H.; Moya-Beltran, A.; Covarrubias, P.C.; Issotta, F.; Cardenas, J.P.; Gonzalez, M.; Atavales, J.; Acuna, L.G.; Johnson, D.B.; Quatrini, R. Molecular Systematics of the Genus Acidithiobacillus: Insights into the Phylogenetic Structure and Diversification of the Taxon. Front. Microbiol. 2017, 8, 30. [Google Scholar] [CrossRef]
- Ibanez, A.; Garrido-Chamorro, S.; Coque, J.J.R.; Barreiro, C. From Genes to Bioleaching: Unraveling Sulfur Metabolism in Acidithiobacillus Genus. Genes 2023, 14, 1772. [Google Scholar] [CrossRef] [PubMed]
- Moya-Beltran, A.; Beard, S.; Rojas-Villalobos, C.; Issotta, F.; Gallardo, Y.; Ulloa, R.; Giaveno, A.; Degli Esposti, M.; Barrie Johnson, D.; Quatrini, R. Genomic evolution of the class Acidithiobacillia: Deep-branching Proteobacteria living in extreme acidic conditions. ISME J. 2021, 15, 3221–3238. [Google Scholar] [CrossRef] [PubMed]
- Gonzalez-Rosales, C.; Vergara, E.; Dopson, M.; Valdes, J.H.; Holmes, D.S. Integrative Genomics Sheds Light on Evolutionary Forces Shaping the Acidithiobacillia Class Acidophilic Lifestyle. Front. Microbiol. 2022, 12, 822229. [Google Scholar] [CrossRef]
- Fry, I.V.; Lazaroff, N.; Packer, L. Sulfate-dependent iron oxidation by Thiobacillus ferrooxidans: Characterization of a new EPR detectable electron transport component on the reducing side of rusticyanin. Arch. Biochem. Biophys. 1986, 246, 650–654. [Google Scholar] [CrossRef]
- Fukumori, Y.; Yano, T.; Sato, A.; Yamanaka, T. Fe(II)-oxidizing enzyme purified from Thiobacillus ferrooxidans. FEMS Microbiol. Lett. 1988, 50, 169–172. [Google Scholar] [CrossRef][Green Version]
- Kusano, T.; Takeshima, T.; Sugawara, K.; Inoue, C.; Shiratori, T.; Yano, T.; Fukumori, Y.; Yamanaka, T. Molecular cloning of the gene encoding Thiobacillus ferrooxidans Fe(II) oxidase. High homology of the gene product with HiPIP. J. Biol. Chem. 1992, 267, 11242–11247. [Google Scholar] [CrossRef] [PubMed]
- Cavazza, C.; Guigliarelli, B.; Bertrand, P.; Bruschi, M. Biochemical and EPR characterization of a high potential iron-sulfur protein in Thiobacillus ferrooxidans. FEMS Microbiol. Lett. 1995, 130, 193–199. [Google Scholar] [CrossRef][Green Version]
- Zeng, J.; Geng, M.; Liu, Y.; Zhao, W.; Xia, L.; Liu, J.; Qiu, G. Expression, purification and molecular modelling of the Iro protein from Acidithiobacillus ferrooxidans Fe-1. Protein Expr. Purif. 2007, 52, 146–152. [Google Scholar] [CrossRef]
- Zeng, J.; Liu, Q.; Zhang, X.; Mo, H.; Wang, Y.; Chen, Q.; Liu, Y. Functional Roles of the Aromatic Residues in the Stabilization of the Fe4S4 Cluster in the Iro Protein from Acidithiobacillus ferrooxidans. J. Microbiol. Biotechnol. 2010, 20, 294–300. [Google Scholar] [CrossRef]
- Bruscella, P.; Cassagnaud, L.; Ratouchniak, J.; Brasseur, G.; Lojou, E.; Amils, R.; Bonnefoy, V. The HiPIP from the acidophilic Acidithiobacillus ferrooxidans is correctly processed and translocated in Escherichia coli, in spite of the periplasm pH difference between these two micro-organisms. Microbiology 2005, 151, 1421–1431. [Google Scholar] [CrossRef]
- Sato, A.; Hori, Y.; Shigeta, Y. Characterization of the Geometrical and Electronic Structures of the Active Site and Its Effects on the Surrounding Environment in Reduced High-Potential Iron-Sulfur Proteins Investigated by the Density Functional Theory Approach. Inorg. Chem. 2023, 62, 2040–2048. [Google Scholar] [CrossRef] [PubMed]
- Heering, H.A.; Bulsink, Y.B.; Hagen, W.R.; Meyer, T.E. Reversible super-reduction of the cubane 4Fe-4S(3+;2+;1+) in the high-potential iron-sulfur protein under non-denaturing conditions. EPR spectroscopic and electrochemical studies. Eur. J. Biochem. 1995, 232, 811–817. [Google Scholar] [CrossRef] [PubMed]
- Rayment, I.; Wesenberg, G.; Meyer, T.E.; Cusanovich, M.A.; Holden, H.M. Three-dimensional structure of the high-potential iron-sulfur protein isolated from the purple phototrophic bacterium Rhodocyclus tenuis determined and refined at 1.5 A resolution. J. Mol. Biol. 1992, 228, 672–686. [Google Scholar] [CrossRef] [PubMed]
- Malik, L.; Hedrich, S. Ferric Iron Reduction in Extreme Acidophiles. Front. Microbiol. 2022, 12, 818414. [Google Scholar] [CrossRef] [PubMed]
- Holm, R.H. Iron-sulphur clusters in natural and synthetic systems. Endeavour 1975, 34, 38–43. [Google Scholar] [CrossRef] [PubMed]
- Jalali, F.; Fakhar, J.; Zolfaghari, A. On using a new strain of Acidithiobacillus ferridurans for bioleaching of low-grade uranium. Sep. Sci. Technol. 2020, 55, 994–1004. [Google Scholar] [CrossRef]
- Hedrich, S.; Johnson, D.B. Acidithiobacillus ferridurans sp. nov., an acidophilic iron-, sulfur- and hydrogen-metabolizing chemolithotrophic gammaproteobacterium. Int. J. Syst. Evol. Microbiol. 2013, 63, 4018–4025. [Google Scholar] [CrossRef] [PubMed]
- Jalali, F.; Fakhari, J.; Zolfaghari, A. Response surface modeling for lab-scale column bioleaching of low-grade uranium ore using a new isolated strain of Acidithiobacillus ferridurans. Hydrometallurgy 2019, 185, 194–203. [Google Scholar] [CrossRef]
- Kaur, J.; Kumar, A.; Kaur, J. Strategies for optimization of heterologous protein expression in E. coli: Roadblocks and reinforcements. Int. J. Biol. Macromol. 2018, 106, 803–822. [Google Scholar] [CrossRef]
- Crowe, J.; Dobeli, H.; Gentz, R.; Hochuli, E.; Stuber, D.; Henco, K. 6xHis-Ni-NTA chromatography as a superior technique in recombinant protein expression/purification. Methods Mol. Biol. 1994, 31, 371–387. [Google Scholar]
- Lovenberg, W.; Buchanan, B.B.; Rabinowitz, J.C. Studies on the Chemical Nature of Clostridial Ferredoxin. J. Biol. Chem. 1963, 238, 3899–3913. [Google Scholar] [CrossRef] [PubMed]
- Siegel, L.M. A Direct Microdetermination for Sulfide. Anal. Biochem. 1965, 11, 126–132. [Google Scholar] [CrossRef] [PubMed]
- Grabarczyk, D.B.; Ash, P.A.; Myers, W.K.; Dodd, E.L.; Vincent, K.A. Dioxygen controls the nitrosylation reactions of a protein-bound 4Fe4S cluster. Dalton Trans. 2019, 48, 13960–13970. [Google Scholar] [CrossRef]
- Qi, Y.; Shangguan, X.; He, J.; Chen, L.; Jin, J.; Liu, Y.; Qiu, G.; Yu, R.; Li, J.; Zeng, W.; et al. Expression, purification, characterization and direct electrochemistry of two HiPIPs from Acidithiobacillus caldus SM-1. Anal. Biochem. 2022, 652, 114724. [Google Scholar] [CrossRef]
- Kyte, J.; Doolittle, R.F. A simple method for displaying the hydropathic character of a protein. J. Mol. Biol. 1982, 157, 105–132. [Google Scholar] [CrossRef]
- Gutfreund, H. Proteins: Structures and molecular properties (second edition). FEBS Lett. 1993, 323, 294. [Google Scholar] [CrossRef]
- Im, W.; Beglov, D.; Roux, B. Continuum solvation model: Computation of electrostatic forces from numerical solutions to the Poisson-Boltzmann equation. Comput. Phys. Commun. 1998, 111, 59–75. [Google Scholar] [CrossRef]
- Liu, Y.; Chen, L.; Shangguan, X.; Ouyang, J.; He, J.; Wang, K.; Tong, Y.; Yu, R.; Zeng, W.; Wu, X.; et al. Expression, Purification and Characterization of a Novel Rusticyanin from the Psychrotolerant Acidithiobacillus ferrivorans. Separations 2023, 10, 448. [Google Scholar] [CrossRef]
- Celej, M.S.; Montich, C.G.; Fidelio, G.D. Protein stability induced by ligand binding correlates with changes in protein flexibility. Protein Sci. 2003, 12, 1496–1506. [Google Scholar] [CrossRef] [PubMed]
- Hochkoeppler, A.; Kofod, P.; Ferro, G.; Ciurli, S. Isolation, characterization, and functional role of the high-potential iron-sulfur protein (HiPIP) from Rhodoferax fermentans. Arch. Biochem. Biophys. 1995, 322, 313–318. [Google Scholar] [CrossRef]
- Hochstrasser, R.M.; Negus, D.K. Picosecond fluorescence decay of tryptophans in myoglobin. Proc. Natl. Acad. Sci. USA 1984, 81, 4399–4403. [Google Scholar] [CrossRef] [PubMed]
- Sau, A.K.; Chen, C.A.; Cowan, J.A.; Mazumdar, S.; Mitra, S. Steady-state and time-resolved fluorescence studies on wild type and mutant Chromatium vinosum high potential iron proteins: Holo- and apo-forms. Biophys. J. 2001, 81, 2320–2330. [Google Scholar] [CrossRef] [PubMed]
- Mizrahi, I.A.; Meyer, T.E.; Cusanovich, M.A. Kinetics of oxidation and reduction of high-potential iron-sulfur proteins with nonphysiological reactants. Biochemistry 1980, 19, 4727–4733. [Google Scholar] [CrossRef] [PubMed]
- Page, C.C.; Moser, C.C.; Chen, X.X.; Dutton, P.L. Natural engineering principles of electron tunnelling in biological oxidation-reduction. Nature 1999, 402, 47–52. [Google Scholar] [CrossRef] [PubMed]
- Rawlings, J.; Wherland, S.; Gray, H.B. Kinetic studies of the oxidation and reduction of Chromatium high potential iron-sulfur protein (HiPIP) by inorganic complexes. Comparison of the electron transfer reactivities of HiPIP and horse heart cytochrome c. J. Am. Chem. Soc. 1976, 98, 2177–2180. [Google Scholar] [CrossRef] [PubMed]
- Mizrahi, I.A.; Wood, F.E.; Cusanovich, M.A. Oxidation-reduction properties of Chromatium vinosum high potential iron-sulfur protein. Biochemistry 1976, 15, 343–348. [Google Scholar] [CrossRef] [PubMed]
- Wu, Y.H.; Jiang, N.; He, Z.; Yang, Y.; Li, Y. Direct electrochemical detection of extracellular nitric oxide in Arabidopsis protoplast based on cytochrome P450 55B1 biosensor. Nitric Oxide-Biol. Chem. 2023, 132, 8–14. [Google Scholar] [CrossRef]
- Koroleva, P.I.; Gilep, A.A.; Kraevsky, S.V.; Tsybruk, T.V.; Shumyantseva, V.V. Improving the Efficiency of Electrocatalysis of Cytochrome P450 3A4 by Modifying the Electrode with Membrane Protein Streptolysin O for Studying the Metabolic Transformations of Drugs. Biosensors 2023, 13, 457. [Google Scholar] [CrossRef]
- Chen, J.J.; Liu, Y.L.; Mahadevan, R. Genetic Engineering of Acidithiobacillus ferridurans Using CRISPR Systems To Mitigate Toxic Release in Biomining. Environ. Sci. Technol. 2023, 57, 12315–12324. [Google Scholar] [CrossRef]
- Jung, H.; Inaba, Y.; West, A.C.; Banta, S. Overexpression of quorum sensing genes in Acidithiobacillus ferrooxidans enhances cell attachment and covellite bioleaching. Biotechnol. Rep. 2023, 38, e00789. [Google Scholar] [CrossRef]
Disclaimer/Publisher’s Note: The statements, opinions and data contained in all publications are solely those of the individual author(s) and contributor(s) and not of MDPI and/or the editor(s). MDPI and/or the editor(s) disclaim responsibility for any injury to people or property resulting from any ideas, methods, instructions or products referred to in the content. |
© 2023 by the authors. Licensee MDPI, Basel, Switzerland. This article is an open access article distributed under the terms and conditions of the Creative Commons Attribution (CC BY) license (https://creativecommons.org/licenses/by/4.0/).