Abstract
A chemical recognition algorithm is an integral part of any autonomous microscale gas chromatography (µGC) system for automated chemical analysis. For a multi-detector µGC system, the chemical analysis must account for the retention time of each chemical analyte as well as the relative response of each detector to each analyte, i.e., the detector response pattern (DRP). In contrast to the common approaches of heuristically using principal component analysis and machine learning, this paper reports a rule-based automated chemical recognition algorithm for a multi-cell, multi-detector µGC system, in which the DRP is related to theoretical principles; consequently, this algorithm only requires a small amount of calibration data but not extensive training data. For processing both the retention time and the raw DRP, the algorithm applies rules based on expert knowledge to compare the detected peaks; these rules are located in a customized software library. Additionally, the algorithm provides special handling for chromatogram peaks with a small signal-to-noise ratio. It also provides separate special handling for asymmetrical peaks that may result from surface adsorptive analytes. This work also describes an experimental evaluation in which the algorithm used the relative response of two complementary types of capacitive detectors as well as a photoionization detector that were incorporated into the µGC system of interest. In these tests, which were performed on chromatograms with 21–31 peaks for each detector, the true positive rate was 96.3%, the true negative rate was 94.1%, the false positive rate was 5.9%, and the false negative rate was 3.7%. The results demonstrated that the algorithm can support µGC systems for automated chemical screening and early warning applications.
1. Introduction
With the research and development dating back to the 1970s [1,2], microscale gas chromatography (μGC) systems are now achieving commercial significance and becoming increasingly promising for in situ measurements of volatile organic compounds (VOCs). A μGC system typically incorporates pump(s), valve(s), separation column(s), preconcentrator(s), and detector(s) [3]. There are two steps necessary to generate a chromatogram: the sampling and separation steps. During the sampling step, analytes are adsorbed by the preconcentrator(s). During the subsequent separation step, the analytes are desorbed and injected into the separation column(s), where the analytes are separated based on volatility as they pass through the separation column(s). A chromatogram is produced by the output of each detector that is located downstream of a column. The temporal delay of each analyte peak is called the elution (or retention) time and is a characteristic of the analyte for the particular separation column and test conditions. To enhance the differentiation of analytes with similar retention times, some μGC systems incorporate multiple complementary detectors [4,5,6,7,8,9].
Our group has recently reported a multi-cell, multi-detector μGC system based on a multi-sensing progressive cellular architecture (MPCA) [9]. This MPCA system monolithically integrates three cells, each incorporating a preconcentrator and a separation column that are tailored for a specific volatility range of analytes. Downstream of each separation column in an MPCA cell are located three detectors in series: two capacitive detectors with different polymer coating thicknesses (CapDetA and CapDetB) and an arrayed integrated photoionization detector (AiPD). By their inherent nature, these detectors provide complementary responses to chemical analytes, leading to well-differentiated responses.
An analytical run in an MPCA system includes a single (collective) sampling step followed by three sequential separation sub-steps—one for each cell. In the sampling step, the sampled vapor passes the three preconcentrators that are ordered by the sorbent adsorptivity, from lowest to highest. As such, the least adsorptive preconcentrator, which is located upstream, traps the least volatile chemicals, whereas the downstream, more adsorptive preconcentrators trap more volatile chemicals. In the subsequent separation sub-steps, one for each cell, the corresponding preconcentrator injects the adsorbed chemicals into the separation column within its cell, with the separation column being tailored for the volatility range of that cell. The output of the three detectors in each cell is tracked to create the overall chromatogram.
The essential information that emerges from an analytical run is the retention time of each analyte and the relative intensity of the response of each detector in each cell to each analyte that passes across it. The relative response of each detector to each analyte is defined as the detector response pattern (DRP) in this work. This paper focuses on an automated algorithm that recognizes chemicals based on the detected peaks in an MPCA µGC system using a combination of retention time and the DRP; the findings can be applied more generally to other μGC systems.
The DRP is a valuable metric for chemical recognition [10]. Various tools for DRP recognition have been reported. One of the most common statistical tools is the principal component analysis (PCA) [8,11], which is often used to reduce data dimensions while maximally preserving information [12]. For chemical recognition from the DRP, the PCA result is often combined with visual inspection [13], Fisher ratio (F-ratio) analysis [13], or other tools [14,15,16] to cluster the data so that statistical boundaries for different chemicals may be established. Another common statistical tool is library lookup [17] combined with machine learning techniques [18,19,20,21], which is also used to cluster the data for recognition.
Although statistical tools have achieved various degrees of success, they tend to have some limitations. First, most statistical tools neglect expert knowledge about the DRP that is intrinsically determined by the sensing principles of the detectors. Consequently, when processed by statistical tools, certain DRP features that benefit the use of expert knowledge may be reduced or eliminated. Second, these tools typically require a substantial amount of data for training, especially for machine learning techniques like neural networks [22,23]. This requirement increases the burden of performing extensive experimental characterizations, even though the experimental efforts can sometimes be alleviated by Monte Carlo simulation. Efforts to fully automate the recognition have been reported [19,24,25] but have not been targeted towards multi-detector µGC systems.
To effectively treat the DRP with expert knowledge and a relatively small amount of experimental characterization, a rule-based algorithm can be used for the raw DRP without statistical processing. The rules can be constructed by setting up an acceptable range of values for each feature of interest to account for uncertainty in the feature, essentially forming a fuzzy logic system [26,27,28,29]. In fuzzy logic, a membership function assigns to each object a score of membership ranging between 0 and 1, where a score closer to 1 indicates that the object is more likely a member of a certain class [30]. The membership function can be determined by statistical data, e.g., derived from the probability density function of a feature of the object. Alternatively, the membership function can be a mathematical expression of expert knowledge [31]. Triangular, trapezoidal, Gaussian, rectangular, and piecewise functions are commonly used for membership functions [31].
This paper reports an automated, rule-based chemical recognition algorithm for the MPCA system, in which expert knowledge is applied to construct a set of fuzzy logic rules. After the peaks are detected from a raw chromatogram, this algorithm uses the peak information (including the retention time, asymmetry, and peak heights) as the input. The recognition uses a chemical library that is constructed from a small number of experiments and applies the rules on the retention time and DRP parameters. Additionally, special rules are implemented for handing surface adsorptive chemicals and peaks with low signal-to-noise ratios. Finally, for each peak, the algorithm provides a list of possible candidates with likelihood scores as the output.
2. Operating Principle and Method
2.1. Overall Algorithm Flow
For ease of discussion, the temporal response of each detector in the MPCA system during the analysis of an analytical run is defined as a sub-chromatogram. For the whole MPCA system with two effective cells and three detectors in each cell; the ensemble of the 6 sub-chromatograms forms a chromatogram. In the following description, a peak in the chromatogram refers to the responses from all three detectors at a matched retention time.
The raw chromatograms must first be processed with a peak detection algorithm. For the MPCA system, the information provided by the peak detection algorithm includes, for each peak, the cell number, retention time, peak asymmetry, and peak heights from the three detectors. For each set of peaks corresponding to an analyte, the chemical recognition algorithm (Figure 1) compares the experimentally observed retention time to values in the chemical library and selects matching candidates. Among these candidates, the algorithm further compares the DRP of this set of peaks against those in the chemical library. Both comparisons use custom-defined recognition rules, which are combined to provide an overall likelihood score.
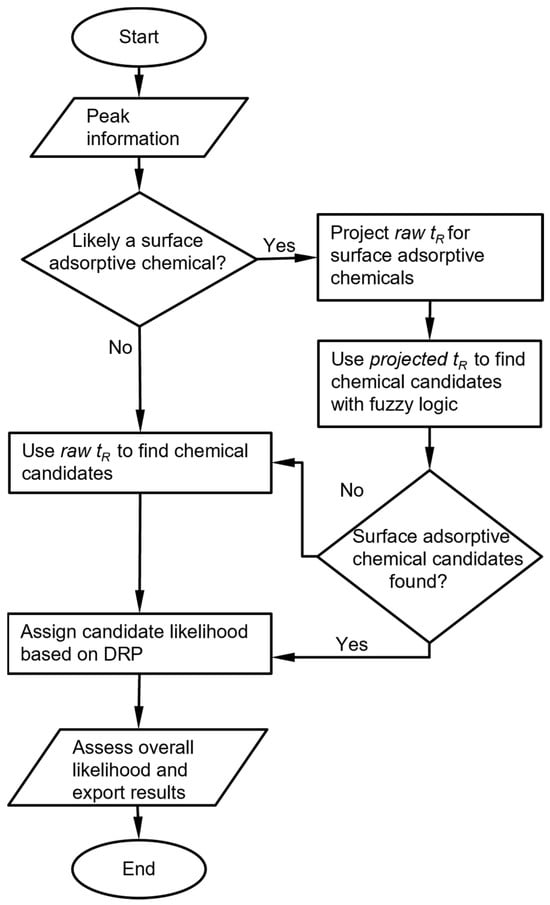
Figure 1.
Overall chemical recognition algorithm flow for each peak in a chromatogram.
In this process, multiple special handling cases may be triggered. First, a known reference chemical may be introduced by the user into the sample and used as a reference for the retention time. In this case, the algorithm first finds the peak for the reference chemical based on the chemical library, then converts the retention times of all other peaks to retention times relative to the reference chemical and uses these relative values for recognition. Second, for surface absorptive analytes such as the phosphonate esters that usually exhibit asymmetric peaks, the retention times may vary with the injected masses in the retention peaks. For these certain analytes, the retention times are not independently incorporated in the library. Instead, the relationship between retention time and peak height must be pre-determined experimentally, and this height-dependent retention time must be incorporated into the library. Third, when analyte is such that the responses of the detectors are highly orthogonal, some detectors may show strong responses, whereas others may show very weak or zero responses. Such cases may result in small detector signals, which require special handling that overrides the result of direct DRP matching.
2.2. Chemical Library and Recognition Parameters
The chemical library stores all the parameters of the expected system response to each chemical and of the recognition criteria. The library is constructed as a tabulated file using Microsoft Excel; all the parameters can be edited readily. The chemical library incorporates a basic library, an expanded library, and other algorithmic parameters. The basic library contains chemical properties and system response parameters of all target chemicals (Table 1). The chemical properties obtained from online databases include molecular weight, Kovats retention index (RI), dielectric constant, and ionization potentials. These chemical properties are retained for background but not for recognition by the algorithm. The system response parameters include nominal values of the retention time, DRP, the primary cell used for recognition, detector sensitivities, and chemical peak asymmetry. These parameters are obtained from a minimum set of experimental calibration runs, where the system is operated to sample and analyze custom-prepared chemical standards that contain well-separable chemicals. Such calibration runs are normally performed on any system and may include experimentally obtained values combined with theoretically interpolated values. These parameters are used for recognition by the algorithm.

Table 1.
Example of the basic chemical library that contains the chemical properties and MPCA system response characteristics.
The expanded library includes windows for the retention time and the DRP. Here, each window is a range defined by a lower bound value and an upper bound value. A parameter of an experimentally observed peak is considered a match to the corresponding parameter in the library if the experimental value is between the upper and lower bounds. The expanded library also includes parameters for the relationship between retention time and peak height of the surface adsorptive chemicals, which are dependent on the peak heights (Table 2).
Other parameters include identifying whether a reference chemical has been used, the name of the reference chemical, the limits of detection of the detectors, the sampling time of the run, the retention time windows (as fractions of the nominal values) for the surface adsorptive chemicals, and peak asymmetry threshold for treatment as surface adsorptive chemicals. The purpose of these parameters is described in the following sub-sections.
The library established for this work incorporates a total of 28 chemicals. Among these, three are surface adsorptive chemicals that were characterized together (i.e., in mixtures) by 10 experimental runs that covered a practical range of concentrations. The other 25 chemicals were characterized either as neat chemicals or in mixtures of 2–6 chemicals in a total of 7 experimental runs. Each run was performed at a single concentration that provided enough signal-to-noise ratios for most of the detector responses.
2.3. Recognition by Retention Time and Cell Number
As noted previously, the first step to recognizing a peak is to find chemicals in the library with matching retention times. The repeatability in the retention time is determined by the repeatability in the column flow rate and temperature, which may drift in field environments. Surface-adsorptive chemicals eluting a µGC column without sufficient deactivation may cause asymmetric peaks, for which the retention times may vary with concentration. Therefore, an appropriate window must be selected for the retention time based on the knowledge of the µGC system hardware.
The algorithm leverages the characteristics of the microsystem to which it is applied. Because the MPCA system incorporates multiple cells, the chemicals in the library are first pre-filtered by the cell that detected the peak. Within the MPCA system architecture, some chemicals may have responses in only one cell, whereas others may have responses in two cells. In the latter case, usually, one cell is superior to the other cell for recognition because of better peak separation or a taller peak. Hence, the superior cell is defined in the library as the primary cell for this chemical and used for recognition and quantification; the response of the other cell is excluded from the library, except for special cases (e.g., a reference chemical that has responses in two cells and can serve both the cells).
Next, the algorithm checks the peak asymmetry. A peak with significant tailing (i.e., with a tail portion that is much longer than the duration of the rising edge) is typically caused by a surface adsorptive chemical, which requires pre-treatment with an adjustment of the retention time, as discussed below. For a symmetrical peak (i.e., without significant tailing), the algorithm checks if its retention time falls within the retention time windows of each chemical in the library. For the retention time, the recognition involves the use of a high-confidence window and a medium-confidence window (which encloses the high-confidence window). If the retention time of the peak is located within the high-confidence window of a chemical, the chemical is considered a candidate and assigned a retention time likelihood score (StR) of 1. If the peak is located outside the high-confidence window, but within the medium-confidence window of a chemical, the chemical is also considered a potential candidate but is assigned a lower StR of 0.5. The combination of these windows forms a piecewise membership function (Figure 2). By default, the bounds of the high-confidence window and medium-confidence window are empirically set at ±6% and ±10% around the nominal retention times, respectively.
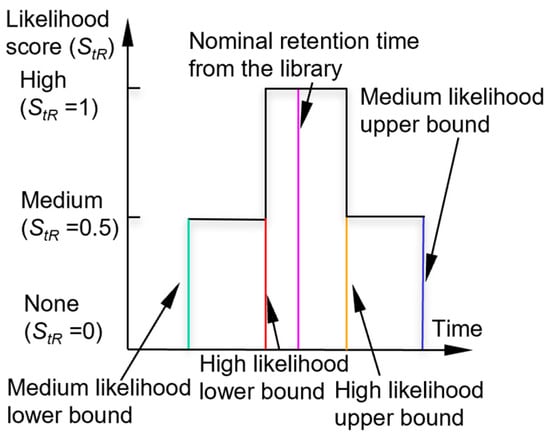
Figure 2.
Likelihood scoring function for retention time.
Table 2.
Example of the expanded chemical library incorporating additional parameters for use by the algorithm.
Table 2.
Example of the expanded chemical library incorporating additional parameters for use by the algorithm.
| Retention Time Likelihood Window | DRP Likelihood Window | Surface Adsorptive Chemical Fitting Parameters | ||||||||||||||
|---|---|---|---|---|---|---|---|---|---|---|---|---|---|---|---|---|
| Chemical | Cell | tR.HC.L(s) | tR.HC.U(s) | tR.MC.L(s) | tR.MC.U(s) | BAL (fF/fF) | BAU (fF/fF) | BDL (fF/mV) | BDU (fF/mV) | ADL (fF/mV) | ADU (fF/mV) | p1 | p2 | p3 | p4 | p5 |
| Benzene | 2 | 40.9 | 46.1 | 39.1 | 47.8 | −1 | 1 | −9.45 × 10⁻⁴ | −1.05 × 10⁻⁴ | 4.52 × 10⁻⁴ | 4.07 × 10⁻³ | |||||
| 2,3-Butanediol | 2 | 116.2 | 131.0 | 111.2 | 136.0 | 1 | 3 | 7.84 × 10⁻² | 7.06 × 10⁻¹ | 4.81 × 10⁻² | 4.32 × 10⁻¹ | |||||
| Butyl Acetate | 2 | 121.6 | 137.1 | 116.4 | 142.3 | 1 | 3 | 4.48 × 10⁻² | 4.03 × 10⁻¹ | 3.39 × 10⁻² | 3.06 × 10⁻² | |||||
| Carbon Tetrachloride | 2 | 42.4 | 47.8 | 40.6 | 49.6 | −1 | 1 | -infinity | −1.00 × 100 | 1.00 × 100 | infinity | |||||
| Cyclohexane | 2 | 43.7 | 49.3 | 41.9 | 51.2 | -infinity | −1 | −9.94 × 10⁻³ | −1.10 × 10⁻³ | 2.09 × 10⁻⁴ | 3.77 × 10⁻³ | |||||
| Decane | 3 | 31.4 | 35.5 | 30.1 | 36.8 | -infinity | −1 | −2.49 × 10⁻¹ | −2.76 × 10⁻² | 1.44 × 10⁻² | 1.30 × 10⁻¹ | |||||
| DEMP | 3 | 0 | 0 | 0 | 0 | 1 | 3 | 8.33 × 10⁻¹ | 7.49 × 100 | 5.89 × 10⁻¹ | 5.30 × 100 | 47.69 | 0.25 | 18.92 | 0.01 | 29.00 |
| DIMP | 3 | 0 | 0 | 0 | 0 | 1 | 3 | 4.12 × 10⁻¹ | 3.71 × 100 | 3.52 × 10⁻¹ | 3.17 × 10−0 | 22.95 | 0.06 | 14.73 | 0.38 | 53.00 |
| DMMP | 2 | 0 | 0 | 0 | 0 | 1 | 3 | 6.13 × 10⁻¹ | 5.68 × 100 | 3.03 × 10⁻¹ | 2.73 × 100 | 46.85 | 0.59 | 246.30 | 0.01 | 0.01 |
| o-Xylene | 2 | 184.7 | 208.3 | 176.9 | 216.2 | −1 | 1 | 1.55 × 10⁻² | 1.73 × 10⁻³ | 3.84 × 10⁻³ | 3.46 × 10⁻² | |||||
| o-Xylene | 3 | 14.9 | 16.9 | 14.3 | 17.5 | −1 | 1 | 1.55 × 10⁻² | 1.73 × 10⁻³ | 2.52 × 10⁻³ | 2.27 × 10⁻² | |||||
Cell indicates the cell that provides the peak to the chemical. tR.HC.L and tR.HC.U indicate the lower bound and upper bound of the retention time high-confidence window, respectively. tR.MC.L and tR.MC.U indicate the lower bound and upper bound of the retention time medium-confidence window, respectively. BAL and BAU indicate the lower and upper bound of the CapDetB/CapDetA window, respectively. BDL and BDU indicate the lower and upper bound of the CapDetB/AiPD window, respectively. ADL and ADU indicate the lower and upper bound of the CapDetA/AiPD window, respectively.
For the special case of surface adsorptive chemicals, e.g., phosphonate esters such as dimethyl methylphosphonate (DMMP), diethyl methylphosphonate (DEMP), and diisopropyl methylphosphonate (DIMP), the surface adsorption along the fluidic paths causes not only peak tailing but also retention time variation with concentration. For recognition, the latter factor must be specially treated. The peak tailing is a good indicator to trigger this special treatment. However, in a µGC system, peak tailing may also result from imperfections, such as slow preconcentrator desorption or leakage. To reduce the number of special treatments required, a second indicator can be added based on the fact that the surface adsorptive chemicals typically have high polarity, which produces positive responses in both the capacitive detectors [9]. Therefore, the algorithm implements a rule such that, if the asymmetry of a peak exceeds a certain threshold defined in the library, and both the CapDetA and CapDetB peaks are positive, this peak is considered likely a surface adsorptive chemical. Empirically, this threshold value is set to 3.
The next step is to determine whether this peak can be recognized as a surface adsorptive chemical in the library. For each of the applicable surface adsorptive chemicals in the library (i.e., in the same cell as this peak), its projected retention time (tRp) can be calculated based on a pre-characterized function of the actual peak height (H), which is empirically formulated as
where p1, p2, p3, p4, and p5 are fitting parameters obtained from multiple prior experimental characterization runs over a concentration range of interest (Figure 3). Considering the relatively large capacitive detector responses to the surface adsorptive chemicals, the peak height for this function is obtained from a capacitive detector (in this case, CapDetA). In prior experimental characterization, the fitting parameters for all the tested phosphonate esters provided R2 values ≥ 0.99 (Figure 3). Next, for each surface adsorptive chemical in the library, the bounds of the high-confidence window and medium-confidence window are empirically set at ±10% and ±20% around the tRp, respectively. The algorithm then searches for the surface adsorptive chemical candidates that have retention time windows enclosing the retention time of the detected peak. If no such candidate is found, the algorithm falls back to treat the peak as a normal peak.
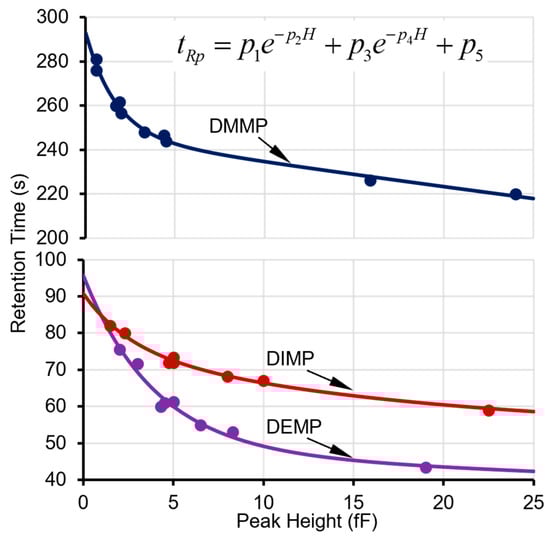
Figure 3.
Experimental data points on retention times and peak heights and fitted curves for DMMP in Cell2 and DEMP and DIMP in Cell3.
2.4. Recognition by DRP
After the selection of chemical candidates by retention time, leveraging the multi-detector benefit offered by the MPCA system, the DRP is further used for chemical recognition. In the MPCA system, the DRP consists of the three peak height response ratios representing ratios of the three detectors, i.e., CapDetB/CapDetA, CapDetA/AiPD, and CapDetB/AiPD. The nominal values of these response ratios are stored in the library. In the general case, a library lookup process is applied to each response ratio. If a response ratio of a detected peak falls within the corresponding window of a chemical candidate in the library, this response ratio is considered a match to the library and is assigned a likelihood score of 1; otherwise, it is assigned a likelihood score of 0. As a result, the membership function for each individual response ratio is essentially a rectangular function. The DRP match scores are denoted as SBA (for CapDetB/CapDetA), SAD (for CapDetA/AiPD), and SBD (for CapDetB/AiPD).
The CapDetB/CapDetA response ratio is a reliable indicator of the chemical polarity. CapDetA is designed to always provide a positive response, which is dominated by swelling of the detector coating (i.e., polydimethylsiloxane) upon chemical absorption. In contrast, CapDetB is designed to provide either a positive response or a negative response, depending on the dielectric constant difference between the chemical and the detector coating [9]. The CapDetB/CapDetA response ratio is most useful for differentiating among the following three chemical categories: (1) highly non-polar chemicals such as alkanes, for which this ratio is typically <−1; (2) less non-polar chemicals such as aromatic hydrocarbons, for which this ratio typically is between −1 and 1; and (3) polar chemicals, for which this ratio is typically between 1 and 3. However, within each chemical category, this ratio is less reliable in differentiating individual chemicals [9]. Therefore, in the expanded library, the windows for this ratio are coarsely set at these ranges rather than fixed percentages around the nominal values. For certain chemicals whose CapDetB/CapDetA response ratios are experimentally verified to deviate from the ranges above, the windows can be adjusted accordingly in the library. For example, 1-octanol is a polar chemical but has been experimentally verified to have a nominal CapDetB/CapDetA response ratio of 0.89; its CapDetB/CapDetA response window is adjusted to be from 0.45 to 1.35 in the library.
In contrast, the AiPD response is dominated by the ionization potential of the chemical, which is minimally or not correlated with the capacitive detector responses. In principle, relatively narrow windows can be used for the CapDetA/AiPD and CapDetB/AiPD response ratios. However, in practice, one must consider the inaccuracies in the peak height values provided by the peak detection algorithm, which can be caused by the slightly non-linear AiPD response to concentration [9], baseline drift, noise, asymmetry, and coelution (i.e., overlap of peaks).
In practice, for a combination of detectors with a high level of orthogonality (e.g., the 3 types of detectors in the MPCA system), it is not uncommon for one or more detectors to provide nearly zero peak heights. This scenario can cause significant variability in the calculation of the response ratios in the detected peaks. To address this scenario, a subroutine is implemented for comparing the response ratios of the detected peaks to the chemical library. In this subroutine, for each detector, a peak height threshold (Hth) is set at 6 times the detector noise (represented by the standard deviation σ), below which the response is considered potentially compromised. As a result, the Hth values for both the CapDetA and CapDetB are set at 0.24 fF, and that for the AiPD is set at 0.36 mV. Corresponding to the number of peaks with heights below Hth, the following three cases are considered: (1) All three peaks with heights below Hth; (2) two peaks with heights below Hth, (3) only one peak with a height below Hth. In the first case, for a chemical peak, if all three detectors provide peak height magnitudes below the thresholds, this peak is considered not recognizable by response ratio, and all three DRP match scores are set to zero.
The second is that in which two detectors provide peak height magnitudes that are below their corresponding thresholds, whereas the third detector provides a peak height magnitude that is above its thresholds. The DRP match score for the response ratio between the first two detectors is assigned zero. For each of the other two DRP scores, a projected peak height is calculated as the product of the third detector (above Hth) and the library value of the response ratio of respective first or second detector to the third detector. It is possible that the projected peak height magnitude of the first or second detector is also below the respective Hth. In such a case, the small magnitude of the detected peak height is confirmed, and subsequently, an exception is created where the DRP match score for the response ratio between this detector and the third detector is assigned to be 1, indicating a match of this response ratio to the chemical candidate. However, if the projected peak height magnitude of a detector is above Hth, the small magnitude of the detected peak height cannot be confirmed. In such a case, the exception above is not created, and the DRP match score for the peak height ratio between this detector and the third detector is determined by the library lookup result (Figure 4). As an example, assume that both the detected CapDetA and CapDetB peak height magnitudes are below their Hth, whereas the detected AiPD peak height magnitude is above its Hth. In this case, SBA is automatically assigned a zero. The projected CapDetA and CapDetB peak height magnitudes are calculated based on the detected AiPD peak height. If the projected CapDetA peak height is also below its corresponding Hth, the SAD is assigned a 1. Otherwise, the SAD is dependent on the library lookup result. The same judgment procedure is applied to the CapDetB and the SBD.
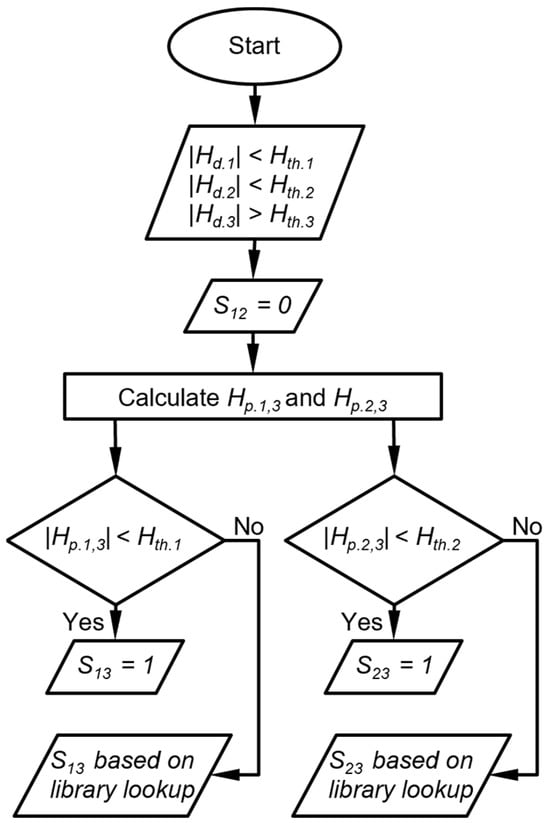
Figure 4.
Flow diagram of DRP match scoring when two detector peak heights are below their peak height thresholds. Hth.i is the peak heigh threshold for detector i, Hd.i is the detected peak height of the detector i, Hp.i,j is the peak height of detector i projected from detector j, and Sij is the score that corresponds to the response ratio between detector i and detector j.
The third case is that in which one detector provides a peak height magnitude below its Hth, whereas the other two detectors provide peak height magnitudes above their Hth (Figure 4). In this case, the DRP match score for the peak height ratio between the latter two detectors (S23) is determined by the library lookup result. Then, two projected peak heights are calculated for the former detector, each based on the detected peak height of one of the latter detectors. If a projected peak height magnitude is below its Hth, the DRP match score for the response ratio between the former detector and the corresponding latter detector is assigned to be 1. If a projected peak height magnitude is above its Hth, the DRP match score for the peak height ratio between the former detector and the corresponding latter detector is determined by the library lookup result (Figure 5). As an example, suppose the CapDetA peak height magnitude is below its Hth, whereas both the CapDetB and AiPD peak height magnitudes are above their Hth, the SBD is determined by the library lookup result. Two projections of the CapDetA peak height are calculated from the detected CapDetB and AiPD peak heights. If the CapDetA peak height magnitude that is projected from CapDetB Is below the Hth of CapDetA, SBA is assigned 1. Otherwise, the SBA is determined by whether the library lookup result for the CapDetA/CapDetB response ratio. The same judgment procedure is applied to the SAD.
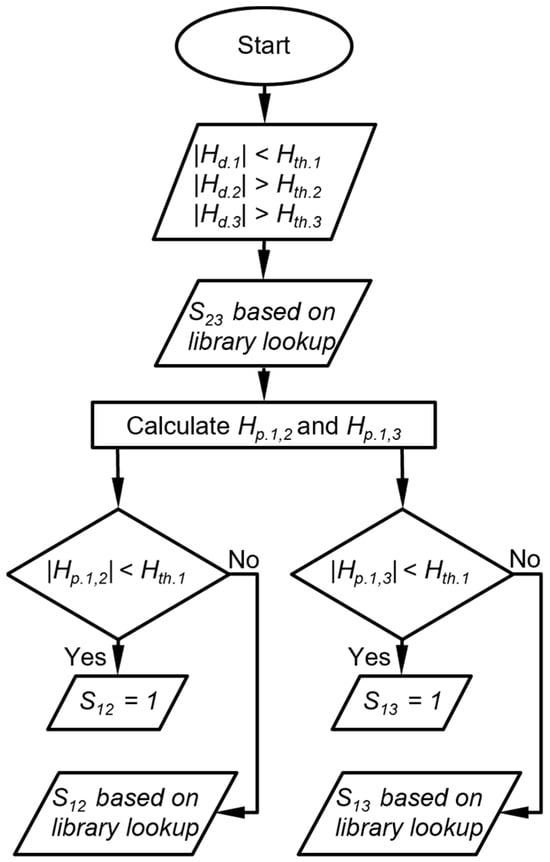
Figure 5.
Flow diagram of DRP scoring when one detector peak height is below its peak height thresholds. Hth.i is the peak height threshold for detector i, Hd.i is the detected peak height of the detector i, Hp.i,j is the peak height of detector i projected from detector j, and Sij is the score that corresponds to the response ratio between detector i and detector j.
2.5. Total Score for Recognition
To quantify the overall likelihood of a chemical recognition result, a total score (STotal) is calculated for each chemical candidate of a peak. The STotal is defined based on the individual retention time and DRP match scores:
where, Si is the ith DRP match score, wi is the corresponding weight assigned by the user, and StR is the previously defined retention time likelihood score. The three DRP match scores are combined by summing rather than multiplication; a single DRP match score of 0 does not eliminate a possible chemical candidate. In contrast, the StR and the sum of the DRP match score are multiplied (rather than being added) because a 0 in either of these two values is a good indicator of mismatch between a peak and a listed chemical in the library. By default, the wi values are all set to be 1/3. For a chemical candidate, as StR can be either 1 or 0.5 and Si can be either 1 or 0, the possible values of STotal include 0, 0.17, 0.33, 0.5, 0.67, and 1. For those users who prefer only binary results (i.e., presence or absence of target chemicals), the STotal criterion for positive recognition (i.e., presence of a target chemical) is set to be ≥0.67, i.e., with StR = 1 and at least two Si values to be 1. For other users who prefer more granularity in the results, the STotal value can provide additional insights. For example, a STotal of 1 represents higher confidence in the recognition than a STotal of 0.67, whereas a STotal of 0.5 may be set as an indicator for further investigation. Note that the weights of the DRP and the criterion for positive recognition can be changed by the user if needed.
2.6. Estimated Concentration
After chemical recognition, the algorithm provides an estimate of the chemical concentration, even though the quantification is not the focus of this work. To minimize the impact of quantification error from the detector noise, the algorithm selects in the primary cell the detector that provides the largest signal-to-noise ratio to compute the concentration associated with a peak. The concentration C is calculated by
where Hi is the peak height for the detector with the largest signal-to-noise ratio, αi is the sensitivity of the corresponding detector, and tsampling is the sampling time.
2.7. Using a Reference Chemical
If the user specifies a reference chemical to be used for recognition of other chemicals, the algorithm first verifies the presence of the reference chemical among all the detected peaks in both cells. This verification checks the retention time and the DRP between the detected peaks and the reference chemical information in the library using a similar process as described above. If the reference chemical is recognized in a cell, for all the other peaks in this cell, the algorithm computes the relative retention times (tR.r) as the ratios between the raw retention times and that of the reference chemical. All the retention time bounds are also ratioed accordingly. Then, the algorithm searches for chemical candidates, scores them as described above, and computes the relative concentrations (Cr) as a ratio to that of the reference chemical.
3. Results and Discussion
The chemical recognition algorithm was assessed using the peak detection results of the MPCA system chromatograms as the input data. In this work, the peak detection results were provided by a wavelet-based algorithm [32] that was further adapted for the MPCA system chromatograms. This peak detection algorithm provides a set of processed chromatograms for user visualization and provides tabulated peak information of all the detected peaks to be used for chemical recognition. The tabulated peak information includes the peak number, retention time, peak asymmetry, CapDetA peak height, CapDetB peak height, and AiPD peak height. To facilitate user inspection, the tabulated peak information is repeated in the output results table of the chemical recognition algorithm (e.g., Table 3) in the columns “Chemical Number”, “Retention time (s)”, “Asymmetry”, “CapDetA (fF)”, “CapDetB (fF)”, and “AiPD (mV)”, respectively. The output results table also includes the recognition scores StR, SBA, SAD, SBD, and STotal in the corresponding columns. The names and estimated concentrations of the recognized chemicals are reported in the columns “Chemical Name” and “C (ppb)”, respectively. For recognition results obtained with reference chemicals, the estimated concentration is labeled “Cr (ppb)” instead. Each recognized chemical contains all the information above in a row, which is uniquely numbered in the column “Chemical Number” using the format of “x.y.(z)”, where x indicates which cell the peak is from, y indicates which peak in the cell it is referring to, and z is the chemical candidate number. For example, the first possible chemical candidate for the third peak detected in Cell2 is numbered as “2.3.(1)”. In this work, only the Cell2 and Cell3 data are used for recognition; Cell1 is in continuing development and will be included in the future [9].
Table 3.
Recognition results for the first example. The labels on the left indicate comparison to the ground truth, in which the bold italic text indicates chemicals that are in the library. This section describes three representative examples of the chemical recognition results. In each example, the recognition results are compared against the true list of chemicals, i.e., the ground truth, on a peak-by-peak basis.
The first example is a relatively simple chromatogram, which contains eight detected peaks in Cell2 and 13 detected peaks in Cell3. The chromatogram shows all the peaks with known identities and whether they are in the library (Figure 6). Among the other peaks with unknown identities, Peaks 3.4, 3.7, 3.9, and 3.12, and part of Peak 2.4 resulted from system outgassing, as verified by separate chromatograms of blank runs (i.e., with zero-grade air as the samples), which also contained these peaks. The remaining unknown peaks likely resulted from trace impurities in the sample. After the algorithm performed chemical recognition, the output (Table 3) showed that all the chemicals that were within the library were correctly recognized, with a total score of 0.67 or higher. The peak for dodecane, which was not in the library, was correctly treated as unknown and not falsely recognized as another chemical in the library.
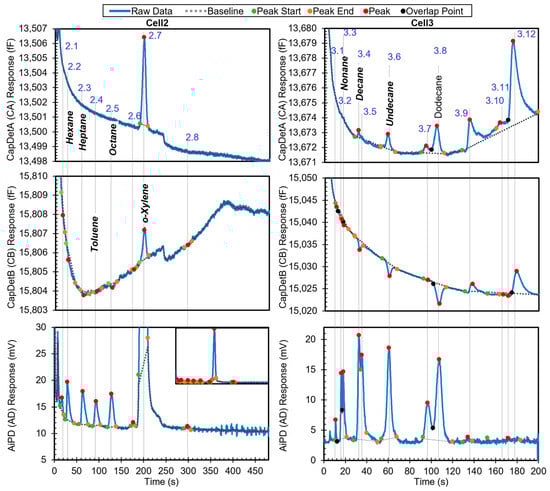
Figure 6.
Raw chromatograms and detected peaks of the first example. For the peaks with known identities, the identities are labeled. Known peaks present in the library are labeled in bold italic.
Using Peak 2.2 as an example to navigate the recognition algorithm, it was recognized as follows. In the first step, the algorithm decided that this peak was unlikely to be a surface adsorptive chemical, and hence, no special treatment was needed. Despite a peak asymmetry of 3.96 (which exceeded the threshold value of 3 for being considered to have significant tailing), this decision was made because neither peak height from CapDetA and CapDetB was a positive value, indicating that this peak was unlikely to be from a polar chemical. In the second step, based on the cell number and the retention time (29.2 s), both hexane and ethyl acetate were found as possible candidates. In the library, hexane has a nominal retention time of 29.2 s, a high-confidence window of 27.5–31.1 s, and a medium-confidence window of 26.3–32.1 s. Therefore, the StR for hexane was 1. In the library, ethyl acetate has a nominal retention time of 31.1 s, a high-confidence window of 29.2–33.0 s, and a medium-confidence window of 28.0–34.2 s. Therefore, the StR for ethyl acetate was also 1.
The third step used the DRP information. For Peak 2.2, the detected CapDetA peak height magnitude was below its Hth; in fact, the peak detection algorithm did not detect a CapDetA peak for it. Therefore, Peak 2.2 was treated as the third case in the DRP subroutine. Assuming that this peak was generated by hexane, the CapDetA peak height was projected from both the detected peak heights from CapDetB and AiPD, based on the nominal DRP for hexane. The former projected values were 0.06 fF and 0.03 fF, respectively; both were smaller than their corresponding Hth values. Therefore, both SBA and SAD were assigned to be 1. The CapDetB/AiPD peak height ratio was −5.68 × 10⁻², which was within the corresponding window in the library (−6.09 × 10⁻² to −6.76 × 10⁻³); therefore, SBD was assigned as 1. As a result, hexane received a STotal of 1, indicating that this peak was likely generated by hexane. Subsequently, the concentration was calculated for hexane using Equation (3); based on the peak height of the AiPD, which provided the strongest signal-to-noise ratio among the three detectors, the concentration was estimated to be 70.26 ppb. Next, assuming that this peak was generated by ethyl acetate, the CapDetA peak height was projected. However, neither the projected value was below the corresponding Hth. In the subsequent comparison of the peak height ratios against the library, none of the ratios formed a match. Therefore, ethyl acetate received a 0 in every DRP match score and consequently a STotal of 0, indicating that this peak was unlikely to have been generated by ethyl acetate.
The second example is a more complex chromatogram with 31 peaks. The complexity was manifested in the extent of partially and even fully coeluting peaks, for which the peak detection algorithm may produce inaccurate peak information, particularly on the peak heights and hence the DRP. The chromatogram in Figure 7 shows all the peaks with known identities and indicates whether or not they are in the chemical library. Other peaks correspond to unknown chemicals that resulted from system outgassing or sample impurities. Apart from methyl isobutyl ketone (MIBK), m-xylene, 1-chloroheptane, nitrobenzene, and dodecane, the other known chemicals were in the library. After the algorithm performed chemical recognition, the output (Table 4) showed that most of the chemicals that were within the library were correctly recognized, with a total score of 0.67 or higher. The peaks for m-xylene, 1-chloroheptane, nitrobenzene, and dodecane, which were not in the library, were correctly treated as either unknowns or a chemical with STotal < 0.67, i.e., they were not falsely recognized as another chemical in the library.
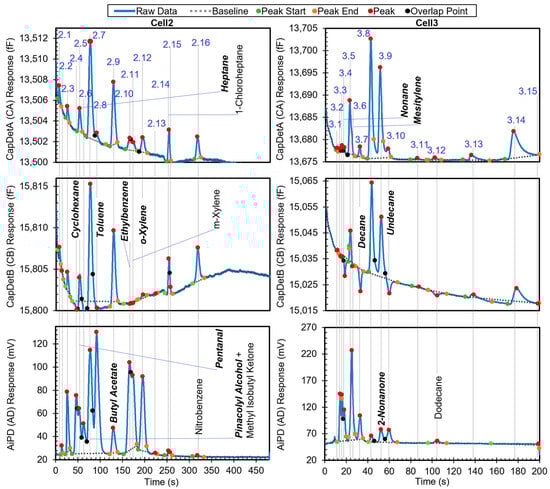
Figure 7.
Raw chromatograms and detected peaks of the second example. For the peaks with known identities, the identities are labeled. Known peaks present in the library are labeled in bold italic.
Table 4.
Recognition results for the second example. The labels on the left indicate comparison to the ground truth, in which the bold italic text indicates chemicals that are in the library.
However, there were some cases of misrecognition. Peak 2.7, which resulted from full coelution of pinacolyl alcohol (in the library) and MIBK (not in the library), was not recognized correctly. Based on the retention time, pinacolyl alcohol was correctly found as the possible candidate with a StR of 1. In the subsequent recognition based on the DRP, all three detector peak height magnitudes were above their corresponding Hth values, so all DRP ratios were directly compared to the windows in the library. Only the CapDetB/CapDetA response (1.59 × 100) was within the corresponding window (1–3), whereas CapDetB/AiPD (1.67 × 10⁻¹) was not within the corresponding window (9.81 × 10⁻³ to 8.83 × 10⁻²), and CapDetA/AiPD (1.05 × 10⁻²) was also not within the corresponding window (7.60 × 10⁻³ to 6.84 × 10⁻²). Therefore, SBA was assigned 1, whereas SBD and SAD were assigned 0, producing a STotal of only 0.33. This false negative recognition resulted from the coelution of MIBK, which altered the DRP. In the future, this problem can be addressed by incorporating MIBK into the library and implementing the algorithm to handle coeluting chemicals.
For Peak 2.9, while butyl acetate was correctly reported with STotal = 0.67, 2,3-butanediol was reported with STotal = 1. This was because both 2,3-butanediol and butyl acetate had relatively similar nominal retention times (123.6 s vs. 129.3 s), so their high-confidence retention time windows both covered the retention time of Peak 2.9 (at 129.6 s); additionally, they had relatively similar DRPs. Evidently, the retention time of Peak 2.9 was much closer to that of butyl acetate than 2,3-butanediol. If the retention time windows can be narrowed to, for example, within ±3% of the nominal retention time, the high-confidence window of 2,3-butanediol becomes 119.9–127.3 s, whereas that of butyl acetate becomes 125.5–133.3 s. In this scenario, the retention time of Peak 2.9 only falls within the high-confidence window of butyl acetate.
For the same reason as Peak 2,9, both 1-octanol and 2-nonanone were reported for Peak 3.9, although only the former was truly in the sample. However, the nominal retention times of 2-nonanone (51.7 s) and 1-octanol (51.8 s) are almost identical. Therefore, for these two chemicals, simply narrowing the retention time window cannot improve recognition. Differentiation of these two chemicals may require narrower DRP windows.
The third example is a chromatogram with phosphonate esters (DMMP, DEMP, and DIMP), which are surface adsorptive chemicals. The chromatogram contains 21 peaks. The chromatogram in Figure 8 shows all the peaks with known identities and whether they are in the chemical library. All the known chemicals were in the library. After the algorithm performed chemical recognition, the output (Table 4) showed that all the chemicals that were within the library were correctly recognized, with a total score of 0.67 or higher. Peak 2.2 resulted from system outgassing, but the algorithm recognized it as toluene; a possible solution to addressing this problem is presented later.
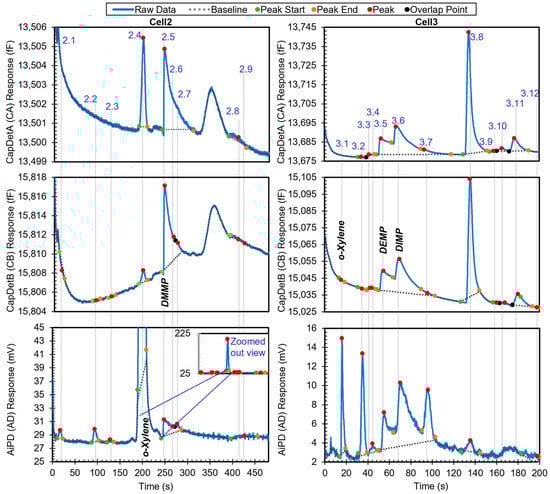
Figure 8.
Raw chromatograms and detected peaks of the third example. For the peaks with known identities, the identities are labeled. Known peaks present in the library are labeled in bold italic.
When the user specified the use of o-xylene as the reference chemical, the phosphonate esters were also correctly recognized and quantified in relative quantities (Table 5). In this process, the algorithm first searched for o-xylene in both cells and correctly recognized Peaks 2.4 and 3.1 as o-xylene. Next, retention times of o-xylene in these two cells were set as reference retention times, with 199.7 s for Cell2 and 15.9 s for Cell3. Take Peak 2.5 as an example. It had a retention time of 248.1 s in Cell2 and, therefore, a relative retention time of 1.2 (i.e., 248.1 s/199.7 s). In the first step, based on the peak asymmetry (24.5) and the CapDetA and CapDetB peak heights (both being positive), the peak underwent special treatment. In Cell2, the only surface adsorptive chemical in the library was DMMP. Using Equation (1) and the detected CapDetA peak height, the projected retention time for DMMP was 245.3 s. With a nominal retention time of 196.5 s in the library for o-xylene in Cell2, the projected nominal relative retention time of DMMP was, therefore, 1.2, which well matched the relative retention time of Peak 2.5. Therefore, StR was assigned 1. Subsequently, the recognition based on the DRP was performed as previously discussed.
Table 5.
Recognition results of the third example. The labels on the left indicate comparison to the ground truth. The columns in light blue background are results with the use of o-xylene as the reference chemical. For this example, other columns resulting from the use of the reference chemical are identical as those without using a reference chemical and therefore not repeated here.
Although most peaks that resulted from system outgassing were correctly treated as unknowns, some may have affected the recognition results. For instance, Peak 2.2 in the third example was incorrectly reported as toluene, whereas Peak 2.4 in the first example (which constituted both system outgassing and toluene from the sample) was possibly overestimated in concentration. One solution to address these problems is to incorporate the features of the outgassing peak into the chemical library, including not only the retention times and the DRPs but also the expected peak heights. As a result, these peaks can be correctly recognized as outgassing chemicals and separated from true unknown chemicals in the sample. Furthermore, if the outgassing peaks are well characterized, their contributions to the peak heights of the actual analyte chemicals can be subtracted before quantifying the analyte chemicals.
Other false positive cases resulted from chemicals with similar parameters, such as Peak 2.9 (butyl acetate and 2,3-butanediol) and Peak 3.9 (2-nonanone and 1-octanol) in the second example. Although further narrowing the retention time and DRP windows may enhance differentiation between these chemicals, it requires more experimental characterization of the system hardware to provide more statistics on the variations in these parameters. Additionally, as the AiPD exhibits a non-linear response to chemical concentrations [9], it requires additional considerations. Regardless, for an expert user who recognizes the MPCA system as a chemical screening and early warning system rather than a fingerprint-type identification system, the current style of reporting multiple possibilities for each peak may be considered a useful feature.
To quantitatively summarize the recognition accuracy, the recognition results were categorized to form a confusion matrix (Table 6). For each peak, if its recognition result included the correct chemical identity, it was considered a true positive; if a peak from any chemical outside the library was falsely recognized as a chemical in the library, it was considered a false positive; if its recognition result included both a correct chemical identity and an incorrect chemical identity, it was considered both a true positive and a false positive (e.g., Peak 2.9 in the second example). Additionally, if a peak from any chemical outside the library was reported as unknown, it was considered a true negative; if a peak was from any chemical in the library but was reported as unknown, it was considered a false negative. Overall, the chemical recognition algorithm in this work provided a true positive rate of 96.3%, a true negative rate of 94.1%, a false positive rate of 5.9%, and a false negative rate of 3.7%.
Table 6.
Confusion matrix based on the recognition results.
Compared to the statistical methods, the advantages of this work are summarized as follows:
- A viable library can be constructed using small data sets (7 total for non-special case chemicals) and expert knowledge.
- The causal relationship between the recognition score, the DRP, and expert knowledge increases the traceability of the algorithm.
- Special rules for small signals and for surface absorptive chemicals enhance the recognition of complex samples.
4. Conclusions
Overall, the algorithm reported in this work provided chemical recognition for a µGC system with three complementary types of detectors and achieved its intended performance. Recognition rules for the retention time and the detector response pattern were developed based on both the physical attributes and expert understanding of the hardware. Despite the use of relatively coarse windows for individual parameters, the combined use of these recognition rules enabled chemical recognition in complex chromatograms, overcoming the uncertainty of peak information resulting from low signal-to-noise ratios, asymmetry, and overlapping peaks. Additionally, customized special treatments were implemented to further address these problems. The recognition capabilities of the algorithm were illustrated in three examples, with all the results well expected and explainable. Such a chemical recognition algorithm requires only a small amount of experimental data because, typically, one experimental run is enough to establish the nominal responses for multiple chemicals. Therefore, this algorithm shows the prospects of reducing the burden on system calibration while providing satisfactory results to expert users.
Although this work adopts fuzzy logic, the membership functions applied to the individual parameters are relatively simple, i.e., with step functions providing binary results to a small number of discrete windows. With more experimental characterization and a better understanding of the parameter variations, probability density functions can be established and used as the membership functions, thus providing more granularity to the individual recognition scores.
To further improve the algorithm, future work may include the following. (1) Characterize the outgassing peaks and add them to the library. (2) Conduct more experimental characterization of the chemical response variations, which can provide a better quantitative basis for setting the membership functions and likelihood windows. (3) Implement an algorithm to handle coeluting chemicals within a peak. (4) Expand the library to include more chemicals.
Author Contributions
Conceptualization, Q.X. and Y.Q.; methodology, Q.X. and Y.Q.; software, Q.X.; validation, Q.X. and Y.Q.; formal analysis, Q.X. and Y.Q.; investigation, Q.X.; resources, Y.Q. and Y.B.G.; data curation, Q.X.; writing—original draft preparation, Q.X.; writing—review and editing, Q.X., Y.Q. and Y.B.G.; visualization, Q.X.; supervision, Y.Q. and Y.B.G.; project administration, Y.B.G.; funding acquisition, Y.Q. and Y.B.G. All authors have read and agreed to the published version of the manuscript.
Funding
This research was funded in part by the Office of the Director of National Intelligence (ODNI), Intelligence Advanced Research Projects Activity (IARPA), via contract number FA8650-19-C-9105.
Data Availability Statement
The data presented in this study are available on request from the corresponding author.
Acknowledgments
The authors gratefully acknowledge the contributions of W. Liao, D. Winship, I. Lara-Ibeas, X. Zhao, H. Lu, T. Qian, and R. Gordenker on the design, fabrication, assembly, and data collection of the MPCA system.
Conflicts of Interest
The authors declare no conflict of interest.
References
- Carle, G.C.; Donaldson, R.W.; Terry, S.C.; Wise, K.D. Microminiature Gas Chromatograph; NASA Tech Briefs; NASA: Washington, DC, USA, 1972. [Google Scholar]
- Terry, S.C.; Jerman, J.H.; Angell, J.B. A gas chromatographic air analyzer fabricated on a silicon wafer. IEEE Trans. Electron Devices 1979, 26, 1880–1886. [Google Scholar] [CrossRef]
- Regmi, B.P.; Agah, M. Micro Gas Chromatography: An overview of critical components and their integration. Anal. Chem. 2018, 90, 13133–13150. [Google Scholar] [CrossRef] [PubMed]
- Jin, C.; Zellers, E.T. Chemometric analysis of gas chromatographic peaks measured with a microsensor array: Methodology and performance assessment. Sens. Actuators B Chem. 2009, 139, 548–556. [Google Scholar] [CrossRef]
- Li, M.; Myers, E.B.; Tang, H.X.; Aldridge, S.J.; McCaig, H.C.; Whiting, J.J.; Simonson, R.J.; Lewis, N.S.; Roukes, M.L. Nanoelectromechanical resonator arrays for ultrafast, gas-phase chromatographic chemical analysis. Nano Lett. 2010, 10, 3899–3903. [Google Scholar] [CrossRef] [PubMed]
- Qin, Y.; Gianchandani, Y.B. A fully electronic microfabricated gas chromatograph with complementary capacitive detectors for indoor pollutants. Microsyst. Nanoeng. 2016, 2, 15049. [Google Scholar] [CrossRef]
- Hu, J.; Qu, H.; Chang, Y.; Pang, W.; Zhang, Q.; Liu, J.; Duan, X. Miniaturized polymer coated film bulk acoustic wave resonator sensor array for quantitative gas chromatographic analysis. Sens. Actuators B Chem. 2018, 274, 419–426. [Google Scholar] [CrossRef]
- Wang, J.; Nuñovero, N.; Nidetz, R.; Peterson, S.J.; Brookover, B.M.; Steinecker, W.H.; Zellers, E.T. Belt-mounted micro-gas-chromatograph prototype for determining personal exposures to volatile-organic-compound mixture components. Anal. Chem. 2019, 91, 4747–4754. [Google Scholar] [CrossRef]
- Liao, W.; Winship, D.; Lara-Ibeas, I.; Zhao, X.; Xu, Q.; Lu, H.; Qian, T.; Gordenker, R.; Qin, Y.; Gianchandani, Y.B. Highly Integrated μGC Based on a Multi-sensing Progressive Cellular Architecture with a Valveless Sample Inlet. Anal. Chem. 2023, 95, 2157–2167. [Google Scholar] [CrossRef]
- Kim, S.K.; Chang, H.; Zellers, E.T. Microfabricated Gas Chromatograph for the selective determination of trichloroethylene vapor at sub-parts-per-billion concentrations in complex mixtures. Anal. Chem. 2011, 83, 7198–7206. [Google Scholar] [CrossRef]
- Hove, H.T.; Grahl-Nielsen, O.; Rogstad, A. Assay for dinoflagellate toxins in mussels by gas chromatography and Principal Components Analysis. Anal. Chim. Acta 1989, 222, 35–42. [Google Scholar] [CrossRef]
- Jolliffe, I.T.; Cadima, J. Principal component analysis: A review and recent developments. Philos. Trans. R. Soc. A Math. Phys. Eng. Sci. 2016, 374, 20150202. [Google Scholar] [CrossRef]
- García-Berríos, E.; Gao, T.; Theriot, J.C.; Woodka, M.D.; Brunschwig, B.S.; Lewis, N.S. Response and discrimination performance of arrays of organothiol-capped au nanoparticle chemiresistive vapor sensors. J. Phys. Chem. C 2011, 115, 6208–6217. [Google Scholar] [CrossRef][Green Version]
- Park, J. Personal Monitoring Instrument for the selective simultaneous measurement of multiple organic vapors. Am. Ind. Hyg. Assoc. J. 2000, 61, 192–204. [Google Scholar] [CrossRef]
- Park, J.; Groves, W.A.; Zellers, E.T. Vapor recognition with small arrays of polymer-coated microsensors. A comprehensive analysis. Anal. Chem. 1999, 71, 3877–3886. [Google Scholar] [CrossRef] [PubMed]
- Zellers, E.T.; Batterman, S.A.; Han, M.; Patrash, S.J. Optimal coating selection for the analysis of organic vapor mixtures with polymer-coated surface acoustic wave sensor arrays. Anal. Chem. 1995, 67, 1092–1106. [Google Scholar] [CrossRef]
- Stein, S.E. An integrated method for spectrum extraction and compound identification from gas chromatography/mass spectrometry data. J. Am. Soc. Mass Spectrom. 1999, 10, 770–781. [Google Scholar] [CrossRef]
- Sholokhova, A.Y.; Grinevich, O.I.; Matyushin, D.D.; Buryak, A.K. Machine learning-assisted non-target analysis of a highly complex mixture of possible toxic unsymmetrical dimethylhydrazine transformation products with chromatography-mass spectrometry. Chemosphere 2022, 307, 135764. [Google Scholar] [CrossRef]
- Baccolo, G.; Quintanilla-Casas, B.; Vichi, S.; Augustijn, D.; Bro, R. From untargeted chemical profiling to peak tables—A fully automated AI driven approach to untargeted GC-MS. Trends Anal. Chem. 2021, 145, 116451. [Google Scholar] [CrossRef]
- Senesac, L.R.; Dutta, P.; Datskos, P.G.; Sepaniak, M.J. Analyte species and concentration identification using differentially functionalized microcantilever arrays and artificial neural networks. Anal. Chim. Acta 2006, 558, 94–101. [Google Scholar] [CrossRef]
- Matyushin, D.D.; Sholokhova, A.Y.; Buryak, A.K. Deep Learning Driven GC-MS Library Search and its application for Metabolomics. Anal. Chem. 2020, 92, 11818–11825. [Google Scholar] [CrossRef]
- Alwosheel, A.; van Cranenburgh, S.; Chorus, C.G. Is your dataset big enough? Sample size requirements when using artificial neural networks for discrete choice analysis. J. Choice Model. 2018, 28, 167–182. [Google Scholar] [CrossRef]
- Beleites, C.; Neugebauer, U.; Bocklitz, T.; Krafft, C.; Popp, J. Sample size planning for classification models. Anal. Chim. Acta 2013, 760, 25–33. [Google Scholar] [CrossRef] [PubMed]
- Wilde, M.J.; Zhao, B.; Cordell, R.L.; Ibrahim, W.; Singapuri, A.; Greening, N.J.; Brightling, C.E.; Siddiqui, S.; Monks, P.S.; Free, R.C. Automating and extending comprehensive two-dimensional gas chromatography data processing by interfacing open-source and commercial software. Anal. Chem. 2020, 92, 13953–13960. [Google Scholar] [CrossRef] [PubMed]
- Behrends, V.; Tredwell, G.D.; Bundy, J.G. A software complement to AMDIS for processing GC-MS Metabolomic Data. Anal. Biochem. 2011, 415, 206–208. [Google Scholar] [CrossRef]
- Blaffert, T. Computer-assisted multicomponent spectral analysis with fuzzy data sets. Anal. Chim. Acta 1984, 161, 135–148. [Google Scholar] [CrossRef]
- Otto, M.; Bandemer, H. Pattern recognition based on fuzzy observations for spectroscopic quality control and chromatographic fingerprinting. Anal. Chim. Acta 1986, 184, 21–31. [Google Scholar] [CrossRef]
- Love, J.H. Gas chromatograph peak identification using statistically determined fuzzy logic membership functions. In Proceedings of the IEEE International Conference on Neural Networks (ICNN), Orlando, FL, USA, 28 June–2 July 1994; pp. 3283–3288. [Google Scholar]
- Rearden, P.; Harrington, P.B.; Karnes, J.J.; Bunker, C.E. Fuzzy rule-building expert system classification of fuel using solid-phase microextraction two-way gas chromatography differential mobility Spectrometric Data. Anal. Chem. 2007, 79, 1485–1491. [Google Scholar] [CrossRef]
- Zadeh, L.A. Fuzzy Sets. Inf. Control 1965, 8, 338–353. [Google Scholar] [CrossRef]
- Mendel, J.M. Uncertain Rule-Based Fuzzy Systems: Introduction and New Directions, 2nd ed.; Springer: Berlin/Heidelberg, Germany, 2019. [Google Scholar]
- Zhao, X.; Qin, Y.; Gianchandani, Y.B. Automatic Peak Integration and Baseline Correction for Micro-scale Gas Chromatographs Using Continuous Wavelet Transform. In Proceedings of the IEEE Sensors, Montreal, QC, Canada, 27–30 October 2019; pp. 1–4. [Google Scholar]


Disclaimer/Publisher’s Note: The statements, opinions and data contained in all publications are solely those of the individual author(s) and contributor(s) and not of MDPI and/or the editor(s). MDPI and/or the editor(s) disclaim responsibility for any injury to people or property resulting from any ideas, methods, instructions or products referred to in the content. |
© 2023 by the authors. Licensee MDPI, Basel, Switzerland. This article is an open access article distributed under the terms and conditions of the Creative Commons Attribution (CC BY) license (https://creativecommons.org/licenses/by/4.0/).