Abstract
For the manufacturing of complex biopharmaceuticals using bioreactors with cultivated mammalian cells, high product concentration is an important objective. The phenotype of the cells in a reactor plays an important role. Are clonal cell populations showing high cell-specific growth rates more favorable than cell lines with higher cell-specific productivities or vice versa? Five clonal Chinese hamster ovary cell populations were analyzed based on the data of a 3-month-stability study. We adapted a mechanistic cell culture model to the experimental data of one such clonally derived cell population. Uncertainties and prior knowledge concerning model parameters were considered using Bayesian parameter estimations. This model was used then to define an inoculum train protocol. Based on this, we subsequently simulated the impacts of differences in growth rates (±10%) and production rates (±10% and ±50%) on the overall cultivation time, including making the inoculum train cultures; the final production phase, the volumetric titer in that bioreactor and the ratio of both, defined as overall process productivity. We showed thus unequivocally that growth rates have a higher impact (up to three times) on overall process productivity and for product output per year, whereas cells with higher productivity can potentially generate higher product concentrations in the production vessel.
1. Introduction
For the production of certain biopharmaceuticals, animal cells have to be expanded from a frozen vial. Today, Chinese hamster ovary (CHO) cells are by far the most popular system in use [1] because they are known to be easy to grow; safe as far as not carrying any infectious agents; and last but not least, highly productive with yields in the multiple grams per liter range [2,3]. Nevertheless, questions and issues remain to be solved to maximize their utility, particularly since CHO cells have a very wide range of genotypic diversity and thus corresponding phenotypic differences [4,5,6]. This is quite obvious when clonally derived cell populations from a single transfection are compared against each other. These phenotypic differences have impacts on growth-related characteristics, cell-specific productivity and the quality of the final product (e.g., glycosylation patterns) [6,7]. Screening and profiling methods have been introduced (amongst others by [5,7]) to assess cell growth rate, cell-specific productivity and glycosylation patterns, along with further quality attributes of the produced recombinant proteins. In addition, the phenotypic stability of cell populations is another important parameter. A factor to maintaining stability over a reasonable time frame is the use of environmental conditions of cells within narrow and favorable ranges [2,3]. For the testing of the genetic and production stability, clonally derived cell lines, also in the following referred to as “clones” or “clonally derived cell populations”, undergo typically stability studies which can last up to six months.
Desired phenotypic parameters to be maintained in such generated cell lines (besides properties characterizing the quality of the produced recombinant protein) are high cell-specific productivity [3,4,8,9] and high growth rates in order to reduce overall cultivation times (including the duration of the cell expansion process). However, growth rates and specific productivity of recombinant cells are often inversely related to each other [3]. Thus, a frequent trade-off has to be weighed between clonal populations, with one showing faster growth but a lower cell-specific production rate and vice versa (see Figure 1a), assuming little or no quality differences in the product obtained.
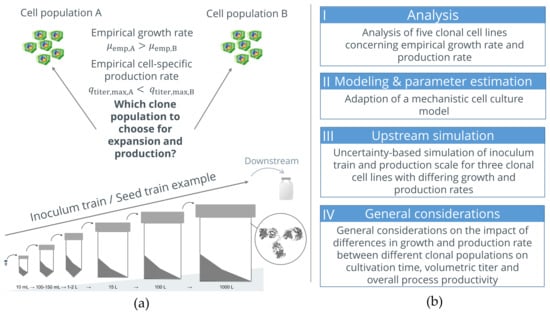
Figure 1.
(a) Problem definition: Find the clone with a higher potential regarding inoculum train creation and final quantities of interest (volumetric titer in production and overall process productivity (=Space-Time-Yield; volumetric titer in production/overall cultivation time including inoculum train)). (b) Structure of the presented studies.
Mathematical process models appear to be suitable tools for analysis, for the generation of process understanding and for simulation and prediction. Several examples of using such process models addressing biopharmaceutical manufacturing can be found in the literature [10,11,12,13,14,15,16]. Within this field, uncertainty-based methods gained attention because model uncertainty, uncertainty in measurements and batch-to-batch variability can be taken into consideration in this way.
This study aims to present a model-based investigation of the impacts of clonal differences concerning cell-specific growth rates and cell-specific production rates on the duration of an inoculum train; the volumetric titer in production; and the overall process productivity, defined by the ratio of volumetric titer in production to the overall cultivation time, including the duration of the cell expansion process (inoculum train). In this study, a batch process (for simulation of the inoculum train and also for the production bioreactor) has been used for simulation and evaluation because it is a good first step to obtain results regarding the impacts of phenotypic differences on the above-described response values. This can be further expanded—once a smaller number of clonally derived cell lines have been chosen—to also involve fed-batch processes and/or perfusion mode.
The investigation is divided into four main blocks (see also Figure 1b(I–IV) for orientation).
I: Growth rate and production rate were analyzed for five clonal populations based on the data of a stability study (Section 3.1).
II: A reference cell line was taken from one of these and a mechanistic cell culture model was adapted to the data obtained in the laboratory (Section 3.2). Uncertainties were considered and prior knowledge from previous studies concerning model parameters was integrated into the model using Bayesian parameter estimation.
III: Upstream simulations were performed for three different clonal cell lines under consideration of the variabilities observed in Section 3.1. For each clonal cell line a suitable inoculum train protocol is defined. Furthermore, these inoculum train protocols are compared to each other with respect to inoculum train duration and volumetric titer in production (see Section 3.3).
IV: Several combinations of maximum growth rate (±10%) and maximum production rate (±10% and ±50%) within realistic ranges were considered (Section 3.4). First, production rate was varied ±10% for a multiple regression. Second, a variation of ±50% was applied to cover all three investigated clones with their growth and production rates and to illustrate them in a response surface plot. Based on the results, a decision criterion is provided which is expected to help in evaluating different clonal cell lines.
2. Materials and Methods
2.1. Data from a Stability Study
Experimental data from a stability study for analysis of cell-specific growth rates (in the following growth rates) and cell-specific production rates (in the following production rates) for five different clonal CHO populations (named clone 1, ..., clone 5) have been used for statistical analysis. The CHOExpress cells have been used as a host system, which are known to be moderate producers of ammonia. This is also based on the media formulations used in the work. Cells were cultivated with and without puromycin in duplicate runs in 50 mL OrbShake tubes (TubeSpin bioreactor 50™, TPP, Trasadingen, Switzerland, 30 mm diameter) with culture volumes of 5 mL. Each subcultivation was started with a viable cell density of 5 cells mL. The cultures were shaken at 180 rpm in a Kühner SFX-1 incubator (Kühner AG, Birsfelden, Switzerland), set at a temperature of 37 C and a CO set-point of 5%. For each clonal population, cells have been cultivated and passaged (subcultivated) every 3 or 4 days during a time period of 13 weeks (25 subultivations in total). Measurements of volumetric product titer were taken 4 days after starting a new subcultivation for every second subcultivation. Viable cell densities were determined at the end of every subcultivation. The seeding density of 5 cells mL was based on calculated dilutions into fresh medium. These data have been used for approximations of empirical growth rates and production rates according to Section 2.4.
2.2. Experimental Data and Set Up for Modeling Purposes
Batch culture experiments were performed by ExcellGene SA for clonal cell population 1 (clone 1) for modeling purposes. Cell expansion was carried out in volumes of 10 mL (TubeSpin bioreactor 50™, TPP, Trasadingen, Switzerland, 30 mm diameter), 50 mL (Erlenmeyer bottle—250 mL, 85 mm diameter) and 500 mL (TubeSpin bioreactor 600™, TPP, Trasadingen, Switzerland, 100 mm diameter) while shaking at 37 C temperature, 180 rpm shaking speed, 80% humidity and 5% CO. Viable cell density and viability were determined using Guava easyCyte™ 5HT cytometry (Luminex Corporation, Austin, TX, USA) and glucose, glutamine, lactate and ammonia were measured using a NOVA Bioanalyzer (Nova Biomedical Corporation, Waltham, MA, US). At 10 mL and 50 mL scale, measurements of viable cell density and viability were performed on days 0, 1, 2, 3 and 4, and volumetric titer was measured on day 8. At the 500 mL scale of operation, measurements of viable cell density, viability, glutamine and ammonia were performed on days 0, 1, 2, 3, 4 and 8. Glucose and lactate were determined at days 0, 1, 2, 3 and 4 and by volumetric titer on days 4 and 8.
For clarity, in the following and throughout this paper, data presentation and discussions on cell cultures refer to experimental work with clonal cell lines by identifying these in numbers, i.e., clonal cell line # 1, 2, 3, or equivalent. In contrast, modelled cell lines are referred to as Clone A, B, etc.
2.3. Cultivation Systems for Inoculum Train Simulations
For inoculum train simulation, only vessel-types applicable for orbital shaking have been considered, with the expectation that the cultivation conditions were highly similar during cell expansion. These have been taken from the list reported in [17]. Based on the given working volumes, an inoculum train has been designed to include 5 scales from 10 mL to 100 L target volume and a production scale of 1000 L target volume (see Table 1).

Table 1.
Cultivation systems, including working volumes per vessel.
2.4. Approximations of Empirical Growth Rates and Production Rates
Based on data of viable cell densities of a clonal population, empirical (averaged) growth rates and empirical (averaged) production rates have been determined. The empirical growth rate between two points in time and was calculated using the corresponding viable cell density values and according to
The empirical production rate between two points in time and was calculated using the corresponding volumetric titer values and according to
2.5. Statistical Testing of the Differences in Means between Clonal Cell Populations
Clonal populations have been analyzed regarding their growth rates and production rates by applying statistical tests to determine the differences between population means using the statistical software R [18]. Variance homogeneity was tested using the Bartlett test [19]. A global test on differences between population means was performed using the Brown and Forsythe F-test [20] (similar to the classical ANOVA but adapted for heterogeneous variances). To identify where the differences come from and to determine the differences between individual groups, post hoc tests have to be performed. When comparing more than two populations, a method for multiple testing containing an adjustment of the significance level is additionally required. Multiple testing methods exist for groups showing heterogeneous variances. In this work, a pairwise comparison was performed using the adjustment method by Benjamini and Yekutieli [21]. The applied statistical tests and R-commands are given in Figure 2.
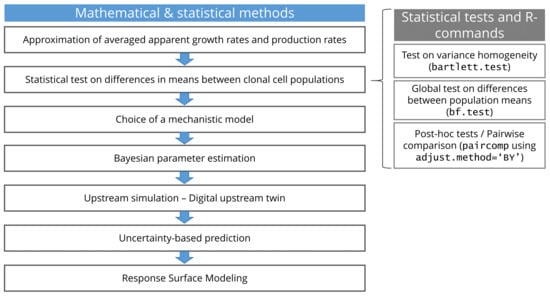
Figure 2.
Summary of mathematical, statistical and computational methods applied in the presented study including the applied R-commands for statistical tests.
2.6. Mechanistic Model
The applied kinetic model is a modification of previous model variations published in [12,13,22,23]. Differential equations (see Table 2), consisting of nine mostly Monod-type algebraic equations (description of growth rate, death rate, substrate uptake, metabolite production kinetics and production rate) and 18 model parameters, describe the cell culture dynamics of total and viable cell density, and and concentrations of glucose , glutamine , limiting substrate , lactate , ammonia and volumetric titer . All these variables and model parameters are listed in Table A1, including units and descriptions.
Table 2.
Mechanistic model (for batch and fed-batch mode) [12,13,22,23] for descriptions of cell growth, cell death, substrate uptake, metabolite production and antibody production.
The model can be applied for batch-mode and fed-batch mode. The presented model example contains extended fed-batch terms for a glucose feed, a glutamine feed and a medium feed containing specific glucose and glutamine concentrations. Therefore, the differential equations are extended by the terms (at the end of each differential equation) including feeding rates for glucose () and glutamine () and for the medium feed (). The specific glucose and glutamine concentrations are denoted by , , and . When applying fed-batch mode, all considered concentrations (viable and total cells, substrates and metabolites) are diluted during addition of the feed. This is represented by the dilution term . At the same time, glucose or glutamine concentrations increase during the glucose or glutamine feeding and during the medium feeding. This is represented by the terms , and or , respectively. When applying this model to batch-mode, all these feeding terms are omitted.
2.7. Bayesian Parameter Estimation
One of the main differences between Bayesian statistics and frequentist statistical methods (“classical statistics” based on frequencies) is that Bayesian statistics provides a framework to integrate prior process knowledge (knowledge available before applying new data for analysis), including input uncertainty, and to calculate probabilities based on both, prior knowledge and new collected data. Applying this principle within the context of parameter estimation is called Bayesian parameter estimation. A very brief description of this procedure is given through the following steps: Step 1 quantifies the prior knowledge, including input uncertainties (e.g., measurement uncertainties of initial concentrations and uncertainties concerning model parameters). In this contribution a gamma distribution has been chosen to describe the probability distribution of model parameters (further details can be found in the Appendix A.1).
The second step is to determine the posterior parameter distributions using an appropriate algorithm. A Markov chain Monte Carlo method was applied based on a single-component metropolis algorithm, resulting in posterior distributions, including the maximum a posteriori (MAP) estimate and variance.
Step 3 is to evaluate the parameter estimation results, for example, based on the Monte Carlo error and the posterior parameter distributions. This method was implemented in the self-developed seed train-software tool developed at Ostwestfalen-Lippe University of Applied Sciences and Arts. For a more detailed description of this approach, refer to [13].
2.8. Upstream Simulation—Software Tool
The upstream process has been simulated and digitally displayed using the seed train-software tool [12,13,14] implemented in MATLAB [24]. To digitally display an upstream process, several inputs are required: The estimated model parameters, initial concentrations of cells of the first scale of operation, a passaging or subcultivation strategy for the cells (e.g., concerning the point in time for cell passaging), the inoculum train vessels and operating conditions and medium concentrations. For further details, see [12,13,14].
2.9. Uncertainty-Based Prediction
For simulation of the production scale, uncertainty in measurements of initial concentrations and in parameters was considered and propagated onto the output. Therefore, Monte Carlo samples were generated sampling initial values of state variables for scale 1 from a gamma distribution described above. The corresponding histograms can be found in the appendix; see Figure A1.
The obtained 90% prediction bands (credible bands) were used for comparisons of different clonal cell populations, and were calculated using the 5% and 95% quantiles of the obtained Monte Carlo sample at a specific point in time.
2.10. Response Surface Modeling
Response surface models (RSM) describe the relationships between individual explanatory variables (here and ) on one or more process variables of interest. In this contribution, the first response variable was the volumetric titer in production. The second response variable was the overall process productivity (=Space-Time-Yield: volumetric titer in production/overall cultivation time, including inoculum train). To explain: This is very important when a given manufacturing plant can be used for production during one year—how much product can this facility deliver for the market? This methodology mostly consists of solving a multiple regression model, meaning to estimate the corresponding regression coefficients. First order and second order polynomials have been adapted (through estimation of regression coefficients) using MATLAB [24]. To evaluate the obtained model, the coefficient of determination was calculated. It is a measure used to explain how well differences in the response variable can be explained by its relationship to the considered independent factors.
The -coefficients (here ) indicate how much the response value changes per each unit variation of the independent variable (or factor, here , or ). Thus, a higher -coefficient stands for a higher correlation between the factor and the response value (here volumetric titer or overall process productivity).
3. Results and Discussion
The following results provide insights into the roles of cell-specific growth rate (in the following growth rate) and cell-specific production rate (in the following production rate) in the cell expansion process (inoculum train) and the final production scale of operation using a model-based simulation approach. The following variables are considered: duration of the inoculum train; the volumetric titer in production; and the overall process productivity, defined by the ratio of volumetric titer in production to the overall cultivation time, including inoculum train.
In the first step (compare to Figure 2), data of a stability study of five clonal CHO cell lines were analyzed concerning growth rates and production rates. Can statistically significant differences can be observed between these five cell populations?
An implemented and tested mechanistic cell culture model was adapted to further exploit the experimental data of one of these populations. Modeling and parameter estimations based on new experiments at 10, 50 and 500 mL were performed. This model was then used for further theoretical considerations.
Uncertainty-based simulations of inoculum train and production scale were performed for three clonal cell lines with established differences of growth and production rates.
Finally, a study was performed for several combinations of growth rate and production rate, showing the impacts of these differences on cultivation time and overall process productivity.
3.1. Analysis of Variabilities in Growth Rate and Production Rate for Five Clonal Cell Lines
Experimental data from a 3-month stability study were used to calculate growth and production rates for each clonal population. The clonal populations were subcultivated every 3 or 4 days during a time period of 13 weeks (see Section 2.1). The averaged empirical growth rates for two measurements of viable cell density and (at the beginning and at the end of a subcultivation) have been calculated according to Equation (1). The averaged empirical production rate between the beginning of a subcultivation and 4 days later was calculated according to Equation (2) for every second subcultivation (volumetric titer were only determined for the 4-day subcultivations).
The obtained average growth and production rates are illustrated in Figure 3 over every second subcultivation. The corresponding distributions can be found in the appendix (see Figure A2 and Figure A3).
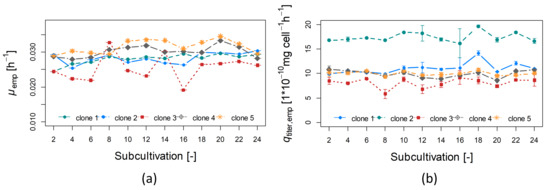
Figure 3.
Growth rates (a) and production rates (b) for clonal populations “clone 1” to “clone 5” for every second subcultivation in 50 mL OrbShake tubes.
Mean, standard deviation (sd), coefficient of variation (cv) and maximum (max) are listed for both quantities, growth rate and production rate, for all five populations in Table 3.
Table 3.
Mean, standard deviation (sd), coefficient of variation (cv) and maximum of empirical growth rate and mean, standard deviation, coefficient of variation and maximum of empirical production rate for ‘clone 1’ to ‘clone 5’ based on data from a 13 weeks-stability study.
Clone 5 showed the highest growth rate (a mean of 0.030 h, a cv of 7% and a maximum value of 0.035 h) and clone 2 the highest production rate (a mean of 17.4 mg cell h, a cv of 5.8% and a maximum value of 19.6 mg cell h) (see also Figure 3).
Overall, the growth rates (mean values) varied between 0.62 d (=0.026 h) and 0.72 d (=0.030 h), and production rates varied between 19 pg cell d (=8.09 ·10 mg cell h) and 42 pg cell d (=17.4 ·10 mg cell h). These growth rates are in the range of those reported recently in [6] (0.48–0.76 d), where different CHO host cell lines were compared. The production rates found in the present study exceeded the production rates presented in [6], where production rates between 1.6 and 16.2 pg cell d were found, and [25], where averaged production rates ranged between 8 and 22 pg cell d, though the cultivation set ups in those studies may have differed in some aspects from ours, e.g., concerning cultivation vessels and volumes.
However, to identify which clones differ from each other in terms of averaged growth rates and production rates, the variations of the calculated rates have to be considered as well. To decide if several clonal populations have significant differences in terms of their means, an analysis of variance adapted for heterogeneous variances and post hoc tests (multiple comparison) has been performed according to the statistical procedure described in Section 2.5. To test on variance homogeneity, the Bartlett test was applied, and the result (p-value = 0.019 for , p-value = 0.021 for ) indicates heterogeneous variances. Hence, the Brown and Forsythe F-test [20] was applied. The results (p-value = 2.9 for and p-value = 5.0 for ) show that statistically significant differences (on a 5%-level) exist in both cases. The results of the post hoc tests, to identify differences between individual groups, are listed in Table 4.
Table 4.
Results of the test regarding differences in means: differences concerning growth rate ( and corresponding p-value) and concerning production rate ( and corresponding p-value).
It can be seen that most populations show statistically significant differences between each other (p-values ≪ 0.05), except clone 2 and clone 3 concerning growth rate (p-value = 1), and clone 4 candompared to clone 5 concerning both, growth rate (p-value = 0.19) and production rate (p-value = 1). The biggest difference in terms of growth rate has been found between clone 5 and clone 3, with a difference of 0.0041 h (see Table 4, row 1, columns 1–3). A positive value in column 2 means that the left clone in column 1 has a higher than the right clone in column 1.
Clone 2 has a significantly higher specific productivity than any of the other clones (see Table 4, rows 1 to 4, columns 4–6). All differences between clone 2 and the compared clone are positive and statistically significant (p-values < 0.05). The following is cell line 1 with significantly higher production rates than clones 3, 4 and 5 (see Table 4, rows 5, 8 and 9 in columns 4–6).
To investigate whether a theoretical clonal cell population showing high growth rates is more favorable than cell lines with higher production rates, clonal populations (here referred to in a generalist way as clone A and clone B) are considered which are inversely related to each other. This means that the following criteria are fulfilled:
- The averaged empirical growth rate of clone A, , is statistically significantly higher than the averaged empirical growth rate of clone B, , i.e., .
- The averaged empirical production rate of clone A, , is statistically significantly lower than averaged empirical production rate of clone B, , i.e., .
This holds for the comparisons “clone 1 vs. clone 5” and “clone 2 vs. clone 5” of Section 3.1. Therefore, the differences between these clones in terms of growth rate and production rate (highlighted in bold font in Table 4) are considered in the following.
It should be noted that the averaged growth and production rates differ from the model parameters maximum growth rate and maximum production rate , used within a cell culture model. For this reason, the presented findings regarding differences between clonal populations have also been calculated on a percentage basis, to keep the same ratios within the simulation-based investigations. The empirical growth rate of clone 1 was approximately 7.6% higher than that of clone 5 and 10% higher than that of clone 2. The empirical production rate was 10.5% lower than that of clone 5 and 74% higher than that of clone 2.
In order to know how these clones would behave in a typical cell expansion process (from vial to production vessel) and at the final production phase, a representation was created which is explained in the following section. Growth rates and production rates are assumed to remain the same at the larger scales of operation.
3.2. Model Adaption of a Mechanistic Cell Culture Model for Prediction Using Bayesian Parameter Estimation
To display the cell growth behavior of a cell line, a growth model has to be applied and adapted based on experimental data. Since only clone 5 was available for further experiments, cell expansion processes from 5 mL and 10 mL in parallel to 500 mL have been performed at ExcellGene SA for this clone. At 5 and 10 mL scales, viable cell density, viability and volumetric titer have been measured. Calculated growth rates and production rates have been used to define the prior distributions of and in the following.
At 500 mL scale, cells have been cultivated over a period of 8 days and substrates (glucose and glutamine) and metabolites (lactate and ammonia) were measured in addition to viable cell density, viability and volumetric titer (to also adapt parameters characterizing substrate uptake and death rate). Based on these experiments, a growth model (see Section 2.2), which had been already applied to other CHO cell lines, was used here while applying Bayesian parameter estimations. This approach consists of the following steps:
In a first step, the prior knowledge about model parameters had to be quantified. In the second step, experimental data were added, and a Markov chain Monte Carlo algorithm is used to find the posterior probability distributions of the model parameters to be estimated. The obtained posterior distributions contained information from prior knowledge and new experimental data.
3.2.1. Prior Knowledge
To quantify the prior probability distributions of model parameters, data from the stability study and data from additional experiments at 5 mL and 10 mL with the same clone, clone 5, have been used in the following way:
The maximum growth rate of clone 5 over all subcultivations of the stability study was h. Additional experiments at 5 and 10 mL-scales revealed growth rates of 0.046 and h, respectively. The additional experiments provide one measurement per day, allowing the computation of the growth rate per day. The stability study provides data at the beginning and at the end of each subcultivation (with a duration of 3 or 4 days each). Consequently, the maximum growth rate cannot be approximated as precisely as using daily measurements. Nevertheless, it is considered for determination of the prior distribution but with less weight (1/3) than the approximations of further experiments (2/3).
The maximum production rate of clone 5 over all subcultivations of the stability study revealed mg cell h. The maximum production rates of clone 5, based on additional experiments at 5 and 10 mL-scales, were mg cell h and mg cell h, respectively. The reason for the variation of these values is unknown, but the variation (uncertainty) itself is information also included in the prior probability study. (A higher uncertainty signifies less weight for the prior mean within the parameter estimation process).
Based on this information, mean and variance have been calculated to characterize the prior probability distribution of maximum growth rate and maximum production rate according to Equation (A1). These are listed in Table 5, including the corresponding coefficient of variation (cv).
Table 5.
Prior parameter values for maximum growth rate (mean, variance and coefficient of variation (cv)) and empirical production rate (mean, variance and coefficient of variation (cv)).
3.2.2. Posterior Distributions
Bayesian parameter estimation has been performed using a Markov chain Monte Carlo (MCMC) algorithm considering cultivation data (at 500 mL over 8 days) and prior distributions as described in Section 2.7. Measured and simulated time course data are presented in Figure 4. It can be seen that reasonable agreement between measured and simulated data can be achieved by the set of model parameters used, although more experimental data between day 4 and day 8 could have helped to define more precisely when the cells entered into the stationary phase. Prior (before parameter estimation) and posterior (after parameter estimation) distributions are shown in Figure 5. Posterior means of estimated model parameters and values of the fixed model parameters are presented in Table A1. It can be concluded from Figure 4 together with Figure 5 that parameters and represent rather well the measured data: Posterior distributions (red solid lines) are much narrower than the prior distributions (blue dashed lines), thereby reducing uncertainty for these model parameters. This means that uncertainty has been reduced for these model parameters. Furthermore, the means moved slightly to the right in the case of maximum growth rate and strongly to the left in case of . Posterior distributions of the remaining model parameters do not differ much from their prior distributions.
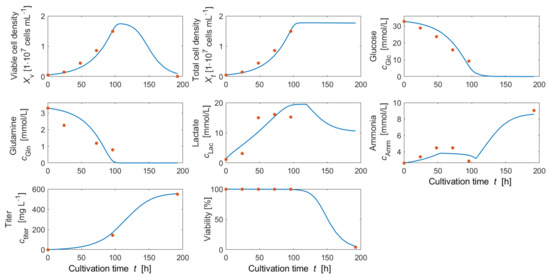
Figure 4.
Measurements (red dots) and simulated time profiles (blue solid lines) of viable and total cell density, glucose concentration, glutamine concentration, lactate concentration, ammonia concentration, volumetric titer and viability after Bayesian parameter estimation (based on the maximum a posteriori estimate (MAP)) at 500 mL scale (TubeSpin bioreactor 600™).
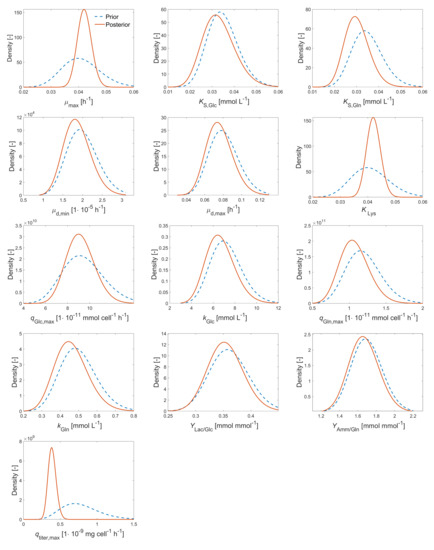
Figure 5.
Earlier derived (a priori) parameter distributions (before parameter estimation, blue dashed lines) and posterior parameter distributions (after parameter estimation, red solid lines) of estimated model parameters of the process model presented in Table 2 based on experimental data from cultivation in 500 mL (TubeSpin 600™ bioreactor) with a cultivation time of 8 days.
3.3. Uncertainty-Based Upstream Process Simulation—Comparison of Three Clonal Populations with Different Growth and Production Rates
In this section, we describe the application of the adapted model perform upstream simulations for three different theoretical cell lines, named A, B and C, under consideration of variabilities observed in Section 3.1. The reference clone A is characterized by the model parameter distributions obtained in the previous section (parameter estimation for clone 5). The two other clones B and C are defined as showing lower growth rates than clone A, but higher production rates than clone A, as listed in Table 6. In order to choose realistic values concerning the differences between clones A, B and C, the differences obtained in Section 3.1 concerning growth rate and production rate have been applied. Empirical growth rates for experimentally analyzed cell lines 5 and 1 showed an averaged difference of 7.6% and for 5 and 2 an averaged difference of 10%.Therefore, model parameter of clone B was chosen to be 7.6% lower than of clone A and of clone C was chosen to be 10% lower than of clone A.
Table 6.
Model parameters maximum growth rate and maximum production rate of the three clones used for the simulation.
Empirical production rates for cell lines 5 and 1 showed averaged differences of 10.5% and 74%, respectively. Therefore, model parameter of clone B was chosen to be 10.5% higher than of clone A, and of clone C was chosen to be 74% higher than of clone A. A suitable inoculum train protocol was defined for each clonal cell line. Furthermore, these simulations were used to investigate and illustrate the impact of differences in growth and production rates between all three clones regarding duration of the inoculum train, volumetric titer in production and overall process productivity for a batch process.
To digitally display an upstream process, the following inputs have been defined:
Volumes: The simulated upstream process consisted of six scales of operation with the following volumes: 10 mL → 120 mL → 1.5 L → 15 L → 100 L → 1000 L (production).
This setup enabled the use of a highly similar type of cultivation approach (orbital shaking) at all scales. Note: ExcellGene has considerable experience with scale-up cultures in both orbital shaken and standard stirred systems to have sufficient confidence in the matching impacts of critical parameters in both approaches (not published). Passaging strategy: Cells were passaged, i.e., subcultivated, as soon as a required cell density for transfer was reached, using the predicted viable cell density. The required cell biomass was based on the optimal cell density for inoculation at cells mL. Initial concentrations: viable cell density, cells mL; viability; glucose, mmol L; glutamine mmol L; lactate, mmol L; ammonia, mmol L, titer, = 0 mg L; and volume, L. Furthermore, a limiting substrate was assumed to have initial value mmol L.
The corresponding simulated time profiles for trends in viable cell density and titer are presented in Figure 6.
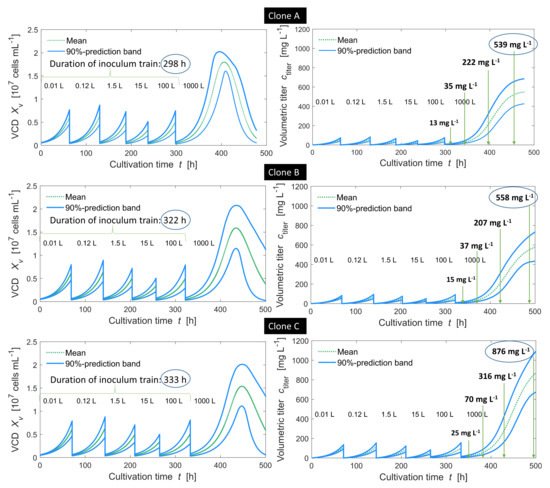
Figure 6.
Simulated viable cell density (VCD) and volumetric titer over inoculum train cultures (5 scales) and production scale (1000 L) for clones A (above), B (middle) and C (below). The maximum growth rate of clone B was 7.6% lower than that of clone A, and the maximum cell-specific production rate of clone B was 10.5% higher than that of clone A. The maximum growth rate of clone C was 10.5% lower than that of clone A and the maximum cell-specific production rate of clone C was 74% higher than that of clone A.
It turned out that the designed inoculum trains seemed suitable for cell expansion of all three clonal populations. When the inoculum cell densities were fulfilled, cells did not enter into the stationary phase during the inoculum train, and transfer cell densities were within an acceptable range (maximum cell density below cells mL).
The durations of the inoculum train cultures ranged from 298 to 333 h. Obviously, lower growth rates cause longer cultivation times. Clone B needed 24 h and clone C 35 h more than clone A. Clone A and clone B, concerning the predicted volumetric titers in the production vessel, differed by a 10.5% higher production rate of clone B, resulting in a 13% higher volumetric titer during the first hours of the production phase. However this difference shrunk over time: After 25 h clone A reached 13 mg L and clone B 15 mg L. Between 50 and 100 h in the production vessel, clone A compensated for the disadvantage through a 7.6% higher growth rate. After 100 h, clone A presentd a titer of 222 mg L, 7% more than clone B with 207.0 mg L. Nevertheless, after 168 h (7 days) clone B reached a higher volumetric titer (558 mg L) than clone A (539 mg L). This was due to the fact that the higher growth rate of clone A led to an earlier beginning of the death phase (here in batch mode) compared to clone B. Putting the volumetric titer in relation to the overall cultivation time and accepting an overall error of about 10%, both clones led to a similar overall process productivity (1.16 mg L h for clone A and 1.14 mg L h for clone B).
A clearer impact was observed for clone C, having a 10% lower maximum growth rate combined with a 74% higher production rate as compared to clone A. Already, after the first 25 h in the production vessel, clone C reached 25 mg L on average (clone A and B only 13 and 15 mg L, respectively), and after 7 days (168 h) clone C reached 876 mg L (clone A and B only 539 and 558 mg L, respectively). This is an increase of 337 mg L (63.5% of the volumetric titer generated with clone A).
It should be noted that the presented model-based method can be further extended to fed-batch processes which are most frequently applied in industrial large scale manufacturing or to perfusion mode. However, the batch process has been considered in this study because the focus was not to find an optimal operating mode for the production bioreactor, but rather to consider how phenotypic differences effect cell growth in the inoculum train, which contributes significantly to the manufacturing time and overall process productivity, yet is rarely considered in literature [26].
A comparison of different CHO host cell lines for batch, fed-batch and perfusion modes was recently reported in [6]. They found that differences in phenotypic properties affect cell growth and productivity regardless of process mode (batch, fed-batch or perfusion) or cell culture media.
For a better illustration, Figure 7 shows how variabilities in model parameters and propagate onto the output uncertainty in form of probability distributions (histograms) at each interesting point in time.
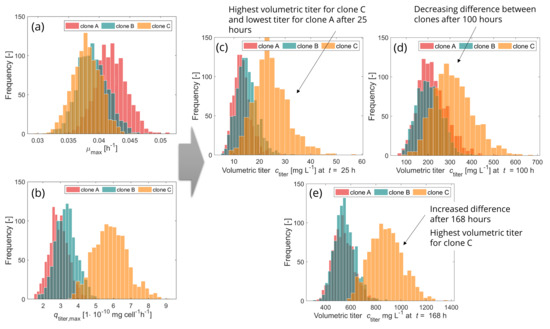
Figure 7.
Histograms of inputs and outputs for clone A in the background (red), clone B in the middle (turquoise) and clone C in the front (orange). Inputs: Probability distributions of maximum growth rate (a) and maximum production rate (b) for three different clones. Probabilities are defined by the given means and and the corresponding coefficients of variation (cv). Outputs: Probability distributions of volumetric titer after 25 (c), 100 (d) and 168 (e) hours for the three clones.
It thus becomes visible how the output distribution changes over time. In accordance with the results presented in Figure 6, there is not a huge difference concerning volumetric titer between the distributions of clone A and clone B: not after 25 h (Figure 7c), 100 h (Figure 7d) or 168 h (Figure 7e) of production. The distributions are almost overlapping, although after 100 h clone A shows a higher mean than clone B, as described above. The distribution of clone C instead differs clearly from those of clone A and clone B (small overlap) after 25 h in production. After 100 h of production there are larger overlapping areas between all three clones, indicating a decline in differences between them. However, after 168 h (7 days) of production, a clear difference (smaller overlap) is visible between clone C and clones A and B, whereas clone A and B are almost totally overlapping. In this case and under the assumptions of equal stability and quality, clone C would be the recommended clone for moving forward.
Nevertheless, it may be the case that two or more clonal populations differ in a different proportion to each other in terms of phenotypic characteristics than the here discussed three. The following section tries to address such.
3.4. Impacts of Differences in Growth and Production Rates on Inoculum Train and Titer at Production Scale—General Considerations and a Decision Criterion
To judge the effects of growth rate and specific productivity in numerous clonal cell populations, one needs to know the resulting overall process productivities (=Space-Time-Yield: volumetric titer in production/overall cultivation time, including inoculum train).
We determined these effects for a realistic cell expansion setup and based on model parameter ranges derived from the previous sections ( h± 10%, mg cellh± 10%). For each parameter combination, the two response numbers (volumetric titer in production and overall process productivity) were obtained by upstream simulations as before. These results were then adapted to corresponding response surfaces (see Figure A4, Figure A5, Figure A6), which visualize the effects of maximum growth rate and maximum production rate on each response quantity.
Multiple linear regression has been performed for the responses after 50, 100 and 168 h in the production vessel. Due to their different orders of magnitude, all variables have been scaled (transformed) to the range of [0, 1]. The results are presented in Table 7.
Table 7.
Results of a multiple linear regression (R, -coefficients, standard error (SE) and p-value) in two variables, maximum growth rate (coefficient ) and maximum production rate (coefficient ) at 50, 100 and 168 h of production. Response values are volumetric titer in production and overall process productivity (=Space-Time-Yield: volumetric titer in production/overall cultivation time, including inoculum train).
All regressions have an R-value very close to one, meaning that the applied model is suitable to present the correlation between factors and response variables. All determined -coefficients, which describe the correlation of () and () for the investigated response variable, show p-values less than 0.05 (meaning that they are statistically significant to a 5%-level). Due to the scaling of both factors, the -coefficients stayed within the range of 0 and 1. It is interesting to see that the impact and the relation between both factors, and , varies depending on which point in time in production is considered.
Regarding volumetric titer as a response variable, it can be observed that after 50 h in the production vessel, the impact of ( = 0.57) was 1.4 times higher than the impact of ( = 0.42). After 100 h in production, this changed. Then, the impact of ( = 0.69) was 2.2 times higher than the impact of ( = 0.31). However, after 168 h (7 days) in production, ( = 0.67) was again higher than (two times = 0.33). The decreasing impact of after 168 h can be explained because cells probably entered in the stationary/death phase (here batch-mode is assumed) while cells were still producing titer.
Considering overall process productivity, has a higher impact than , regardless of the considered point in time (see -coefficients for the overall process productivity in Table 7). It was 1.6 times higher after 50 h, three times higher after 100 h and 1.17 times higher after 168 h cultivation time in the production vessel compared to . Obviously, therefore, growth rates have a higher impact on the output per year.
This regression analysis was performed within a range of 0.397 h± 10% for and 5 mg cellh± 10% for ); it should be noted, however, that the results of the stability study showed a higher variation of the production rate than that of the growth rate. Therefore, has been varied ± 50%, and response surfaces for both response variables, volumetric titer and overall process productivity, have been estimated as shown in Figure 8.
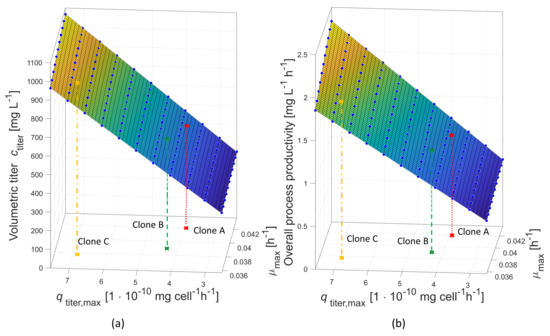
Figure 8.
Response surface for volumetric titer after 168 h (7 days) of production over maximum production rate and maximum growth rate (a). Overall process productivity (=Space-Time-Yield: volumetric titer after 168 h (7 days) in production/overall cultivation time, including inoculum train) over maximum production rate and maximum growth rate (b). The reference clone A (red solid line) and two compared clones, clone B (green dashed line, 7.6% lower and 10.5% higher ) and clone C (orange dotted line, 10% lower and 74% higher ) are placed in the graphs.
Choosing a clonal population showing a lower growth rate but a higher production rate will only be favorable if the productivity is high enough. As stated before, and summarized in Table 8, clones A and B delivered very similar process productivities (1.16 mg L h for clone A and 1.14 mg L h for clone B). The final titers for clone A and B were 539 and 558 mg L , respectively—a negligible difference. When taking 74% higher productivity for C, then a more significant difference is obtained with 876 mg L after 168 h, and an 1.75 mg L h overall process productivity enhancement over A and B is seen.
Table 8.
Results, volumetric titer and overall process productivity (=Space-Time-Yield: volumetric titer after 168 h (7 days) in production/overall cultivation time, including inoculum train) for reference clone A, and two clones to be compared, clone B and clone C. These clones differ in terms of maximum growth rates and maximum production rates, as listed in the corresponding rows.
The response surface models can be used, therefore, to approximate volumetric titer and overall process productivity for a realistic combination of growth rate and production rate, and help with the decision processes. These simulations can be used to determine to what extent growth rate or production rate must differ to cause a difference of at least 5% in the response variables.
4. Conclusions
A model-based approach in combination with statistical methods was applied to study the impacts of the cell-specific growth rate (“growth rate”) and cell-specific production rate (“production rate” or “specific productivity”) on overall product yield using parameters such as time needed for the inoculum train cultures, the volumetric titer during final production phase and the overall process productivity (=Space-Time-Yield: volumetric titer in production/overall cultivation time, including inoculum train). For three theoretical clonal populations an inoculum train protocol was defined, suitable for all of them: Cell line A showed a 7.6% higher maximum growth rate, cell line B a 10.5% higher production rate than cell line A and cell line C a 10% lower maximum growth rate and a 74% higher production rate than cell line A. For all three cell lines, a prediction model of an inoculum train, including predictive uncertainty arising from model parametric uncertainty (due to biological variabilities), has been utilized. For cell line A (higher ) the inoculum train would take 298 h until inoculation of cells into the production bioreactor (1000 L), for B (higher ) it would take 322 h and for C (higher ) 333 h. Cell line A would generate a volumetric titer of approximately 539 mg L after 168 h in the final production vessel, B would result in 558 mg L and C would result in 876 mg L, assuming a batch process.
Moreover, response surface modeling was applied to quantify the effects of both parameters on volumetric titer and overall process productivity at specific points in time in production. Based on the results of a simulation using mathematical process models in combination with statistical methods, decision criteria can be provided that can help to evaluate different clonal cell lines for future manufacturing purposes. This can be seen as a support tool in addition to the characterization of biochemical, biophysical and functionality properties to asses the quality of the final product. Assuming little or no quality differences in the products obtained in cell culture, the growth rate of a clonal cell population has the higher impact (up to three times) on the overall process productivity, and thus, on the output per year, and clones with higher production rates have the potential to generate significantly more volumetric titer in production.
It has not escaped our attention that modern processes in large scale manufacturing are most frequently fed-batch processes with production run times exceeding the herein-discussed 7-day batch processes. These fed-batch processes can increase volumetric titers quite dramatically. Nevertheless, the batch process evaluation is a good first step to obtain quick results. They can be further expanded once a smaller number of clonally derived cell lines have been chosen to also involve fed-batch processes. Moreover, shorter batch processes have certain advantages for some products—for example, reducing the negative impacts of certain losses in production campaigns, such as contaminations or disruptions from instrument failures. Thus, the preferred mode for most efficient use of a given manufacturing facility would be to shorten overall production time phases (in the largest bioreactor) while maximizing growth in inoculum train cultures and to achieve the highest maximal density in the so-called N-1 cultures (i.e., the culture preceding the production vessel). In spite of this, the authors of this article hope to having provided a useful discussion on the complex relationships between different phenotypes of CHO cells, particularly those that have major impacts on overall productivity in manufacturing.
Author Contributions
Conceptualization, T.H.R. and B.F.; methodology, T.H.R. and B.F.; software, T.H.R.; validation, T.H.R.; formal analysis, T.H.R.; investigation, T.H.R., S.M., F.M.W. and B.F.; resources, S.M. and F.M.W.; data curation, T.H.R. and S.M.; writing—original draft preparation, T.H.R.; writing—review and editing, F.M.W. (major), B.F., R.P. and T.H.R.; visualization, T.H.R. and B.F.; supervision, B.F. and F.M.W.; project administration, T.H.R. and B.F.; funding acquisition, B.F. and T.H.R. All authors have read and agreed to the published version of the manuscript.
Funding
This research received no external funding. The article processing charge (APC) was funded partially by Ostwestfalen-Lippe University of Applied Sciences and Arts.
Institutional Review Board Statement
Not applicable.
Informed Consent Statement
Not applicable.
Data Availability Statement
Not applicable.
Acknowledgments
We acknowledge support for the Open Access fees by Ostwestfalen-Lippe University of Applied Sciences and Arts (TH OWL) through the funding program Open Access Publishing.
Conflicts of Interest
The authors declare no conflict of interest.
Abbreviations
The following abbreviations and symbols are used in this manuscript:
| Shape parameter of a gamma distribution (-) | |
| Regression coefficients (impact) | |
| Scale parameter of a gamma distribution (-) | |
| Growth rate (h) | |
| Death rate (h) | |
| Maximum death rate (h) | |
| Minimum death rate (h) | |
| () | (Maximum) empirical cell-specific growth rate (h) |
| Maximum cell-specific growth rate (h) | |
| () | Averaged empirical growth rate of clone A (B) (h) |
| () | (Initial) ammonia concentration (mmol L) |
| () | (Initial) glucose concentration (mmol L) |
| () | (Initial) glutamine concentration (mmol L) |
| () | (Initial) lactate concentration (mmol L) |
| () | (Initial) limiting substrate concentration (mmol L) |
| () | (Initial) volumetric titer (product concentration) (mg L) |
| Volumetric titer (product concentration) at point in time (mg L) | |
| CHO | Chinese Hamster Ovary |
| CI | Confidence interval |
| cv | coefficient of variation |
| Difference in terms of growth rate (h) | |
| Difference in terms of production rate (mg cell h) | |
| Change of volume due to sampling [L h] | |
| i | Running index (-) |
| j | Running index (-) |
| Correction factor for ammonia uptake (-) | |
| Cell lysis constant (h) | |
| Monod kinetic constant for glucose (mmol L) | |
| Monod kinetic constant for glutamine (mmol L) | |
| Monod kinetic constant for limiting substrate (mmol L) | |
| Monod kinetic constant for glucose uptake (mmol L) | |
| Monod kinetic constant for glutamine uptake (mmol L) | |
| Monod kinetic constant for uptake of limiting substrate (mmol L) | |
| MAP | Maximum a posteriori |
| max | Maximum value |
| MCMC | Markov Chain Monte Carlo |
| () | (Maximum) cell-specific ammonia uptake rate (mmol cell h) |
| () | (Maximum) cell-specific glucose uptake rate (mmol cell h) |
| () | (Maximum) cell-specific glutamine uptake rate (mmol cell h) |
| () | (Maximum) cell-specific lactate uptake rate (mmol cell h) |
| () | (Max.) cell-specific uptake rate of limiting substrate (mmol cell h) |
| () | (Maximum) cell-specific production rate (mg cell h) |
| () | (Maximum) empirical cell-specific production rate (mg cell h) |
| , | Average empirical production rate of reference or compared clone |
| R | Coefficient of determination |
| RSM | Response surface models |
| sd | Standard deviation |
| SE | Standard error |
| t | Time (h) |
| Point in time with index i (h) | |
| V | Volume (L) |
| Viability (%) | |
| Total cell density (cells L) | |
| Viable cell density (cells L) | |
| Viable cell density at point in time with index i (cells L) | |
| Y | Arbitrary random variable (-) |
| Kinetic production constant for ammonia (mmol mmol) | |
| Kinetic production constant for lactate (mmol mmol) |
Appendix A
Appendix A.1. Choice of the Prior Distribution
To perform Bayesian parameter estimation, prior distributions have to be quantified to form probability distributions. An appropriate type of distribution has to be chosen in accordance with the available knowledge. In this contribution, a gamma distribution has been chosen to describe the probability distribution of model parameters. This assumption is based on the fact that the considered random variables can only adopt positive values, and furthermore, the gamma distribution is well suited for representing the realistic range based on the available prior knowledge. It is defined by the parameters (shape) and (rate).
To characterize the individual distribution of a variable Y (here or ), the corresponding mean () and variance () are used to compute the distribution parameters rate () and shape (), according to:
Appendix B
Appendix B.1. Supplementary Figures


Figure A1.
Histograms of sampled initial concentrations of viable cells , glucose , glutamine , lactate and ammonia in the first cultivation vessel for upstream simulations.


Figure A2.
Histograms of empirical growth rates for clonal populations clone 1–clone 5 calculated over several subcultivation steps with culture volumes of 5 mL (during a period of 13 weeks).


Figure A3.
Histograms of empirical production rates for clonal populations clone 1–clone 5 calculated over several subcultivation steps with culture volumes of 5 mL (during a period of 13 weeks).

Figure A4.
Response surfaces showing the impacts of maximum growth rate and maximum production rate on volumetric titer and overall process productivity after 50 h of production.

Figure A5.
Response surfaces showing the impacts of maximum growth rate and maximum production rate on volumetric titer and overall process productivity after 100 h of production.

Figure A6.
Response surfaces showing the impacts of maximum growth rate and maximum production rate on volumetric titer and overall process productivity after 168 h (7 days) of production.
Appendix B.2. Supplementary Tables
Table A1.
Modeled variables and model parameters included in the underlying model (symbols, units and descriptions).
Table A1.
Modeled variables and model parameters included in the underlying model (symbols, units and descriptions).
| Variable/Parameter | Unit | Initial Value | Description |
|---|---|---|---|
| cells L | 5.3 | Total cell density | |
| cells L | 5.3 | Viable cell density | |
| mmol L | 5.9 | Glucose concentration | |
| mmol L | 3.3 | Glutamine concentration | |
| mmol L | 0.01 | Lactate concentration | |
| mmol L | 2.6 | Ammonia concentration | |
| mg L | 0 | Volumetric product (antibody) titer | |
| V | L | 0.01 | Volume |
| Model Parameter | Unit | Posterior Estimate/Fixed Value | Description |
| h | 0.042 | Maximum cell-specific growth rate | |
| mmol L | 0.03 | Monod kinetic constant for glucose | |
| mmol L | 0.03 | Monod kinetic constant for glutamine | |
| mmol L | 0.16 (fixed) | Monod kinetic constant for limiting substrate | |
| h | 1.0 | Minimum cell-specific death rate | |
| h | 0.08 | Maximum cell-specific death rate | |
| h | 1.2 | Cell lysis constant | |
| mmol cell h | 9.7 | Maximum cell-specific glucose uptake rate | |
| mmol L | 6.2 | Monod kinetic constant for glucose uptake | |
| mmol cell h | 1.1 | Maximum cell-specific glutamine uptake rate | |
| mmol L | 0.5 | Monod kinetic constant for glutamine uptake | |
| mmol cell h | 1.1 (fixed) | Max. cell-specific uptake rate of limiting substrate | |
| mmol L | 8.15 (fixed) | Monod kinetic constant for uptake of limiting substrate | |
| mmol mmol | 0.35 | Kinetic production constant for lactate | |
| mmol cell h | 1.0 (fixed) | Cell-specific maximum lactate uptake rate | |
| mmol mmol | 1.67 | Kinetic production constant for ammonia | |
| mmol cell h | 4.5 (fixed) | Cell-specific maximum ammonia uptake rate | |
| - | 1.9 (fixed) | Correction factor for ammonia uptake | |
| mg cell h | 3.9 | Cell-specific maximum production rate |
References
- Walsh, G. Biopharmaceutical benchmarks 2018. Nat. Biotechnol. 2018, 36, 1136–1145. [Google Scholar] [CrossRef] [PubMed]
- Wurm, F. CHO Quasispecies—Implications for Manufacturing Processes. Processes 2013, 1, 296. [Google Scholar] [CrossRef]
- Wurm, F.; Wurm, M. Cloning of CHO Cells, Productivity and Genetic Stability—A Discussion. Processes 2017, 5, 20. [Google Scholar] [CrossRef]
- Browne, S.; Al-Rubeai, M. Selection Methods for High-Producing Mammalian Cell Lines. Trends Biotechnol. 2007, 25, 425–432. [Google Scholar] [CrossRef] [PubMed]
- Lakshmanan, M.; Kok, Y.J.; Lee, A.P.; Kyriakopoulos, S.; Lim, H.L.; Teo, G.; Poh, S.L.; Tang, W.Q.; Hong, J.; Tan, A.H.M.; et al. Multi–omics profiling of CHO parental hosts reveals cell line–specific variations in bioprocessing traits. Biotechnol. Bioeng. 2019, 116, 2117–2129. [Google Scholar] [CrossRef] [PubMed]
- Reinhart, D.; Damjanovic, L.; Kaisermayer, C.; Sommeregger, W.; Gili, A.; Gasselhuber, B.; Castan, A.; Mayrhofer, P.; Grünwald-Gruber, C.; Kunert, R. Bioprocessing of Recombinant CHO-K1, CHO-DG44, and CHO-S: CHO Expression Hosts Favor Either mAb Production or Biomass Synthesis. Biotechnol. J. 2019, 14, e1700686. [Google Scholar] [CrossRef] [PubMed]
- Beketova, E.V.; Ibneeva, L.R.; Abdulina, Y.A.; Dergousova, E.A.; Filatov, V.L.; Kozlovsky, S.V.; Shilov, E.S.; Datskevich, P.N.; Rozov, F.N. Optimized dual assay for the transgenes selection and screening in CHO cell line development for recombinant protein production. Biotechnol. Lett. 2019, 41, 929–939. [Google Scholar] [CrossRef] [PubMed]
- Porter, A.J.; Racher, A.J.; Preziosi, R.; Dickson, A.J. Strategies for selecting recombinant CHO cell lines for cGMP manufacturing: Improving the efficiency of cell line generation. Biotechnol. Prog. 2010, 26, 1455–1464. [Google Scholar] [CrossRef] [PubMed]
- Wang, B.; Albanetti, T.; Miro-Quesada, G.; Flack, L.; Li, L.; Klover, J.; Burson, K.; Evans, K.; Ivory, W.; Bowen, M.; et al. High-throughput screening of antibody-expressing CHO clones using an automated shaken deep-well system. Biotechnol. Prog. 2018, 34, 1460–1471. [Google Scholar] [CrossRef]
- Narayanan, H.; Luna, M.F.; von Stosch, M.; Bournazou, M.N.C.; Polotti, G.; Morbidelli, M.; Butté, A.; Sokolov, M. Bioprocessing in the Digital Age—The Role of Process Models. Biotechnol. J. 2019. [Google Scholar] [CrossRef]
- Xie, X.; Schenkendorf, R. Robust Process Design in Pharmaceutical Manufacturing under Batch-to-Batch Variation. Processes 2019, 7, 509. [Google Scholar] [CrossRef]
- Frahm, B. Seed Train Optimization for Cell Culture. In Animal Cell Biotechnology; Pörtner, R., Ed.; Springer protocols, Humana Press: New York, NY, USA, 2014; pp. 355–367. [Google Scholar]
- Hernández Rodríguez, T.; Posch, C.; Schmutzhard, J.; Stettner, J.; Weihs, C.; Pörtner, R.; Frahm, B. Predicting industrial-scale cell culture seed trains-A Bayesian framework for model fitting and parameter estimation, dealing with uncertainty in measurements and model parameters, applied to a nonlinear kinetic cell culture model, using an MCMC method. Biotechnol. Bioeng. 2019, 116, 2944–2959. [Google Scholar] [CrossRef]
- Hernández Rodríguez, T.; Frahm, B. Design, Optimization, and Adaptive Control of Cell Culture Seed Trains. Methods Mol. Biol. 2019, 2095, 251–267. [Google Scholar] [CrossRef]
- Hernández Rodríguez, T.; Frahm, B. Digital Seed Train Twins and Statistical Methods. Adv. Biochem. Eng. Biotechnol. 2020. [Google Scholar] [CrossRef]
- Deppe, S.; Frahm, B.; Hass, V.C.; Hernández Rodríguez, T.; Kuchemüller, K.B.; Möller, J.; Pörtner, R. Estimation of Process Model Parameters. Methods Mol. Biol. (Clifton, NJ) 2019, 2095, 213–234. [Google Scholar] [CrossRef]
- Zhang, X.; Stettler, M.; de Sanctis, D.; Perrone, M.; Parolini, N.; Discacciati, M.; de Jesus, M.; Hacker, D.; Quarteroni, A.; Wurm, F. Use of orbital shaken disposable bioreactors for mammalian cell cultures from the milliliter-scale to the 1,000-liter scale. Adv. Biochem. Eng. Biotechnol. 2009, 115, 33–53. [Google Scholar] [CrossRef]
- R Core Team. R: A Language and Environment for Statistical Computing; R Foundation for Statistical Computing: Vienna, Austria, 2020. [Google Scholar]
- Bartlett, M.S. Properties of sufficiency and statistical tests. Proc. R. Soc. Lond. Ser. A Math. Phys. Sci. 1937, 160, 268–282. [Google Scholar] [CrossRef]
- Brown, M.B.; Forsythe, A.B. The Small Sample Behavior of Some Statistics Which Test the Equality of Several Means. Technometrics 1974, 16, 129–132. [Google Scholar] [CrossRef]
- Benjamini, Y.; Hochberg, Y. Controlling the False Discovery Rate: A Practical and Powerful Approach to Multiple Testing. J. R. Stat. Soc. Ser. B Methodol. 1995, 57, 289–300. [Google Scholar] [CrossRef]
- Kern, S.; Platas-Barradas, O.; Pörtner, R.; Frahm, B. Model-based strategy for cell culture seed train layout verified at lab scale. Cytotechnology 2016, 68, 1019–1032. [Google Scholar] [CrossRef]
- Möller, J.; Hernández Rodríguez, T.; Müller, J.; Arndt, L.; Kuchemüller, K.B.; Frahm, B.; Eibl, R.; Eibl, D.; Pörtner, R. Model uncertainty-based evaluation of process strategies during scale-up of biopharmaceutical processes. Comput. Chem. Eng. 2019, 106693. [Google Scholar] [CrossRef]
- MATLAB. Version 9.9.0 (R2020b); The MathWorks Inc.: Natick, MA, USA, 2010. [Google Scholar]
- Kim, Y.J.; Han, S.K.; Yoon, S.; Kim, C.W. Rich production media as a platform for CHO cell line development. AMB Express 2020, 10, 93. [Google Scholar] [CrossRef]
- Böhl, O.J.; Schellenberg, J.; Bahnemann, J.; Hitzmann, B.; Scheper, T.; Solle, D. Implementation of QbD strategies in the inoculum expansion of a mAb production process. Eng. Life Sci. 2020, 27, 9. [Google Scholar] [CrossRef]
Publisher’s Note: MDPI stays neutral with regard to jurisdictional claims in published maps and institutional affiliations. |
© 2021 by the authors. Licensee MDPI, Basel, Switzerland. This article is an open access article distributed under the terms and conditions of the Creative Commons Attribution (CC BY) license (https://creativecommons.org/licenses/by/4.0/).