Abstract
Process safety helps prevent the unexpected and unplanned release of flammable and toxic chemicals, leading to poisonous gas clouds, fires, and explosions. Vapor cloud explosions (VCEs) are among the most severe hazards to humans and the environment in process facilities. Therefore, process safety demands to use best and reliable techniques to model VCEs in process industries and storage tanks of flammable chemicals. In this regard, the Computational Fluid Dynamics (CFD) models are more appropriate, as these models provide three-dimensional (3D) modeling of all sequences of events in an accident. In this study, CFD is used to model VCE in two industrial accidents: the Amuay refinery disaster (happened in 2012) and the Indian Oil Corporation’s (IOC) Jaipur terminal (2009). This work studies 3D CFD modeling of flammable cloud explosion in the real-time configuration for both accidents. FLACS (FLame ACceleration Simulator), a CFD software, is used to simulate the loss of hydrocarbon containment, cloud formation, and explosion in both industrial case studies. The ignition locations and grid sizes were varied to analyze their influence on explosion overpressure, temperature, vapor velocity, and fuel mass. This work also investigated the effect of geometry complexity on the explosion. Results showed that, as opposed to the coarse grid, the fine grid provides more precision in the analysis. The study also reveals an explosion overpressure of the order 4–15 bar (g) for the given case studies. This study’s results can help perform a qualitative and quantitative risk assessment of the Amuay refinery accident and Jaipur fire. The simulation of different scenarios can help develop and improve safety guidelines to mitigate similar accidents.
1. Introduction
Fuels are a significant energy source for power generation and transportation. In general, fuels such as petrol, natural gas, diesel, and petroleum gas have high demand. The need for energy is pushing every country to develop refinement facilities for crude oil processing and refining. The proliferation of processing industries has increased the potential hazards to the safety of people and process facilities [1]. Today, process safety intermingles in the design, production, and maintenance of every processing facility. However, despite all safety guidelines and measures, accidents are happening. The magnitude of these accidents ranges from minor damage to equipment or personnel to catastrophic accidents, which cause losses of human lives and damage properties worth billions of dollars [2].
In the oil and gas process facility, the risk can be due to the rapid and unexpected release of flammable process chemicals, which can cause toxic clouds and explosions. Even when the leaks are small, they lead to pollution and adverse health effects. Although hazardous conditions vary from facility to facility, the magnitude of damage depends upon the quantity and the type of released material. Process facilities such as refineries and tank farms, which hold large amounts of fuels, have an enormous potential for destruction [3]. One of the most devastating and destructive events that can take place in an oil and gas facility is a vapor cloud explosion (VCE). The VCE happens due to the ignition of a flammable cloud. The cloud is a mixture of gas, vapor, aerosol, mist, and it forms due to the loss of a certain quantity of combustible gas or vaporizing liquid [4]. The flame speed in VCE is very high, which creates considerable overpressure. Consequently, the overpressure causes bulk damage to people, buildings, and property in the vicinity of the explosion.
Moreover, due to its substantial adverse impact, a VCE can initiate a domino effect. A VCE can trigger secondary, tertiary, or even more VCEs in a domino effect called the cascading effect of VCE [5]. A better understanding of the overpressure propagation in a VCE can help develop risk mitigation techniques for minimizing damages due to VCE. There are five conditions for VCE to occur. Those are: the release of flammable material; the ignition source’s location with high energy; the size of the vapor cloud formed; flow with turbulence condition for accelerating the flame front; and the cloud’s obstacles [6].
There had been numerous accidents due to VCE, such as the Buncefield accident [7], the Flixborough disaster [8], the Jaipur oil depot fire [9], and the Amuay refinery accident [10]. The scope of this study is the accidents that occurred in the Jaipur oil depot and the Amuay refinery. In this study, different parameters that affect VCE are examined. Considering VCEs accidents in two industries, an explosion model using computational fluid dynamics (CFD) is developed. The model considers the complex geometries of both industrial cases.
Literature Review
One of the accidents studied in this paper is the Amuay refinery accident, in 2012, near Punto Fijo, Venezuela. The other accident is the fire in the Jaipur oil depot in 2009 in Jaipur, India. There have been several studies conducted to model such accidents. Few researchers performed the numerical simulation of the Amuay refinery accident using CFD [11]. Their research developed simulation scenarios based on different atmospheric conditions and provided a comparison among them. The results of their study showed that wind speed played an essential role in analyzing cloud behavior. The research helped to understand dense gas dispersion in the Amuay refinery accident. In their study, the location of the ignition source was a nearby street.
In another study, the CFD model was developed to study cloud dispersion and the explosion of gas release in storage terminals of an oil and gas depot [12]. The study assessed the impact of different flow rates, duration of released gas, and surrounding conditions on vapor cloud dimensions, such as diameter, explosive strength, and cloud height. The study results revealed that obstacles in a storage facility of oil and gas affect the vapor cloud’s shape and size. In case 2 of the study [12], the control room, pump house, building, and piping system were simulated. The study showed that it took 1084 s for the cloud to cover the whole plant for 50 kg/s leakages of gasoline from a 1 m2 origin. The study also showed that the vapor cloud diameter in the Jaipur oil deport fire was between 800 m to 900 m. In another study, research was conducted to analyze the influence of volume blockage ratio (VBR) on the Jaipur fire explosion [13]. The CFD was used to construct the Jaipur fire accident, and the leakage of fuel vapor from a valve connected to the piping system was studied at different flow conditions. The study showed that under calm conditions, the cloud traveled 600–900 m, and it took a simulation time of 2–3 h.
The studies presented in the literature review section helped propose better process design facilities with more robust production and maintenance plans. However, such studies have not considered the variations in fuel type (light versus heavy fuel), within the site geometry in explosion modeling. Fuel type plays an essential role in defining the intensity of the explosion. Moreover, previous studies consider limited accident scenarios. The site geometry of the accident and the location of an ignition source are essential aspects that need to be considered in computational-based studies. For example, the heat flux distributions of fire and the flame behavior are highly dependent upon the ignition source’s location, as highlighted in the literature [14]. Hence, an ignition source site plays a vital role in assessing the overpressure in a VCE. Therefore, it should be included in the CFD modeling. The present work demonstrates the applications of CFD simulation to simulate Amuay refinery and Jaipur fire accidents. This study aims to predict various characteristics of VCE in both industrial accidents. To the best of the authors’ investigations, there has been no study conducted on the comparative behavior of VCEs in both accidents, and hence is the objective of current work. This work also discusses various technical aspects of both accidents to understand gas explosions better and investigates factors that affect the CFD model. In these two case studies, the variations in ignition locations, temperature, pressure, vapor velocity, and the mass of combustible fuels are also studied. This work also identifies proper grid size for higher precision and captures the effect of gas composition and geometry complexity using different ignition locations in two accidents. A methodological framework of this study is shown in Figure 1. As shown in Figure 1, as a preliminary step of the study, different scenarios are developed in step 1 for both accidents under investigation. In step 2, input information is retrieved. This information includes the meteorological conditions and details on the release of hydrocarbon for both accidents. Step 3 is aimed to define the domain and geometry for the simulation of both accidents. Computational grid and initial conditions are described in steps 4 and 5, respectively, while in the last step, simulations are performed, and results are analyzed. Further details of the methodology are presented in Section 3 of this paper.
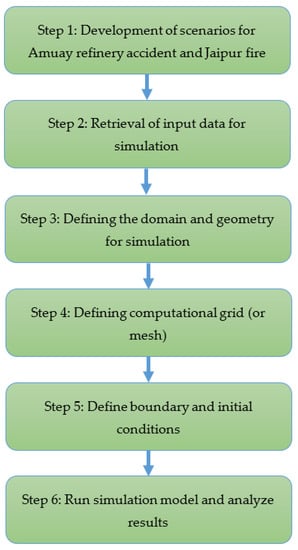
Figure 1.
A glimpse of the methodological framework for this study.
This paper consists of two parts. The first part provides a conceptual background of accidents in the Amuay refinery and Jaipur fire, and the second part describes the methodological framework of the study.
2. Background
2.1. Vapour Cloud Explosion (VCE)
In general, the combustion of a large amount of flammable vapor cloud involving more than one tonne of combustible fuel causes an explosion. As a result of quick energy release, the explosion causes to have a magnificent overpressure. Consequently, more severe fatalities occur due to the minimal time to revert to protective action [15]. The release of combustible materials in the atmosphere results in the formation of a vapor cloud. If the propagating flammable elements find a source of ignition, it results in a VCE. The VCE demands analytical, computational (with CFD tool), and experimental investigations to mitigate future accidents. The most likely outcome of a flammable fluid discharge over some particular time is to form a flammable vapor cloud. The failure of an under-pressure vessel, pipe, or other facilities can lead to instant dispersion of flammable vapors. The general event tree for cloud vapor explosion is presented in Figure 2.
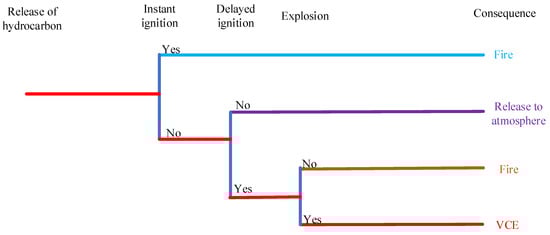
Figure 2.
An event tree of VCE.
2.2. Detonation and Deflagration
The overpressure produced due to the fuel mixture’s fast combustion spreads through the fuel mixture as a shock wave that causes to ignite the fuel mixture. The shock wave and flame front move together at supersonic velocity. Due to this characteristic, detonation is considered more destructive as compared to deflagration. In deflagration, there is the subsonic velocity (<100 m/s) of flame propagation and a modest overpressure (<7.3 psi). However, in detonation, the flame propagation velocity is supersonic (up to 2000 m/s), and there is high overpressure (290 psi). Under certain conditions, deflagration combustion is quickly transformed into a detonation explosion. The phenomenon is called deflagration to detonation transition (DDT). It has been revealed that the DDT phenomenon occurred in the Amuay refinery accident and Jaipur fire [16]. There are strong reasons behind the existence of DDT in these industrial VCEs. For example, there was a high flame speed (closer to the speed of sound) in both accidents. Under such circumstances, there is a high possibility that deflagration would have been transitioned to detonation [17]. To reduce the likelihood of DDT, researchers have pointed to having an obstacle-free path and avoiding congestion such as residential buildings in a fire radiation radius [10]. These research findings are being modeled in this study using the geometry of the accidents.
2.3. Affecting Parameters
Different parameters analyzed in this study are discussed below.
2.3.1. Geometry Complexity
One of the primary conditions in which the subsonic transforms into supersonic flame speed is the geometry complexity (obstacles and partial confinement in the flame path). The geometry of an accident scene can significantly affect the behavior of the explosion, and the gas explosion concentration can vigorously differ according to the flame’s velocity. Changes in boundary conditions can result in a remarkable change within the propagation of gas. The obstacle in the path of the explosion propagation has a considerable impact on increasing the gas velocity. The location of the obstruction profoundly influences the propagation of the flame. Research shows that a faster propagation of the flame is noticed when the obstacles are closer to the ignition source [18].
2.3.2. Ignition Source
According to a study, some of the significant sources of accidents in process industries are listed below [19]:
- flames being exposed to the environment, such as flares;
- burning substances;
- solid surfaces have a high temperature;
- electrical sparks beside similar other means of discharge;
- confinement having an adiabatic situation.
The minimum ignition temperature of the fuel-air mixture is highly critical. Furthermore, the ratio of hydrocarbon mixtures being investigated at their various temperatures of the mixture has a crucial role in the explosion modeling [20].
2.3.3. Wind Effect
A study investigating the accidents due to the VCEs shows that the wind speed was low in more than 70% of accidents [21]. A low rate of wind speed causes the leakage of fuel by gravity. The results advise that nil or low wind speed conditions can affect the entire explosion risk in many oil and gas plants. The weather conditions are occasionally rare than low wind velocity. However, they are associated with gigantic clouds with a much higher risk of ignition.
Moreover, wind conditions with low speed allow cloud formation through the low release rates of vapor. This condition has the potential to cause accidents as there is a high likelihood of continuous release. Hence, the modeling of the risk of VCE in petrochemical industries needs to include wind conditions. In a review study on VCEs, researchers categorized various industrial accidents based on wind conditions [21]. In their study, both accidents (Jaipur and Amuay) were classified as those which occurred in nil/low wind conditions. The study also identified vapor release rates of 67 kg/s and 3 kg/s for Amuay and Jaipur accidents, respectively. The wind data in their study was based on meteorological records and the shape of the cloud formed. A low wind speed was defined as the wind speed that spreads the vapor cloud to an equal extent and in all fuel source directions, and this definition is adopted in the current study.
2.4. The Explosion at Punto Fijo Refinery, Venezuela
An explosion occurred at Amuay (Punto Fijo) refinery, the second-largest refinery in the world, on 25 August 2012, around 01:11 a.m. (GMT) in the northwest of Venezuela. A plant layout of the Amuay refinery is shown in Figure 3. The shock wave released by the explosion affected the neighboring residential area. There was significant damage to people and property. More than 50 people lost their lives, over 100 people were seriously injured, several light injuries were reported, and more than 1600 houses were damaged. Residents of over 200 homes were evacuated to safer places. The damage in monetary terms was more than one billion U.S. dollars.
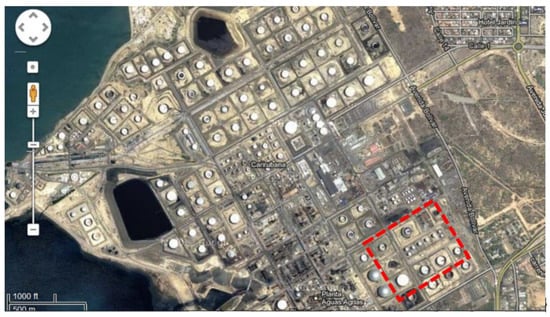
Figure 3.
An Overview and layout of the Amuay Refinery located in Venezuela, Falcón State, Carirubana city. An approximate location of the disaster zone is highlighted in a red box. Reproduced with permission from Kirti Bhushan Mishra, Klaus-Dieter Wehrstedt, Holger Krebs, Fuel Processing Technology; published by Elsevier, 2014, with permission from Elsevier.
Amuay incident, a layout shown in Figure 4, began with a leak of high vapor pressure substances such as alkenes, liquefied natural gas (LNG), or liquid butane (or propane) and formed a denser flammable vapor cloud in the atmosphere, as shown in Figure 4. The dispersed cloud stuck near the ground and created fog under low wind conditions. A study reported the spread of dispersed fuel to a radius of 0.6 km, due to low wind speed [10]. The accumulation of the dispersed vapor cloud proved to be catastrophic when the cloud caught an ignition source. Researchers believed that the ignition source was most probably not inside the Amuay refinery but passing by vehicle [22]. The overpressure generated, as the result of the explosion, was of high magnitude. It crushed steel fences and cars, blown the refinery structure, and bent the infrastructure and vehicles. Based on the media sources, various initiating events led to make this accident a catastrophic one. Those events were the negligence towards the regular maintenance and ignoring the leak and associated smells in the plant before the incident [10].
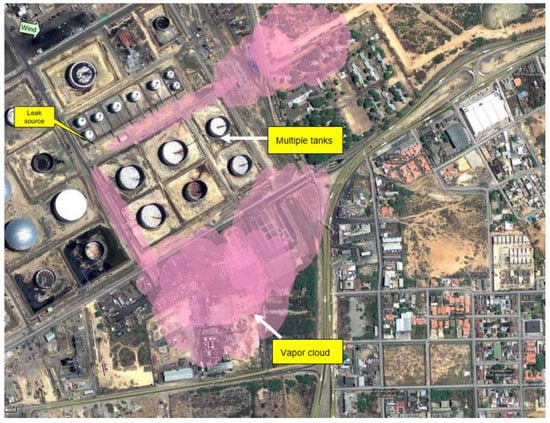
Figure 4.
A satellite map of vapor cloud formation in Amuay refinery in Venezuela, Falcón State, Carirubana city, was reproduced with permission from Kirti Bhushan Mishra, Klaus-Dieter Wehrstedt, Holger Krebs, Fuel Processing Technology; published by Elsevier, 2014, with permission from Elsevier.
An installed component’s functional failure is the most frequent hazard in the petrochemical industries, including valves, pumps, and piping. These operational failures occur due to an improper maintenance schedule, corrosion, and inadequate safety knowledge practices. Some witnesses in the refinery reported seeing a liquefied gaseous fuel leakage [22]. Other studies reported initiating events as malfunctioning of the valve, pumping system, and piping connected to the olefin tanks [23]. In summary, it was believed that the Amuay incident occurred due to the failure of a valve in piping. Venezuela’s socialist government reported that the sabotage and manipulation of several bolts from a gas pump caused the rupture, which initiated a gas leakage in the flange of a pump. Subsequently, a quick alkene leak occurred due to a 7.4 cm opening in a pipeline [24].
Dispersion of high vapor pressure olefin fuel started to accumulate a combustible cloud in the atmosphere after a valve’s failure, as shown in Figure 5. This cloud of olefin stuck to the ground due to its higher density than air. It formed white irregular fog with no particular smell unless it contained some additives like hydrogen sulfide. Due to slow wind speed, the dispersed fuel started to accumulate and covered a radius of nearly 0.6 km [10]. A passing-by vehicle was recognized as the most likely source of ignition in the Amuay accident. The blast generated an overpressure in the range of 150 kPa to 2000 kPa, which proved to be destructive for property and human lives [10].
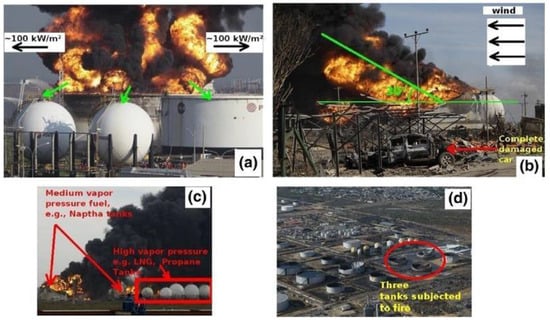
Figure 5.
(a) Tank fire, (b) wind pushing the fire to other tanks, (c) fire affecting olefin tanks, (d) site showing three tanks subjected to fire after the accident, reproduced with permission from Kirti Bhushan Mishra, Klaus-Dieter Wehrstedt, Holger Krebs. Fuel Processing Technology; published by Elsevier, 2014, with permission from Elsevier.
2.5. Explosion at Indian Oil Corporation’s (IOC) Jaipur Terminal, India
The accident shown in Figure 6 occurred on 29 October 2009, in a giant tank at the Indian Oil Corporation oil depot, in Jaipur India, that held 8000 kiloliters of petrol. The accident’s primary reason was gasoline leakage from a valve connected to the pipeline [25]. The fire erupted in multiple tanks and continued for over a week [26]. The explosion created a massive fireball that covered the entire installations and started a fire in the nearby fuel tanks. The investigating team estimated that there was an uncontrolled leakage for 90 min. Eighty-one tonnes of gasoline might have vaporized. The vapor cloud eventually exploded with an intensity equivalent to 38 tonnes of TNT explosives. The management decided to let the petroleum products burnt to avoid another potential accident due to fire [16]. The leaking gasoline created a vapor cloud that exploded and started a fire in the storage tanks. This accident claimed twelve lives, and several people were injured and lost more than Rs. 2.8 billion (Indian rupees). The investigating team found that the ignition source was flameproof electrical equipment or firing up of an internal combustion engine in the nearby areas. The fire in the storage tanks spread to various other tanks, setting all the 60,000 kiloliters of fuel on the fire. The fire caused catastrophic damage in a radius of nearly 2 km. It was observed that the vapor cloud engulfed the entire facility, including the plant, truck offloading area, and parts of the pipeline terminal. Gasoline concentration in the area was 7.8 percent to 1.2 percent, within the gasoline flammability range [13].
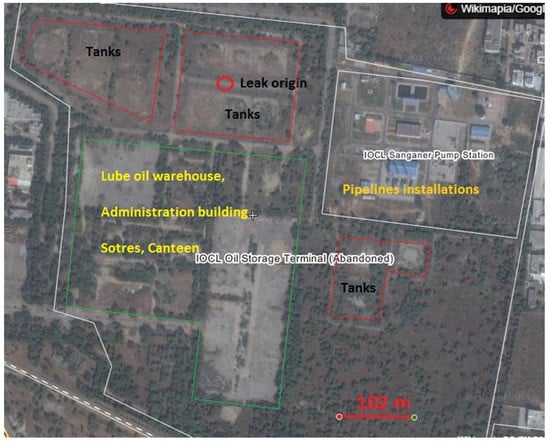
Figure 6.
Satellite map of Jaipur plant indicating the location of leak origin and the top view of the tanks. The area on the map is India, Rajasthan State, Jaipur city. Reproduced with permission from Kirti Bhushan Mishra, Journal of Loss Prevention in the Process Industries; published by Elsevier, 2018, with permission from Elsevier.
Below is the summary of the sequence of events [27];
- loss of primary gasoline containment;
- escape of gasoline from secondary containment;
- the operating staff was ordained useless;
- lack of tools to tackle the situation;
- flaws in the engineering design;
- no team available for operating from the site and in the case of essential areas.
The flammable cloud was formed because a massive quantity of gasoline escaped from containment and then vaporized. Various parameters contributed to the explosion: the explosive properties; weather conditions; and ignition source location. The energy emitted in the explosion created a blast wave that changed the nature of the blast. In a blast wave, the pressure increases instantaneously and drops very fast to return to atmospheric pressure. In this case, the fundamental reason was the complete absence of the specific site operating procedures and leakage mitigation equipment [28].
Computational Fluid Dynamics (CFD) techniques are being progressively applied to better understand fire and explosion behaviors [29]. In CFD, mathematics is applied through algorithms and numerical techniques to understand fluid flow problems with or without chemical reactions [30]. Although analytical methods provide great usefulness in studying various cloud explosions parameters, a CFD concept is broadly utilized for multiple applications such as VCE [29].
CFD allows the modeling of a detailed site geometry of the VCE facility. Moreover, CFD enables modification of wind conditions, as per case studies, in large-scale modeling experiments [31]. However, there is no experimental data that could help study the continuous release of flammable material in calm wind conditions in which vapor transport is caused by gravity. A few studies have focused on using CFD to analyze VCE at the Buncefield oil depot accident in low wind conditions [32,33]. The only quantitative data used in these studies was vapor front progress; however, the movement of the vapor front does not affect the cloud structure itself. Another challenge is to model CFD when there is a long-range transport of cloud.
Moreover, the selection of grid size in CFD affects the precision of the results. To fill this research gap, this paper models Amuay refinery and Jaipur fire accidents using CFD. This work uses the actual fuel compositions at the time of accidents. Both accidents are reconstructed in this simulation study, and analyses are performed.
3. Modeling Methodology
The CFD models are the most significant models to perform 3D (3 Dimensional) modeling and allow using the equations that govern fluid motion for a vast range of complex scenarios [12]. FLACS (FLame ACceleration Simulator), developed by GexCon AS (https://www.gexcon.com/, accessed on 9 May 2021), is a frequently utilized CFD tool in chemical and petroleum industries for explosion modeling in process safety and risk analysis. The FLACS implements and solves the compressible conservation equations (such as momentum, mass, species, and enthalpy) on a 3D Cartesian grid using finite volume [17]. Among CFD software for explosion modeling, FLACS is a proper research tool for investigating explosion details through various influencing factors in a gas explosion, such as gas cloud size and ignition position [34]. Moreover, FLACS can also help analyze other affecting parameters, including flow dispersion, shock waves, and the cloud’s dimensions. Due to such features, FLACS v10.4 was used to model and simulate the Amuay refinery accident and Jaipur fire in this study.
3.1. Input Data for Simulation
In this simulation study, 3D (3 Dimensional) models of the Amuay refinery and Jaipur fire accidents were built. The momentum and mass equations for both accidents and numerical models were adopted from the literature [35]. The general specification of the geometry within different x, y, and z directions was 25.6 m, 8 m, and 8 m, respectively. Two fuel compositions were studied in the simulation. The first fuel was flammable octane, i.e., the fuel composition closer to that of in Jaipur oil depot fire, compared to flammable natural gas composition (i.e., CH4 91.3%; C2H6 7%, C3H8 1.3%) as the second fuel, i.e., the fuel composition closer to that of in Amuay refinery explosion. Initial and boundary conditions were defined as 2 m/s for initial wind speed. The stability in the atmospheric conditions was achieved by setting relative turbulence to zero. This condition helped to achieve calm/zero wind conditions, as discussed earlier.
In both studies, simulations were performed with coarse and fine mesh in which the grid numbers and the graphical presentation of the grids developed are shown in Table 1 and Figure 7, respectively.

Table 1.
The number of grids in different dimensions for both coarse and fine meshing.
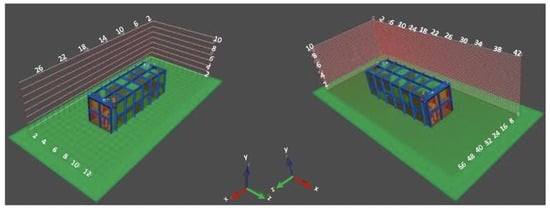
Figure 7.
Geometry with coarse grid (left) and fin grid (right).
Two different grid sizing, i.e., coarse and fine grids, were used for simulation to assess the results’ precision based on the grid sizing parameter.
The explosions for fuel compositions in various aspects, such as the released pressure, temperature, fluid velocity, and fuel level, were evaluated. Besides, the ignition location was also assessed in the simulations since it was another profoundly influencing parameter for both accidents, as discussed previously. The effect of geometry complexity on the explosion was analyzed by considering two ignition source locations, i.e., case 1 (18 m, 5 m, 5 m) and case 2 (13 m, 5 m, 5 m). FLACS has already been validated as a valuable tool for developing CFD code for various gas dispersion cases [36,37] and, therefore, such validation is not repeated in this study.
4. Results and Discussion
The highest achieved pressures, using both fuels, during the explosion with coarse and fine mesh calculations are summarized in Table 2.
Table 2.
Results of simulation with coarse and fine meshing.
Table 2 indicates that grid sizing is a critical parameter that significantly influences the precision of the analysis. In Table 2, Case 1 and Case 2 represent the different locations of the ignition source in modeling, as discussed in Section 3.1 of this paper. In Table 2, “Case 1 Octane” and “Case 2 Octane” both indicate the use of octane as fuel, while “Case 1 Natural gas” and “Case 2 Natural gas” both show the use of natural gas as fuel in respective case studies. Results suggest that higher-pressure values are observed for all four cases in Table 2 when a grid with fine mesh size is used. This analysis of grid sizing shows that, as opposed to coarse mesh, the fine mesh size results in higher accuracy. The variations of pressure, fluid velocity, and fuel consumed in the explosion over time for both cases are shown in Figure 8. In Figure 8, the peak of pressure after the explosion is presented with other parameters such as fuel level and fluid velocity for octane explosion in both cases of ignition locations by implementing fine grid calculations. The results show that in case 1, the pressure starts to increase from 0.37 s and reaches a maximum pressure of 15 bar (g) in 0.42 s. The peak pressure drops to 0 bar (g) at 0.49 s. However, case 2 indicates that pressure starts to increase from 0.34 s and gains a peek at 5.24 bar (g) at 0.42 s. The pressure drops to 0 bar (g) at 0.49 s. These results show that the ignition location case1 resulted in a much higher pressure peak. This trend is due to the high-pressure explosion (i.e., over 14 bar (g)) in comparison with the lower pressure peak for case 2 ignition location (i.e., over 5 bar (g)). The natural gas explosion results are presented in Figure 9 for both ignition sites with fine grid calculations.
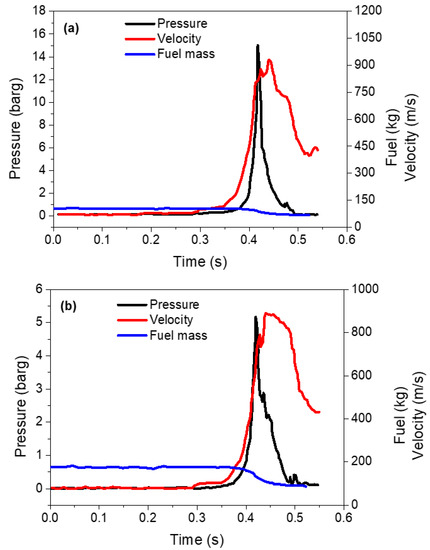
Figure 8.
(a) Pressure, fluid velocity, and fuel graph due to the explosion with octane, Case 1; (b) pressure, fluid velocity, and fuel graph due to the explosion with octane, Case2.
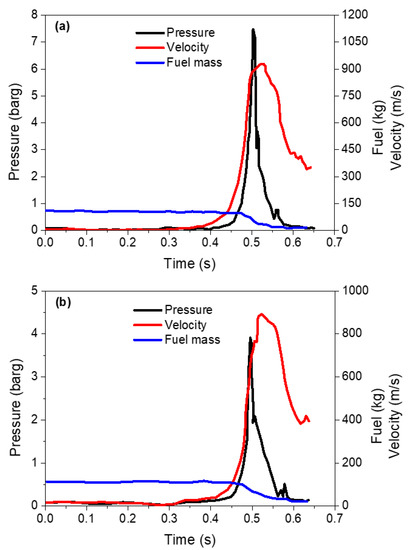
Figure 9.
(a) Pressure, fluid velocity, and fuel graph due to the explosion with natural gas, Case1; (b) Pressure, fluid velocity, and fuel graph due to the explosion with natural gas, Case2.
The pressure diagram of the natural gas explosion in Figure 9 shows that the ignition location in case1 resulted in a higher pressure peak than the case 2 ignition location in the natural gas explosion. However, the natural gas explosion resulted in noticeable lower pressure peaks compared to the octane fuel explosion. The fluid velocity results in Figure 8 indicate that the maximum fluid velocities in cases 1 and 2 are 1038 m/s and 902 m/s, respectively. This result suggests a higher fluid velocity in case 1. Using natural gas as fuel, results of velocity in Figure 9 show a velocity of 925 m/s and 905 m/s in cases 1 and 2, respectively. It reveals that both fuels, natural gas and octane, have higher fuel velocities in case 1. The fluid velocity values increased for fuel explosions with values higher than 900 m/s and dropped with less slope after the peak than the sudden drop of pressure graph. The fuel level for all bursts dropped noticeably after the explosion and maintained constant at approximately 0 kg value.
The distribution profiles of pressure and temperature for the octane case 1 explosion are presented in Figure 10. It reveals that the highest pressure is created at the explosion shock wave, while the temperature is not at its highest level at the same point. It also shows that the pressure is not released significantly out of the explosion confined geometry.
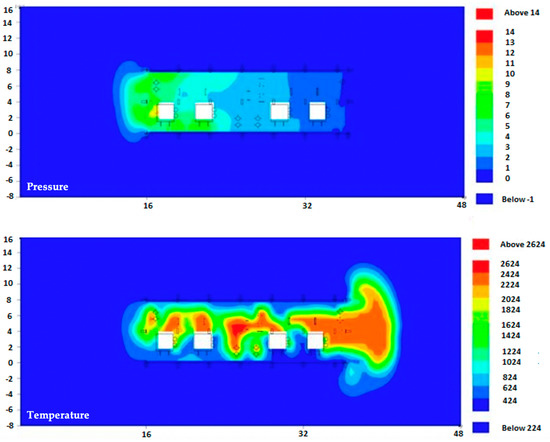
Figure 10.
Pressure and temperature distribution profiles Case 1 octane explosion.
After observing the highest pressure in the confined geometry, the pressure distributes significantly out of the confinement. The results of the pressure and temperature distribution profiles for case 2 are shown in Figure 11. It shows that the temperature inside and outside the confinement started to enhance remarkably.
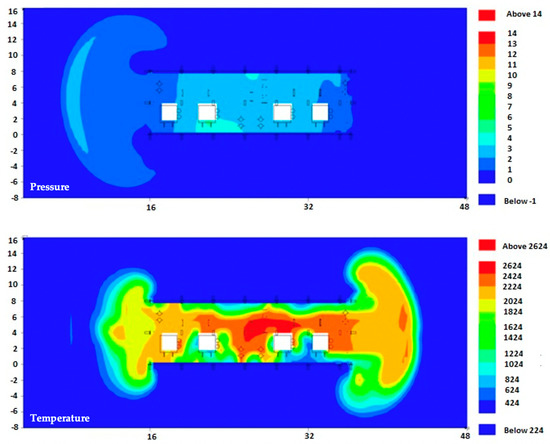
Figure 11.
Pressure and temperature distribution profiles Case 2 octane explosion.
The temperature and pressure distribution profiles of cases 1 and 2 for the natural gas explosion are shown in Figure 12 and Figure 13, respectively.
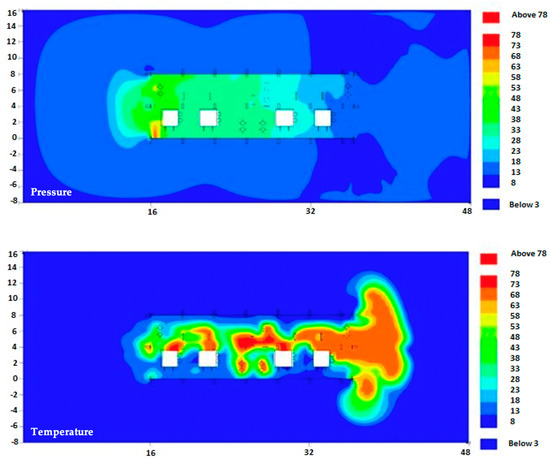
Figure 12.
Pressure and temperature distribution profiles for Case 1 for a natural gas explosion.
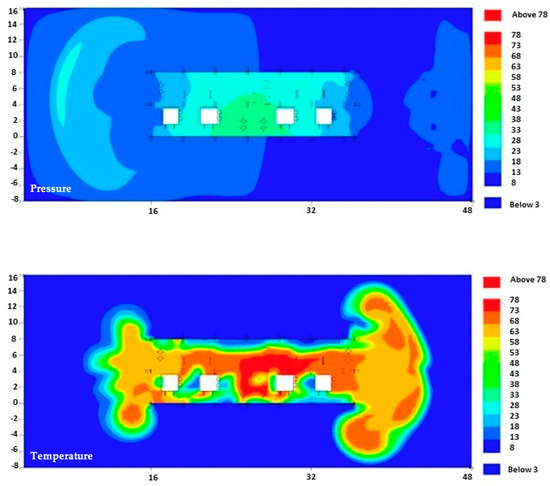
Figure 13.
Pressure and temperature distribution profiles for Case 2 for a natural gas explosion.
Results in Figure 12 show that the distribution profiles for pressure and temperature of natural gas explosion follow the same trend as octane explosion in case 1, but with lower intensities of both variables. It shows that the VCE due to natural gas will have lower destruction compared to using octane fuel.
Results in Figure 13 reveal that both temperature and pressure profiles in case 2 of using natural gas are slightly different than shown in Figure 11. As shown in Figure 13, there is a significant variation in pressure once the cloud explosion reaches outside the confinement. The temperature profile shows the same behavior in Figure 13.
CFD simulation helped to understand better fire and explosion modeling for the Amuay refinery accident and Jaipur fire; however, there are still critical criteria that challenge applying these types of software. As an illustration, simulation time profoundly affects the performance of the simulation studies. A fast simulation speeds up the analysis process and enables us to study different scenarios, as presented in this study. Results show that the analysis’s precision significantly reduces due to higher grid sizing, which results in faster simulations.
As shown in this study, complex geometries and processes can make the simulation time, for precise calculations, even longer. Such delay can only be avoided with the use of advanced computers and a higher software capability. A high level of precision is an essential consideration that cannot be avoided in safety-related applications. In this study, simulation in computer utilized the full capacity of one central processing unit (CPU) core. Therefore, the simulation’s simultaneous operation should be decided based on the availability of higher computer capacity. If this is not followed consistently, the simulation time length will increase significantly, which will affect the study. In this study’s simulations, one critical parameter is the ignition location in the simulated complex geometry. This study reveals differences in the values of pressure and temperature by changing the ignition location in simulations. It indicates the effect of geometry and the presence of different obstacles in the geometries under study. As shown in Figure 8 and Figure 9, the overpressure changes approximately two times more than when the ignition location was moved to a more constricted location inside the plant. These results are consistent with the literature. A study identified that the increased confinement and congestion caused the increase in burning rate and pressure buildup in the Jaipur fire accident [16]. The composition of the exploding gas also has a noticeable effect on the impact of the explosion. This study demonstrates that octane fuel has much higher released impacts than natural gas. In the constricted ignition location, the octane fuel creates an overpressure of more than 15 bar, whereas methane creates a 7.5 bar pressure. In both cases, the rate of decline in fluid velocity is lesser than the drop-in pressure. The overpressure results in this study are consistent with the values reported in the previous studies. Research work on the Amuay refinery reported the range of overpressure between 1.5 bar and 20 bar [10]. The consistencies of results in this study with previously conducted research indicate that the simulation results of this study are reliable. As shown in this study, the overpressure builds up rapidly after the fuel ignition, reaching its peak value instantaneously. Results show that the highest temperature is achieved after the pressure drops following the buildup to the maximum. The analysis indicates that geometry complexity is essential in CFD modeling due to changes in the ignition locations and released temperature and pressure. The size of the extricated cloud, compared to the confined geometry at the point of the explosion, can significantly differentiate the resulted impact scenarios.
On the other hand, the wind speed and the direction of the wind also affect the results. The released temperature is also a critical evaluating factor in this study. A significant temperature rise for both explosion compositions is noticed after achieving the highest released pressure due to the explosions’ shock wave. In a process industry, hazard reduction is achieved through robust process design. Future work is recommended to include secondary containment, such as dikes surrounding the leaking tank, in the CFD model. This model can help assess temperature and overpressure variations in reducing and preventing hazards from the tanks. A risk-based economic analysis [38,39,40] is also recommended to estimate the financial loss due to accidents in process industries.
5. Conclusions
Research and development are critical to ensure a high safety level at industrial plants. There will always be hazardous conditions associated with process industries. However, hazard identification and risk assessment can help to maintain the sustainability and reliability of production processes. The VCEs are among the most dangerous accidents in process industries due to a combination of fire elements such as fuel, oxygen, and an ignition source. Therefore, there is a need to adopt preventive measures to avoid disasters of fires and explosions. A CFD simulation tool, FLACS, used in this study, provides valuable insight into understanding cloud explosion phenomena in the Amuay refinery and Jaipur oil depot fire. This study shows that precision in geometrical shapes is vital in understanding VCE, though such simulation requires higher simulation time. This work conducts detailed analyses of the parameters influencing an explosion. This information can improve facilities’ design in mitigating leaks and understand worst-case scenario events, leading to catastrophic accidents. The study concludes that the geometrical complexity and composition of the flammable fuels are amongst the critical influencing factors in modeling VCE. As a future direction, the CFD model developed in this study could be integrated with the layout of surrounding buildings of the accident site. This modified model would help to simulate scenarios in terms of the layer of protection analysis (LOPA).
Author Contributions
Conceptualization, Z.S., M.K.K., A.R., F.S.M., K.V. and R.K.; Data curation, M.K.K.; Formal analysis, A.R., F.S.M., K.V. and R.K.; Investigation, Z.S.; Methodology, Z.S., A.R., F.S.M., K.V. and R.K.; Project administration, Z.S. and M.K.K.; Software, Z.S., M.K.K., A.R., F.S.M., K.V. and R.K.; Writing—original draft, A.R., F.S.M., K.V., and R.K.; Writing—review & editing, Z.S. and M.K.K. All authors have read and agreed to the published version of the manuscript.
Funding
This research received no external funding.
Institutional Review Board Statement
Not applicable.
Informed Consent Statement
Not applicable.
Data Availability Statement
Not applicable.
Conflicts of Interest
The authors declare no conflict of interest.
References
- Woodward, J.L.; Pitbaldo, R. LNG Risk-Based Safety: Modeling and Consequence Analysis; John Wiley & Sons: Hoboken, NJ, USA, 2010. [Google Scholar]
- King, R.; Hirst, R. King’s Safety in the Process Industries; Butterworth-Heinemann: Oxford, UK, 1998. [Google Scholar]
- Tian, D.; Zhao, C.; Wang, B.; Zhou, M. A MEMCIF-IN method for safety risk assessment in oil and gas industry based on interval numbers and risk attitudes. Eng. Appl. Artif. Intell. 2019, 85, 269–283. [Google Scholar] [CrossRef]
- Casal, J. Evaluation of the Effects and Consequences of Major Accidents in Industrial Plants; Elsevier: Amsterdam, The Netherlands, 2017. [Google Scholar]
- Zhou, J.; Reniers, G. Modeling, and analysis of vapour cloud explosions knock-on events by using a Petri-net approach. Saf. Sci. 2018, 108, 188–195. [Google Scholar] [CrossRef]
- Oran, E.S.; Chamberlain, G.; Pekalski, A. Mechanisms and occurrence of detonations in vapor cloud explosions. Prog. Energy Combust. Sci. 2020, 77, 100804. [Google Scholar] [CrossRef]
- Johnson, D.M. The potential for vapour cloud explosions—Lessons from the Buncefield accident. J. Loss Prev. Process. Ind. 2010, 23, 921–927. [Google Scholar] [CrossRef]
- Venart, J. Flixborough: The Explosion and its Aftermath. Process. Saf. Environ. Prot. 2004, 82, 105–127. [Google Scholar] [CrossRef]
- Sharma, R.; Gurjar, B.; Wate, S.; Ghuge, S.; Agrawal, R. Assessment of an accidental vapour cloud explosion: Lessons from the Indian Oil Corporation Ltd. accident at Jaipur, India. J. Loss Prev. Process. Ind. 2013, 26, 82–90. [Google Scholar] [CrossRef]
- Mishra, K.B.; Wehrstedt, K.-D.; Krebs, H. Amuay refinery disaster: The aftermaths and challenges ahead. Fuel Process. Technol. 2014, 119, 198–203. [Google Scholar] [CrossRef]
- Schmidt, S.; Mishra, K.B.; Wehrstedt, K.-D. CFD based reproduction of Amuay refinery accident 2012. Chem. Eng. 2016, 48. [Google Scholar] [CrossRef]
- Dasgotra, A.; Teja, G.V.; Sharma, A.; Mishra, K.B. CFD modeling of large-scale flammable cloud dispersion using FLACS. J. Loss Prev. Process. Ind. 2018, 56, 531–536. [Google Scholar] [CrossRef]
- Mishra, K.B. The influence of volume blockage ratio on IOCL Jaipur explosion. J. Loss Prev. Process. Ind. 2018, 54, 196–205. [Google Scholar] [CrossRef]
- Xiao, H.; Duan, Q.; Jiang, L.; Sun, J. Effects of ignition location on premixed hydrogen/air flame propagation in a closed combustion tube. Int. J. Hydrog. Energy 2014, 39, 8557–8563. [Google Scholar] [CrossRef]
- Schaschke, A. Dictionary of Chemical Engineering; OUP Oxford: Oxford, UK, 2014. [Google Scholar]
- Sharma, R.K. A violent, episodic vapour cloud explosion assessment: Deflagration-to-detonation transition. J. Loss Prev. Process. Ind. 2020, 65, 104086. [Google Scholar] [CrossRef]
- Hansen, R.; Johnson, D.M. Improved far-field blast predictions from fast deflagrations, DDTs and detonations of vapour clouds using FLACS CFD. J. Loss Prev. Process Ind. 2015, 35, 293–306. [Google Scholar] [CrossRef]
- Yi, Y.; Xueqiu, H.; Geng, L.; Huia, W. Effect of meshy obstacle on methane gas explosion. Procedia Eng. 2011, 26, 70–74. [Google Scholar] [CrossRef][Green Version]
- Eckhoff, R.K. Explosion Hazards in the Process Industries; Gulf Professional Publishing: Cambridge, MA, USA; London, UK, 2016. [Google Scholar]
- Sinha, A.; Wen, J.X. A simple model for calculating peak pressure in vented explosions of hydrogen and hydrocarbons. Int. J. Hydrogen Energy 2019, 44, 22719–22732. [Google Scholar] [CrossRef]
- Atkinson, G.; Cowpe, E.; Halliday, J.; Painter, D. A review of very large vapour cloud explosions: Cloud formation and explosion severity. J. Loss Prev. Process. Ind. 2017, 48, 367–375. [Google Scholar] [CrossRef]
- Ohep, E. More than 100 Dead in PDVSA Amuay Explosion—CEO Fedecamaras Falcon. 5 September 2012. Available online: http://www.petroleumworld.com/storyt12090501.htm (accessed on 28 June 2020).
- The Global Barrel. Amuay Refinery Disaster: Syrian Naphtha & Chavez ’Petroleum Revolution’ in Flames. 30 August 2012. Available online: https://globalbarrel.com/2012/08/30/amuay-refinery-disaster-syrian-naphtha-chavez-petroleum-revolution-in-flames/ (accessed on 28 June 2020).
- Pearson, T. Venezuelan Report: Refinery Disaster Caused by Intentional Manipulation of Gas Pump Bolts. 10 September 2013. Available online: https://venezuelanalysis.com/news/10013 (accessed on 29 June 2020).
- Zhang, S.; Wang, X.; Cheng, Y.F.; Shuai, J. Modeling and analysis of a catastrophic oil spill and vapor cloud explosion in a confined space upon oil pipeline leaking. Pet. Sci. 2020, 17, 556–566. [Google Scholar] [CrossRef]
- Girdhar, M. Jaipur Fire and its Environmental effects. Fire Eng. 2012, 37, 21–22. [Google Scholar]
- Lal, M.B. Committee Report; Oil Industry Safety Directorate: Noida, India, 2015.
- Sharma, R.K.; Gurjar, B.R.; Ho, H.K.P.; Ghuge, S.P.; Agrawal, R. Lessons Learned from Industrial Chemical Accidents: A Case Study of Indian Oil Corporation (IOC) Terminal, Jaipur, India. 2015. Available online: https://pscmembers.tamu.edu/wp-content/uploads/2015/2015 Proceedings/045_Ravi Sharma.pdf (accessed on 29 June 2020).
- Hurley, M.J.; Gottuk, D.T.; Hall, J.R., Jr.; Harada, K.; Kuligowski, E.D.; Puchovsky, M.; Torero, J.L.; Watts, J.M., Jr.; Wieczorek, C.J. SFPE Handbook of Fire Protection Engineering; Springer: Berlin/Heidelberg, Germany, 2015. [Google Scholar]
- Dan, S.; Kim, H.; Shin, D.; Yoon, E.S. Quantitative Risk Analysis of New Energy Stations by CFD-Based Explosion Simulation. In Computer Aided Chemical Engineering; Elsevier: Amsterdam, The Netherlands, 2012; Volume 31, pp. 305–309. [Google Scholar]
- Gant, S.; Narasimhamurthy, V.; Skjold, T.; Jamois, D.; Proust, C. Evaluation of multi-phase atmospheric dispersion models for application to Carbon Capture and Storage. J. Loss Prev. Process. Ind. 2014, 32, 286–298. [Google Scholar] [CrossRef]
- Gant, S.E.; Atkinson, G.T. Buncefield Investigation: Dispersion of the Vapour Cloud; Health and Safety Laboratory Report, CM/06/13; Health and Safety Laboratory: Bootle, UK, 2006.
- Venart, J.E.S.; Rogers, R.J. The Buncefield explosion: Vapor cloud dispersion and other observations. IChemE Symp. Ser. Hazards 2011, 22, 519–527. [Google Scholar]
- Johnsen, R.; Ryum, S.R. Explosion, Fire and Structural Response Analysis. In Proceedings of the SPE International Conference on Health, Safety and Environment in Oil and Gas Exploration and Production, Stavanger, Norway, 26–28 June 2000. [Google Scholar]
- Ma, G.; Huang, Y.; Li, J. VCE Overpressure Prediction by CFD Modelling. In Risk Analysis of Vapour Cloud Explosions for Oil and Gas Facilities; Springer: Singapore, 2019; pp. 45–79. [Google Scholar]
- Hansen, O.R.; Gavelli, F.; Ichard, M.; Davis, S.G. Validation of FLACS against experimental data sets from the model evaluation database for LNG vapor dispersion. J. Loss Prev. Process. Ind. 2010, 23, 857–877. [Google Scholar] [CrossRef]
- Hansen, R.; Melheim, J.A.; Storvik, I.E. CFD-modeling of LNG dispersion experiments. In Proceedings of the AIChE Spring National Meeting, Houston, TX, USA, 22–27 April 2007. [Google Scholar]
- Sajid, Z.; Zhang, Y.; Khan, F. Process design and probabilistic economic risk analysis of bio-diesel production. Sustain. Prod. Consum. 2016, 5, 1–15. [Google Scholar] [CrossRef]
- Sajid, Z.; Khan, F.; Zhang, Y. A novel process economics risk model applied to biodiesel production system. Renew. Energy 2018, 118, 615–626. [Google Scholar] [CrossRef]
- Sajid, Z.; Khan, F.; Zhang, Y. Integration of interpretive structural modelling with Bayesian network for biodiesel performance analysis. Renew. Energy 2017, 194–203. [Google Scholar] [CrossRef]


Publisher’s Note: MDPI stays neutral with regard to jurisdictional claims in published maps and institutional affiliations. |
© 2021 by the authors. Licensee MDPI, Basel, Switzerland. This article is an open access article distributed under the terms and conditions of the Creative Commons Attribution (CC BY) license (https://creativecommons.org/licenses/by/4.0/).