Article

Volatile Fatty Acids and Biomethane Recovery from Thickened Waste Activated Sludge: Hydrothermal Pretreatment’s Retention Time Impact

Environmental Research Group for Resource Recovery, Department of Civil Engineering, Faculty of Engineering, Architecture and Science, Ryerson University, 350 Victoria Street, Toronto, ON M5B 2K3, Canada
*
Author to whom correspondence should be addressed.
Processes 2020, 8(12), 1580; https://doi.org/10.3390/pr8121580
Submission received: 11 August 2020 / Revised: 25 November 2020 / Accepted: 25 November 2020 / Published: 30 November 2020
(This article belongs to the Special Issue Processes for Biofuel, Biogas and Resource Recovery from Biomass)

Abstract

:
The main objective of this study was to evaluate the hydrothermal pretreatment’s retention time influence on the volatile fatty acids and biomethane production from thickened waste activated sludge under mesophilic conditions. Six different retention times of 10, 20, 30, 40, 50, and 60 min were investigated while the hydrothermal pretreatment temperature was kept at 170 °C. The results showed that the chemical oxygen demand (COD) solubilization increased by increasing the hydrothermal pretreatment retention time up to 30 min and stabilized afterwards. The highest COD solubilization of 48% was observed for the sample pretreated at 170 °C for 30 min. Similarly, the sample pretreated at 170 °C for 30 min demonstrated the highest volatile fatty acids yield of 14.5 g COD/Lsubstrate added and a methane yield of 225 mL CH4/g TCODadded compared to 4.3 g COD/Lsubstrate added and 163 mL CH4/g TCODadded for the raw sample, respectively. The outcome of this study revealed that the optimum conditions for solubilization are not necessarily associated with the best fermentation and/or digestion performance.

1. Introduction

Global climate change and the energy crisis due to the combustion of fossil fuels have increased the interest in the bio-renewable energy resources. Therefore, the wastewater treatment plants (WWTP) nowadays are not only targeting wastewater treatment but recovering value-added products, such as volatile fatty acids and biomethane, from the wastewater. Anaerobic digestion (AD) is a promising technology to reclaim energy from organic matter. AD has many benefits, such as solid reduction, decreasing the greenhouse gas emissions, odor reduction, and increase in the non-market profits compared to the other waste treatment technologies [1].
AD is a biological process that transforms complex organic matter to biogas and digestate by four main steps: hydrolysis, acidogenesis, acetogenesis, and methanogenesis [2,3]. During hydrolysis, hydrolytic bacteria utilizes water to break down the complex polymeric structures of organic compounds into their constituent monomeric subunits, such as amino acids, sugars, and long-chain fatty acids. In waste activated sludge (WAS), the major part of the organic compounds is bounded in a polymeric network formed by extracellular polymeric substances (EPSs). EPSs are extremely hydrated structures with high impact in settling, dewatering of the sludge, and bio flocculation [4]. EPSs in WAS is mainly attributed to the proteins and carbohydrates that need to be disintegrated to make the intracellular content available to the microorganisms. The degree of degradation and overall digestion performance are reported to be improved by solids solubilization and hydrolyzed organics degradation [5]. The by-products of the hydrolysis step are then converted into a mixture of volatile fatty acids (VFAs) and other products, such as hydrogen and ammonia, by acidogenic bacteria. Afterwards, acetogenic bacteria converts the VFAs produced from the acidogenesis to acetate, carbon dioxide, and hydrogen. In the last step, methanogenesis utilizes the acidogenesis products (acetate, H2, and CO2) and produces methane [6].
Generally, methane produced from the last phase of AD is considered to be the main beneficial product. However, by excluding the methane forming stage, valuable organic acids such as VFAs can be produced by anaerobic fermentation (hydrolysis and acidogenesis) [7]. VFAs can be extracted from the biological process and utilized for many applications, such as a carbon source for the biological nutrient removal (BNR) process [8], generating electricity through a microbial electrolysis cell (MEC) [9], or producing the poly-hydroxyalkanoates (PHA) for biodegradable plastic production [8]. The main difference between the fermentation and anaerobic digestion process is the by-product of the process. Fermentation by-products are mainly VFAs and alcohols; however, anerobic digestion by-products are ultimately methane and carbon dioxide. On the other hand, the fermentation process includes two main steps, hydrolysis and acidogenesis, while anaerobic digestion includes four steps, namely, hydrolysis, acidogenesis, acetogenesis, and methanogenesis. Another difference is that the fermentation process requires an acidic environment, while anaerobic digestion requires a neutral pH.
Most of research studies have reported that hydrolysis is the rate-limiting step for AD of complex organic matters, whereas, for the easily biodegradable substrates, the methanogenesis step is the rate-limiting step [10]. In order to overcome this challenge, different pretreatment technologies, including mechanical, chemical, biological, and thermal, have been applied to promote the hydrolysis step [11,12,13]. Among these pretreatment methods, hydrothermal pretreatment (HTP) is considered to be one of the most studied pretreatments, which is commercially available at full scale. The first full-scale HTP plant was implemented in 1995 at the HIAS WWTP of Hamar (Norway) [14,15,16]. HTP refers to the heating of the biomass at beyond the autoclave temperature (121 °C) [15]. The main mechanism of hydrothermal pretreatment is disintegration of the cell membrane and subsequently solubilizing the organic compounds by releasing the intracellular materials [17]. Other benefits of HTP are removing the pathogens, reducing the viscosity, decreasing the particle size of the solids, and enhancing the dewaterability [10].
Various thermal and hydrothermal temperatures ranging from 50 °C to 275 °C have been studied to improve the AD and fermentation of municipal sludge. Most of the studies have focused on AD while only few studies investigated the effect of HTP on the fermentation or two-stage AD. Researchers investigated the effect of the hydrothermal pretreatment temperature [18,19,20] and retention time [5,13,21,22] on biogas production at different ranges. Various studies in the literature have also reported a higher soluble content after hydrothermal pretreatment compared to the raw TWAS [18,19,21]. According to the literature, and as shown in Table 1, the optimal HTP temperature for the AD is 160–180 °C [10]. However, there is a discrepancy in the optimum retention time. Some researchers reported 30 min as the optimum time [19,20], while others found that the 50 min [18] and 76 min [22] are the optimum times. On the other hand, some researchers reported higher retention time of 24 h as the optimum time [21].
On the other hand, to the authors’ best knowledge, there are a limited number of studies in the literature on the effect of the hydrothermal pretreatment’s retention time on VFA production or on the two-stage anaerobic digestion. Therefore, the main objective of the study was to evaluate the effect of the hydrothermal pretreatment’s retention time on the VFA production and methane production of TWAS. The degree of solubilization due to the pretreatment as well as due to the fermentation was investigated. The effect of the pretreatment on VFA production and VFA distribution was also analyzed. Furthermore, the effect of the pretreatment on the methane yield, methane rate, and kinetics was evaluated.

2. Materials and Methods

2.1. Substrate and Seed Preparation

The substrate employed in the current study was TWAS obtained from Ashbridge’s Bay Wastewater Treatment Plant (AWWTP). This plant is located at the east end of Toronto, Canada, having a nominal capacity of 818,000 m3/day and an equivalent population of 1,524,000 is being served by this plant. The residential wastewater coming to the AWWTP goes through four major treatment phases of preliminary, primary, secondary treatment (activated sludge), and disinfection. Samples for the current study were collected after the secondary treatment effluent underwent a thickening process by centrifugation. The characteristics of the raw TWAS can be found in Table 2.
The seed used for the current study was also obtained from an operating anaerobic digester at the AWWTP. The digester is operated under mesophilic condition with hydraulic retention time (HRT) of approximately 18 days. The feed for this digester at the AWWTP was a mixture of TWAS and primary sludge with an organic loading rate of about 1.1 kg total volatile solids/m3.d [25].
For the fermentation tests, the seed was pretreated thermally using a hot plate in a 6 L stainless-steel pot to suppress methanogens prior to using it for the fermentation tests [26]. The temperature of the seed was brought to 70 °C and it was then incubated in the incubator for 30 min at 70 °C. Next, the seed was chilled to room temperature without using any cooling system. The pH was adjusted to 5.5 using HCl. The seed’s characteristics are shown in Table 2.

2.2. Hydrothermal Pretreatment

Hydrothermal pretreatment of the substrate was performed under six different conditions. The temperature was fixed at 170 °C and six retention times of 10, 20, 30, 40, 50, and 60 min were tested. A Parr 4848 Hydrothermal Reactor with a capacity of 2 L (Parr Instrument Company, Moline, IL, USA) was used for the HTP. The volume of the TWAS for each pretreatment in this study was 1 L. The operating process of the hydrothermal pretreatment is described in our previous study [27].

2.3. Solubilization Calculations

The degree of solubilization or chemical oxygen demand (COD) solubilization is commonly used as an indicator to evaluate the pretreatment performance [19]. Soluble compounds, such as SCOD, soluble protein, and soluble carbohydrates, were monitored before and after the HTP to evaluate the effect of the pretreatment on the TWAS solubilization. The solubilization percentage (%) was calculated using Equation (1):
Solubilization   percentage   d u e   t o   p r e t r e a t m e n t   ( % ) =   ( SCOD HTP SCOD Raw ) / PCOD Raw   × 100
PCOD Raw =   TCOD Raw SCOD Raw
SCOD HTP : Soluble COD concentration after HTP.
SCOD Raw : Soluble COD concentration of the raw sample.
PCODRaw: Particulate COD concentration of the raw sample.
TCOD Raw : Total COD concentration of the raw sample.
The percentage reduction in VSS “R” due to the pretreatment was calculated using Equation (3):
R   ( % ) = ( VSS Raw VSS HTP ) / VSS Raw × 100  
VSS Raw : VSS concentration of the raw sample.
VSS HTP : VSS concentration after pretreatment.
The COD solubilization percentage during the acidification process was calculated using Equation (4).
Solubilization   percentage   d u e   t o   a c i d i f i c a t i o n   ( % ) =   MSCOD P / PCOD Sub
MSCOD P = MSCOD F   MSCOD I
SCOD I =   SCOD Sub   ×   V Sub +   SCOD Seed   ×   V Seed V Sub +   V Seed
PCOD HTP =   TCOD HTP SCOD HTP
Mass   of   SCOD F =   SCOD F   ×   ( V Sub +   V Seed ) SCOD Seed   ×   V Seed
MSCOD P : Mass of soluble COD produced.
PCOD Sub : Particulate COD of the substrate which can be either PCOD Raw or PCOD HTP according to Equation (2) or Equation (7).
MSCOD F : Mass of the soluble COD after acidification.
MSCOD I : Mass of the soluble COD before acidification.
SCOD I : Soluble COD concentration before acidification.
SCODSub: Soluble COD concentration of the substrate (raw or pretreated).
VSub: Volume of the substrate added.
SCODSeed: Soluble COD of the seed.
VSeed: Volume of seed added.
PCODHTP: Particulate COD of the pretreated substrate before adding to the reactor.
TCODHTP: TCOD concentration of the pretreated sample.
SCODF: SCOD after acidification test.
For the mass of SCODF calculation, it was assumed that the SCOD in the seed did not degrade or convert during the acidification process.

2.4. Fermentation Experiment

Six pretreated TWAS samples and one raw sample (control) were used for the acidification (fermentation) experiment. The acidification tests were carried out under mesophilic and batch conditions. The total volume of each reactor was 1800 mL and the working volume was 1600 mL. According to the food-to-microorganism (F/M) ratio of 1 g TCOD/g VSS, the volumes of the substrate and seed were calculated based on Equation (9):
F M =   T C O D s u b   ×   V s u b V S S s e e d   ×   V s e e d
Vsub: Volume of substrate added to the fermenter.
Vseed: Volume of seed added to the fermenter.
VSSseed: Volatile suspended solids of the seed.
TCODsub: TCOD of the substrate.
Considering the F/M ratio, the calculated volumes of substrate and seed were added to the reactors. After mixing both components (substrate and seed), the pH of the liquid was adjusted to 5.50 by using 3.5 M HCl. To ascertain that an anaerobic condition is provided, nitrogen gas was purged in each reactor for about 5 min and sealed promptly. A Bioprocess Automatic Methane Potential Test System (AMPTS II) was used for carrying out the acidification test. A detailed description of the AMPTS can be found in our previous paper [25].
The VFA yield produced after acidification of the pretreated and raw TWAS was calculated using Equations (10):
VFAs   Yield =   MVFAs p MVSS added
MVFAsp = VFAsfinal × (Vsub + Vseed)
MVSSadded = VSSsub × (Vsub)
MVFAsp: Mass of the VFAs produced after acidification.
MVSSadded: Mass of the VSS added in the substrate.
VFAsfinal: VFAs concentrations at the end of the acidification.
VSSsub: VSS concentrations of the substrate.

2.5. Biochemical Methane Potential Experiment

The biochemical methane potential (BMP) test was conducted under batch mesophilic conditions. The experiment was conducted in triplicates using the six different thermally pretreated samples in addition to the raw sample; in total, 21 reactors were used. To eliminate interference of background methane production from the seed, degassing was performed for the seed for ten days under mesophilic conditions prior to substrate addition. After 10 days of degassing, based on the F/M ratio of 1 g TCOD/g VSS, a specific amount of TWAS was added to the reactors. The pH was then adjusted to about 6.8 to 7.00. Afterwards, the mixture (substrate and seed) was purged with nitrogen for about 5 min to remove any dissolved oxygen and provide anaerobic conditions. The total volume of the reactor was 260 mL, with a working volume of 200 mL. As the alkalinity of the seed was over 6000 mg/L, supplement alkalinity was not required.

2.5.1. Kinetics

Typically, hydrolysis is the rate-limiting step of anaerobic digestion of particulate wastes. In this stage, biological degradation occurs when the cell wall is disrupted, releasing the intracellular organic matter [28,29]. In general, anaerobic digestion is explained as a first-order reaction relating to substrate concentration (Equation (13)) and methane production (Equation (14)).
dS/dt = −k S
k: The first order kinetic constant (d−1).
t: The digestion time (d).
S: Residual substrate (organics) concentration (mg/L) at any time t.
Since measuring S during the experiment is challenging and the substrate reduction is directly correlated to the methane production, Equation (13) has been modified to be based on the methane production, as shown in Equation (14) [30].
d[(Bo − B)/Bo]/dt = −k [(Bo − B)/Bo]
Bo: Ultimate methane production at the end of the AD related to the initial substrate content (So).
B: The methane production linked to the consumed substrate denoting S = Bo − B.
The first-order kinetic constant (k) value may be calculated as the slope of the linear curve of ln ((Bo − B)/Bo) vs. t.

2.5.2. Biodegradability

The anaerobic biodegradability (BDCH4) can be calculated by using the experimental methane production compared to the theoretical methane value, as follows in Equation (15) [31]:
BDCH4 (%) = (BoExp/BoTh) ∗ 100
BoExp: The experimental ultimate methane production (mL).
BoTh: The theoretical methane potential based on the mass of the initial TCOD of the substrate, neglecting the biomass synthesis (approximately 5% of the consumed organic matter). The BoTh was calculated using the following formula:
BoTh = (TCODsub × Vsub-added) × theoretical methane yield, which is 0.397 L CH4/g COD (at 37 °C)

2.5.3. Gompertz Model

In the batch tests, a modified Gompertz model was considered to depict the progression of cumulative methane production [32]:
H = P . exp { exp [ R m   e P ( λ t ) +   1 ] }
H: The cumulative methane production (mL).
P: The maximum methane production (mL).
Rm: The maximum methane production rate (mL/h).
λ: The lag phase time (h).
t: The incubation time (h).
e = exp (1) = 2.718.

2.5.4. Mass Balance for COD

The COD mass balance was calculated by Equation (17):
%COD balance = (CODfinal + CODCH4)/CODinitial ∗ 100
CODfinal: The final TCOD at the end of the experiment.
CODCH4: The COD of the cumulative methane produced based on 0.397 L CH4/g COD.
CODinitial: The initial TCOD.

2.6. Analytical Methods

All the water and gas quality analyses, such as TSS, VSS, TCOD, SCOD, carbohydrates, proteins, VFAs, particle size distribution (PSD), biogas production, and biogas composition, were analyzed as described in our previous paper [25].

3. Results and Discussions

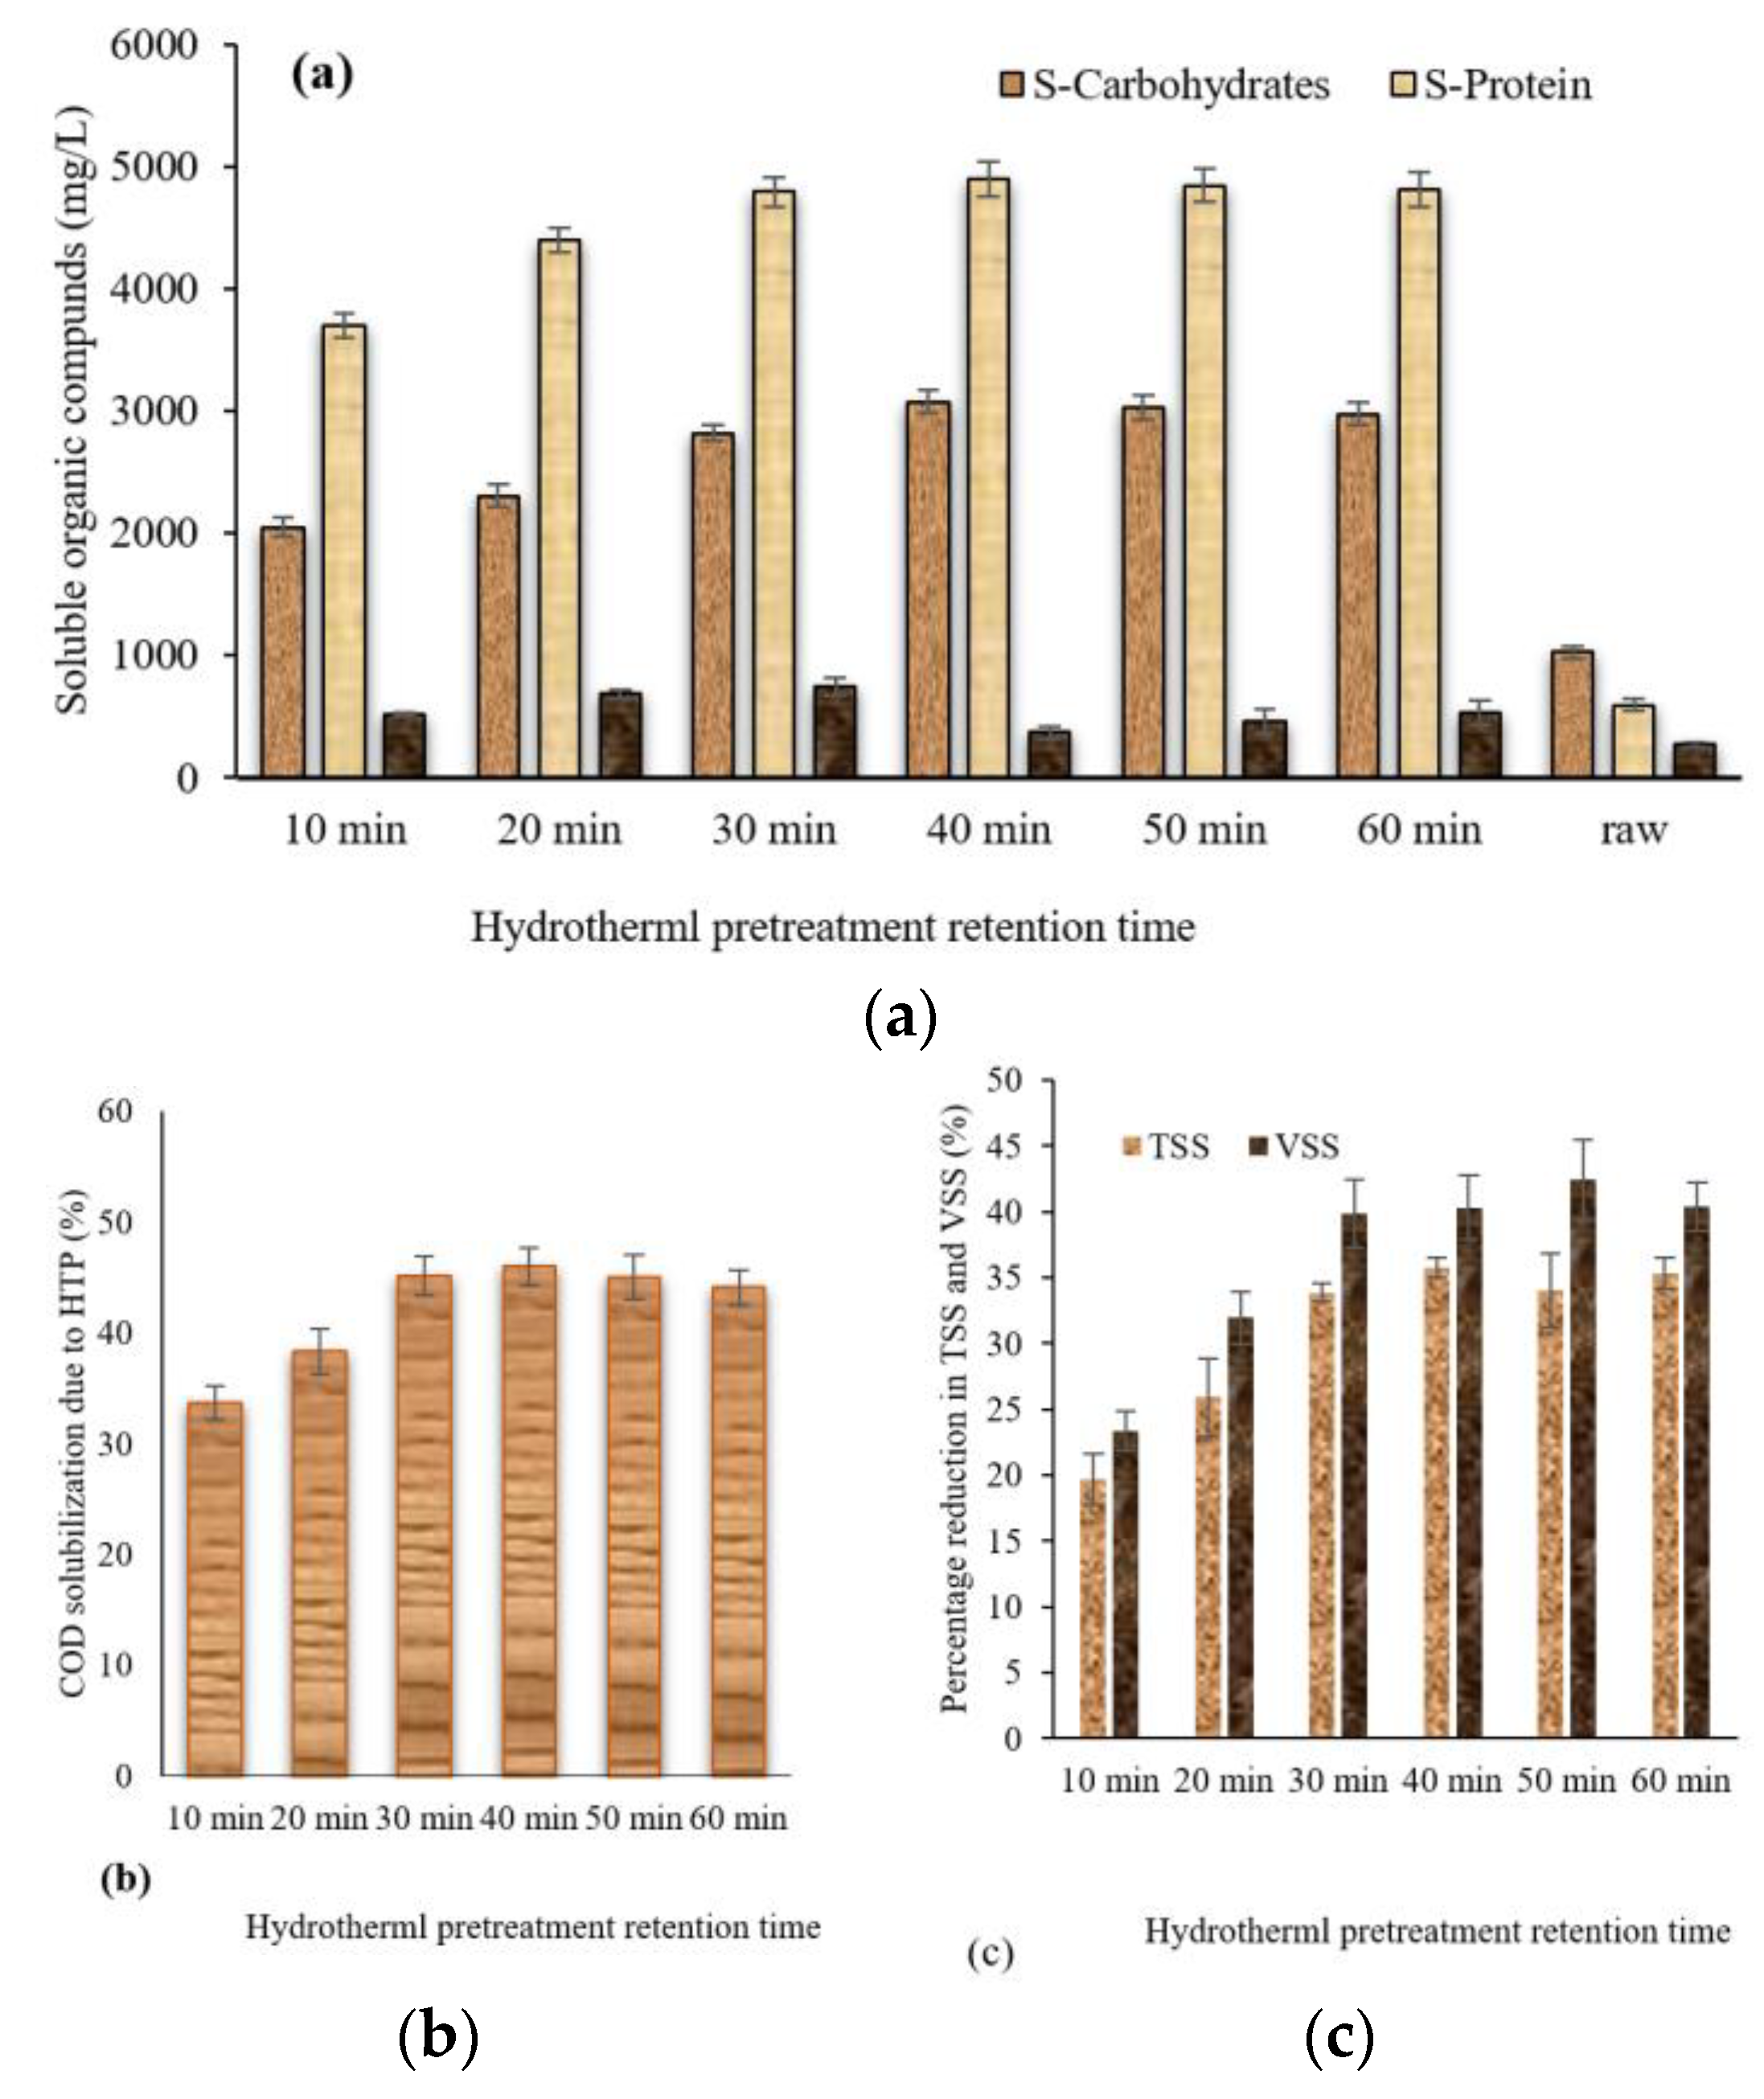
3.1. Effect of Retention Time on TWAS Disintegration

TWAS samples were hydrothermally pretreated at six different hydrothermal retention times, namely, 10, 20, 30, 40, 50, and 60 min, under the same HTP temperature of 170 °C. All the pretreated samples had a higher content of soluble compounds compared to the raw sample. Figure 1a illustrates the different soluble components, such as the VFAs, soluble carbohydrates, and soluble protein concentrations for the pretreated and raw samples. Comparing the soluble content in the raw sample to the hydrothermally pretreated samples, it was evidenced that the HTP has increased the concentration of all the soluble compounds. This enhancement in soluble compounds was expected based on our previous study, where it was found that HTP enhances the soluble portion of the TWAS at 170 °C [27].
As shown in Figure 1a, soluble proteins of all the pretreated samples were higher than the raw sample; however, it increased at a retention time of 10 min to about 3700 mg/L compared to 600 mg/L for the raw sample. The highest soluble protein of about 4800 mg/L was achieved at a retention time of 30 min, after which there was no significant increase. These findings are in agreement with Xue et al.’s [21] results, who investigated the effect of hydrothermal retention time on high-solid sludge by retaining the HTP temperature at 180 °C and changing the retention time from 0 to 180 min. They found that increasing the retention time was associated with an increase in soluble proteins. They reported that the concentration of soluble proteins increased from 15 g/L to 25 g/L when the retention time increased from 10 to 60 min and it continued to increase at a lower rate, reaching up to approximately 30 g/L at 180 min.
On the other hand, the soluble carbohydrates’ concentration increased when the retention time was increased from 10 to 40 min, and then it was stabilized. The highest concentration of soluble carbohydrates of about 3100 mg/L was achieved for the sample hydrothermally pretreated for 40 min compared to about 1000 mg/L for the raw sample. Xue et al. [21] also found that increasing the HTP retention time from 10 to 30 min increased the soluble carbohydrates content from 2000 mg/L to 2500 mg/L. However, they reported that increasing the retention time above 30 min still enhanced the concentration of soluble carbohydrates while in our study it was not the case.
The SCOD of the hydrothermally pretreated samples ranged from 12,970 ± 250 mg/L (being the lowest value for sample pretreated for 10 min) to 16,690 ± 180 mg/L (the highest concentration for sample pretreated for 30 min). The conversion of particulate matter in the TWAS to soluble can be also expressed as the COD solubilization (which reflects the percentage of particulate COD that was converted to SCOD). The COD solubilization of the hydrothermally pretreated samples is illustrated in Figure 1b. As seen in the figure, all the COD solubilization increased by increasing the retention time up to 30 min, and then it decreased slightly. The highest COD solubilization of 45% was achieved at a 30 min retention time. This was in line with some studies in the literature; for example, Ding et al. [33] reported a maximum COD solubilization of 65% when they pretreated TWAS at a temperature of 140 °C for 30 min. They tested different retention times, ranging from 5 to 30 min with 5 min intervals, and they reported that the COD solubilization has increased from 58% to 65% when the retention time was increased from 5 to 30 min.
Although the hydrothermal pretreatment enhances the COD solubilization of the particulate organic compound, it causes a Maillard reaction by creation of colored refractory organic compounds at elevated temperatures formed by polymerizing the carbonyl groups of the reducing sugars and amino groups of amino acids, peptides, or proteins [34].
On the other hand, the VFA content increases with raising the retention time up to 30 min and decreased slightly afterwards. All the pretreated samples had a higher VFA content compared to the raw sample. The highest concentration of VFAs of 750 mg COD/L was spotted at a retention time of 30 min compared to 272 mg COD/L for the raw sample. To the authors’ knowledge, no studies have been conducted on the effect of the retention time at a high temperature (higher than 100 °C) on VFA production. However, some studies reported a rise in VFA production when increasing the retention time when the TWAS was pretreated at a temperature of 60–80 °C [5,21].
The percentages reduction in TSS and VSS due to the hydrothermal pretreatment are illustrated in Figure 1c. As shown in the Figure, increasing the retention time up to 30 min caused an increase in solids reduction, and it was stabilized afterwards. The TSS reduction of the hydrothermally pretreated samples ranged from 20% to about 35%. On the other hand, the VSS reduction ranged from 23% to about 40%. The VSS reduction of 23% was achieved at a retention time of 10 min; this percentage increased to 32% at a retention time of 20 min and reached the maximum of 40% at a retention time of 30 min. The VSS reduction did not change significantly after a retention time of 30 min. A negative direct correlation of “−0.955” between the reduction in VSS concentration and increase in SCOD concentration, considering different HTP retention times, was observed. The results also revealed that increasing the hydrothermal pretreatment retention time caused the release of a higher ammonia content. When the retention time increased from 10 min to 30 min, the ammonia content increased from 148 mg/L to 229 mg/L and it began to drop and reached 165 mg/L at 60 min, which might be due to evaporation. This is similar to what was reported by Ding et al. [26], who found that the NH4–N concentration increased by increasing the HTP retention time.

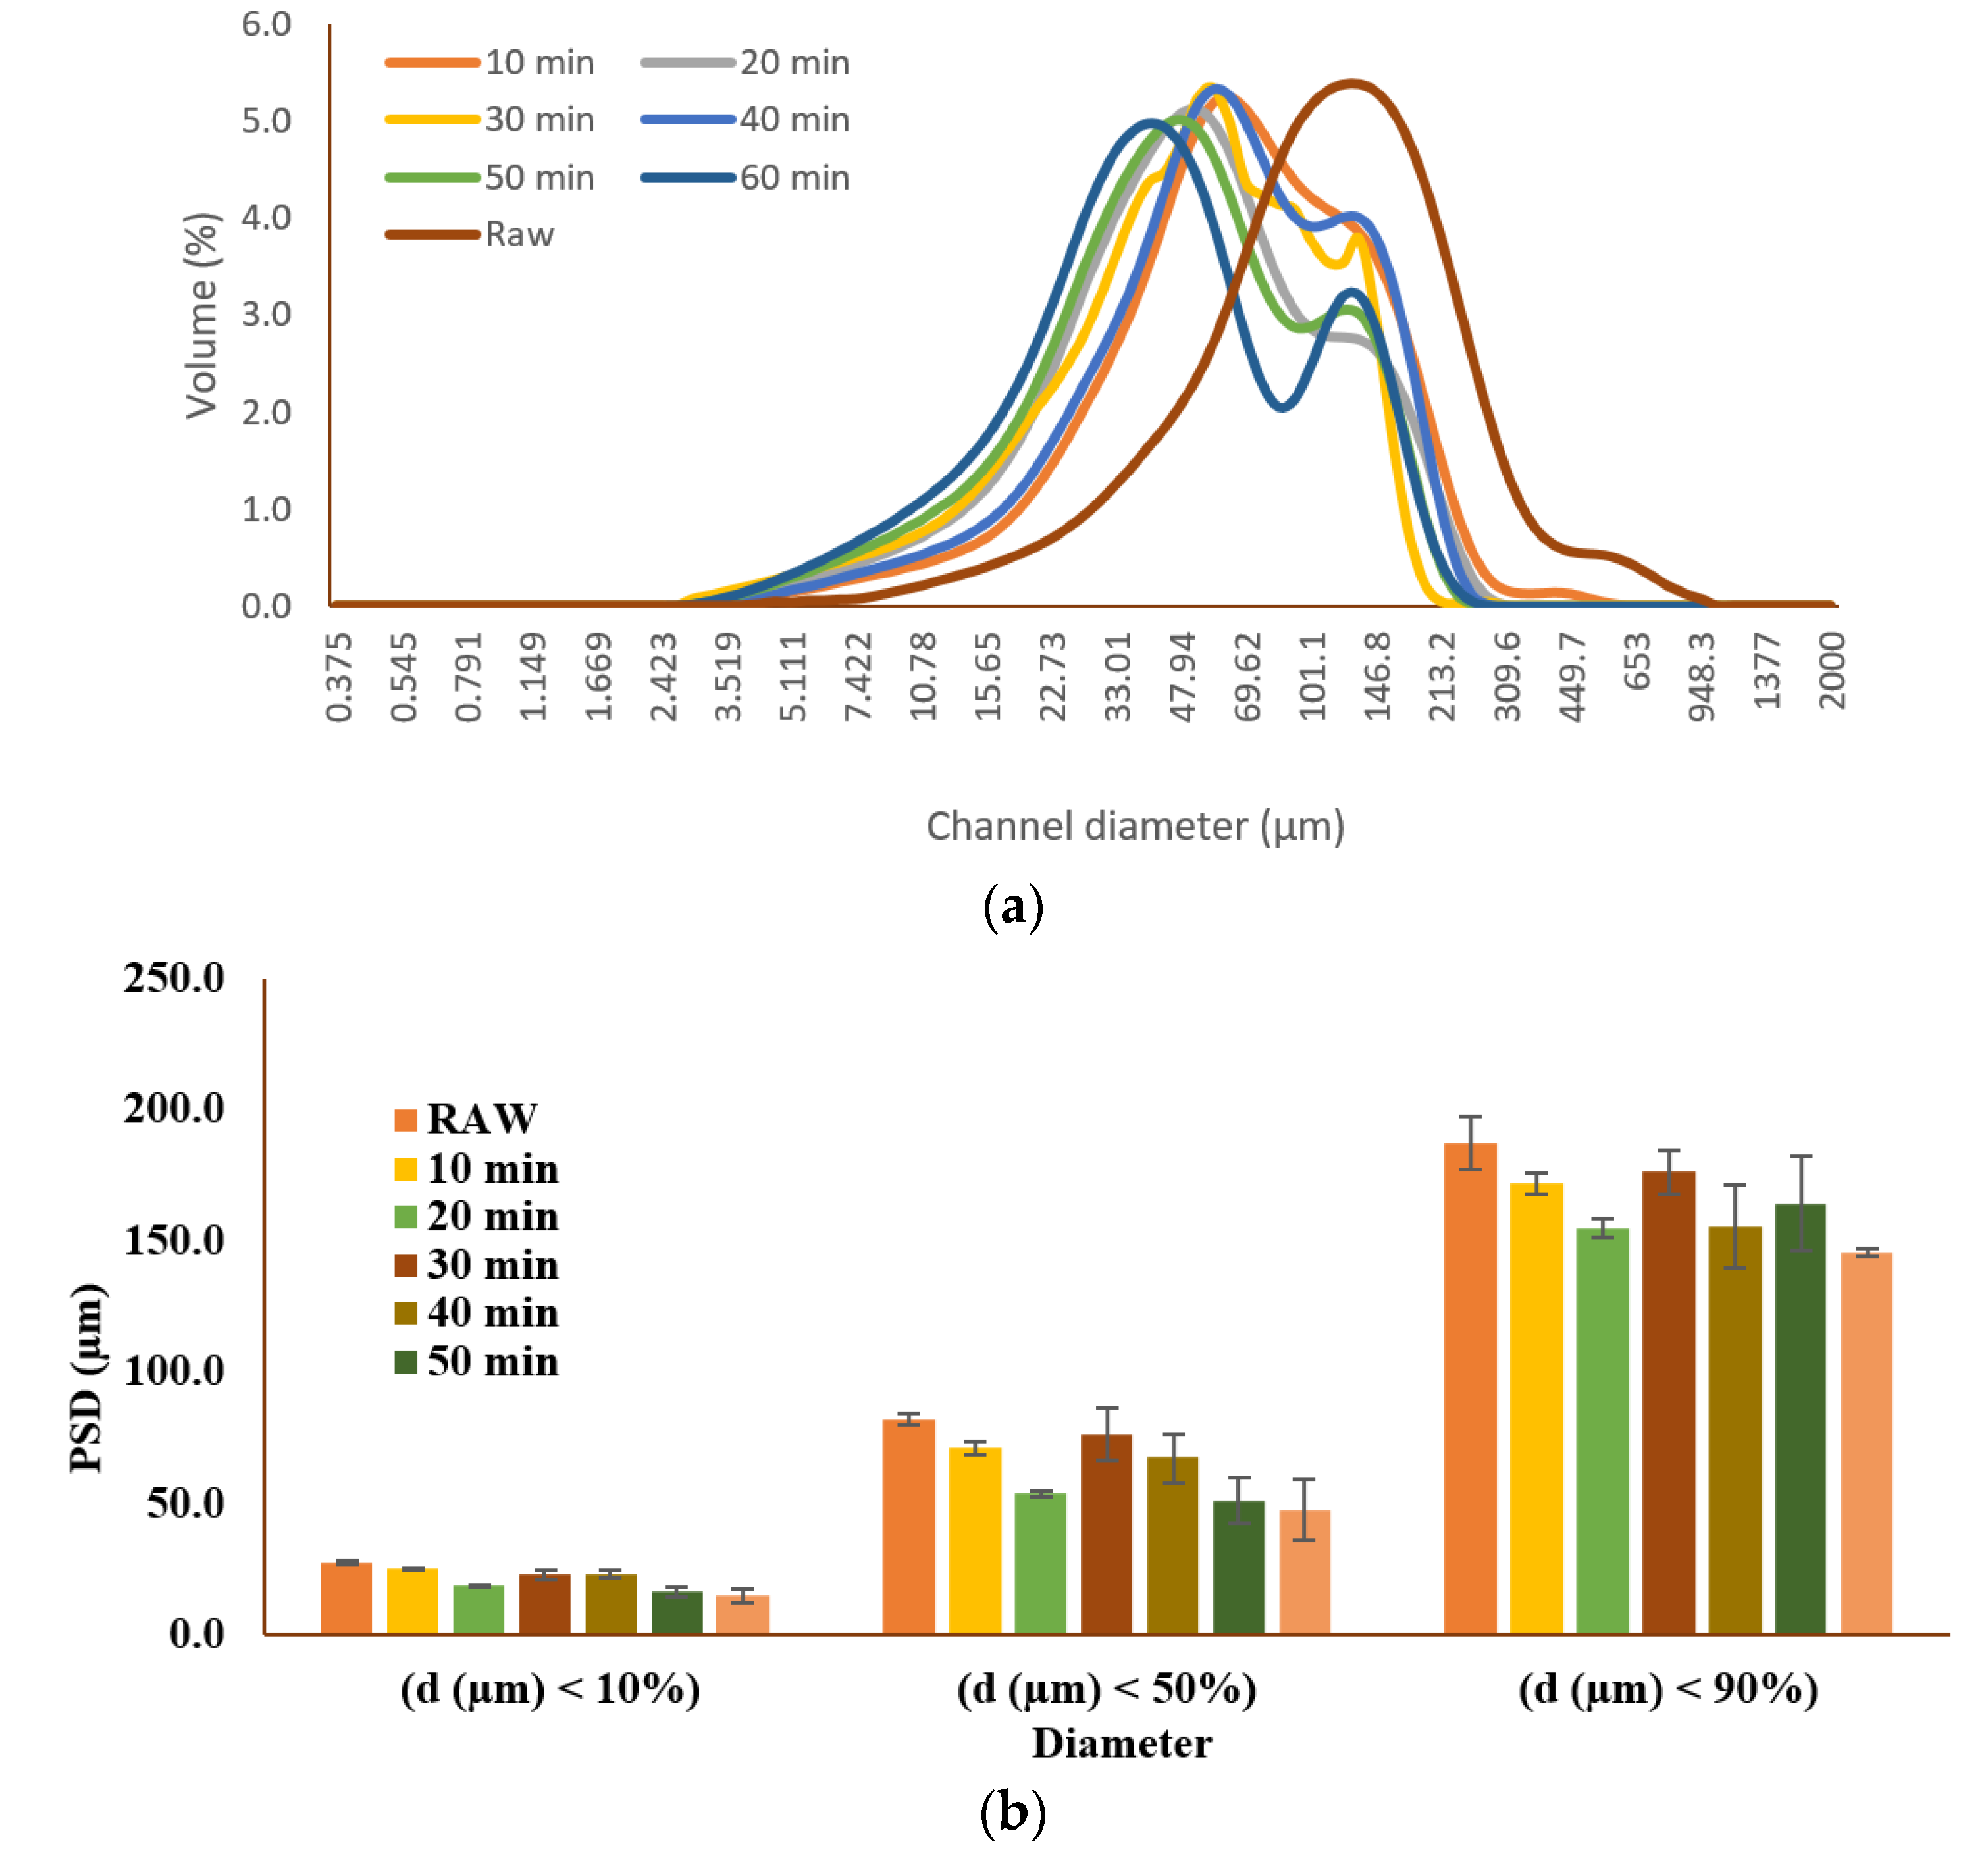
3.2. Effect of Retention Time on Particle Size Distribution

A reduction in particle size facilitates substrate homogenization, increases the carbohydrates’ solubilization, and decreases the cellulose crystallinity. Therefore, it is considered as an important parameter in AD as it influences the degradation rate of the particulate matter [35]. Figure 2 illustrates the particle size distribution (PSD) of the raw and the hydrothermally pretreated samples. As shown in the figure, all the pretreated samples had a lower particle size compared to the raw sample. The d10 and d90 of the raw sample were 27 and 187 μm, respectively. Those values decreased to 15 and 125 μm for the pretreated samples. Increasing the retention time was associated with a decrease in the particle size of the pretreated samples (p < 0.05). The lowest particle size was observed for the sample pretreated for 60 min. At a retention time of 60 min, the d10, d50, and d90 were 15.2 ± 2.4, 47.8 ± 11.8, and 145.5 ± 1.7 μm, respectively, which accounted for a 45%, 42%, and 22% decrease in the particle size compared to the raw sample. Our previous study also demonstrated a reduction in particle size from 27 to 152 μm for the raw sample to 11–121 μm for the pretreated ones [27] when the HTP temperature ranged from 150 to 240 °C and a retention time of 10 to 30 min was applied on the TWAS. Comparable observations were also reported for hydrothermal pretreatment of excess sludge for 180–210 °C for 60 min [36]. They reported about a 90% reduction in the average median value of the sludge’s particle size after HTP compared to the raw sample [36].

3.3. Effect of Retention Time on Fermentation of TWAS

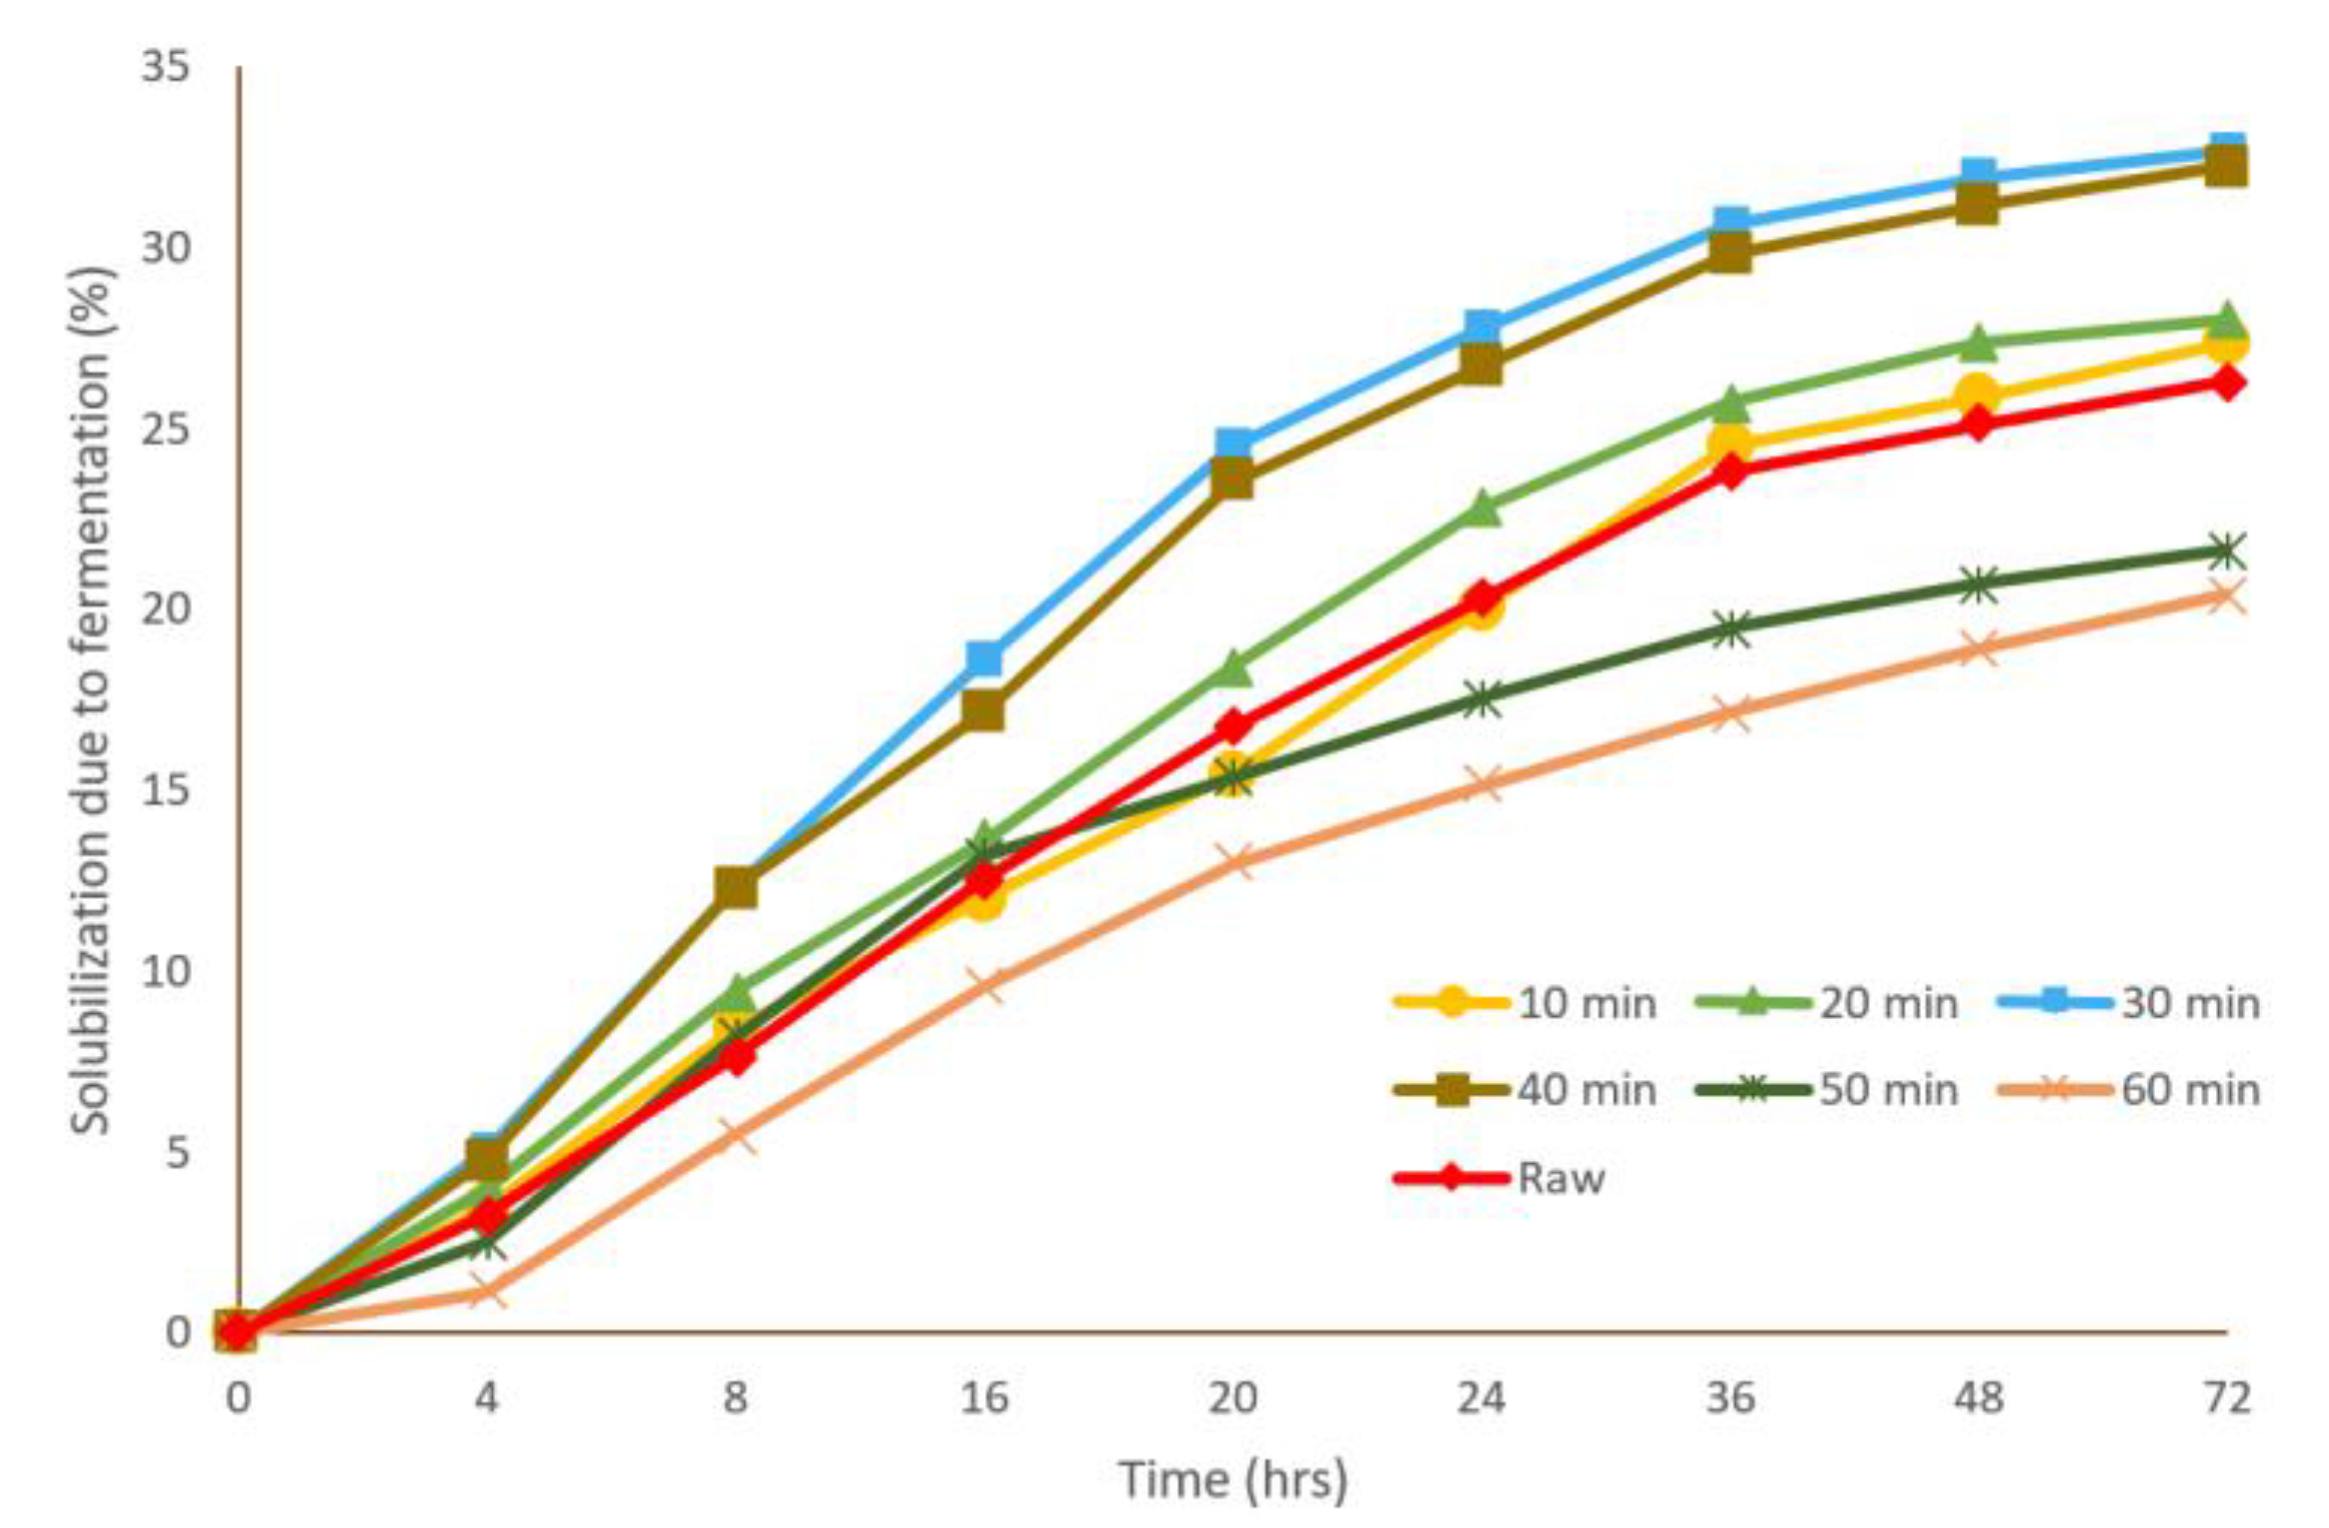
3.3.1. COD Solubilization Due to Fermentation and Overall COD Solubilization

All the pretreated and raw samples underwent a fermentation test. The samples were collected during the fermentation to evaluate the effect of fermentation time as well as hydrothermal retention time on the different parameters. Figure 3 illustrates the COD solubilization of the TWAS for the pretreated and raw samples during the fermentation test. All the samples (raw and pretreated) have a similar trend of solubilization. With increasing the fermentation time, the solubilization increased exponentially until 36 h, after which the increase in solubilization was not significant. The solubilization after 36 h was about 90% of that one after 72 h, i.e., most of the fermentation occurred during the first 36 h.
For the retention times of 10, 20, 30, and 40 min, the trend in COD solubilization due to fermentation followed the same trend of the COD solubilization due to the hydrothermal pretreatment, i.e., with increasing the retention time within this range, the COD solubilization increased. Increasing the hydrothermal retention time beyond 40 min was associated with a lower COD solubilization compared to the raw sample during fermentation. As seen in Figure 3, retention times of 10 and 20 min achieved an approximately 28% solubilization in comparison to 26% for the raw sample. Samples pretreated for 30 and 40 min had a slightly higher solubilization of 32–33%. However, samples pretreated for 50 and 60 min demonstrated a lower solubilization of 20–21% in comparison to the 26% for the raw sample. The low COD solubilization percentage compared to the raw sample in the longer retention times (50 and 60 min) during fermentation can be due to the presence of the refractory compounds (melanoidins) produced during hydrothermal pretreatment at higher HTP retention times, which slows down or hinders the solubilization of the particulate organics during fermentation. Therefore, the effect of the HTP on fermentation of TWAS was not significant after performing a one-way ANOVA (p > 0.05); but, overall, the solubilization of the particulate matter, combining the hydrothermal pretreatment and fermentation, was considerable. The overall solubilization for all samples due to hydrothermal pretreatment and fermentation are indicated in Table 3. Overall solubilization denotes the amount of particulate matter transferred to soluble as a result of both hydrothermal pretreatment and fermentation. All pretreated samples had an approximately 2-times higher final solubilization compared to the raw sample. Ding et al. (2017) evaluated the effect of hydrothermal pretreatment retention time for 5 to 30 min under 140 °C on fermentation of TWAS; they reported that the longer retention times resulted in higher COD solubilization [33]. They found that COD solubilization was enhanced from 58% for a 5 min retention time to 66% for a 30 min retention time, which is in accordance with the results of this study.

3.3.2. Volatile Fatty Acid Yield

The volatile fatty acid yield of the hydrothermally pretreated and raw TWAS are shown in Table 3. The trend of VFA yield produced by fermentation was in a line with the COD solubilization, solid reduction, and soluble carbohydrate content trends due to the hydrothermal pretreatment. In general, all hydrothermally pretreated samples demonstrated a 2–4 times higher VFA yield compared to the raw sample. The VFA yield as per mass of TCOD added for the hydrothermally pretreated samples varied from 257 mg COD/g TCODadded to 423 mg COD/g TCODadded. The VFA yields considering the volatile suspended solids of the substrate for the hydrothermally pretreated samples ranged from 424 mg COD/g VSS added to 699 mg COD/g VSSadded compared to 206 mg COD/g VSSadded for the raw sample. Similar to the COD solubilization due to fermentation, the VFA yield increased by increasing the HTP retention time from 10 min to 30 min, and then dropped afterwards. The highest VFA yield of 699 mg COD/g VSS added was obtained for the sample pretreated for 30 min, which was 3.5 times more than that of the raw sample. This was in accordance with some researchers who reported that all hydrothermally pretreated samples had higher VFA contents compared to the raw samples [26]. However, their results were a little different from our study; they reported that the VFA concentration changed from 12 g/L for 5 min to 13.8 g/L for 30 min.
The specific VFA production rate was calculated by normalizing the VFA production rate per mass of VSS added. The specific VFA production rate increased slightly after the pretreatment compared to the raw sample. The specific VFA production rate for all the hydrothermally pretreated samples increased by about 11% compared to the raw sample, showing two peaks of a high rate (11%) at a 10- and 40-min retention time. The maximum specific VFA production rate of 52 mg COD/g VSS per day was observed at the two retention times of 10 and 40 min compared to 47 mg COD/g VSS per day for the raw sample.

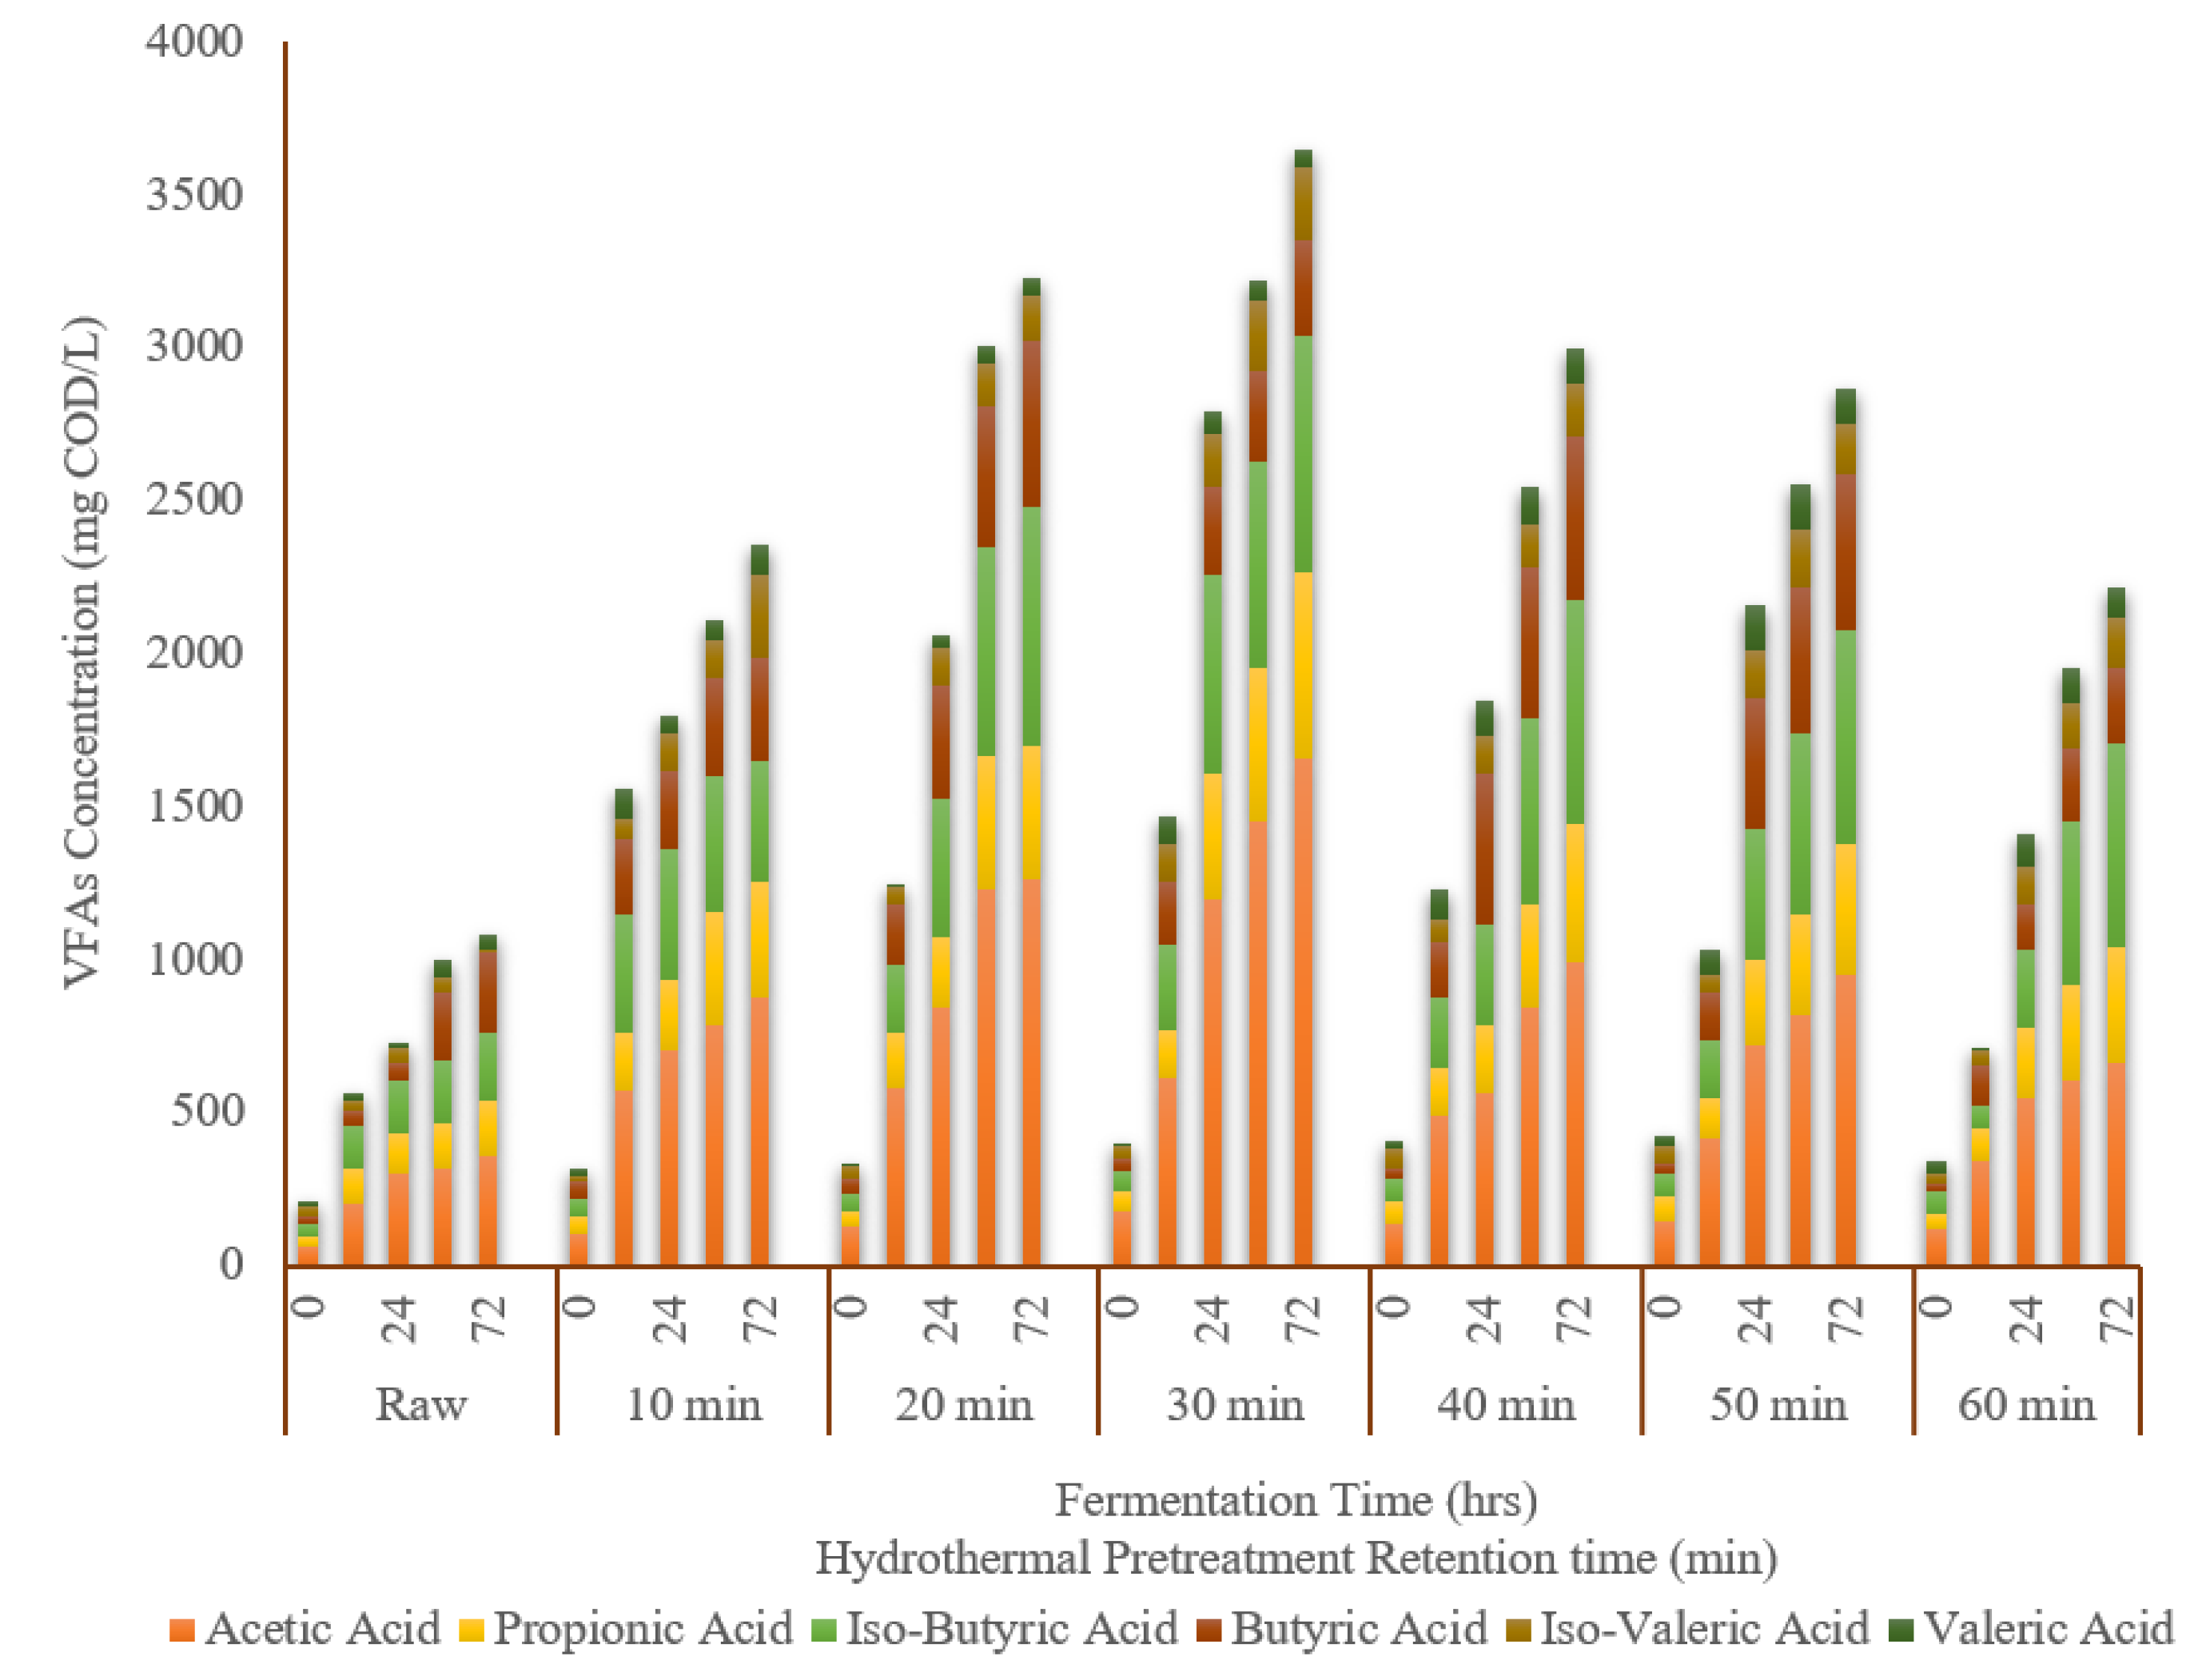
3.3.3. Volatile Fatty Acid Spectrum

The variations in volatile fatty acids at the end of the fermentation experiment are shown in Figure 4, where acetic acid, propionic acid, iso-butyric acid, butyric acid, iso-valeric acid, and valeric acid were detected. The most abundant type of VFAs for pretreated and raw TWAS during fermentation was acetic acid, followed by iso-butyric acid and propionic acid. The concentrations of all types of VFAs produced from the pretreated samples were higher than that of the raw sample. The concentration of all types of VFAs for the pretreated and raw sample increased with increasing the fermentation time, reaching their maximum values at the end of the tests (i.e., after 3 days). Acetic acid accounted for 30% to 46% of the total VFAs produced from the pretreated samples at different retention times. The concentration of acetic acid for the pretreated samples at the end of fermentation tests ranged from 660 mg COD/L to 1660 mg COD/L, which were 2–4 times higher than that of the raw sample (360 mg COD/L). The maximum acetic acid concentration of 1660 mg COD/L was achieved at the sample pretreated for 30 min. The trend in acetic acid production for all the pretreated samples during the fermentation was in agreement with the COD solubilization. Iso-butyric acid, the second most abundant type of VFA, was increased with increasing retention time, reaching the maximum of 770 mg COD/L at a 30 min retention time. Iso-butyric acid accounted for 17% to 30% of the total VFAs in different retention times, which was in most cases higher than that of the raw portion (21%). The iso-butyric acid concentration for the hydrothermally pretreated samples ranged from 400 mg COD/L to 770 mg COD/L at the end of the experiments. The third-highest acid was propionic acid. The trend in propionic acid production was similar to the above-mentioned two types of VFAs. The highest concentration of 610 mg COD/L was achieved for the 30 min HTP retention time at the end of the experiment. This concentration was three times higher than that of what was observed for the raw sample (180 mg COD/L). Although the concentration of propionic acid was enhanced by HTP and varied considering the HTP retention time, it had almost similar portions of total VFAs (14% to 17%) at all retention times, which was in most cases the same as the raw sample (17%). In general, the propionic acid contents at the end of the fermentation experiment for the pretreated samples were in the range of 230 mg COD/L to 610 mg COD/L.
Butyric acid production demonstrated different rates and trends compared to the other types of VFAs. The concentrations of butyric acid for the pretreated samples at the end of the fermentation experiments ranged from 310 mg COD/L to 540 mg COD/L, which were higher than that of the raw sample (260 mg COD/L), except for sample pretreated for 60 min (250 mg COD/L). Interestingly, the percentage of butyric acid to the total VFAs was different than all types of VFAs, having lower proportions compared to the raw sample. The highest concentration of butyric acid of 540 mg COD/L was achieved for the sample pretreated for 20 min.
The concentration of both valeric acid and iso-valeric acid for all the pretreated samples were also higher than that of the raw sample. The highest concentration of valeric acid of 120 mg COD/L was observed for the sample pretreated for 40 min at the end of the experiment, which was almost 2-times higher than that of the raw sample (44 mg COD/L). Though, in terms of its percentage compared to all other types of VFAs, it was the lowest portion of TVFAs (2–4%). The highest concentration of iso-valeric acid of 270 mg COD/L was achieved for the sample pretreated for 10 min, which was almost 22 times higher than that of the raw sample (12 mg COD/L). Except for the sample pretreated for 20 min, iso-valeric acid accounted for a lower percentage of TVFAs compared to the raw sample.
Considering the distribution of the VFA types with different hydrothermal retention times, it can be concluded that hydrothermal pretreatment retention time influences the amount of VFA production as well as the type of VFA. For example, the percentage of acetic acid and iso-butyric acid compared to the total VFAs for the hydrothermally pretreated samples at six retention times were higher than that of the raw sample, whereas it was almost the same percentage for propionic acid and valeric acid, and it was lower for butyric acid and iso-valeric acid. Nonetheless, the fermentation time did not have a significant influence on the variation in VFAs.
Zhang et al. (2019) studied the impact of the hydrothermal pretreatment of primary sludge (PS) and waste activated sludge (WAS) under 155–175 °C for 30 min prior to the fermentation process. Their results revealed a higher VFA yield of 220 mg COD/mg VSSadded compared to the raw of 150 mg COD/mg VSSadded; also, it was found that all types of VFAs had a slight increase due to the HTP, and the most abundant VFA types was butyric acid (2880 mg COD/L), followed by acetic acid (2650 mg COD/L) and then valeric acid (2520 mg COD/L). While, in our study, the VFAs were distributed slightly differently than in Zhang et al.’s study, and the VFA yields are lower due to the nature of the studied waste as they mixed PS with WAS. Morgan-Sagastume et al. (2011) studied the effect of the hydrothermal pretreatment of waste activated sludge in a full-scale plant [17]. They reported that the hydrothermal pretreatment enhanced the VFA yield 2–5-fold compared to the raw sample when they applied a temperature of 160 °C. Furthermore, they found that the hydrothermal pretreatment increased the VFA production rate 4–6-fold compared to the raw sample.

3.4. Biomethane Production

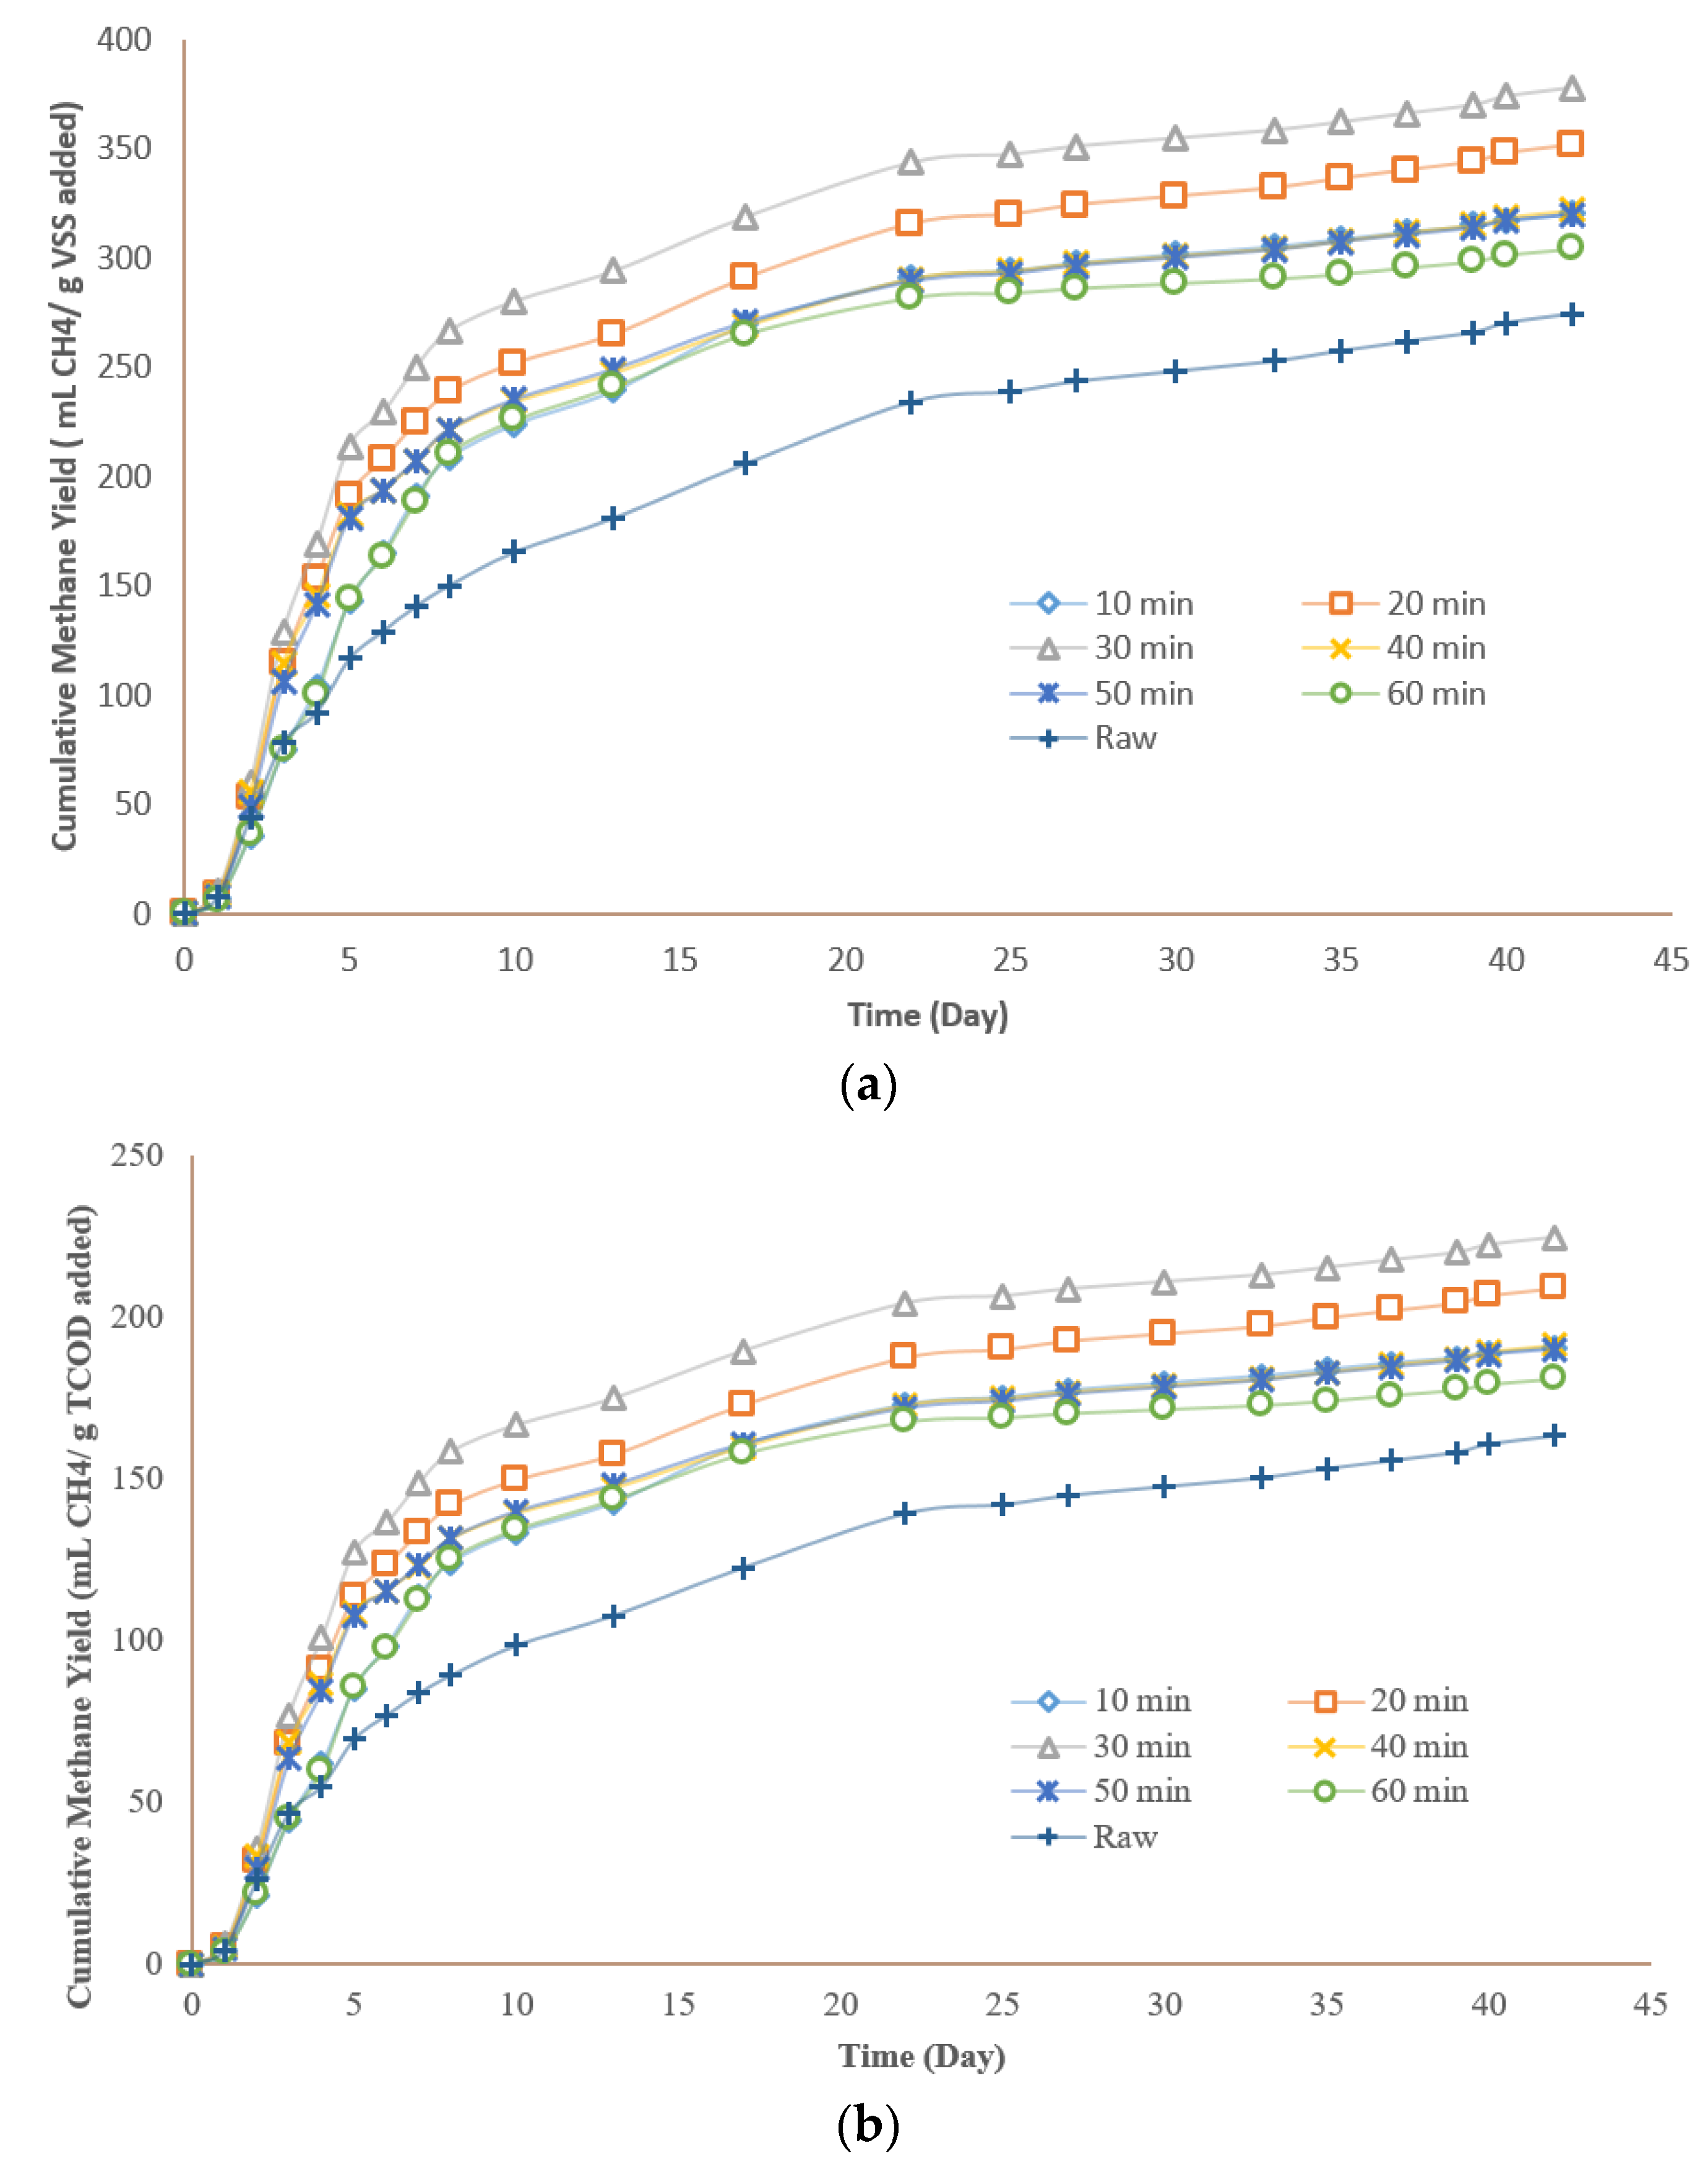
3.4.1. Methane Yields

Figure 5a depicts the cumulative methane yields as mL CH4/g VSS added and Figure 5b as mL CH4/g TCOD added for all the pretreated and raw samples. The BMP test results revealed that hydrothermal pretreatment at all retention times led to a higher methane yield in comparison to the raw sample. The trend of all pretreated samples was almost similar to the raw sample and no lag phase was spotted. This is due to the source of the substrate and seed incorporated in the current research study. The seed did not require time to adapt to the environment, since the seed and the substrate were obtained from the same wastewater treatment plant. In addition, the anaerobic digester of the plant was operating under anaerobic mesophilic conditions and the collected seed was used in the earliest time after receiving it from the plant, preventing any change in the microbial community.
The methane yield demonstrated a direct correlation of 0.43 with COD solubilization due to the hydrothermal pretreatment. The pretreated samples with the highest COD solubilization of 45% produced the highest methane yield among the other pretreated samples as well (377 ± 6 mL CH4/g VSS added). Considering also the hydrothermal pretreatment retention time, methane yield followed the same trend as COD solubilization, indicating that the retention time has a similar influence on solubilization and methane production.
The maximum methane yield of 377 mL CH4/g VSSadded, which corresponded to 225 mL CH4/g CODadded, was observed for the sample pretreated for 30 min compared to 163 mL CH4/g CODadded for the raw sample. After a retention time of 30 min, the methane yields started to decrease; these results were expected as the thermal pretreatment in a higher retention time is associated with a higher sever condition and consequently lower methane yield. The observed trend of methane production in this study was generally similar to the past studies. Zhang et al. (2016) reported similar results for the effect of hydrothermal retention time on methane production. They hydrothermally pretreated the TWAS at 165 °C for 15, 30, and 60 min, and underwent a biomethane production test. They found that the optimal methane yield of 182 mL CH4/g VSFeed was observed at a retention time of 30 min. They also reported that increasing the HTP retention time to 60 min resulted in slight reduction in methane yield (180 mL CH4/g VSFeed). The percentage improvement of methane yield for the hydrothermally pretreated samples are shown in Table 4. Methane yield increased by 17% for the sample pretreated for 10 min compared to the raw sample. The maximum increase in methane yield of 38% in comparison to the raw TWAS was achieved at a retention time of 30 min. This value declined to 17%, 16%, and 11% for a 40-, 50-, and 60-min retention time, respectively.

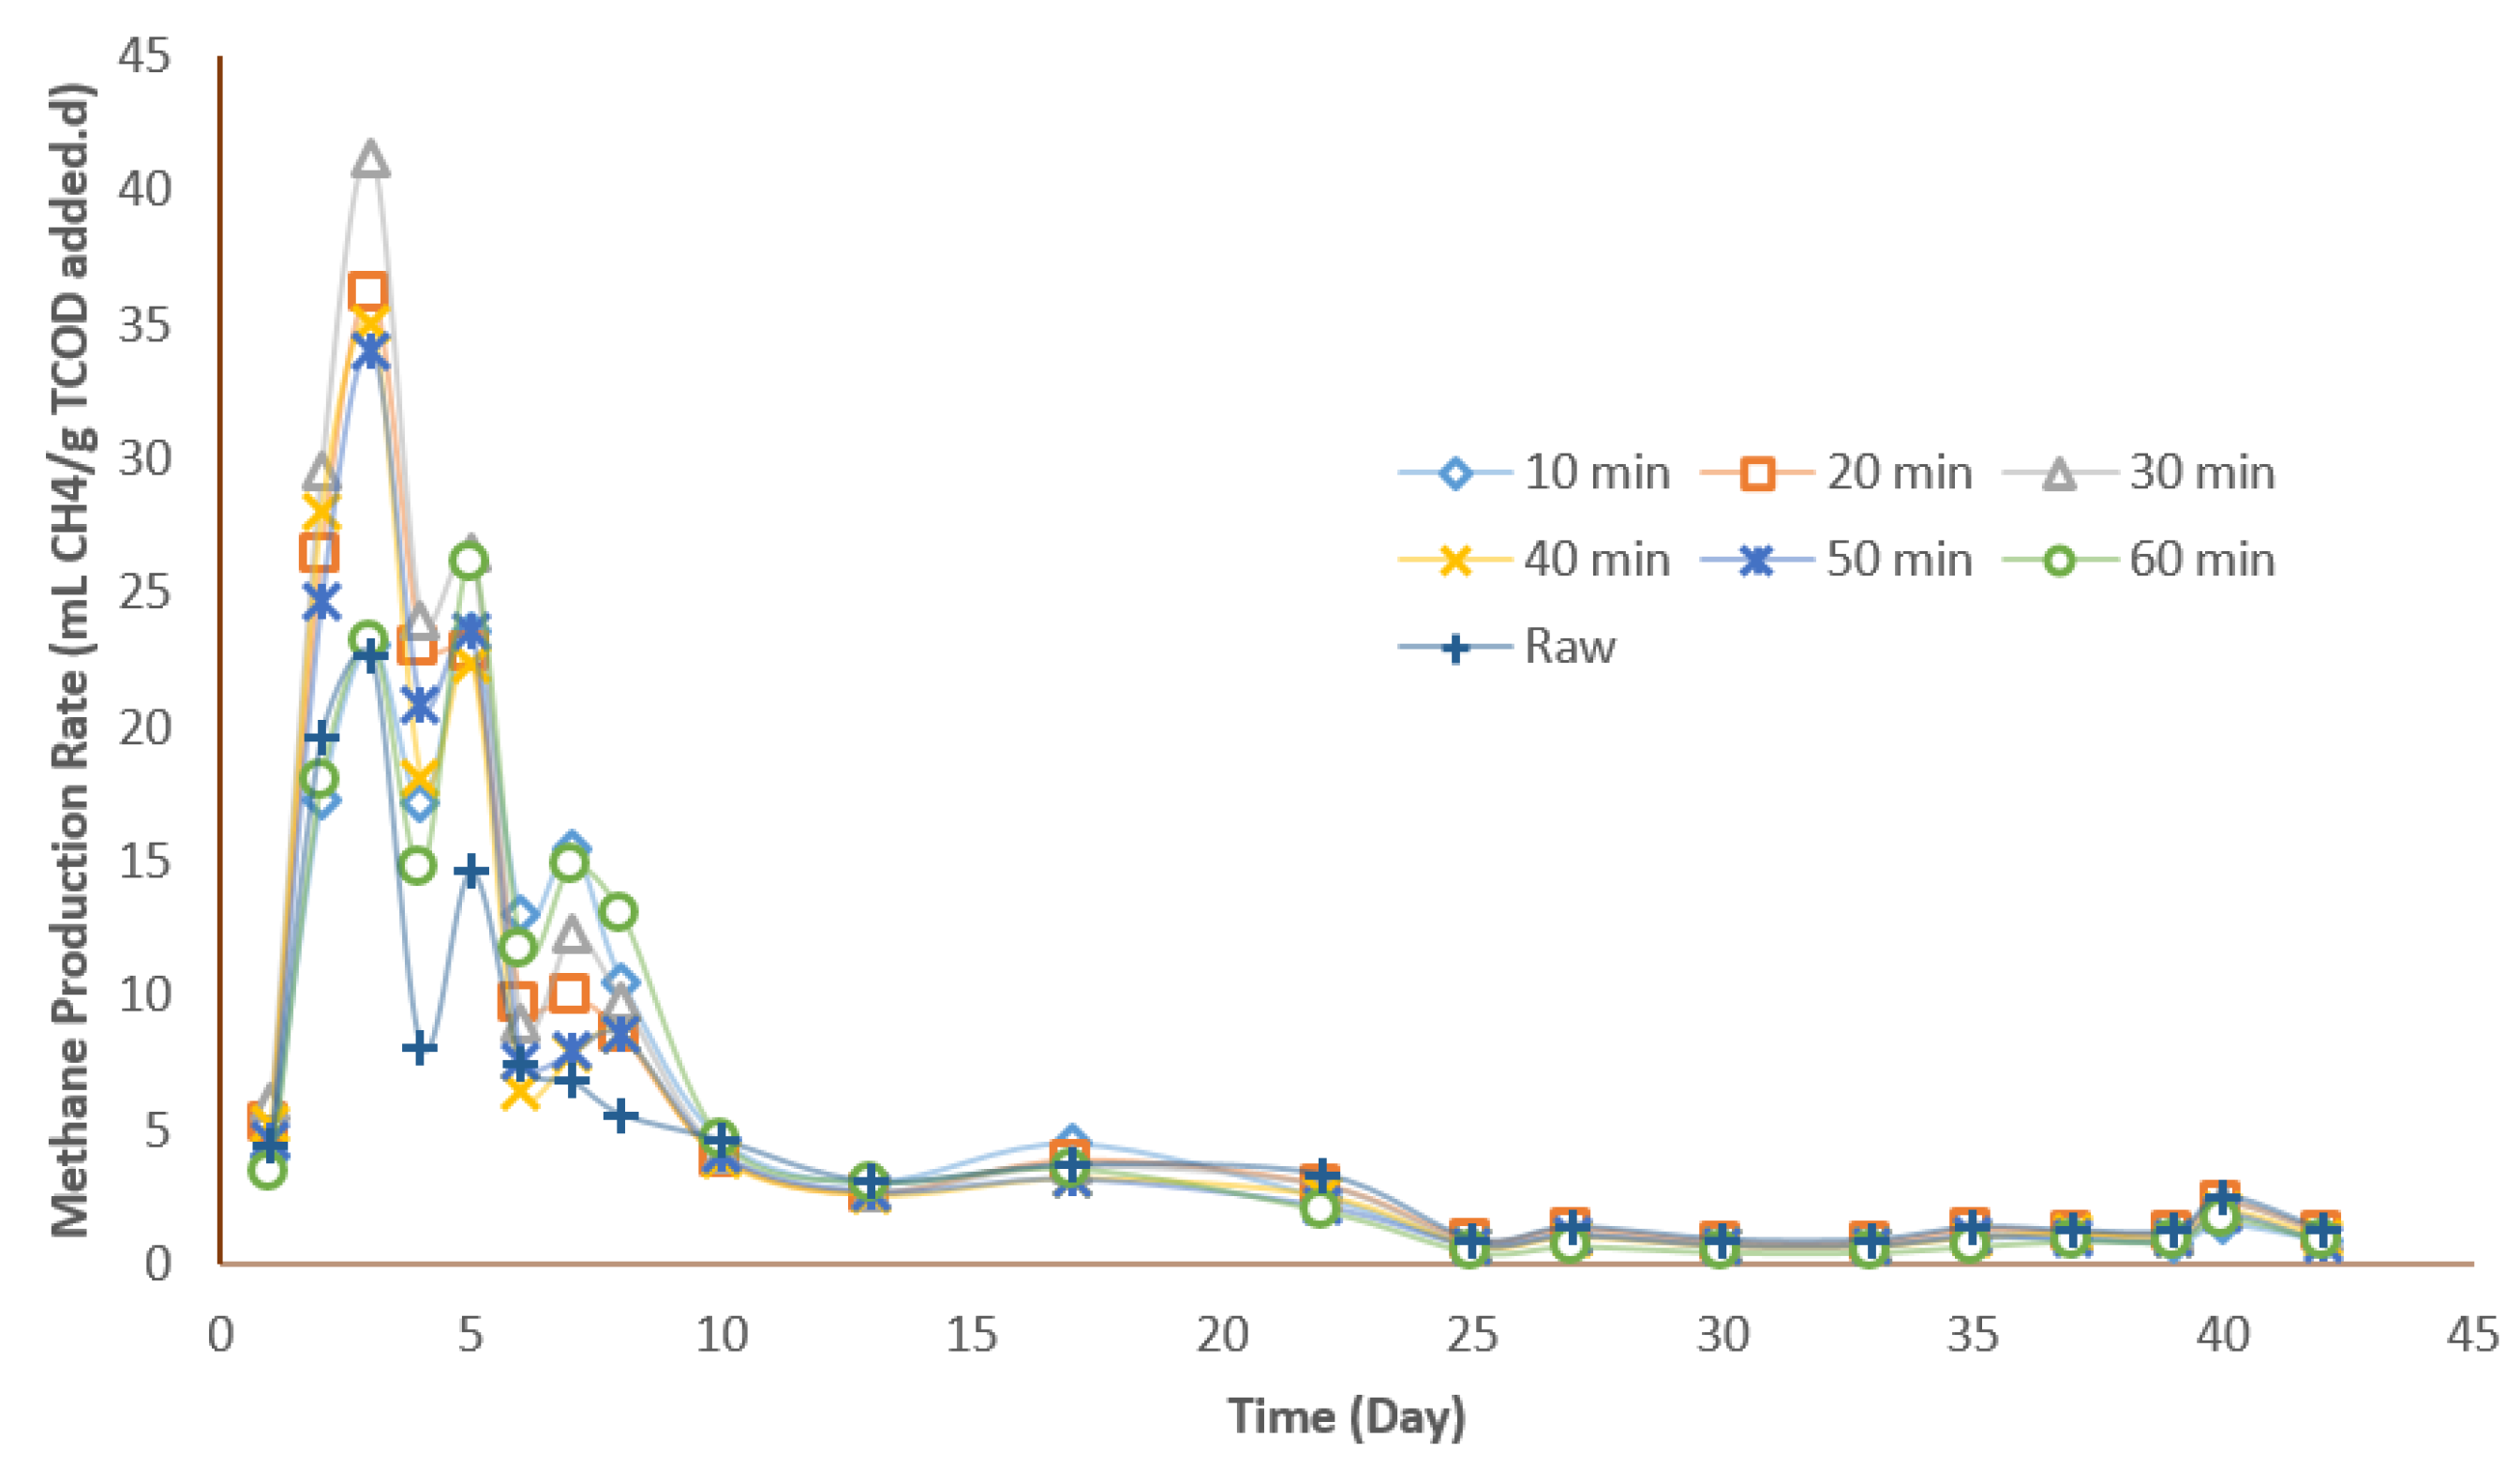
3.4.2. Methane Production Rate

As depicted in Figure 6, there were three methane production phases during the anaerobic digestion of the thermally pretreated TWAS and raw TWAS. The first phase indicated the maximum methane production on the third day, followed by minor peaks on the fifth and seventh days. The maximum methane production rate at phase one for the hydrothermally pretreated samples ranged between 23 and 41 mL CH4/g TCODadded per day. In this phase, except the lowest and highest HTP retention time of 10 and 60 min, all the hydrothermally pretreated samples demonstrated a higher methane production rate compared to the raw sample (23 mL CH4/g TCODadded per day). The maximum methane production rate of 41 was achieved at a retention time of 30 min. Phases two and three in day five and day seven were associated with a methane production rate ranging between 22 and 27 mL CH4/g TCODadded per day and 8 to 15 mL CH4/g TCODadded per day, respectively. The methane production rates in phases two and three for the hydrothermally pretreated TWAS were all higher than that of the raw sample.
Since hydrothermal pretreatment increases the soluble portion of the sludge by releasing the intracellular organic matter, extra readily biodegradable organic substances, such as SCOD, and VFAs become available for methanogenesis by microorganisms; consequently, in phase one, these readily biodegradable organics are consumed and results in a higher methane production. While, in phase two and three, the slowly biodegradable organics, such as organic particulate and refractory organic compounds produced during the hydrothermal pretreatment, begin to degrade; thus, these stages are associated with lower methane production rates [37]. These observations were in a line with Zhang et al.’s (2016) results regarding the maximum production rate for samples hydrothermally pretreated at 165 °C for 15, 30, and 60 min. Similar to our study, they reported the maximum methane production rate of sludge as 72.1 mL CH4/g VSFeed per day at 165 °C and 30 min. Zhang et al. (2019) also witnessed two peaks in the methane production at day 4 and day 6, which denotes the consumption of readily and slowly biodegradable organics generated due to hydrothermal pretreatment.

3.4.3. Anaerobic Biodegradability

The anaerobic biodegradability values of all hydrothermally pretreated and raw samples are shown in Table 4. The level of anaerobic biodegradability (BD) were calculated using the experimental biomethane yield (Bexp) and the theoretical methane yield (BTh) under defined experimental conditions. The data for anaerobic biodegradability reflects that the biodegradability values of the pretreated samples were higher than that of the raw sample. Biodegradability of the pretreated samples ranged from 45% to 56% while the raw sample had a 41% biodegradability. The highest biodegradability of 56% was achieved for the sample pretreated for 30 min, which was about 36% higher than that of the raw sample. This concludes that the hydrothermal pretreatment at 170 °C in general has a significant effect on the biodegradability of the TWAS compared to the raw sample, while a different HTP retention time does not have a significant impact on the biodegradability of the TWAS, as analyzed by one-way ANOVA (p > 0.005).

3.4.4. Kinetics

The predicted parameters based on the cumulative methane data of the batch test, such as the maximum methane production, maximum methane production rate, and lag phase from the Gompertz model and the first-order kinetic constants (k), are shown in Table 5. As shown in the table, the lag phase for the thermally pretreated samples was the same as for the raw sample, except for retention times of 10 and 60 min, with a 1-day higher lag phase. This indicates that the thermally pretreated samples rapidly adapted to the anaerobic environment. The coefficient of determination R2 values of the Gompertz model ranged between 0.998 and 0.999. The predicted maximum methane production rate of 41 mL CH4/d was achieved at a retention time of 30 min compared to 17 mL CH4/d for the raw sample. The first-order kinetics constant values of the hydrothermally pretreated samples were in the range of 0.15 d−1 to 0.21 d−1, which were higher than that of the raw sample (0.12 d−1; see Table 5). The highest k value of 0.21 d−1 for the pretreated samples was achieved at a retention time of 30 min and the lowest value of 0.15 d−1 was observed at the 10- and 60-min retention times. Generally, first-order kinetics were best fitted with the experimental data since the k values of the pretreated samples follow the same trend as the experimental data for methane production; all of them were higher than that of the raw sample, and the R2 of the kinetics constant ranged from 0.998 to 0.999. Rajput et al. (2018) also used the Gompertz model, and they found that the modified Gompertz model was the best fit with their experimental data. Elbeshbishy et al. (2011) also used a first-order model to compare the seed source and pre-incubation source for their biomethane potential test and the model was reported to fit well with their experimental data [38].

4. Conclusions

This study revealed the positive impact of a hydrothermal pretreatment on the fermentation and anaerobic digestion processes. It has been found that the optimum retention time for the hydrothermal pretreatment at 170 °C is 30 min. Applying the hydrothermal pretreatment beyond 30 min did not add any further benefits to the fermentation or to the anaerobic digestion processes. The hydrothermal pretreatment had more impact on the fermentation process compared to the anaerobic digestion. The overall COD solubilization was doubled for the pretreated samples compared to the raw one, and the methane yield increased by 38% after applying the hydrothermal pretreatment.

Author Contributions

Conceptualization, F.l.K. and E.E.; Methodology, F.l.K., N.P., A.E.S., E.E.; Formal Analysis, F.l.K., N.P., A.E.S.; Data Curation, F.l.K.; Writing—Original Draft Preparation, F.l.K.; Writing—Review & Editing, F.l.K., E.E.; Supervision, E.E.; Funding Acquisition, E.E. All authors have read and agreed to the published version of the manuscript.

Funding

This research and the APC were funded by Natural Sciences and Engineering Research Council (NSERC) grant number [RGPIN-2016-04122].

Acknowledgments

The authors would like to thank the Natural Sciences and Engineering Research Council (NSERC) for their financial support.

Conflicts of Interest

The authors declare no conflict of interest.

References

  1. Abudi, Z.N.; Hu, Z.; Xiao, B.; Abood, A.R.; Rajaa, N.; Laghari, M. Effects of pretreatments on thickened waste activated sludge and rice straw co-digestion: Experimental and modeling study. J. Environ. Manag. 2016, 177, 213–222. [Google Scholar] [CrossRef] [PubMed]
  2. Weiland, P. Biogas production: Current state and perspectives. Appl. Microbiol. Biotechnol. 2010, 85, 849–860. [Google Scholar] [CrossRef] [PubMed]
  3. Ariunbaatar, J.; Panico, A.; Frunzo, L.; Esposito, G.; Lens, P.N.L.; Pirozzi, F. Enhanced anaerobic digestion of food waste by thermal and ozonation pretreatment methods. J. Environ. Manag. 2014, 146, 142–149. [Google Scholar] [CrossRef] [PubMed]
  4. Appels, L.; Degrève, J.; Van der Bruggen, B.; Van Impe, J.; Dewil, R. Influence of low temperature thermal pre-treatment on sludge solubilisation, heavy metal release and anaerobic digestion. Bioresour. Technol. 2010, 101, 5743–5748. [Google Scholar] [CrossRef]
  5. Nazari, L.; Yuan, Z.; Santoro, D.; Sarathy, S.; Ho, D.; Batstone, D.; Xu, C.C.; Ray, M.B. Low-temperature thermal pre-treatment of municipal wastewater sludge: Process optimization and effects on solubilization and anaerobic degradation. Water Res. 2017, 113, 111–123. [Google Scholar] [CrossRef] [Green Version]
  6. Dahadha, S.; Amin, Z.; Bazyar Lakeh, A.A.; Elbeshbishy, E. Evaluation of Different Pretreatment Processes of Lignocellulosic Biomass for Enhanced Biomethane Production. Energy Fuels 2017, 31, 10335–10347. [Google Scholar] [CrossRef]
  7. Yesil, H.; Tugtas, A.E.; Bayrakdar, A.; Calli, B. Anaerobic fermentation of organic solid wastes: Volatile fatty acid production and separation. Water Sci. Technol. 2014, 69, 2132–2138. [Google Scholar] [CrossRef] [Green Version]
  8. Liu, H.; Han, P.; Liu, H.; Zhou, G.; Fu, B.; Zheng, Z. Full-scale production of VFAs from sewage sludge by anaerobic alkaline fermentation to improve biological nutrients removal in domestic wastewater. Bioresour. Technol. 2018, 260, 105–114. [Google Scholar] [CrossRef]
  9. Lee, W.S.; Chua, A.S.M.; Yeoh, H.K.; Ngoh, G.C. A review of the production and applications of waste-derived volatile fatty acids. Chem. Eng. J. 2014, 235, 83–99. [Google Scholar] [CrossRef]
  10. Ariunbaatar, J.; Panico, A.; Esposito, G.; Pirozzi, F.; Lens, P.N.L. Pretreatment methods to enhance anaerobic digestion of organic solid waste. Appl. Energy 2014, 123, 143–156. [Google Scholar] [CrossRef]
  11. Carrère, H.; Dumas, C.; Battimelli, A.; Batstone, D.J.; Delgenès, J.P.; Steyer, J.P.; Ferrer, I. Pretreatment methods to improve sludge anaerobic degradability: A review. J. Hazard. Mater. 2010, 183, 1–15. [Google Scholar] [CrossRef] [PubMed]
  12. Xiao, B.; Liu, J. Effects of various pretreatments on biohydrogen production from sewage sludge. Chin. Sci. Bull. 2009, 54, 2038–2044. [Google Scholar] [CrossRef] [Green Version]
  13. Chen, H.; Rao, Y.; Cao, L.; Shi, Y.; Hao, S.; Luo, G.; Zhang, S. Hydrothermal conversion of sewage sludge: Focusing on the characterization of liquid products and their methane yields. Chem. Eng. J. 2019, 357, 367–375. [Google Scholar] [CrossRef]
  14. Carlsson, M.; Lagerkvist, A.; Morgan-Sagastume, F. The effects of substrate pre-treatment on anaerobic digestion systems: A review. Waste Manag. 2012, 32, 1634–1650. [Google Scholar] [CrossRef]
  15. Barber, W.P.F. Thermal hydrolysis for sewage treatment: A critical review. Water Res. 2016, 104, 53–71. [Google Scholar] [CrossRef]
  16. Yang, S.; McDonald, J.; Hai, F.I.; Price, W.E.; Khan, S.J.; Nghiem, L.D. Effects of thermal pre-treatment and recuperative thickening on the fate of trace organic contaminants during anaerobic digestion of sewage sludge. Int. Biodeterior. Biodegrad. 2017, 124, 146–154. [Google Scholar] [CrossRef] [Green Version]
  17. Morgan-Sagastume, F.; Pratt, S.; Karlsson, A.; Cirne, D.; Lant, P.; Werker, A. Production of volatile fatty acids by fermentation of waste activated sludge pre-treated in full-scale thermal hydrolysis plants. Bioresour. Technol. 2011, 102, 3089–3097. [Google Scholar] [CrossRef]
  18. Bougrier, C.; Delgenès, J.P.; Carrère, H. Impacts of thermal pre-treatments on the semi-continuous anaerobic digestion of waste activated sludge. Biochem. Eng. J. 2007, 34, 20–27. [Google Scholar] [CrossRef]
  19. Higgins, M.J.; Beightol, S.; Mandahar, U.; Suzuki, R.; Xiao, S.; Lu, H.W.; Le, T.; Mah, J.; Pathak, B.; DeClippeleir, H.; et al. Pretreatment of a primary and secondary sludge blend at different thermal hydrolysis temperatures: Impacts on anaerobic digestion, dewatering and filtrate characteristics. Water Res. 2017, 122, 557–569. [Google Scholar] [CrossRef]
  20. Jeong, S.Y.; Chang, S.W.; Ngo, H.H.; Guo, W.; Nghiem, L.D.; Banu, J.R.; Jeon, B.H.; Nguyen, D.D. Influence of thermal hydrolysis pretreatment on physicochemical properties and anaerobic biodegradability of waste activated sludge with different solids content. Waste Manag. 2019, 85, 214–221. [Google Scholar] [CrossRef]
  21. Xue, Y.; Liu, H.; Chen, S.; Dichtl, N.; Dai, X.; Li, N. Effects of thermal hydrolysis on organic matter solubilization and anaerobic digestion of high solid sludge. Chem. Eng. J. 2015, 264, 174–180. [Google Scholar] [CrossRef]
  22. Choi, J.M.; Han, S.K.; Lee, C.Y. Enhancement of methane production in anaerobic digestion of sewage sludge by thermal hydrolysis pretreatment. Bioresour. Technol. 2018, 259, 207–213. [Google Scholar] [CrossRef] [PubMed]
  23. Zhang, D.; Jiang, H.; Chang, J.; Sun, J.; Tu, W.; Wang, H. Effect of thermal hydrolysis pretreatment on volatile fatty acids production in sludge acidification and subsequent polyhydroxyalkanoates production. Bioresour. Technol. 2019, 279, 92–100. [Google Scholar] [CrossRef] [PubMed]
  24. Zinatizadeh, A.A.; Mirghorayshi, M.; Birgani, P.M.; Mohammadi, P.; Ibrahim, S. Influence of thermal and chemical pretreatment on structural stability of granular sludge for high-rate hydrogen production in an UASB bioreactor. Int. J. Hydrogen Energy 2017, 42, 20512–20519. [Google Scholar] [CrossRef]
  25. City of Toronto Ashbridges Bay Wastewater Treatment Plant 2008 Annual Report; City of Toronto; Toronto, ON, Canada. 2009, pp. 1–66. Available online: https://www.toronto.ca/wp-content/uploads/2019/05/8f0f-2018-TAB-Annual-Report-FINAL-ecopy.pdf (accessed on 10 November 2020).
  26. Ding, L.; Cheng, J.; Qiao, D.; Yue, L.; Li, Y.Y.; Zhou, J.; Cen, K. Investigating hydrothermal pretreatment of food waste for two-stage fermentative hydrogen and methane co-production. Bioresour. Technol. 2017, 241, 491–499. [Google Scholar] [CrossRef]
  27. Kakar, F.l.; Koupaie, E.H.; Razavi, A.S.; Hafez, H.; Elbeshbishy, E. Effect of Hydrothermal Pretreatment on Volatile Fatty Acids Production from Thickened Waste Activated Sludge. Bioenergy Res. 2019, 13, 591–604. [Google Scholar] [CrossRef]
  28. Wang, Q.; Noguchi, C.; Hara, Y.; Sharon, C.; Kakimoto, K.; Kato, Y. Studies on anaerobic digestion mechanism: Influence of pretreatment temperature on biodegradation of waste activated sludge. Environ. Technol. 1997, 18, 999–1008. [Google Scholar] [CrossRef]
  29. Noike, T.; Endo, G.; Chang, J.-E.; Yaguchi, J.-I.; Matsumoto, J.-I. Characteristics of carbohydrate degradation and the rate-limiting step in anaerobic digestion. Biotechnol. Bioeng. 1985, 27, 1482–1489. [Google Scholar] [CrossRef]
  30. Pavlostathis, S.G.; Giraldo-Gomez, E. Kinetics of anaerobic treatment. Water Sci. Technol. 1991, 24, 35–59. [Google Scholar] [CrossRef]
  31. Jiang, J.; Zhang, Y.; Li, K.; Wang, Q.; Gong, C.; Li, M. Bioresource Technology Volatile fatty acids production from food waste: Effects of pH, temperature, and organic loading rate. Bioresour. Technol. 2013, 143, 525–530. [Google Scholar] [CrossRef]
  32. Dhar, B.R.; Elbeshbishy, E.; Hafez, H.; Lee, H.S. Hydrogen production from sugar beet juice using an integrated biohydrogen process of dark fermentation and microbial electrolysis cell. Bioresour. Technol. 2015, 198, 223–230. [Google Scholar] [CrossRef] [PubMed]
  33. Ding, H.H.; Chang, S.; Liu, Y. Biological hydrolysis pretreatment on secondary sludge: Enhancement of anaerobic digestion and mechanism study. Bioresour. Technol. 2017, 244, 989–995. [Google Scholar] [CrossRef] [PubMed]
  34. Yin, J.; Liu, J.; Chen, T.; Long, Y.; Shen, D. Influence of melanoidins on acidogenic fermentation of food waste to produce volatility fatty acids. Bioresour. Technol. 2019, 284, 121–127. [Google Scholar] [CrossRef] [PubMed]
  35. Motte, J.; Sambusiti, C.; Dumas, C.; Barakat, A. Combination of dry dark fermentation and mechanical pretreatment for lignocellulosic deconstruction: An innovative strategy for biofuels and volatile fatty acids recovery. Appl. Energy 2015, 147, 67–73. [Google Scholar] [CrossRef]
  36. Wang, L.; Li, A.; Chang, Y. Relationship between enhanced dewaterability and structural properties of hydrothermal sludge after hydrothermal treatment of excess sludge. Water Res. 2017, 112, 72–82. [Google Scholar] [CrossRef]
  37. Kim, D.; Lee, K.; Park, K.Y. Enhancement of biogas production from anaerobic digestion of waste activated sludge by hydrothermal pre-treatment. Int. Biodeterior. Biodegrad. 2015, 101, 42–46. [Google Scholar] [CrossRef]
  38. Elbeshbishy, E.; Hafez, H.; Dhar, B.R.; Nakhla, G. Single and combined effect of various pretreatment methods for biohydrogen production from food waste. Int. J. Hydrogen Energy 2011, 36, 11379–11387. [Google Scholar] [CrossRef]
Figure 1. (a) Concentration of soluble organic compounds; soluble protein and carbohydrates were measured as mg/L and the VFAs were measured as mg COD/L. (b) COD solubilization due to the HTP. (c) Percentage reduction in the total and volatile suspended solids after HTP.
Processes 08 01580 g001
Figure 2. (a) Effect of hydrothermal pretreatment on the particle size distribution. (b) d10, d50, and d90 (d10: the fraction of particles with diameters smaller than this value is 10%; d50: the fraction of particles with diameters smaller and larger than this value are 50%; d90: the fraction of particles with diameters below this value is 90%.
Processes 08 01580 g002
Figure 3. COD solubilization during fermentation for the raw and hydrothermally pretreated samples at 170 °C.
Processes 08 01580 g003
Figure 4. Volatile fatty acid variation for the raw and hydrothermally pretreated samples at 170 °C during fermentation, presented as mg COD/L.
Processes 08 01580 g004
Figure 5. Methane yields using a 170 °C hydrothermal pretreatment for all the pretreated samples: (a) as mL CH4/g VSS added; (b) as mL CH4/g TCOD added.
Processes 08 01580 g005
Figure 6. Methane production rate by time for the raw and pretreated TWAS at a 170 °C hydrothermal pretreatment.
Processes 08 01580 g006
Table 1. Studies on the hydrothermal pretreatment’s (HTP’s) impact on anaerobic digestion (AD)/fermentation of thickened waste activated sludge (TWAS).
Studies on Fermentation of Thickened Waste Activated Sludge
HTP ParameterPretreatment ConditionOptimum HTP ConditionEffect of Hydrothermal Pretreatment on Fermentation/ADReactor TypeReference
TemperatureRetention Time
Temperature155–175 °C30 minOne condition used in this temperature rangeVFAs increased by 44% compared to the raw—0.14 g VFAs COD/g TCOD for pretreatedSemi-continuous[23]
90 °C1 hOne condition used76% increase in H2 production compared to the raw—no VFA dataBatch[24]
160 °CNAOne condition usedVFAs increased by 50 to 80% compare to the raw—0.2 g VFAs COD/g TCOD for pretreatedSemi-continuous [11]
Studies on Anaerobic Digestion of Thickened Waste Activated Sludge
Retention time40–80 °C1–3–5 h-No significance effect on ultimate CH4Batch[5]
75–225 °C15–105 min180 °C–76 min23% higher methane production compare to rawBatch and Continuous [22]
60–180 °C15 min–60 h160–24 h10% higher compare to rawBatch[21]
200 °C0.5, 1.0, 2.0, 4.0, and 6.0 h200 °C–0.5 h242 mL CH4/g CODBatch[13]
Temperature100–220 °C30 min180 °C–30 min43–46% higher methane production compared to rawBatch[20]
130–170 °C30 min170 °C–30 min5–6% higher methane production compared to other conditionsSemi-continuous[19]
135–190 °C35–50 min190 °C–50 min25% higher methane production compare to raw Semi-continuous[18]
Table 2. Characteristics for the raw TWAS and the seed.
ParameterUnitsTWASSeed
Total CODmg/L34,400 ± 70021,000 ± 1200
Soluble CODmg/L2100 ± 180420 ± 20
TSS amg/L29,000 ± 50018,000 ± 300
VSS bmg/L20,800 ± 30012,200 ± 200
Total Carbohydratesmg/L1859 ± 150990 ± 80
Soluble Carbohydratesmg/L513 ± 20346 ± 9
Total Proteinmg/L2800 ± 703300 ± 50
Soluble Proteinmg/L600 ± 10350 ± 10
Ammonia Nitrogen NH3–Nmg/L17 ± 5670 ± 20
Alkalinitymg CaCO3/L1550 ± 3005800 ± 300
pH 6.7 ± 07.00 ± 1
a Total suspended solids; b volatile suspended solids.
Table 3. Overall solubilization (solubilization due to hydrothermal pretreatment and fermentation), VFA yields, and VFA composition percentage.
SamplesOverall SolubilizationVFA YieldsPercentage of VFA Variations
%(mg COD VFAs/g VSS Added(mg COD VFAs/g TCOD Added(mg COD VFAs/L Substrate Added)Acetic AcidPropionic AcidIso-Butyric AcidButyric AcidIso-Valeric AcidValeric Acid
170 °C–10 min52450272910037161714114
170 °C–20 min5661837412,9003914241744
170 °C–30 min6369942314,500461721972
170 °C–40 min6157434712,0003315241862
170 °C–50 min5554833211,4003315241864
170 °C–60 min5242425788003017301174
Raw3120612443003317212415
Table 4. Biomethane production parameters, including biomethane yield, biodegradability, maximum methane production rate, and percentage increase in methane production, compared to the control.
SampleUltimate Biomethane ProductionBiomethane YieldsBiodegradabilityMaximum Methane Production Rate (MMPR)Percentage Increase in Methane Production Compared to Control
(mL)(L CH4/L Feedstock)(mL CH4/g TCOD Added)(mL CH4/g VSS Added)(%)(mL/d)(%)
170 °C–10 min333 ± 196.7 ± 0.5190 ± 11320 ± 1548 ± 1.524 ± 0.217 ± 0.1
170 °C–20 min366 ± 147.3 ± 0.4209 ± 8351 ± 2152 ± 1.336 ± 0.428 ± 0.1
170 °C–30 min393 ± 67.9 ± 0.2225 ± 3377 ± 3556 ± 1.741 ± 0.938 ± 0.4
170 °C–40 min335 ± 176.7 ± 0.5191 ± 10321 ± 1848 ± 0.535 ± 0.317 ± 0.3
170 °C–50 min333 ± 66.7 ± 0.1190 ± 4319 ± 1248 ± 0.634 ± 0.316 ± 0.1
170 °C–60 min317 ± 176.3 ± 0.4181 ± 10304 ± 2245 ± 0.426 ± 0.111 ± 0.1
Raw286 ± 55.7 ± 0.1163 ± 3274 ± 541 ± 0.322 ± 0.1-
Table 5. Kinetics parameters from the Gompertz model and first-order kinetic model.
SampleGompertz ModelFirst Order Model
P (mL)Rm (mL/d)λ (d)R2k (d−1)R2
170 °C–10 min317 ± 1630 ± 21 ± 0.50.9990.15 ± 0.010.999
170 °C–20 min341 ± 1435 ± 20 ± 0.00.9990.19 ± 0.010.999
170 °C–30 min367 ± 641 ± 20 ± 0.00.9990.21 ± 0.010.999
170 °C–40 min312 ± 1633 ± 30 ± 0.00.9990.20 ± 0.010.999
170 °C–50 min311 ± 934 ± 10 ± 0.00.9990.19 ± 0.010.999
170 °C–60 min300 ± 1533 ± 11 ± 0.70.9990.15 ± 0.050.999
Raw267 ± 417 ± 10 ± 0.00.9990.12 ± 0.010.999
P = Maximum methane production; Rm = Maximum methane production rate; λ = Lag-phase time.
Publisher’s Note: MDPI stays neutral with regard to jurisdictional claims in published maps and institutional affiliations.

