Article

Risk Assessment of Potentially Toxic Elements Pollution from Mineral Processing Steps at Xikuangshan Antimony Plant, Hunan, China

1
College of Civil Engineering, Hunan University of Science and Technology, Xiangtan 411201, China
2
Hunan Provincial Key Laboratory of Shale Gas Resource Utilization, Hunan University of Science and Technology, Xiangtan 411201, China
3
School Computing, Engineering & Physical Science, University of the West of Scotland, Paisley PA1 2BE, UK
*
Author to whom correspondence should be addressed.
Processes 2020, 8(1), 29; https://doi.org/10.3390/pr8010029
Submission received: 11 November 2019 / Revised: 12 December 2019 / Accepted: 13 December 2019 / Published: 25 December 2019
(This article belongs to the Special Issue Gas, Water and Solid Waste Treatment Technology)

Abstract

:
We evaluated the direct release to the environment of a number of potentially toxic elements (PTEs) from various processing nodes at Xikuangshan Antimony Mine in Hunan Province, China. Sampling wastewater, processing dust, and solid waste and characterizing PTE content (major elements Sb, As, Zn, and associated Hg, Pb, and Cd) from processing activities, we extrapolated findings to assess wider environmental significance using the pollution index and the potential ecological risk index. The Sb, As, and Zn in wastewater from the antimony benefication industry and a wider group of PTEs in the fine ore bin were significantly higher than their reference values. The content of Sb, As, and Zn in tailings were relatively high, with the average value being 2674, 1040, and 590 mg·kg−1, respectively. The content of PTEs in the surface soils surrounding the tailings was similar to that in tailings, and much higher than the background values. The results of the pollution index evaluation of the degree of pollution by PTEs showed that while dominated by Sb, some variation in order of significance was seen namely for: (1) The ore processing wastewater Sb > Pb > As > Zn > Hg > Cd, (2) in dust Sb > As > Cd > Pb > Hg > Zn, and (3) surface soil (near tailings) Sb > Hg > Cd > As > Zn > Pb. From the assessment of the potential ecological risk index, the levels were most significant at the three dust generation nodes and in the soil surrounding the tailings reservoir.

1. Introduction

Pollution caused by nonferrous metal mining has attracted increasing attention from the public in China. With the issue of The 12th Five-Year Plan for Comprehensive Prevention and Control of Heavy Metal Pollution, the pollution caused by nonferrous metal mining, processing, and metallurgy has been again highlighted. As the country hosting the world’s largest reserves of Sb resources and production, the mining and processing industry has generated significant pollution loads on the local environment. Antimony ores are of various types, with many associated minerals and element associations [1,2]. Because of this, Sb ore processing is complex, during which PTEs associated with ore minerals can enter the environment, dispersing in air, soil, and groundwater and leading to migration in the food chain, accumulating in animals, plants, or the human body, and increasing risk to human health [3,4,5,6].
The characteristics of potentially toxic elements (PTEs) pollution in Xikuangshan (XKS) Antimony Mine in Lengshuijiang, Hunan Province, has recently been the focus of independent researches. It has been observed that the water, vegetable fields, farmland, and soil in the tailings zone around XKS Antimony Mine are all seriously polluted [7,8,9,10,11,12,13]. PTEs released to water and soil have directly polluted crops, with PTEs in edible parts of foliage vegetables, fruits, and rhizomes grown in the affected areas of XKS mining area found to be several times higher than those in non-affected areas, among which, Sb and As are the two PTEs dominating this contamination [11,14,15,16]. When an excessive amount of PTEs enter the human body, it will cause tumors and diseases to the liver, skin, and respiratory and cardiovascular systems, and even cancer [17,18,19,20,21]. Sb, As, Hg, and their compounds are listed as pollutants of priority interest by the United States Environmental Protection Agency [22] and the European Union [23]. However, while spatial assessment across the mine-affected region has identified indicative source–pathway–receptor links [24] a more detailed assessment of release from the antimony beneficiation process is missing.
We report here on an assessment of the release of PTEs in wastewater, dust, and solid waste derived from the beneficiation process. The results provide input to process review for environmental protection and occupational exposure routes for longer-term management of site operations.

2. Material and Methods

2.1. Description of Antimony Processing

The antimony processing plant is located in the north of XKS Antimony Mine, Hunan Province. It covers an area of about 18,000 m2 and has a beneficiation scale of 1500 t/d (ton/day). The beneficiation ore is of single antimony sulfide ore, a kind of low temperature hydrothermal filling deposit. It mainly consists of metal minerals (mainly stibnite (Sb2S3) and a small amount of antimony oxide (Sb2O3), pyrite (FeS2), pyrrhotite (Fe(1-x)S), etc.) and gangue minerals (mainly quartz (SiO2)), followed by calcite (CaCO3), barite (BaSO4), kaolin (Al2O3·SiO2·2H2O, gypsum (CaSO4·2H2O), etc.).
The antimony ore beneficiation process was carried out with the combined methods of manual separation, heavy medium separation, and flotation separation. In manual separation, the waste rock accounts for 40%~45%, and the recovery rate of antimony ores after manual separation is 92%~96%; in a heavy-medium separation, with ferrosilicon used as the weighting agent, the ores at the density of 2.62~2.64 t/m3 are picked out, with the discard and the recovery rate at this point being 40%~43% and 93%~95%, respectively. After the two separation steps, the enriched antimony ores are ground to the size of less than 0.074 mm for separation by flotation. During the flotation process, each ton of ore consumes 3.5 m3 water and produces 0.2 kg dust and 920 kg tailings.
Management of wastes and longer-term operation has been outlined in our previous studies [25]. The 120 years of operation at the site have resulted in widespread and sporadic deposition to fill voids generated during mining, covering an area of over 70 km2. Currently tailings are stored behind a reservoir after transport from separation and flotation processes by wastewater. The wastewater is discharged to the local river after minimal treatment.

2.2. Sampling Point Layout and Sample Collection

Sampling carried out for this study identified locations where the predominant discharge/generation of PTEs emissions occurs. Namely: (1) Wastewater generated at ore concentration, tailings accumulation, ore filtration, and tailings reservoir; (2) the production of dust is at the crushing and screening workshop, the fine ore bin, and from the concentrate transportation; and (3) the solid wastes are dominated by the tailings reservoir. Consequently, 24 samples were collected: 12 Wastewater samples were collected from the ore concentrate tank, ore concentrate filter tank, tailings concentration tank, and tailings reservoir. Three separate samples were collected at random from each of the 4 locations (W1~W3, W4~W6, W7~W9, and W10~W12, respectively). Six dust samples with duplicates were collected from the 3 locations (crushing and screening workshop, fine ore bin, and concentrate transportation, numbered D1–D2, D3–D4, and D5–D6, respectively). Three samples were collected from the surface of the tailings reservoir (S1–S3) and three samples of surface soil (0–20 cm in depth) were collected from around the tailings reservoir (S4–S6). Each solid sample was a composite from 3 subsamples mixed together in the field to make total bulk of 1 kg.
The water samples were immediately packed into rinsed pollution-free polyethylene plastic bottles, acidified with HNO3, sealed, and stored in a portable thermostated cooler at <4 °C. The dust, tailings, and soil samples collected were sealed in pollution-free polyethylene plastic bags and transported to the laboratory.

2.3. Sample Preparation and Testing

The solid samples (dust, tailings, and soil) were naturally air dried in the laboratory and ground to particle size less than 0.074 mm for later study. The PTEs were determined by hydride generation-atomic fluorescence (AFS-9700, Beijing Haiguang, China) after the digestion of solid samples (dust, tailings, and soil), and conditioning of water samples. Solid materials (0.10 g) were digested in triplicate as follows: 5 mL of concentrated HNO3 and 0.5 mL of HF in Teflon beakers for 12 h at 170 °C followed by cooling and addition of 1 mL of 30% H2O2 and 30 min later 10 mL of 5% v/v HNO3 before sample filtration with a 0.2 μm polyethylene film injection filter. Finally, ultrapure water was added to the samples to a volume of 50 mL and stored at 4 °C before analysis. The acidified water samples were filtered through a 0.2 μm polyethylene film injection filter before analysis.

2.4. Quality Control

In order to ensure data accuracy in the analysis process and stability of test equipment, the standard reference soil (GBW07406) from China’s National Institute of Metrology was treated in the same way as the dust (tailings, soil) samples, and the recovery rates of Sb, As, Hg, Pb, Cd, and Zn in standard reference materials were 95%–106%, 94%–107%, 94%–104%, 97%–105%, and 91%–105%, respectively. Calibration standards were produced after dilution of stock multi-element solution (reference) At the same time, reagent blanks were included in each batch of analysis samples, and 20% of the samples were remeasured, with RSD (relative standard deviation) remeasurement less than 10%.

2.5. Evaluation Method of PTEs Pollution

The pollution level of PTEs in the antimony beneficiation process was comprehensively evaluated by the pollution index method and potential ecological risk index method, respectively.

2.5.1. Pollution Index (PI)

To evaluate PTEs levels, the pollution index was calculated [26].
Pollution   index   ( P I ) = C i C b
in which C i is element i concentration in the samples, and C b is its environmental background value [27,28,29].
The PI of PTE was classified as non-pollution (PI ≤ 1), which indicated that the level of metals was below the threshold concentration but did not necessarily mean there was no pollution from anthropogenic sources or other enrichment over the background, low level of pollution (1 < PI ≤ 2), moderate level of pollution (2 < PI ≤ 3), and high level of pollution (PI > 3) [30].

2.5.2. Potential Ecological Risk Index (RI)

Potential ecological risk index method links the PTEs’ content, toxicity, and ecological and environmental effect, and evaluates the potential ecological risks of PTEs. It has become the main method to evaluate the ecological hazards of PTEs in the environment and has previously been used to spatially screen soil contamination in the wider area of the mining site [24,25].
The potential ecological risk index was performed using the following equations [31].
R I = i = 1 n E r i
E r i = T r i C r i
C r i = C m i C n i  
where C r i is the single factor pollution index of element i, C m i is the ith metal concentration in the sample, C n i is the background value of the target element, and T r i is the toxic response factor for each of the six metals: Sb (19), As (10), Hg (40), Pb (5), Cd (30) and Zn (1) [32,33]. E r i is the single factor potential risk factor. According to E r i , the sediments or soils were categorized into five levels: (1) E r i ≤ 40, low risk; (2) 40 < E r i ≤ 80, moderate risk; (3) 80 < E r i ≤ 160, moderate to high risk; (4) 160 < E r i ≤ 320, high risk; (5) E r i > 320, very high risk. RI is Multi-factor and comprehensive potential ecological hazard index. According to RI, the sediments or soil were categorized into four levels: (1) RI ≤ 150, low risk; (2) 150 < RI ≤ 300, moderate risk; (3) 300 < RI ≤ 600, high risk; (4) RI > 600, very high risk.

3. Results and Discussions

3.1. Characteristics of PTE Pollution in Wastewater

In light of Technical Guidelines for Environmental Impact Assessment Surface Water Environment (HJ/T 2.3-1993) and related literature [34,35] the significance of pollution by As, Hg, Pb, Cd, and Zn was referenced against Quantitative IV water quality standard in Surface Water Environmental Quality Standards (GB3838-2002) as the reference value for ecological risk assessment [27], and for Sb, a value of 0.005 mg·L−1 was used as the reference value [28].
The results summarized in Table 1 show that the concentration of Sb, As, and Zn in the wastewater from the whole antimony ore beneficiation process exceeded the relevant standards, with the filtration tank the most contaminated by Sb, As, and Pb. The average concentrations of Sb, As, and Pb in wastewater were 4.415 mg·L−1, 1.006 mg·L−1, and 1.536 mg·L−1, respectively. The maximum concentration of Sb, As, and Pb in wastewater were found at sampling sites W4, W5, and W6, respectively, and the values for Sb, As, and Pb were 950, 10, and 30 times higher than the reference value, respectively. The pollution load for As and Pb in the tailings reservoir, tailings tank, and ore concentrate tank was also serious, their average values being 3.414 mg·L−1, 0.772 mg·L−1, and 0.255 mg·L−1, respectively.
The wastewater from the tailings reservoir was most seriously polluted by zinc, with its average concentration of 10.677 mg·L−1 and a maximum of 11.065 mg·L−1 at sampling point W12, which is 8.3 times higher than the standard. In addition, the wastewater from concentrate filtration equipment was also seriously polluted by zinc, whose average concentration reached 9.026 mg·L−1. The concentration of Hg and Cd in wastewater from antimony ore beneficiation process conformed to the standard.
PTEs pollution index (PI) and potential ecological risk index (Eir, RI) of wastewater produced at each stage are shown in Figure 1 and Figure 2. The results of Figure 1 show that Sb pollution was the most serious in the wastewater from the Sb beneficiation process overall, with a PI of ~400 to >980 and for As and Zn, ~7–>10 and >3–>5 respectively. In the case of Pb, pollution impact was more variable across the process, i.e., the tailings concentration tank (pollution-free), tailings reservoir (low-medium pollution), concentrate concentration tank, and concentrate filter tank (serious pollution), while for Hg and Cd, little pollution impact existed. The order of pollution significance in wastewater was: Sb > Pb > As > Zn > Hg > Cd.
Figure 2 shows the individual element (Eir) and composite (RI) values for ecological risk of the PTES in wastewater for this study. Unsurprisingly, Sb had the greatest contribution to the composite ecological risk at all four wastewater sampling points. The RI was dominated by Sb, contributing 98–99% of the compound potential ecological risk (RI) at each sampling location, with As and Pb showing moderate risk. Overall the RI ranged between 8000–17,000, highlighting incredibly high environmental risk.

3.2. Pollution Characteristics of PTEs in Dust

At present, there is no unified evaluation standard for PTEs pollution in dust at home or abroad, and the reference values are quite different [36]. Some scholars select typical reference points to evaluate PTEs’ content according to the evaluation objects [37], but most scholars use local soil background values as reference [38,39,40]. Hunan is a calcareous lithosol region, and the background value of Sb, Pb, Zn, and other elements in soil and the ore itself is relatively high. Therefore, the background content of soil in Hunan Province was selected as the standard reference.
The PTEs’ content of samples from the dust-producing processes is shown in Table 2. It can be seen from the table that the pollution of Sb, As, Hg, Pb, Cd, and Zn in the dust was serious, for all PTEs. Among them, Hg and Cd reached maximum values in the crushing and screening workshop, while for Sb, As, Pb, and Zn the dust of fine ore bin presented the highest concentrations.
The pollution index for dust is shown in Figure 3 and, as expected, Sb was the most enriched in the dusts with an average pollution index >680, with order of magnitude lower values for As, Cd, Pb, Hg, and Zn (69.6, 57.2, 11.1, 11.0, and 6.7), all indicating significant if not extreme pollution.
The Eir of each PTE (Sb, As, Hg, Pb, Cd, Zn) in the dust and the potential ecological risk index (RI) of PTEs (Figure 4) were calculated. The results indicated the following: In the dust, Sb contributed the majority of the ecological risk in the three nodes (crushing and screening plant, fine ore bin, and concentrate transportation route); the Eir values of Sb, As, and Cd were higher than 320 in the three nodes, suggesting very high risk; for Hg, its Eir value was higher than 320 in the crushing and screening plant and fine ore bin, suggesting very high risk, and its Eir value was lower than 320 (Eir = 236) in the concentrate transportation route, indicating high risk; for Pb, its Eir value was higher than 320 (Eir = 415) in the crushing and screening plant, indicating very high risk, and its Eir value was lower than 80 in the fine ore bin and transport routes of mine, suggesting moderate risk. The Eir value for Zn was lower than 40 in the three nodes, which suggested low risk. As can be seen from Figure 4, the pollution made by the three dust-producing nodes was serious, dominated by Sb but depending on location, and different PTEs varied in their individual contribution to the RI. The potential ecological risk index of the crushing and screening workshop, fine ore bin, and concentrate transportation route reached >14,000, >17,000 and >15,000, respectively, which means that they are all seriously polluted. The pollution intensity of PTEs in different nodes was: Fine ore bin > concentrate transportation route > crushing and screening workshop.

3.3. Pollution Characteristics of PTEs in Tailings

The analysis results of PTEs’ content in tailings are shown in Table 3. The results show that the contents of Sb, As, and Zn in tailings were relatively high, with their average contents being 2674.790, 1040.288, and 590.472 mg·kg−1, respectively. The reason may be that the mineral components of the ore were mainly stibnite, accompanied by toxic sand, pyrite, and sphalerite, in which Sb, As, and Zn were most abundant, with significant contribution from Hg, Pb, and Cd.
The PTEs associated with the tailings can migrate to the surrounding soil through dissolution, leakage, and weathering, resulting in pollution over much wider areas [4,24,41,42]. To understand and more fully evaluate the pollution characteristics of tailings in this area more thoroughly, the PTEs’ content in the surface soil around the tailings reservoir was also analyzed in this study. Based on the soil background value of Hunan Province, the pollution index method and potential ecological risk assessment index method were used to evaluate the pollution characteristics (see Table 4 and Table 5). Table 4 shows significant enrichment in Sb, As, Hg, Pb, Cd, and Zn in the soil samples. The average contents of Sb, As, Hg, Pb, Cd, and Zn were 1654.462, 105.399, 2.242, 39.311, 1.185, and 523.104 mg·kg−1, respectively. The order of contents in descending order was Sb, Zn, As, Pb, Hg, and Cd, which was similar to the PTEs in the tailings, highlighting an obvious source link.
As can be seen from Table 5, the PI of Sb had a maximum value of 555.18, higher than the standard [29], and the PI of As, Hg, Cd, and Zn also exceeded 5, indicating high level of pollution, while the PI of Pb was 1.46, indicating low level of pollution. The Eir values of Sb, Hg, and Cd all exceeded 320, indicating very high risk. The Eir value of As was 75.20, indicating moderate risk. The Eir values of Pb and Zn were less than 40, indicating low risk. The RI value of the soil was >13,000, indicating that the soil was at very high risk. Therefore, antimony tailings exerted great influence on the surrounding soils, and should be paid special attention by relevant departments.

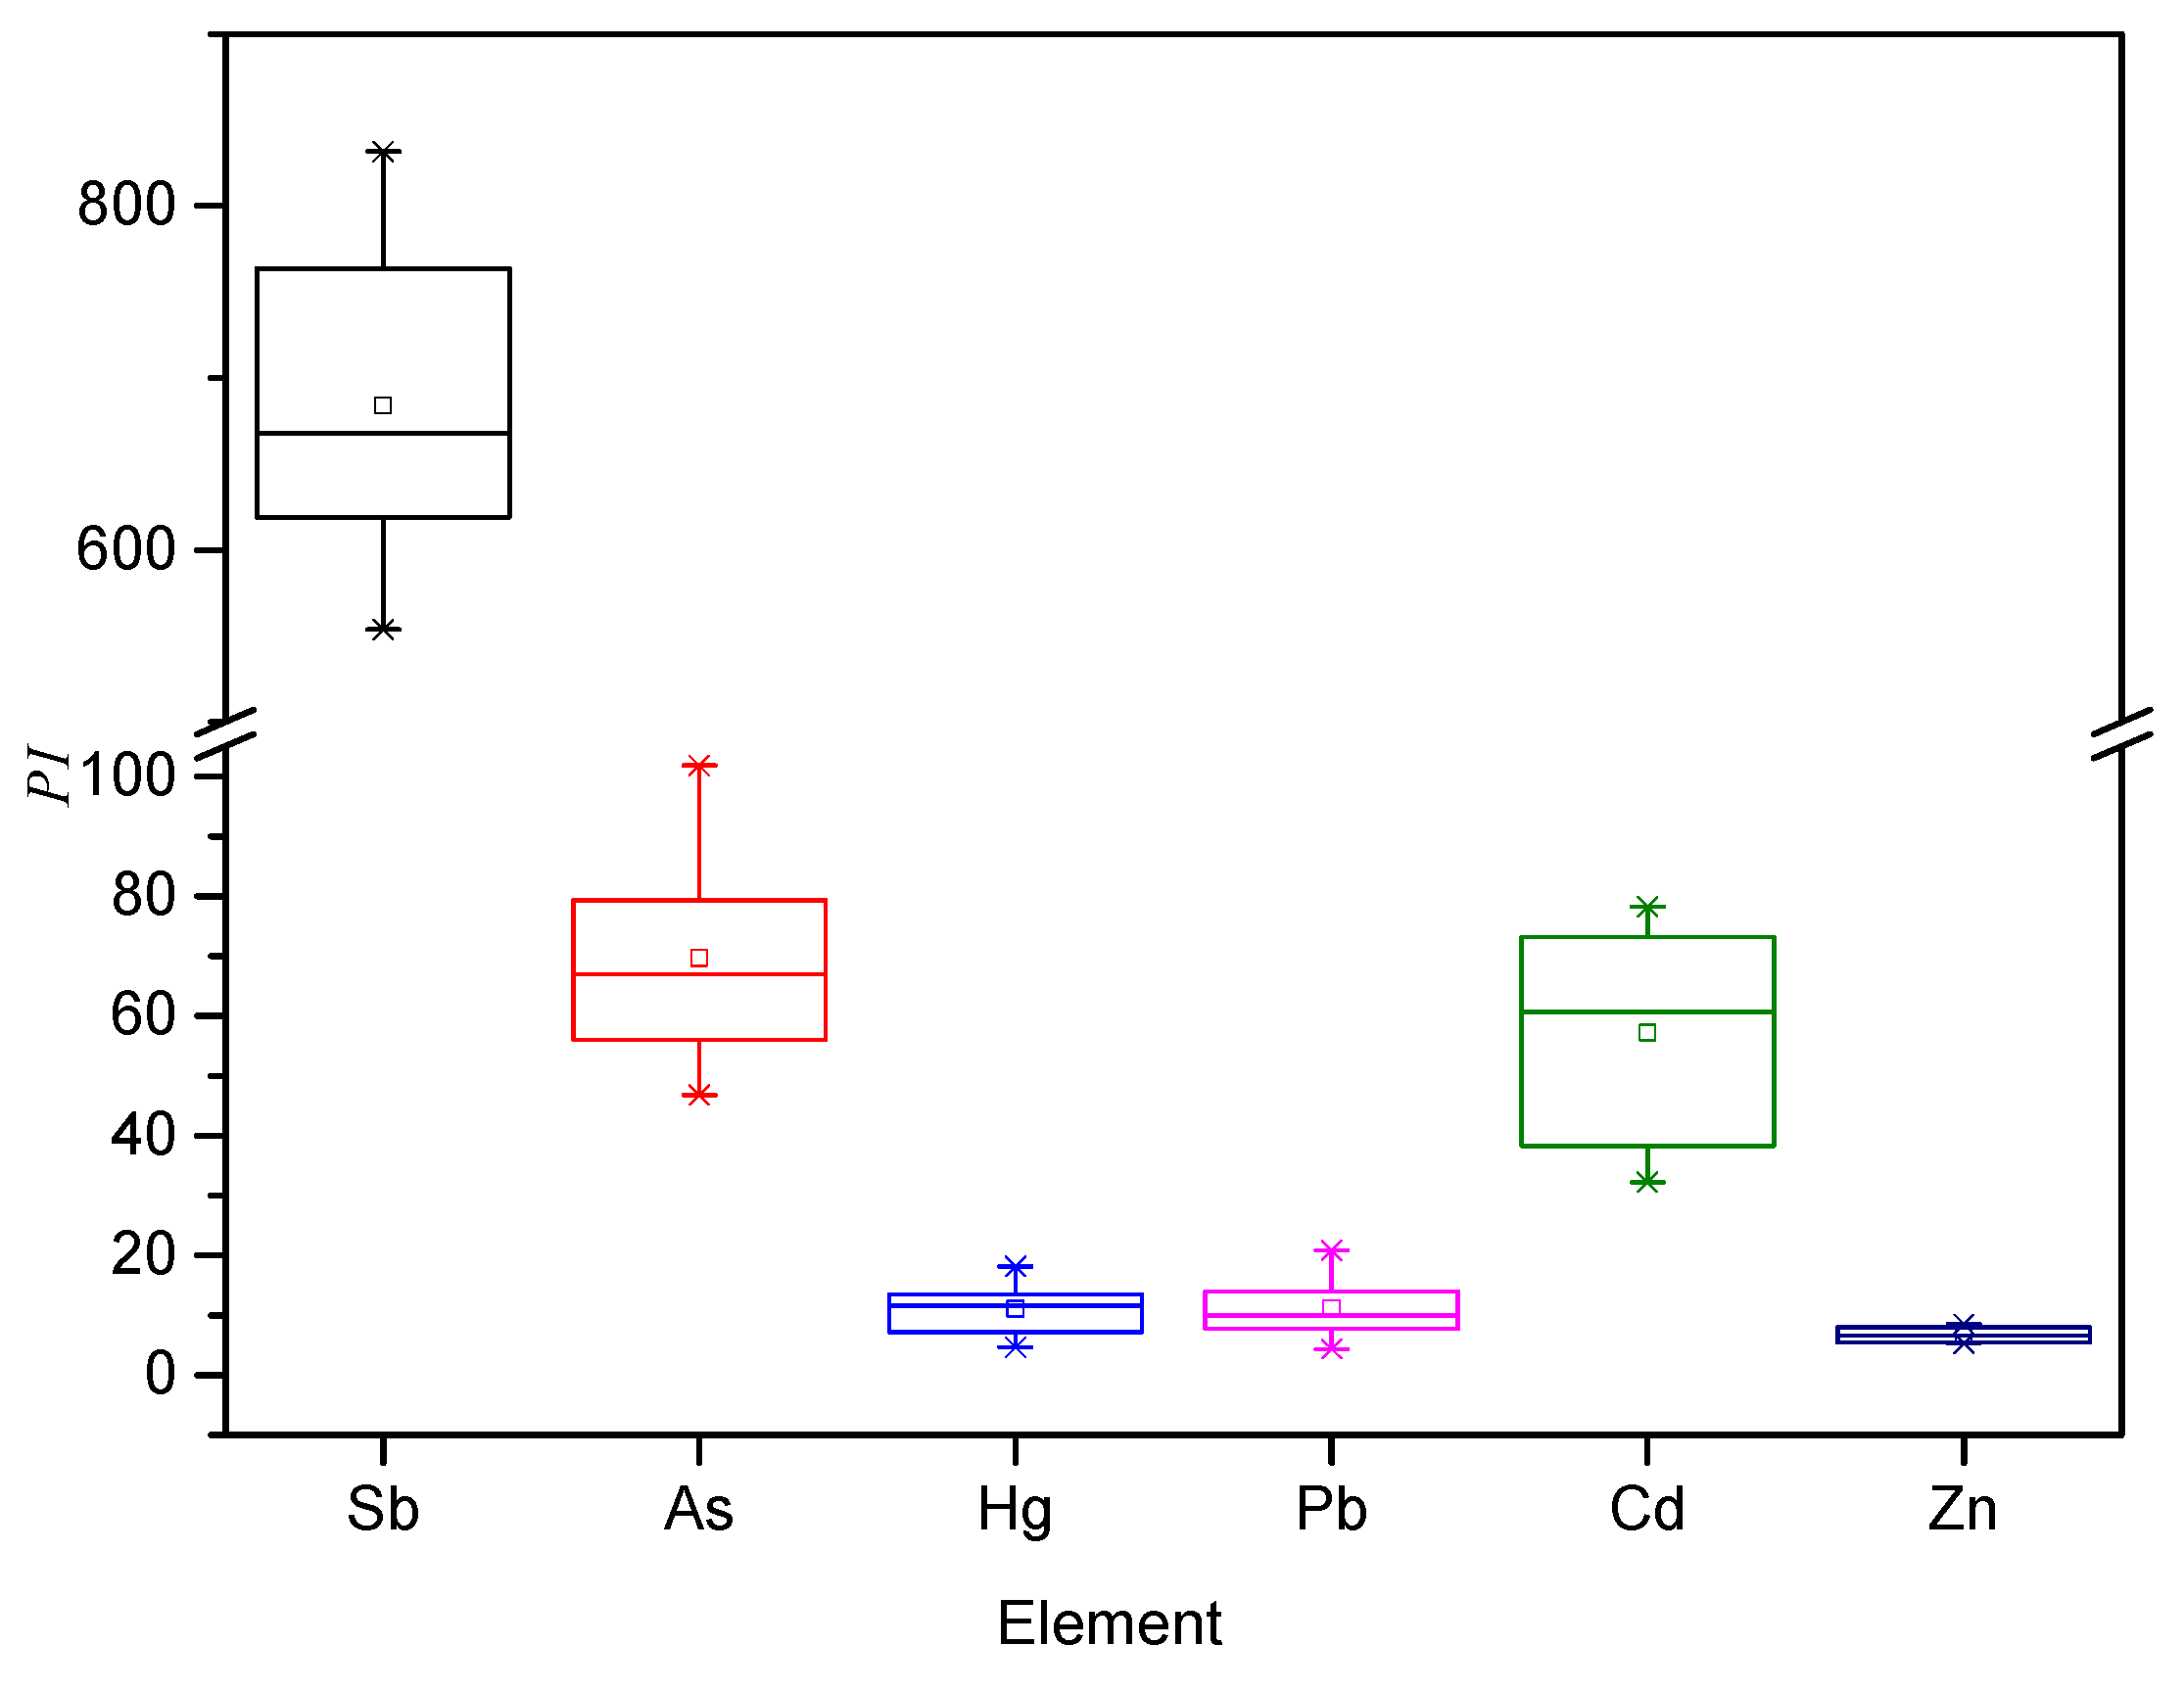
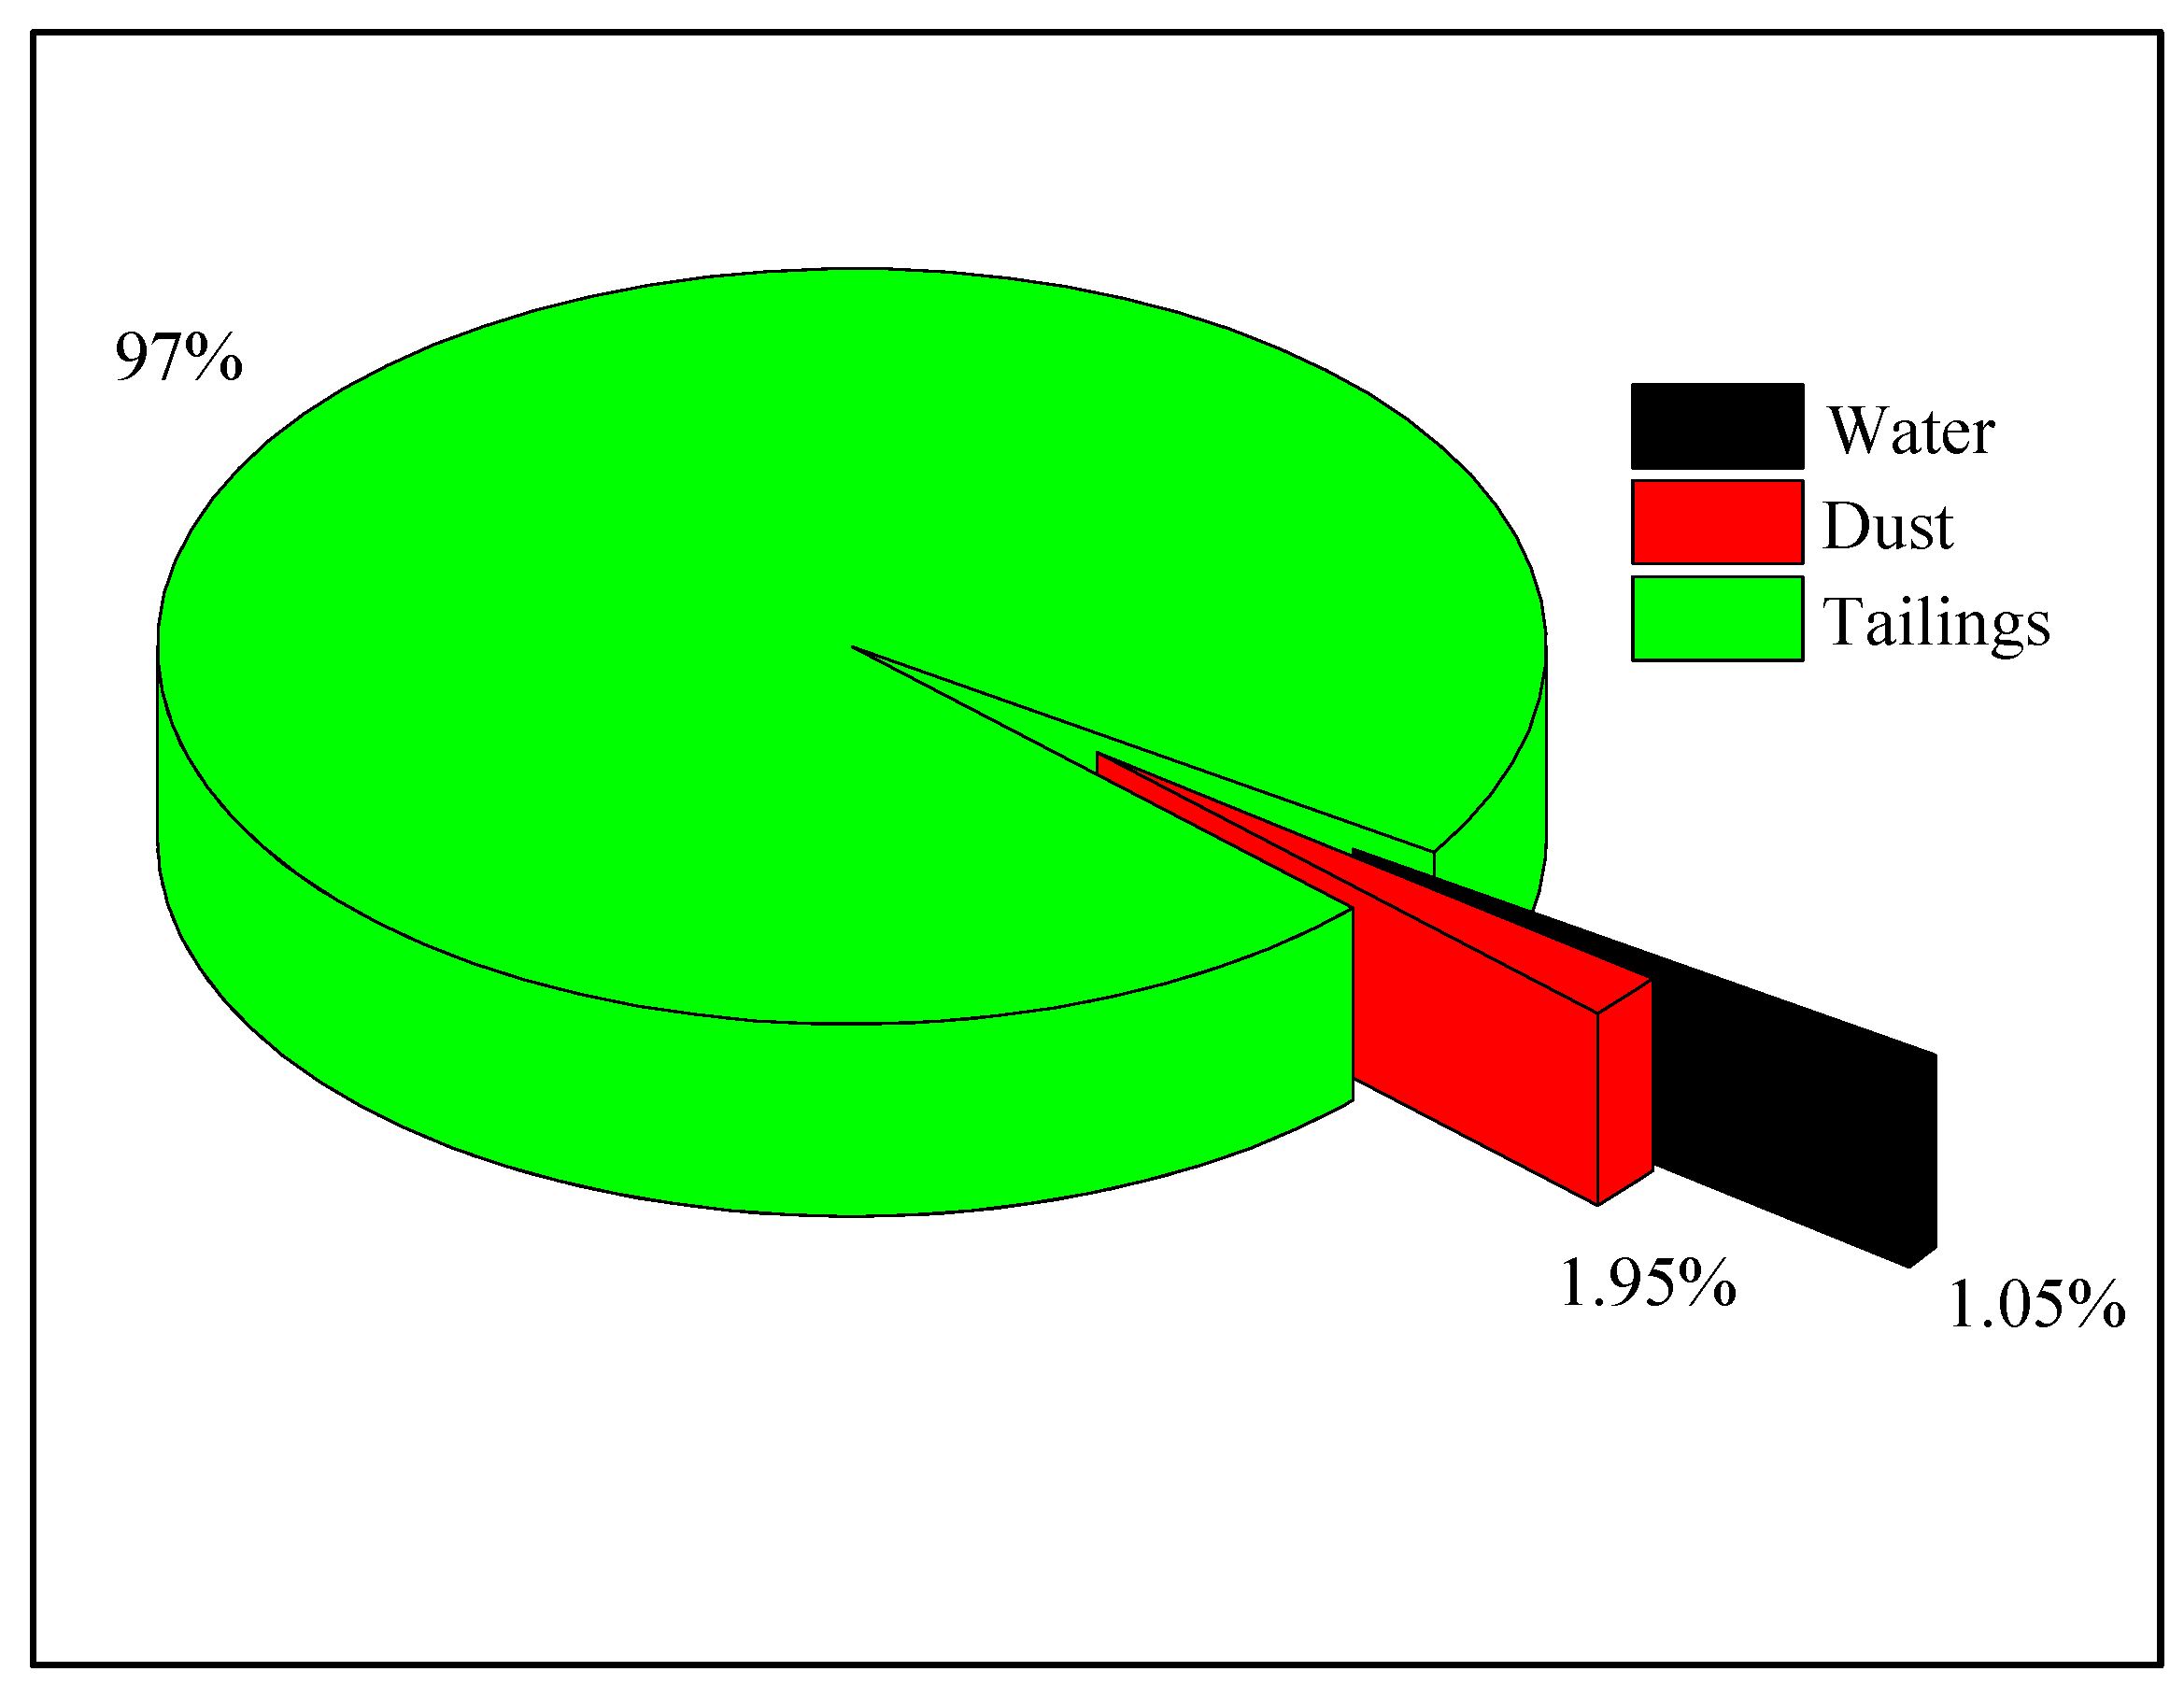
3.4. Comparison of the Total Amount of PTEs

The release of PTEs in different stages in the Sb processing plant is shown in Figure 5. The pollution was dominated by Sb, As, and Zn with tailings contributing the most to risk. At the same time, the production process presented variation in contribution from individual PTEs.
This contribution is emphasized in Figure 6, where tailings accounted for 97.00% of the total amount of PTEs in the wastes. The results show that PTEs in tailings played a key role in the pollution degree of PTEs in the whole antimony beneficiation industry. With the increasing awareness of environmental protection and the development and application of integrated recovery and utilization of technology, antimony ore tailings are one of the key links of clean production and nonwaste (or less waste) mining, which is the most effective method to reduce the harm of antimony ore tailings.

4. Conclusions

The evaluation of processing wastes in the Sb benefication steps at the XKS site confirmed the significance of the tailings-hosting residues from incomplete ore processing. These materials contribute more widely to environmental contamination as seen in localized soil assessment and agree with findings of other studies on widespread environmental contamination in the wider region. In addition, the significance of dust and wastewater as pollution pathways was confirmed and the magnitude, while lower than for tailings, was still of potential ecological significance. The observation that the partition of PTEs other than Sb between these pathways varies from element to element is of value in considering treatment approach. Control and management of surface tailings with dust suppression and more effective wastewater treatment should be combined in a comprehensive management process to reduce the threat to the wider environment and also to occupationally exposed individuals and inhabitants of the region.

Author Contributions

Conceptualization, S.Z. and A.H.; methodology, S.Z.; software, S.Z. and R.D.; validation, A.H.; formal analysis, S.Z.; investigation, S.Z.; resources, S.Z.; data curation, S.Z. and A.H.; writing—original draft preparation, S.Z.; writing—review and editing, A.H.; visualization, S.Z.; supervision, S.Z.; project administration, S.Z.; funding acquisition, S.Z. and R.D. All authors have read and agreed to the published version of the manuscript.

Funding

This study was financially supported by the National Natural Science Foundation of China (No. 41672350), Chinese Postdoctoral Science Foundation (No. 2018M632961), Doctoral Fund of Hunan University of Science and Technology (No. E57109) and the scientific research project of the Hunan Provincial Education Department (No. 18A184).

Conflicts of Interest

The authors declare that there is no conflict of interest regarding the publication of this paper.

References

  1. He, M.C.; Wang, X.Q.; Wu, F.C.; Fu, Z.Y. Antimony pollution in China. Sci. Total Environ. 2012, 41, 421–422. [Google Scholar] [CrossRef]
  2. Hu, X.Y.; He, M.C.; LI, S.S.; Guo, X.J. The leaching characteristics and changes in the leached layer of antimony-bearing ores from China. J. Geochem. Explor. 2017, 176, 76–84. [Google Scholar] [CrossRef] [Green Version]
  3. Quina, A.S.; Durão, A.F.; Muñoz, F.; Ventura, J.; Mathias, M.D.L. Population effects of heavy metal pollution in wild Algerian mice (Mus spretus). Ecotoxicol. Environ. Saf. 2019, 171, 414–424. [Google Scholar] [CrossRef]
  4. Sun, Z.H.; Xie, X.D.; Wang, P.; Hu, Y.N.; Cheng, H.F. Heavy metal pollution caused by small-scale metal ore mining activities: A case study from a polymetallic mine in South China. Sci. Total Environ. 2018, 639, 217–227. [Google Scholar] [CrossRef]
  5. Zhang, X.; Yang, H.H.; Cui, Z.J. Evaluation and analysis of soil migration and distribution characteristics of heavy metals in iron tailings. J. Clean. Prod. 2018, 172, 475–480. [Google Scholar] [CrossRef]
  6. Deng, R.J.; Jin, C.S.; Ren, B.Z.; Hou, B.L.; Hursthous, A. The potential for treatment of antimony-containing wastewater by iron-base adsorbents. Water 2017, 9, 794. [Google Scholar] [CrossRef] [Green Version]
  7. Zhou, J.W.; Nyirenda, M.T.; Xie, L.N.; Li, Y.; Zhou, B.L.; Zhu, Y.; Liu, H.L. Mine waste acidic potential and distribution of antimony and arsenic in waters of the Xikuangshan mine, China. Appl. Geochem. 2017, 77, 52–61. [Google Scholar] [CrossRef]
  8. Qi, C.C.; Wu, F.C.; Deng, Q.J.; Liu, G.J.; Mo, C.L.; Liu, B.J.; Zhu, J. Distribution and accumulation of antimony in plants in the super-large Sb deposit areas, China. Microchem. J. 2011, 97, 44–51. [Google Scholar] [CrossRef]
  9. Wei, C.Y.; Ge, Z.F.; Chu, W.S.; Feng, R.W. Speciation of antimony and arsenic in the soils and plants in an old antimony mine. Environ. Exp. Bot. 2015, 109, 31–39. [Google Scholar] [CrossRef]
  10. Tan, D.; Long, J.M.; Li, B.Y.; Ding, D.; Du, H.H.; Lei, M. Fraction and mobility of antimony and arsenic in three polluted soils: A comparison of single extraction and sequential extraction. Chemosphere 2018, 213, 533–540. [Google Scholar] [CrossRef]
  11. Okkenhaug, G.; Zhu, Y.G.; Luo, L.; Lei, M.; Li, X.; Mulder, J. Distribution, speciation and availability of antimony (Sb) in soils and terrestrial plants from an active Sb mining area. Environ. Pollut. 2011, 159, 2427–2434. [Google Scholar] [CrossRef] [PubMed]
  12. Li, J.N.; Wei, Y.; Zhao, L.; Zhang, J.; Shangguan, Y.X.; Li, F.S.; Hou, H. Bioaccessibility of antimony and arsenic in highly polluted soils of the mine area and health risk assessment associated with oral ingestion exposure. Ecotoxicol. Environ. Saf. 2014, 110, 308–315. [Google Scholar] [CrossRef]
  13. Guo, W.J.; Fu, Z.Y.; Wang, H.; Song, F.H.; Wu, F.C.; Gisey, J.P. Environmental geochemical and spatial/temporal behavior of total and speciation of antimony in typical contaminated aquatic environment from Xikuangshan, China. Microchem. J. 2018, 137, 181–189. [Google Scholar] [CrossRef]
  14. Wang, X.Q.; Li, F.B.; Yuan, C.L.; Li, B.; Liu, T.X.; Liu, C.S.; Du, Y.H.; Liu, C.P. The translocation of antimony in soil-rice system with comparisons to arsenic: Alleviation of their accumulation in rice by simultaneous use of Fe(II) and NO3. Sci. Total Environ. 2019, 650, 633–641. [Google Scholar] [CrossRef]
  15. Basnet, P.; Amarasiriwardena, D.; Wu, F.C.; Fu, Z.Y.; Zhang, T. Elemental bioimaging of tissue level trace metal distributions in rice seeds (Oryza sativa L.) from a mining area in China. Environ. Pollut. 2014, 195, 148–156. [Google Scholar] [CrossRef]
  16. Zeng, D.F.; Zhou, S.J.; Ren, B.Z.; Chen, T.S. Bioaccumulation of antimony and arsenic in vegetables and health risk assessment in the superlarge antimony-mining area, China. J. Anal. Methods Chem. 2015, 2015, 909724. [Google Scholar] [CrossRef] [Green Version]
  17. Kuroda, K.; Endo, G.; Okamoto, A.; Yoo, Y.; Horiguchi, S. Genotoxicity of beryllium, gallium and antimony in short-term assays. Mutat. Res. 1991, 264, 163–170. [Google Scholar] [CrossRef]
  18. Schnorr, T.M.; Steenland, K.; Thun, M.J.; Rinsky, R.A. Mortality in a cohort of antimony smelter workers. Am. J. Ind. Med. 1995, 27, 759–770. [Google Scholar] [CrossRef]
  19. Nigra, A.E.; Ruiz-Hernandez, A.; Redon, J.; Navas-Acien, A.; Tellez-Plaza, M. Environmental metals and cardiovascular disease in adults: A systematic review beyond lead and cadmium. Curr. Environ. Health Rep. 2016, 3, 416–433. [Google Scholar] [CrossRef]
  20. Parvez, F.; Chen, Y.; Brandt-Rauf, P.W.; Bernard, A.; Dumont, X.; Slavkovich, V.; Argos, M.; D’Armiento, J.; Foronjy, R.; Hasan, M.R.; et al. Nonmalignant respiratory effects of chronic arsenic exposure from drinking water among never-smokers in Bangladesh. Environ. Health Perspect. 2008, 116, 190–195. [Google Scholar] [CrossRef] [Green Version]
  21. Nordberg, G.; Fowler, B.; Nordberg, M. Handbook on the Toxicology of Metals, 4th ed.; Academic Press: San Diego, CA, USA, 2015. [Google Scholar]
  22. USEPA. Water Related Fate of the 129 Priority Pollutants; USEPA: Washington, DC, USA, 1979.
  23. European Council. Directive 76/464/EEC—Water Pollution by Discharges of Certain Dangerous Substance discharged into the aquatic environment of the community. OJ L 1976, 129, 23–29. [Google Scholar]
  24. Tang, Z.E.; Deng, R.J.; Zhang, J.; Ren, B.Z.; Hursthouse, A.S. Regional distribution characteristics and ecological risk assessment of heavy metal pollution of different land use in an antimony mining area-Xikuangshan, China. Hum. Ecol. Risk Assess. 2019. [Google Scholar] [CrossRef]
  25. Zhou, S.J.; Hursthouse, A.S.; Chen, T.S. Pollution characteristics of Sb, As, Hg, Pb, Cd, and Zn in soils from different zones of Xikuangshan antimony mine. J. Anal. Methods Chem. 2019, 2019, 2754385. [Google Scholar] [CrossRef] [PubMed]
  26. Islam, M.S.; Ahmed, M.K.; Raknuzzaman, M.; Habibullah-al-mamun, M.; Kundu, G.K. Heavy metals in the industrial sludge and their ecological risk: A case study for a developing country. J. Geochem. Explor. 2017, 172, 41–49. [Google Scholar] [CrossRef]
  27. China State Environmental Protection Administration. Environmental Quality Standards for Surface Water; CSEPA: Beijing, China, 2002. (In Chinese) [Google Scholar]
  28. Ungureanu, G.; Santos, S.; Boaventura, R.; Botelho, C.M.S. Arsenic and antimony in water and wastewater: Overview of removal techniques with special reference to latest advances in adsorption. J. Environ. Manag. 2015, 151, 326–342. [Google Scholar] [CrossRef]
  29. Pan, Y.; Yang, G. Background Value of Soils in Hunan and Their Investigation Methods; China Environmental Science Press: Beijing, China, 1988. (In Chinese) [Google Scholar]
  30. He, J.Y.; Yang, Y.; Christakos, G.; Liu, Y.J.; Yang, X. Assessment of soil heavy metal pollution using stochastic site indicators. Geoderma 2019, 337, 359–367. [Google Scholar] [CrossRef]
  31. Häkanson, L. An ecological risk index for aquatic pollution control. A sedimentological approach. Water Res. 1980, 14, 975–986. [Google Scholar] [CrossRef]
  32. Huang, X.F.; Hu, J.W.; Li, C.X.; Deng, J.J.; Long, J.; Qin, F.X. Heavy-metal pollution and potential ecological risk assessment of sediments from Baihua Lake, Guizhou, P.R. China. Int. J. Environ. Health Res. 2009, 19, 405–419. [Google Scholar] [CrossRef]
  33. Wang, N.N.; Wang, A.H.; Kong, L.H.; He, M.C. Calculation and application of Sb toxicity coefficient for potential ecological risk assessment. Sci. Total Environ. 2018, 610–611, 167–174. [Google Scholar] [CrossRef]
  34. Sun, J.X.; Luo, T.; Zhou, F.; Zou, W.M.; Yan, J.L. Pollution characteristics and assessment of heavy metals in surface water of Yancheng coastal area in Jiangsu. Environ. Pollut. Control 2018, 40, 1294–1299. (In Chinese) [Google Scholar]
  35. Sun, Q.Z.; Zang, S.Y. Pollution evalution and forecast of heavy metal in lake of Zhalong Wetland, China. J. Agro-Environ. Sci. 2012, 31, 2242–2248. (In Chinese) [Google Scholar]
  36. Entwistle, J.A.; Hursthouse, A.S.; Marinho Reis, P.A.; Steward, A.G. Matalliferous mine dust: Human health impacts and potential determinants of disease in mining communities. Curr. Pollut. Rep. 2019, 5, 67–83. [Google Scholar] [CrossRef] [Green Version]
  37. Zhang, J.Q.; Bai, S.Q.; Du, B.Q. Heavy metal pollution of dust topsoil and roadside tree near by main city roadways. J. Southwest Jiaotong Univ. 2006, 41, 68–73. (In Chinese) [Google Scholar]
  38. Lu, X.W.; Pan, H.Y.; Wang, Y.W. Pollution evaluation and source analysis of heavy metal in roadway dust from a resource-typed industrial city in Northwest China. Atmos. Pollut. Res. 2017, 8, 587–595. [Google Scholar] [CrossRef]
  39. Shi, D.Q.; Lu, X.W. Accumulation degree and source apportionment of trace metals in smaller than 63 μm road dust from the areas with different land uses: A case study of Xi’an, China. Sci. Total Environ. 2018, 636, 1211–1218. [Google Scholar] [CrossRef] [PubMed]
  40. Lanzerstorfer, C. Heavy metals in the finest size fractions of road-deposited sediments. Environ. Pollut. 2018, 239, 522–531. [Google Scholar] [CrossRef]
  41. Nikolaidis, C.; Zafiriadis, I.; Mathioudakis, V.; Constantinidis, T. Heavy Metal Pollution Associated with an Abandoned Lead-zinc Mine in the Kirki Region, NE Greece. Bull. Environ. Contam. Toxicol. 2010, 85, 307–312. [Google Scholar] [CrossRef] [Green Version]
  42. Garcí-carmona, M.; Garcí-robles, H.; Turpí torrano, C.; Fernández ondoño, E.; Lorite moreno, J.; Sierra aragón, M.; Martín peinado, F.J. Residual pollution and vegetation distribution in amended soils 20 years after a pyrite mine tailings spill (Aznalcólar, Spain). Sci. Total Environ. 2019, 650, 933–940. [Google Scholar] [CrossRef]
Figure 1. Box-plot showing PI for PTEs in all wastewater samples.
Processes 08 00029 g001
Figure 2. Evaluating results by individual Eir and compound RI.
Processes 08 00029 g002
Figure 3. Box-plot of evaluating results by PI for dust.
Processes 08 00029 g003
Figure 4. Evaluating results by Eir and RI.
Processes 08 00029 g004
Figure 5. Individual PTEs contents in different waste streams.
Processes 08 00029 g005
Figure 6. Distribution of PTEs between major site processing wastes.
Processes 08 00029 g006
Table 1. The concentration of target potentially toxic elements (PTEs) in water samples collected from discharge points at the Xikuangshan (XKS) antimony mineral processing plant.
NodeSample No.PTEs Concentration/(mg·L−1)
SbAsHgPbCdZn
Ore concentrate tankW12.3510.7921.96 × 10−50.2541.16 × 10−57.986
W21.9870.6951.59 × 10−50.2631.35 × 10−57.521
W32.1660.6921.15 × 10−50.2491.08 × 10−56.924
Average 2.1680.7261.57 × 10−50.2551.20 × 10−57.387
filter tankW44.3751.0183.12 × 10−51.4721.79 × 10−59.145
W54.7621.0062.87 × 10−51.5541.58 × 10−58.927
W64.1090.9943.57 × 10−51.5832.04 × 10−59.005
Average 4.4151.0063.19 × 10−51.5361.80 × 10−59.026
Tailings tankW72.7740.8521.02 × 10−50.0249.57 × 10−66.785
W82.5840.7359.54 × 10−60.0379.75 × 10−66.548
W92.9810.7299.96 × 10−60.0358.76 × 10−67.006
Average 2.7800.7729.90 × 10−60.0329.36 × 10−66.780
Tailing reservoirW103.1570.7473.27 × 10−50.0651.07 × 10−510.968
W113.3360.6923.54 × 10−50.1351.12 × 10−59.997
W123.7490.7012.99 × 10−50.1041.19 × 10−511.065
Average 3.4140.7133.27 × 10−50.1011.13 × 10−510.677
Standard value of surface water class IV0.0050.10.0010.050.0052.0
Table 2. PTEs contents in dust samples from nodes in antimony processing plant.
NodeSample No.PTEs Content/(mg·kg−1)
SbAsHgPbCdZn
Crushing and screening plantD11845.274784.0261.631238.9615.781645.327
D21650.716655.7720.954207.5426.174598.182
Average 1747.995719.8991.293223.2525.978621.755
Fine ore binD32478.5711425.3221.138117.2642.544758.074
D42275.6931109.8451.204561.0293.017812.036
Average 2377.1321267.5841.171339.1472.781785.055
Concentrate transportation routeD51966.467958.4570.413375.0254.559514.637
D62014.278915.0280.652300.4165.013498.753
Average 1990.373936.7430.533337.7214.786506.695
Hunan Province soil background values [29]2.98140.09270.07995
Table 3. PTEs contents in antimony tailings.
NodeSample No.PTEs Content/(mg·kg−1)
SbAsHgPbCdZn
Tailing damS12865.5911082.1673.27359.6282.151590.492
S22517.7221141.0473.01755.4672.008643.057
S32641.058897.6512.66954.2351.946537.867
Average 2674.7901040.2882.98656.4332.035590.472
Table 4. PTEs’ contents in soil samples surrounding antimony tailings.
NodeSample No.PTEs Content/(mg·kg1)
SbAsHgPbCdZn
Soils surrounding the TailingsS41652.147106.2052.48140.0281.127499.671
S51834.156112.0552.33838.8631.326548.173
S61477.08497.9371.90739.0421.103521.467
Average 1654.462105.3992.24239.3111.185523.104
Hunan Province soil background values [29]2.98140.09270.07995
Table 5. Evaluating results by PI, Eir, and RI for the soils surrounding antimony tailings.
NodePIEirRI
SbAsHgPbCdZnSbAsHgPbCdZn
Soils surrounding the Tailings555.187.5224.911.4615.005.5110548.4275.20996.47.301500.005.5113132.83

