Article

Exfoliation Behavior of Large Anionic Graphite Flakes in Liquid Produced by Salt-Assisted Ball Milling

1
School of Materials and Chemical Technology, Tokyo Institute of Technology, 2-12-1, O-okayama, Meguro, Tokyo 152-8550, Japan
2
National Institute for Materials Science, 1-2-1, Sengen, Tsukuba, Ibaraki 305-0047, Japan
*
Author to whom correspondence should be addressed.
Processes 2020, 8(1), 28; https://doi.org/10.3390/pr8010028
Submission received: 22 November 2019 / Revised: 20 December 2019 / Accepted: 20 December 2019 / Published: 24 December 2019
(This article belongs to the Section Materials Processes)

Abstract

:
Functionalization of graphite is crucial for efficient and effective exfoliation to graphene. When negative charges are fixed to the edges of natural graphite, the resulting anionic graphite shows negative charging in a polar solvent. This enhanced negative charging is assumed to contribute the exfoliation of graphite during liquid-phase exfoliation (LPE). In this study, we prepared large anionic graphite flakes (~10 μm) by salt-assisted ball milling, as well as natural graphite flakes of the same size for comparison. During the LPE process, centrifugation speed and solvent type have dominant effects on graphene concentration and quality (e.g., size and thickness), so we investigated these factors for anionic graphite flakes in detail. The anionic graphite showed higher exfoliation efficiency in every type of solvent (isopropanol, methyl ethyl ketone, acetone, and water-based cosolvent) compared with the natural graphite. Monolayer graphene, with an average size of 80–200 nm, was obtained with relatively high yield (>10%) at only 3 min of sonication. The small size of graphene was due to edge fragmentation during the LPE process. The recyclability of the sediment and the characterization of the exfoliated powders for anionic graphene were also investigated.

1. Introduction

Graphene is a promising material for improving the mechanical properties, thermal conductivity, and electric conductivity of polymeric nanocomposites owing to its exceptional properties [1,2]. The high productivity and low cost of graphene are in demand for nanocomposite applications. Natural graphite, which is essentially composed of multiple layers of graphene, is extracted using open pit and underground methods. The extracted graphite flakes tend to have a large crystal size, presumably due to the high pressure and temperature underground. The “top-down” approach to producing graphene (i.e., from graphite to graphene) is far more cost effective than the “bottom-up” approach (i.e., chemical vapor deposition method) because natural graphite is cheap (1–10 USD/kg) and abundant. Exfoliation of this highly crystalline graphite yields graphene nanoplatelets (more than 10 layers), few-layer graphene (FLG, 2–5 layers), or monolayer graphene, depending on the exfoliation degree of graphite [3]. There are three major exfoliation methods for this top-down approach: mechanical [4], electrochemical [5], and chemical exfoliation methods [6]. The most frequently used method for production of graphene flakes is the chemical approach, such as graphene oxide (GO) produced by Hummers’s method [7]. The reduction process, such as using hydrazine, converts GO to reduced graphene oxide (rGO) [8]. Although some of the oxygen groups can be eliminated by reduction, rGO includes many structural defects in the form of vacancies and Stone–Wales defects. Furthermore, rGO is no longer crystalline graphene but amorphous carbon. Therefore, the ultrahigh performance of graphene is not expected for rGO. Additionally, the amount of oxidizing agents required for the production of GO is roughly six times that of graphite by weight [9], meaning the material cost of GO or rGO is not cheap (total of ~350 USD/kg) [10]. Since this clearly negates the cost effectiveness of natural graphite, many people in research and industry are trying to find out new applications that compensate its high material cost.
The second commonly used method for the production of graphene is liquid-phase exfoliation (LPE). Exfoliation of graphite occurs by applying shear force or shock waves from cavitation in a suitable liquid [4,11]. The advantages of this method are its simple process—just sonication and centrifugation to remove thick flakes—and the production of nonoxide FLG. However, high shear forces cut the large graphite crystal, and the length of FLG is usually reduced to less than 1 μm, with a polydisperse layer number. These results indicate that the quality control of graphene during the LPE process is difficult, though the layer number can be roughly controlled by the centrifugation conditions [12,13,14]. Furthermore, the yield of FLG from direct exfoliation of natural graphite is usually less than 10% per one hour of sonication or shear exfoliation [11]. Various solvents, including organic solvents [4], water-based cosolvents [15], and water/surfactant systems [16], have been studied. Requirements for successful exfoliation of layered materials are that the surface tension components of the applied solvent should be close to those of the 2D materials [17,18]. Therefore, exfoliation in common low-boiling-point solvents, such as acetone, alcohol, and methyl ethyl ketone (MEK), and pure water is almost impossible. These drawbacks (polydisperse thickness, low yield, and limitation of solvent) must be addressed in order to usher in the widespread use of nonoxide exfoliated graphene.
Many approaches have been proposed for modifying the LPE process in previous works. An exfoliation machine [19], the structure of initial graphite [20,21,22], and new exfoliation media [23,24,25,26] have all been explored. Among the abovementioned factors, controlling graphite structure is the most effective way to produce high-quality graphene with high yield: smaller graphite flakes and crystallite size (or grain size) leads to efficient exfoliation because of low contact area [20]. The overall size and crystallite size of graphite can be decreased effectively by dry processes such as ball milling. The milling process is sometimes too severe to maintain the original graphite crystal structure, causing the graphite to become amorphous carbon or GO after a long time of milling [27]. In order to avoid excess damage to the graphite crystal, additives such as melamine, pyrene, and NH3 gas can be introduced to facilitate exfoliation with minimal damage [28,29]. Buzaglo et al. reported that the molecular structure of a fully conjugated aromatic diluent (e.g., pyrene) facilitates the production of graphene sheets due to the formation of strong π–π interactions with the graphitic surface, thereby producing defect-free graphene that is 200–400 nm in length and has six to nine layer numbers with nearly an order of magnitude higher yield (>90%) [30]. Recently, a new functionalization process was proposed that can improve the exfoliation efficiency of graphite via LPE, wherein the addition of a small amount of salt enables exfoliation in low-boiling-point solvents [31]. Cavitation-induced shock waves cause fragmentation of natural graphite, generating activated carbon at the fracture sites. The added salt reacts with the activated carbon, resulting in edge-functionalized graphite; this ionic edge can contribute to the stabilization of graphene dispersion by enhancing the negative charging in the liquid.
We found that this edge functionalization can be effectively achieved by salt-assisted ball milling [32,33], since the interaction of activated carbon and salt occurs more frequently in the dry state than in the wet state in LPE. Thus, the exfoliation efficiency of graphite in liquid dramatically improved following salt-assisted ball milling, rather than directly adding salt to the LPE process. The ionic bonding of salt remains even after mechanochemical reaction with the activated graphite edge, so dissociation of the cation from the adsorbed salt (anion) still occurs as in a typical solution [33]. This leads to the negative charging of graphite in liquid. Graphite that shows negative charging in a polar solvent has been named “anionic graphite” here. Because the basal plane of anionic graphite is not functionalized during ball milling, anionic graphite shows a hydrophobic nature.
As mentioned above, graphene quality and concentration are affected by the initial graphite size, solvent type, and centrifugation conditions. In order to discern the characteristics and dispersion performance of anionic graphite, graphene quality and concentration were thoroughly investigated in this study with various centrifugation conditions and solvents in comparison with natural graphite of the same flake size. Furthermore, the recyclability of anionic graphite in the LPE process and the characterization of exfoliated powder were also investigated. Based on this comprehensive study of anionic graphite, the dominant exfoliation behavior of the graphite is proposed.

2. Experimental

2.1. Materials

Large graphite flakes (Sigma-Aldrich, d = 500 μm, Tokyo, Japan) were used for salt-assisted ball milling. This large flake size is beneficial for mechanochemical reactions. Graphite fine powder (Wako chemical, d = 15 μm in public data, Kanagawa, Japan) was used for comparison in LPE. Potassium acetate was purchased from Kanto Chemical (Tokyo, Japan). 2-Propanol (IPA), acetone, and MEK were supplied by Kanto Chemical (Tokyo, Japan).

2.2. Production Method

Prior to mechanochemical reaction via ball milling, the potassium acetate and graphite flakes were dried in a constant-temperature drying oven at 60 °C overnight. Any residual water in the graphite powder can inhibit the mechanochemical reaction, so drying is an important step. In fact, we have confirmed that addition of one drop of water significantly reduces the exfoliation efficiency of salt-assisted milled graphite. Presumably, hydrogen and hydroxyl groups adsorbed to the active graphite edge instead of the salts as intended. After drying, 2 g of graphite flakes and 4 g of potassium acetate were added to an 80 mL milling container. Approximately 200 g of steel balls with a diameter of 10 mm were also placed in the container. The mixture was ball-milled by a planetary ball-milling machine (P-6, Fritsch Japan, Yokohama, Japan) at 500 rpm for 10 min. The size of graphite can be controlled by the milling time, so we chose a short milling time (10 min) in order to obtain large anionic graphite and to make natural graphite of the same size. The milled powder was washed with deionized water, and the mixture was shear-mixed to remove the salt completely. The mixture was then vacuum-filtered using a polytetrafluoroethylene (PTFE) membrane (Merck, Darmstadt, Germany) with a pore size of 5 μm. This washing process was repeated several times, then the filtered cake was dried in an oven. The anionic graphite powders were obtained by crushing the dried cake by hand with a mortar and pestle.
With respect to the LPE process, 0.3 g of prepared graphite powder was added to 100 mL of solvent (initial graphite concentration Ci = 3 g/L). High-power probe sonication (UH-600S, SMT, Tokyo, Japan) was applied for 3 min. Then, the dispersion was centrifuged (model 2420, Kubota, Tokyo, Japan) at various centrifugation speeds for 10 min. The top half dispersion was picked up carefully by pipette and retained for characterization.

2.3. Characterization

The size of the graphite powder was precisely measured using scanning electron microscopy (SEM, JSM6510-LA, JEOL Ltd., Tokyo, Japan). Long- and short-axis dimensions were measured for at least 100 flakes and were averaged to determine the size of the graphite. X-ray diffraction (XRD, X’pert-MPD-OES, Philips, Amsterdam, Netherlands) was used to measure the crystallite size (La), the crystallite thickness (Lc), and the d-spacing of graphite, using 10 mass % of silicon powder as a reference powder for XRD measurement. Excitation voltage and electric current were maintained at 45 kV and 40 mA, respectively. The quality of exfoliated powder was evaluated by Raman spectroscopy (NRS-4100, JASCO Co., Tokyo, Japan) using a 532 nm laser. The size distribution of graphene was obtained by atomic force microscopy (AFM, SPM-9700, Shimadzu, Kyoto, Japan) set to dynamic tapping mode. The AFM sample was prepared by spray-coating of the dispersion on freshly cleaved mica. The substrate was preheated on a hotplate at 180 °C to facilitate the evaporation of the liquid solvent. In addition, the dispersion was diluted using the same solvent until the absorbance of the dispersion became less than 0.3. The graphene concentration was measured by optical absorbance at 660 nm using a spectrophotometer (ASV11D, Shimadzu, Kyoto, Japan). The absorbance coefficient α for the Beer–Lambert law (A = αcl) was determined to be 3300 L g−1 m−1. Energy dispersive X-ray spectrometry (EDS, Genesis, EDAX, Tokyo, Japan) was used to perform elemental analysis of the powders. The accuracy of the elemental analysis was 0.03 at % in our experimental condition.

3. Results

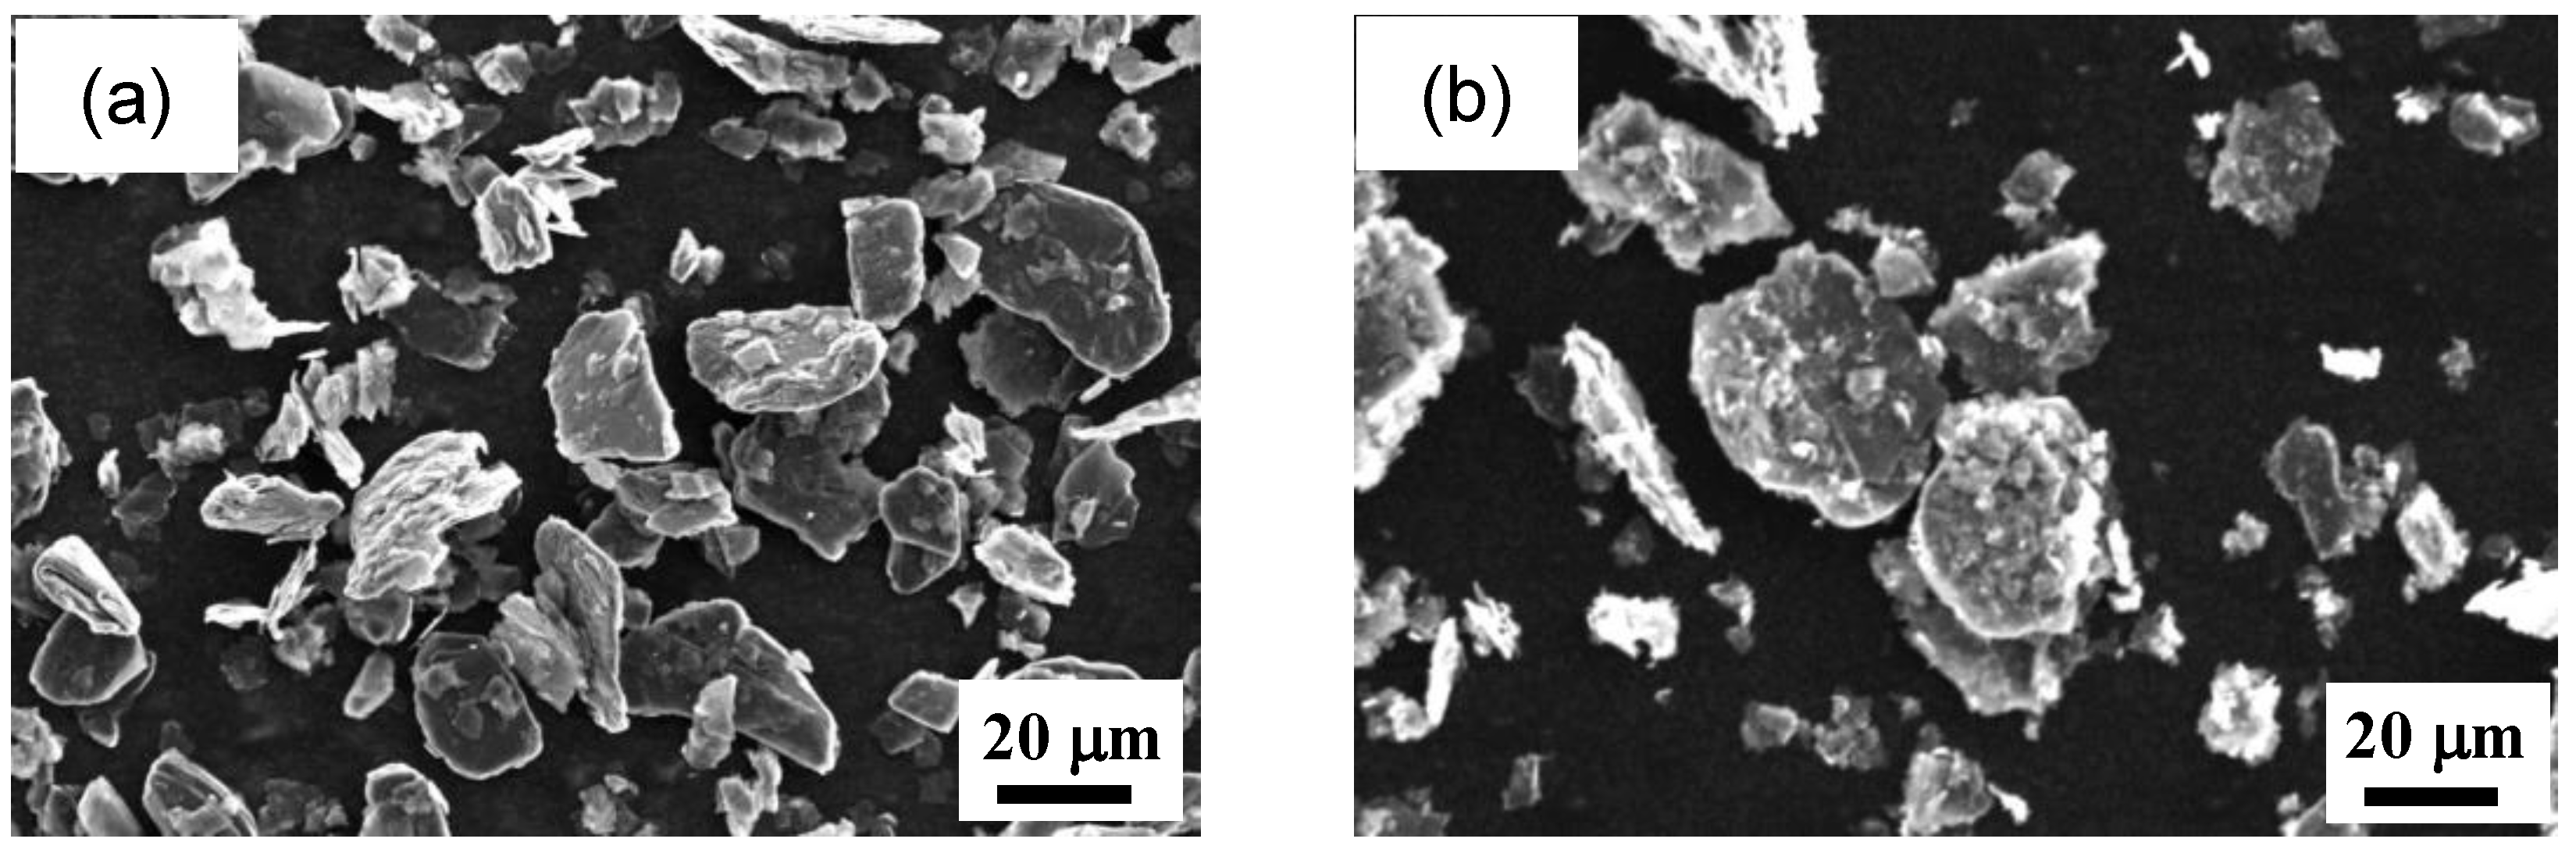
3.1. Characterization of Graphite

It is important to accurately measure the natural graphite size before modification due to its effect on exfoliation efficiency in the LPE process. In our previous study, an FLG productivity improvement of up to 1500% was attained when graphite with smaller flakes (d = 2.2 μm) was used instead of graphite with large flakes (d = 71 μm) [20]. The graphite had a platelet geometry, making it difficult to obtain a precise size distribution using conventional methods such as laser diffraction, which is often used for the determination of sphere diameter. We checked the size distribution of graphite by SEM images, as shown in Figure 1. The natural graphite (Wako) in this study showed a flatter and smooth surface compared with anionic graphite (salt-assisted milled graphite). The average diameters of the natural and anionic graphite used for the LPE process were 13 and 11.2 μm, respectively (Figure S1). It appears as though the flake thickness of the anionic graphite was greater than natural graphite, but it is difficult to directly measure flake thickness from micrographs. Instead of SEM, XRD was selected, as it is a useful tool for measuring the thickness of layered materials [34,35,36], whereby the thickness of layered materials can be determined by the full-width half-maximum (FWHM) of 002 reflections. A standard method for measuring d-spacing and crystallite thickness (Lc) by XRD has been established for graphite [34]. The peak intensity was higher and the 002 profile was broader for anionic graphite than for natural graphite (Figure S2), indicating the anionic graphite was thicker than the natural graphite. The results of XRD measurements are summarized in Table 1. The crystallite thicknesses of anionic and natural graphite were 665 and 230 nm, respectively. It should be noted that the d-spacing of anionic graphite (0.3354 nm) was smaller than that of natural graphite (0.3357 nm). This means that the anionic graphite had a more ordered structure compared with natural graphite, which included a slight turbostratic structure. It also indicates that there were no functional groups on the basal plane of the graphite after salt-assisted ball milling. Crystallite size (La) was determined from 110 profiles of graphite. It has been reported that if La > 1 μm, reliable data cannot be obtained [37]. In our data, La of anionic graphite exceeded 1 μm, suggesting that a large crystallite size was maintained after ball milling. From SEM and XRD analysis, it can be concluded that the salt-assisted ball milling in our study did not facilitate the exfoliation of graphite but rather fragmented the flakes into 11.3 μm diameter pieces without changing the layered structure.

3.2. Effects of Centrifugal Treatment
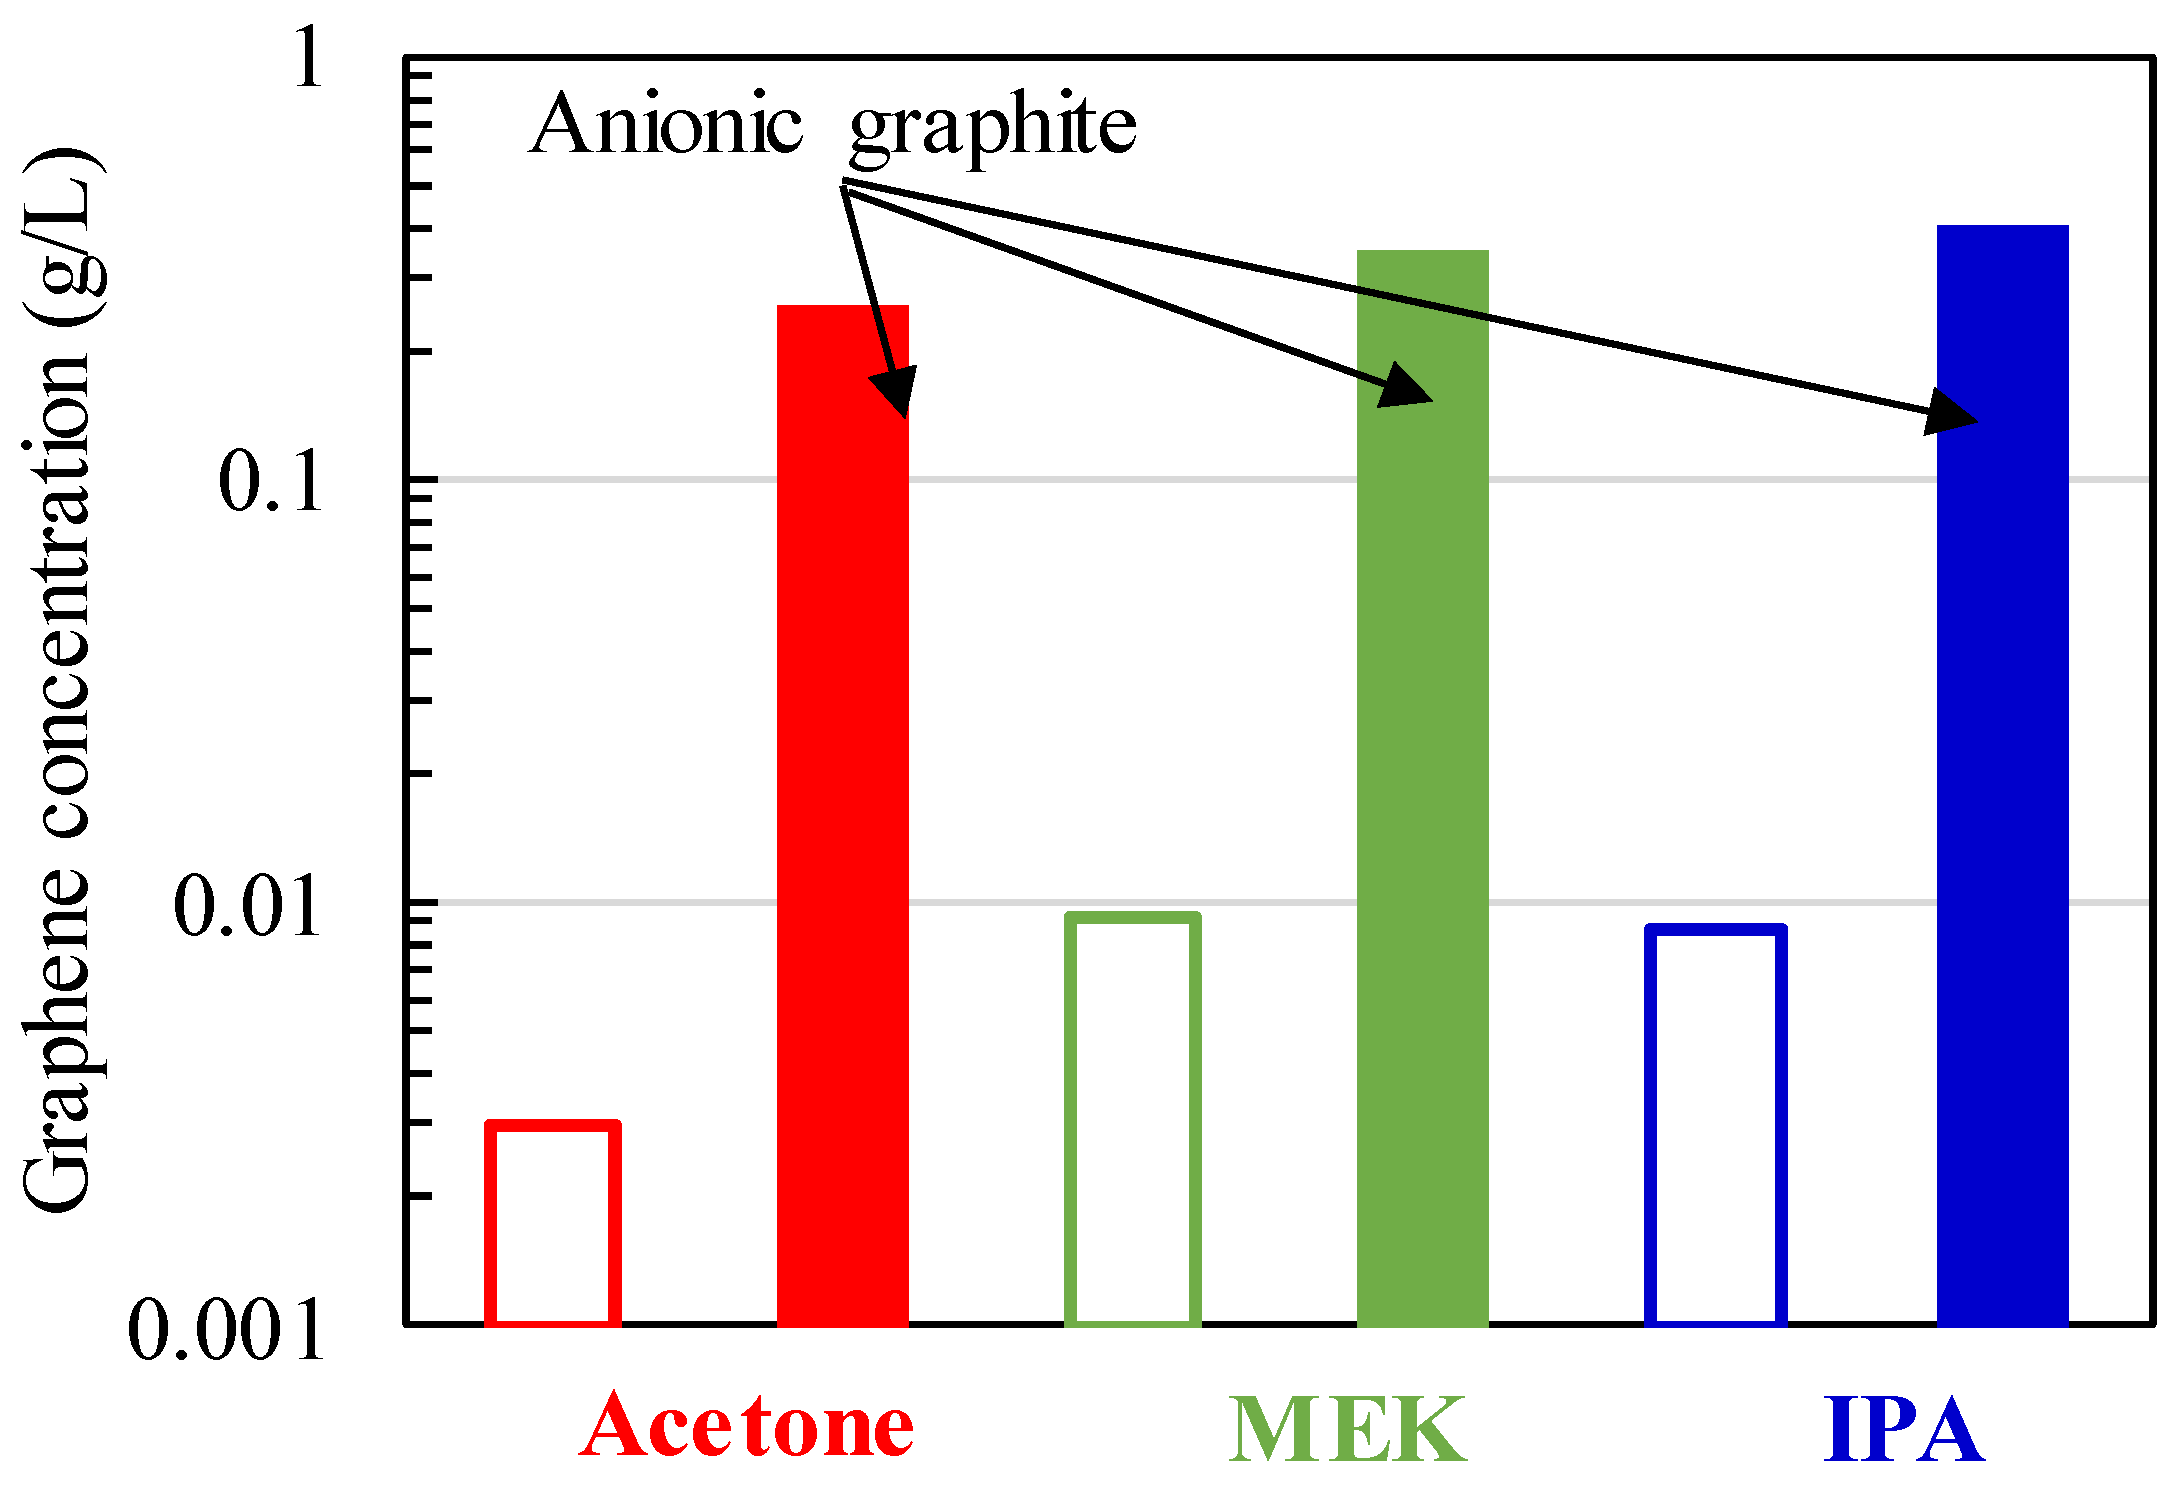
It has been well studied how the centrifugation speed influences the graphene concentration and size when natural graphite is the starting material [12,14,23], primarily due to sedimentation of the largest and thickest graphene flakes at a high centrifugation speed. In general, the large lateral size of FLG obtained by a low centrifugation speed is preferable for the mechanical reinforcement of polymeric materials [38]. On the other hand, some applications and devices cannot be considered unless the dispersion has a very high monolayer content [13], in which case iterative centrifugation cascades have been proposed to enrich the monolayer content.
The effect of centrifugation speed on the dispersion concentration of anionic graphene was unexpectedly different from that obtained from natural graphite (Figure 2). In this characterization, an IPA/water cosolvent (40 vol %/60 vol %) was used because it was also ideal for AFM characterization since it has no surfactant and high volatility. The concentration of natural graphite decreased linearly as the centrifugation speed increased, dropping from 0.117 g/L at 500 rpm to 0.03 g/L at 3000 rpm, indicating a 74% reduction of graphene concentration at the highest centrifugation speed in this study. This result agrees with most reports in the literature, which showed a 70–80% reduction of graphene concentration within a similar rpm range [12,14]. Meanwhile, the dispersion of anionic graphene maintained a high concentration with only a 26% reduction at 3000 rpm, which was still approximately 12 times higher than the dispersion concentration of natural graphite; this was despite both having almost the same flake size before sonication, as well as anionic graphite being 3 times thicker than natural graphite (Table 1). It can be inferred that the negative charging generated by adsorbed salts at the edge significantly contributed to the improvement of exfoliation efficiency during the LPE process.
Size and thickness distributions of graphene dispersions obtained at various centrifugation speeds were collected by AFM measurement. A typical image of anionic graphene deposited on a mica substrate is shown in Figure 3. A uniform thickness of 0.8 nm and a lateral size of 50–400 nm was observed for dispersion using anionic graphene (Figure S3). Although the actual thickness of the monolayer graphene was 0.335 nm, its apparent thickness measured by AFM was generally in the range of 0.6–1.0 nm [11]. This discrepancy was presumably caused by residual solvent or interaction between the probe and the material surface during tapping-mode scanning. Based on our previous works and other references, the apparent thickness of monolayer graphene was assumed to be 0.8 nm. The distributions of layer number against size for both types of graphene are shown in Figure S3, where at least 50 flakes were measured for each condition (red—exfoliated from anionic graphite; white—exfoliated from natural graphite). Based on these distributions, the average lateral size and layer number for each centrifugation condition is shown in Figure 4. The average size of anionic graphene was 160–200 nm (Figure 4a), depending on the centrifugation speed, which was larger than the graphene obtained from natural graphite (120 nm). Most importantly, the layer number of graphene obtained by anionic graphite was a single layer (monolayer) for all centrifugation speeds (Figure 4b), in contrast to the decrease from 2.7 to 1.5 with the increasing centrifugation speed for natural graphite. These results help explain why the anionic graphene concentration did not change significantly with the increasing centrifugation speed. The correlation between graphene thickness and concentration with respect to centrifugation speed can be described as follows: graphene exfoliated from natural graphite has a polydisperse thickness, so the thicker graphene sheets are removed from the supernatant by sedimentation at lower centrifugation speeds, and each smaller size is successively removed as the speed increases. Conversely, most of the graphene exfoliated from anionic graphite is monolayer, so sedimentation is limited and most of the graphene remains in the dispersion, even after a high centrifugation speed. In summary, monolayer-rich graphene can be obtained using anionic graphite as a starting material in the LPE process.

3.3. Solvent Type

LPE in commonly used low-boiling-point solvents, including acetone, MEK, and IPA, was performed. It was found that a low centrifugation speed (~500 rpm) is enough to separate graphite and graphene with respect to anionic graphite, so a mild centrifugation condition (500 rpm for 10 min) was conducted after 3 min of sonication. After centrifugation of graphene made from natural graphite, sedimentation was significant and only a nearly transparent dispersion was obtained; visual observation of the Tyndall effect indicated that an extremely low concentration of graphene remained dispersed in the low-boiling-point solvent (Figure 5a). The surface tension of these low-boiling-point solvents was too low (around 20 mJm−2) to obtain a stable dispersion of unmodified graphene, which requires values closer to 30–40 mJm−2 [4,17]. In stark contrast, stable, dark dispersions of anionic graphene were obtained (Figure 5b). The concentration of each graphene dispersion was estimated by the Beer–Lambert law using optical absorbance measured at 660 nm, and the results are shown in Figure 6. Graphene concentration in acetone increased approximately 100 times when we used anionic graphite instead of natural graphite, and with an increase of at least 40 times for the other solvents as well. Concentrated graphene dispersions of anionic graphene can be obtained due to the enhanced negative charging caused by adsorbed salts [33]. The high electrical repulsion between anionic graphene sheets restricts the typical van-der-Waals-induced restacking observed in polar solvents. Thus, high concentrations of graphene dispersions in low-boiling-point solvents were obtained for anionic graphene.
The size and thickness distribution of anionic graphene was checked by AFM for each solvent (Figure 7 and Figure S4). All graphene in MEK and IPA dispersions displayed monolayer thickness, but the lateral size was smaller (~80 nm) than in the IPA/water cosolvent (~200 nm). Fragmentation of graphite tends to occur more easily than exfoliation in low-boiling-point solvents because of the surface tension mismatch. In acetone, the anionic graphite exfoliated into FLG (polydisperse, Nave = 3.54) rather than a monolayer (Figure 7a). The exfoliation efficiency of graphene in acetone appears to be the worst compared with other low-boiling-point solvents, a tendency that corresponds with previously reported results [39]. O’Neill et al. reported that dispersion quality is particularly sensitive to the dispersive Hansen parameter δD; successful dispersions were only achieved for solvents with 15 MPa1/2 < δD < 21 MPa1/2. Since the value for acetone is very low (15.5 MPa1/2), it is difficult to obtain concentrated dispersions. It seems this also affected the exfoliation degree of anionic graphite in acetone.
Raman analysis is a powerful tool for estimating the damage degree of graphite [11]. The Raman spectra collected from vacuum-filtered films are shown in Figure 8. The characteristic peaks—the G band (~1590 cm−1), D peak (~1350 cm−1), and 2D peak (~2700 cm−1)—are clearly visible for each graphene film. The G band is derived from sp2 bonding of carbon, and the D peak reflects any present defects (sp3 defect, vacancy-like defects, and edge defects). The intensity ratio of G and D peaks (ID/IG) is frequently used for quantification of defects in graphene. The average values of ID/IG for all graphene are relatively low (<0.23). If there are abundant defects on the basal plane, the ID/IG value falls in the range of 0.8–1.5 for rGO [6,27]. The low ID/IG indicated that the graphene obtained from anionic graphene had few defects on the basal plane, with the highest value corresponding to graphene exfoliated by LPE in acetone. This is because the graphene size in acetone was smallest and thus included more edge defects than the other graphene. ID/IG is associated with the graphene edge (i.e., length), so the empirical equation below was proposed by Khan et al. [12]:
I D / I G ( I D / I G ) powder = k / L
where k is a constant. In this study, k = 0.17 and (ID/IG)powder = 0.037 were used to calculate the length of graphene. The calculated curve is shown in Figure 9, along with data from our previous study (red symbols). The calculated value clearly overestimated the length of graphene. The k value was determined by using the graphene obtained from LPE; however, Khan et al. applied bath sonication for 168 h in N-methylpyrrolidone (NMP) [12], whereas in our case, only 3 min of probe sonication was applied. It is presumed that the large graphene obtained from a long sonication time includes some small defects on the basal plane, and fragmentation usually occurs as a result of damage accumulation. Thus, it is reasonable to consider that some defects are introduced on the basal plane during the LPE process. We consider that the discrepancy between Equation (1) and the experimental data is due to defects on the basal plane of large graphene sheets, although it should be emphasized that there is currently no explicit evidence that the basal plane is damaged during LPE. Further detailed analysis is required to discuss whether this is the case or not. Alternatively, the relationship between crystallite size La and ID/IG is derived as below:
L a ( nm ) = ( 2.4 × 10 10 ) λ laser 4 ( I D / I G )
where λ is the wavelength of the laser (532 nm in this study) [40,41,42]. ID/IG reflects the defect at the boundary of each graphite crystal. We can substitute La as flake size L if there are no defects on the basal plane. The calculated curve by Equation (2) was far below the value obtained by Equation (1) (Figure 9). Our experimental data were close to the curve estimated by Equation (2), which means the graphene size was very small, but there were few defects on the basal plane. This quality difference (flake size and basal plane damage) might arise from the different exfoliation behavior of anionic graphite compared with natural graphite in the LPE process. Exfoliation behavior is discussed in the following section.

3.4. Recycling of Sediment

Regarding the yield of graphene, a more than 10% yield can be obtained using anionic graphite, but it can be increased even more by recycling the sediment flakes after centrifugation. To investigate if sediment recycling can increase the graphene yield, the IPA dispersion was centrifuged at 1500 rpm for 10 min to ensure that the sedimentation of large graphite was complete; then, 45 mL of the remaining dispersion was removed from the 50 mL vessel for concentration measurement, which was then replaced by 45 mL of fresh IPA (i.e., added to the sediment). This process (3 min of sonication, 10 min of centrifugation at 1500 rpm) was repeated to check the dispersibility of the sediment (Figure 10a). Following this recycling process, we observed a gradual increase in the measured concentration for natural graphite after each repetition (Figure 10b). This is attributed to the fragmentation of the graphite flakes during the LPE process, which caused a size reduction and thus a gradual increase in the measured graphene concentration [21]. However, the total yield for natural graphene after five cycles was too low (2.3%) to meet industrial requirements. In the case of anionic graphene, the total yield was 25% after five cycles. In contrast to natural graphite, the measured concentration for anionic graphene sharply decreased with the increasing recycle number. This is attributed to several factors. One is the reduction of the initial graphite concentration in the LPE process; in general, the graphene concentration is in proportion to the inputted graphite concentration [43]. The initial graphite concentration decreased from 3 to 2.63 g/L at the second cycle, which should correspond to an approximately 12.3% reduction in graphene concentration at the second cycle. However, a 50% reduction of graphene concentration was observed. We performed elemental analysis for exfoliated powder and sediment powder by EDS and found that the powders collected from dispersion had a higher potassium content (0.18 wt %) compared with the sediment powder (0.02 wt %) (Figures S5 and S6). This means the powder functionalized with salt dispersed well, whereas the powder with a low functionalization degree settled during centrifugation. If we consider the hypothesis that fragmentation of graphite frequently occurs close to the edge of graphite, it follows that graphite with a low functionalization degree would be subject to sedimentation, and that the dispersibility of graphene decreases with each repetition as more of the edges are fragmented.

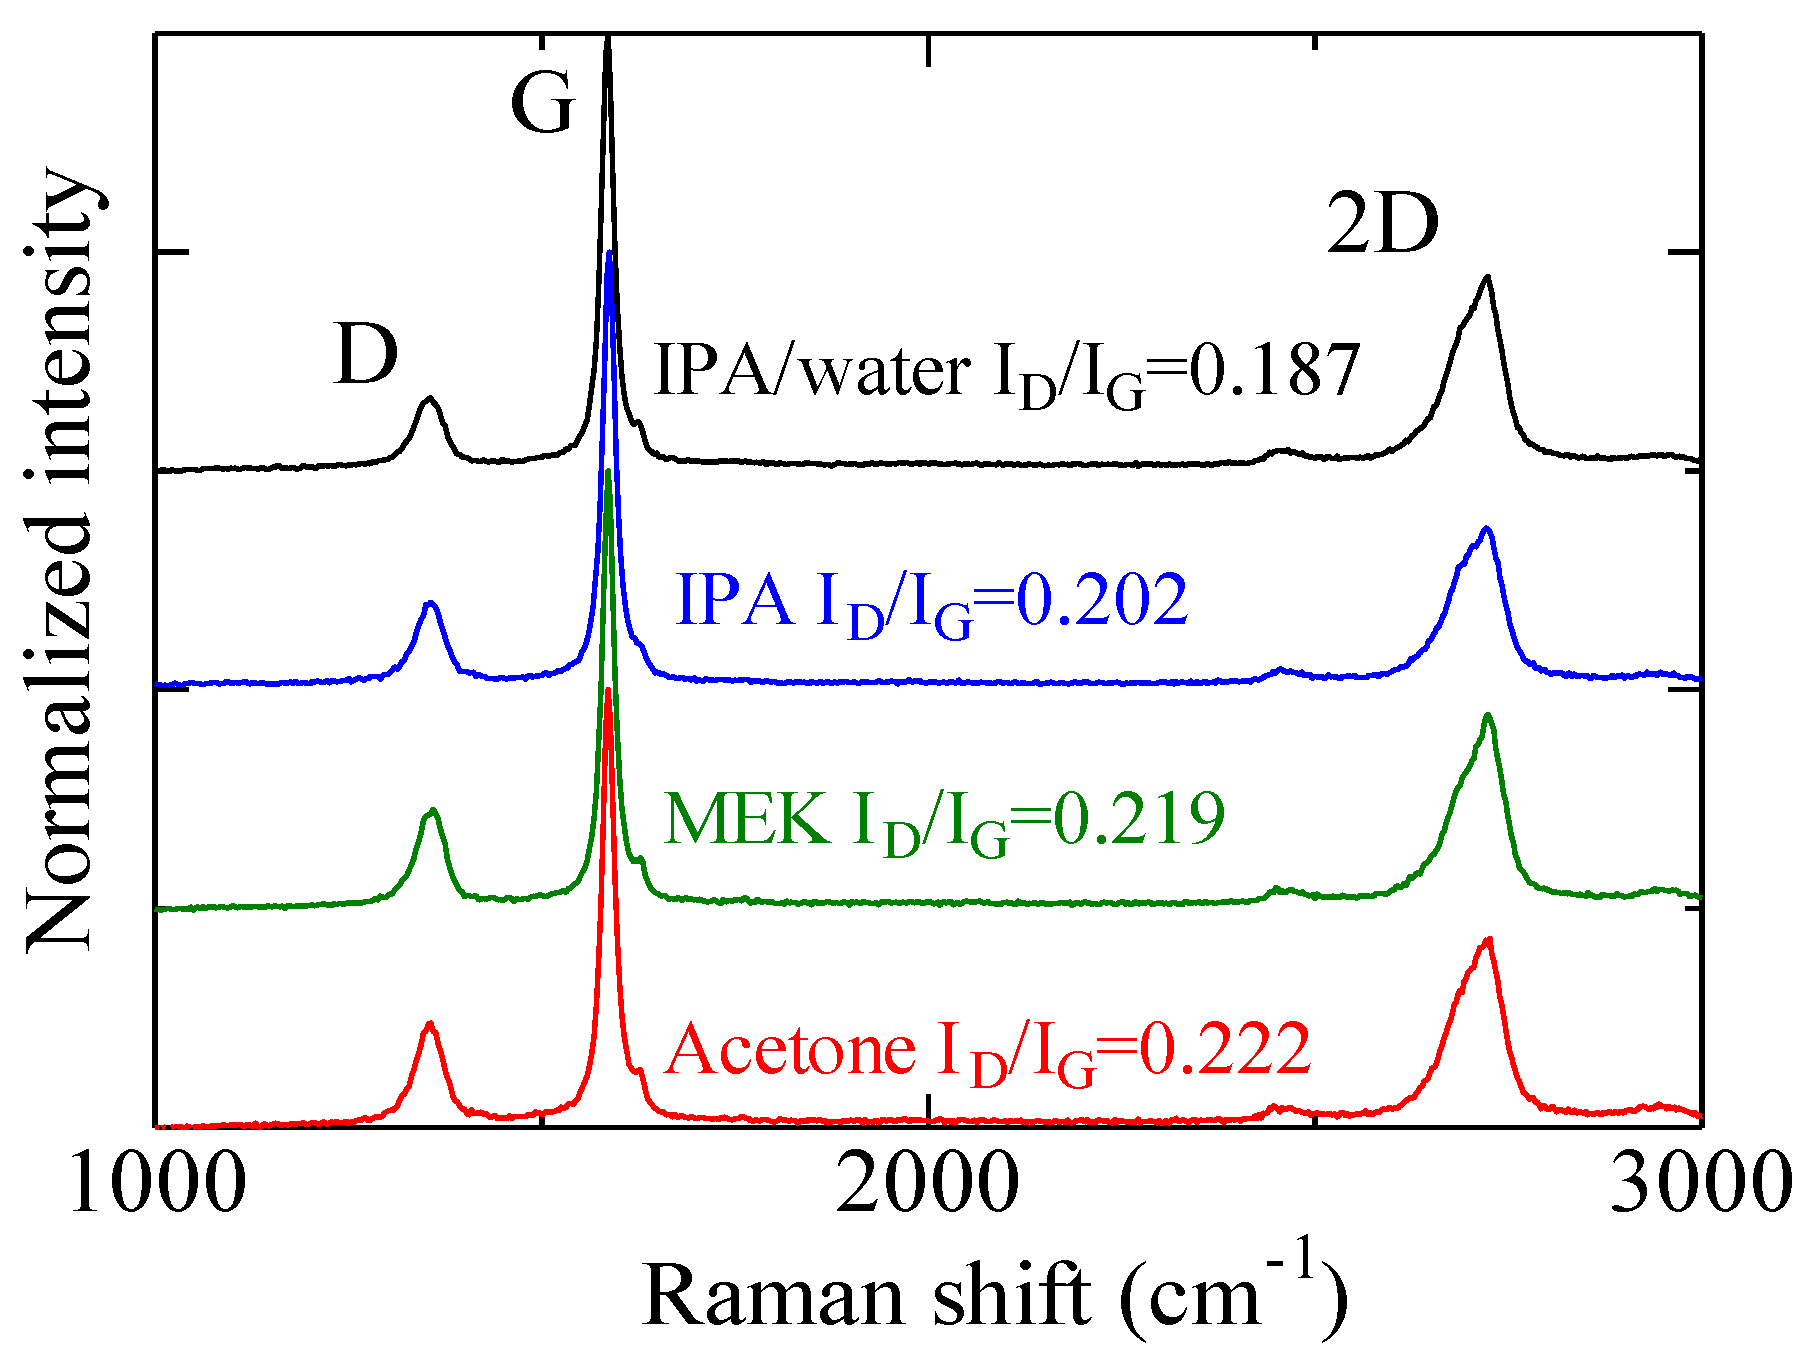
3.5. Characterization of Exfoliated Powder

The exfoliated graphene powder was collected by vacuum filtering of the IPA/water dispersion using PTFE membranes. The collected powder was dried in an oven, then the layered structure was investigated by XRD. The weak intensity of the (002) peak was observed for exfoliated anionic graphene (Figure 11). Although the anionic graphite was completely exfoliated during the LPE process, the collected power restacked again due to the lack of repulsive force and only van der Waals forces acting under the atmospheric environment. The crystallite thickness decreased from 665 to 57.5 nm after the LPE process. In addition, the d-spacing of the collected powder slightly increased due to the turbostratic structure of the restacked graphene (Table 1). Recently, Kauling et al. revealed that most of the commercially available so-called “graphene” is actually “graphite microplatelets”, not FLG or monolayer graphene [44]. We consider that these graphite microplatelets might be exfoliated to a certain level, but the exfoliated sheets form agglomerations after drying due to van der Waals forces.
The collected powder was used for the LPE process again using the same process condition (3 min of sonication and 10 min of centrifugation at 1500 rpm). The yield of graphene exfoliated from the collected powder (i.e., previously exfoliated anionic graphene that was dried) was 96% and 70% in IPA/water cosolvent and IPA, respectively. The yield of graphene exfoliated from freshly prepared anionic graphite (i.e., not previously exfoliated) was 16.7% and 8% for the same solvents, respectively. This indicates that although the exfoliated powders were restacked after drying, the graphene yield was dramatically improved upon re-exfoliation compared with anionic graphite without previous exfoliation. This is likely due to the small size of exfoliated graphite and the electric repulsive force generated at the edge of anionic graphite. Exfoliated anionic graphene powder should be useful for functional inks due to its high exfoliation efficiency (high yield).

4. Discussion

The anionic graphite produced by salt-assisted ball milling showed different behavior than natural graphite in the LPE process. The thickness and size of graphene is usually controlled by centrifugation speed, but we found that the dispersion quality obtained from anionic graphene does not seem to be sensitive to centrifugation. Additionally, high-yield exfoliation was successfully achieved in low-boiling-point solvents and could be increased by recycling the sediment despite the gradual decrease in concentration with each cycle. Based on all these experimental data and observations, one dominant exfoliation mechanism of anionic graphene is proposed, as shown in Figure 12. The salts are adsorbed at the edge of graphene through mechanochemical reaction during ball milling. The dissociation of cations from the adsorbed salts (anions) contributes to the negative charging of each graphite layer. This negative charging facilitates the exfoliation of graphite during LPE processes [45] such as sonication, wherein cavitation-induced shock waves act on the graphite and induce exfoliation. For natural graphite, the size reduction of graphite flakes occurs prior to the exfoliation, which starts to occur when the size of graphene becomes sufficiently small enough for local shear forces in the liquid to overcome the van der Waals forces between layers; exfoliation occurs more easily for smaller flakes in the case of layered materials simply due to the surface area between layers. Exfoliation and fragmentation of graphite simultaneously occur during the LPE process; thus, the layer number of graphene is polydisperse. On the other hand, this complex behavior likely occurs for anionic graphite as well, meaning fragmentation more likely occurs near the edge of anionic graphite and the unexfoliated core is left after LPE. This edge fragmentation model can explain why the recyclability of anionic graphite decreased (Figure 10) and more potassium was detected for exfoliated graphite compared with the sediment. During LPE, the mechanochemical reaction also occurs at the fragmented edge [31,46], in which case hydrogen and hydroxyl groups are presumably adsorbed at the edge. Yi et al. reported that the oxygen-containing groups form at the edge of graphene, which can contribute to the negative charging of graphene [46]. However, the contribution to exfoliation of this oxygen/hydroxyl functionalization resulting from LPE is much lower than the salt functionalization demonstrated in this study, because the graphene yield using natural graphite (usually bearing oxygen-containing groups) [22] is lower than that of anionic graphite.
In this study, we produced small graphene sheets with an average length of 200 nm. Although the size of anionic graphene is larger than the FLG (100 nm) obtained from natural graphite, a larger lateral size should be a priority in future work for composites applications. We initially speculated that larger graphene can be obtained by LPE using anionic graphite with a larger initial size, which is why the ball milling time was limited to 10 min, so as to retain as large a size of anionic graphite as possible. However, small graphene was ultimately produced from large anionic graphite due to the edge fragmentation mechanism described (Figure 12). In our previous research, we ball-milled graphite for 20 min and the average size of graphene was 366 nm, which is two times higher than this study [33]. We also found that the adsorbed salt increased as the milling time increased, suggesting that a higher amount of adsorbed salts and a smaller graphite size possibly hinders edge fragmentation. There are many factors that must be optimized to obtain micron-size graphene, such as milling time and salt structure.

5. Conclusions

Anionic graphene that has the same size (~10 μm) and layered structure as natural graphite was successfully synthesized by salt-assisted ball milling. The exfoliation behavior of anionic graphene in the LPE process was investigated and compared to natural graphite as a control. Monolayer graphene measuring 200 nm was obtained in an IPA/water cosolvent with a high yield (>10%) after just 3 min of sonication. The dispersion quality (i.e., concentration and layer number) of anionic graphene was not sensitive to the centrifugation speed, whereas that obtained from natural graphene did show such dependence. We confirmed that anionic graphite is useful for producing stable dispersions in low-boiling-point solvents, as demonstrated by obtaining monolayer graphene with an average size of 80 nm in IPA and MEK. The defects of graphene obtained from anionic graphite were found to be low (ID/IG = 0.19–0.22) based on Raman analysis. Furthermore, we discovered that the concentration of anionic graphene gradually decreased with the increasing recycling number of the sediment after centrifugation, which we conclude is because fragmentation occurred near the edge of graphite and, thus, the amount of adsorbed salt that remained on the sediment—which is crucial for negative charging—decreased. Thus, the exfoliation efficiency of the resultant graphite gradually deteriorated as the number of cycles increased. The exfoliated anionic graphene powder formed agglomerations with a thickness of 57.5 nm after drying, but it exhibited ultrahigh exfoliation efficiency with a yield of 96% and 70% after only 3 min of sonication in the IPA/water cosolvent and IPA, respectively. We found that edge fragmentation of anionic graphite during LPE reduces the lateral size of exfoliated graphene. A new technique that avoids edge fragmentation of anionic graphite will be required to obtain high-quality and large-size graphene.

Supplementary Materials

The following are available online at https://www.mdpi.com/2227-9717/8/1/28/s1, Figure S1: Size distribution of anionic graphite produced by salt-assisted ball milling and natural graphite, Figure S2: XRD profile of anionic graphite and natural graphite, Figure S3: Length and layer number distribution measured by AFM for dispersions after various centrifugation speed (from 500 to 2000 rpm), Figure S4: AFM images of exfoliated anionic graphene deposited onto mica substrate from (a) acetone, (b) MEK and (c) IPA dispersions (centrifugation 1000 rpm 10 min), Figure S5: EDS analysis for exfoliated anionic graphite collected by vacuum filtering, Figure S6: EDS analysis for sediment.

Author Contributions

Y.A. conducted the most of the experiments and wrote the manuscript. J.D.T. provided idea and polished the manuscript. K.A. collected XRD and SEM data. M.K. supervised the research. All authors have read and agreed to the published version of the manuscript.

Funding

This work was supported by JSPS KAKENHI, grant number 19H02021.

Acknowledgments

We acknowledge the Center for Advanced Materials Analysis at the Tokyo Institute of Technology for XRD, EDS, and Raman analysis.

Conflicts of Interest

The authors declare no conflict of interest.

References

  1. Hu, K.; Kulkarni, D.D.; Choi, I.; Tsukruk, V.V. Graphene-polymer nanocomposites for structural and functional applications. Prog. Polym. Sci. 2014, 39, 1934–1972. [Google Scholar] [CrossRef]
  2. Potts, J.R.; Dreyer, D.R.; Bielawski, C.W.; Ruoff, R.S. Graphene-based polymer nanocomposites. Polymer 2011, 52, 5–25. [Google Scholar] [CrossRef] [Green Version]
  3. Bianco, A.; Cheng, H.-M.; Enoki, T.; Gogotsi, Y.; Hurt, R.H.; Koratkar, N.; Kyotani, T.; Monthioux, M.; Park, C.R.; Tascon, J.M.D.; et al. All in the graphene family—A recommended nomenclature for two-dimensional carbon materials. Carbon 2013, 65, 1–6. [Google Scholar] [CrossRef]
  4. Hernandez, Y.; Nicolosi, V.; Lotya, M.; Blighe, F.M.; Sun, Z.; De, S.; McGovern, I.T.; Holland, B.; Byrne, M.; Gun’Ko, Y.K.; et al. High-yield production of graphene by liquid-phase exfoliation of graphite. Nat. Nanotechnol. 2008, 3, 563–568. [Google Scholar] [CrossRef] [Green Version]
  5. Parvez, K.; Wu, Z.S.; Li, R.; Liu, X.; Graf, R.; Feng, X.; Mullen, K. Exfoliation of graphite into graphene in aqueous solutions of inorganic salts. J. Am. Chem. Soc. 2014, 136, 6083–6091. [Google Scholar] [CrossRef] [PubMed] [Green Version]
  6. Stankovich, S.; Dikin, D.A.; Piner, R.D.; Kohlhaas, K.A.; Kleinhammes, A.; Jia, Y.; Wu, Y.; Nguyen, S.T.; Ruoff, R.S. Synthesis of graphene-based nanosheets via chemical reduction of exfoliated graphite oxide. Carbon 2007, 45, 1558–1565. [Google Scholar] [CrossRef]
  7. Hummers, W.S.; Offeman, R.E. Preparation of Graphitic Oxide. J. Am. Chem. Soc. 1958, 80, 1339. [Google Scholar] [CrossRef]
  8. Pei, S.; Cheng, H.-M. The reduction of graphene oxide. Carbon 2012, 50, 3210–3228. [Google Scholar] [CrossRef]
  9. Marcano, D.C.; Kosynkin, D.V.; Berlin, J.M.; Sinitskii, A.; Sun, Z.; Slesarev, A.; Alemany, L.B.; Lu, W.; Tour, J.M. Improved synthesis of graphene oxide. ACS Nano 2010, 4, 4806–4814. [Google Scholar] [CrossRef]
  10. Zhao, S.; Xie, S.; Zhao, Z.; Zhang, J.; Li, L.; Xin, Z. Green and High-Efficiency Production of Graphene by Tannic Acid-Assisted Exfoliation of Graphite in Water. ACS Sustain. Chem. Eng. 2018, 6, 7652–7661. [Google Scholar] [CrossRef]
  11. Paton, K.R.; Varrla, E.; Backes, C.; Smith, R.J.; Khan, U.; O’Neill, A.; Boland, C.; Lotya, M.; Istrate, O.M.; King, P.; et al. Scalable production of large quantities of defect-free few-layer graphene by shear exfoliation in liquids. Nat. Mater. 2014, 13, 624–630. [Google Scholar] [CrossRef] [PubMed]
  12. Khan, U.; O’Neill, A.; Porwal, H.; May, P.; Nawaz, K.; Coleman, J.N. Size selection of dispersed, exfoliated graphene flakes by controlled centrifugation. Carbon 2012, 50, 470–475. [Google Scholar] [CrossRef]
  13. Backes, C.; Szydlowska, B.M.; Harvey, A.; Yuan, S.; Vega-Mayoral, V.; Davies, B.R.; Zhao, P.L.; Hanlon, D.; Santos, E.J.; Katsnelson, M.I.; et al. Production of Highly Monolayer Enriched Dispersions of Liquid-Exfoliated Nanosheets by Liquid Cascade Centrifugation. ACS Nano 2016, 10, 1589–1601. [Google Scholar] [CrossRef] [PubMed]
  14. Khan, U.; O’Neill, A.; Lotya, M.; De, S.; Coleman, J.N. High-concentration solvent exfoliation of graphene. Small 2010, 6, 864–871. [Google Scholar] [CrossRef]
  15. Halim, U.; Zheng, C.R.; Chen, Y.; Lin, Z.; Jiang, S.; Cheng, R.; Huang, Y.; Duan, X. A rational design of cosolvent exfoliation of layered materials by directly probing liquid-solid interaction. Nat. Commun. 2013, 4, 2213. [Google Scholar] [CrossRef]
  16. Lotya, M.; Hernandez, Y.; King, P.J.; Smith, R.J.; Nicolosi, V.; Karlsson, L.S.; Blighe, F.M.; De, S.; Wang, Z.; McGovern, I.T.; et al. Liquid phase production of graphene by exfoliation of graphite in surfactant/water solutions. J. Am. Chem. Soc. 2009, 131, 3611–3620. [Google Scholar] [CrossRef] [Green Version]
  17. Coleman, J.N. Liquid exfoliation of defect-free graphene. Acc. Chem. Res. 2013, 46, 14–22. [Google Scholar] [CrossRef]
  18. Shen, J.; He, Y.; Wu, J.; Gao, C.; Keyshar, K.; Zhang, X.; Yang, Y.; Ye, M.; Vajtai, R.; Lou, J.; et al. Liquid Phase Exfoliation of Two-Dimensional Materials by Directly Probing and Matching Surface Tension Components. Nano Lett. 2015, 15, 5449–5454. [Google Scholar] [CrossRef]
  19. Arao, Y.; Mizuno, Y.; Araki, K.; Kubouchi, M. Mass production of high-aspect-ratio few-layer-graphene by high-speed laminar flow. Carbon 2016, 102, 330–338. [Google Scholar] [CrossRef]
  20. Mori, F.; Kubouchi, M.; Arao, Y. Effect of graphite structures on the productivity and quality of few-layer graphene in liquid-phase exfoliation. J. Mater. Sci. 2018, 53, 12807–12815. [Google Scholar] [CrossRef]
  21. Barwich, S.; Khan, U.; Coleman, J.N. A Technique To Pretreat Graphite Which Allows the Rapid Dispersion of Defect-Free Graphene in Solvents at High Concentration. J. Phys. Chem. C 2013, 117, 19212–19218. [Google Scholar] [CrossRef]
  22. Yang, L.; Zhao, F.; Zhao, Y.; Sun, Y.; Yang, G.; Tong, L.; Zhang, J. Enhanced exfoliation efficiency of graphite into few-layer graphene via reduction of graphite edge. Carbon 2018, 138, 390–396. [Google Scholar] [CrossRef]
  23. Lotya, M.; King, P.J.; Khan, U.; De, S.; Coleman, J.N. High-concentration, surfactant-stabilized graphene dispersions. ACS Nano 2010, 4, 3155–3162. [Google Scholar] [CrossRef] [PubMed]
  24. Arao, Y.; Mori, F.; Kubouchi, M. Efficient solvent systems for improving production of few-layer graphene in liquid phase exfoliation. Carbon 2017, 118, 18–24. [Google Scholar] [CrossRef]
  25. Chen, H.; Liu, B.; Yang, Q.; Wang, S.; Liu, W.; Zheng, X.; Liu, Z.; Liu, L.; Xiong, C. Facile one-step exfoliation of large-size 2D materials via simply shearing in triethanolamine. Mater. Lett. 2017, 199, 124–127. [Google Scholar] [CrossRef]
  26. Manna, K.; Huang, H.-N.; Li, W.-T.; Ho, Y.-H.; Chiang, W.-H. Toward Understanding the Efficient Exfoliation of Layered Materials by Water-Assisted Cosolvent Liquid-Phase Exfoliation. Chem. Mater. 2016, 28, 7586–7593. [Google Scholar] [CrossRef]
  27. Mahmoud, A.E.D.; Stolle, A.; Stelter, M. Sustainable Synthesis of High-Surface-Area Graphite Oxide via Dry Ball Milling. ACS Sustain. Chem. Eng. 2018, 6, 6358–6369. [Google Scholar] [CrossRef]
  28. Xing, T.; Mateti, S.; Li, L.H.; Ma, F.; Du, A.; Gogotsi, Y.; Chen, Y. Gas Protection of Two-Dimensional Nanomaterials from High-Energy Impacts. Sci. Rep. 2016, 6, 35532. [Google Scholar] [CrossRef] [Green Version]
  29. Leon, V.; Rodriguez, A.M.; Prieto, P.; Prato, M.; Vazquez, E. Exfoliation of graphite with triazine derivatives under ball-milling conditions: Preparation of few-layer graphene via selective noncovalent interactions. ACS Nano 2014, 8, 563–571. [Google Scholar] [CrossRef]
  30. Buzaglo, M.; Bar, I.P.; Varenik, M.; Shunak, L.; Pevzner, S.; Regev, O. Graphite-to-Graphene: Total Conversion. Adv. Mater. 2017, 29, 1603528. [Google Scholar] [CrossRef]
  31. Arao, Y.; Tanks, J.D.; Kubouchi, M.; Ito, A.; Hosoi, A.; Kawada, H. Direct exfoliation of layered materials in low-boiling point solvents using weak acid salts. Carbon 2019, 142, 261–268. [Google Scholar] [CrossRef]
  32. Arao, Y.; Tanks, J.; Aida, K.; Kubouchi, M. Mechanochemical reaction using weak acid salts enables dispersion and exfoliation of nanomaterials in polar solvents. J. Mater. Sci. 2018, 54, 4546–4558. [Google Scholar] [CrossRef]
  33. Arao, Y.; Kuwahara, R.; Ohno, K.; Tanks, J.; Aida, K.; Kubouchi, M.; Takeda, S. Mass production of low-boiling point solvent- and water-soluble graphene by simple salt-assisted ball milling. Nanoscale Adv. 2019, 1, 4955–4964. [Google Scholar] [CrossRef] [Green Version]
  34. Iwashita, N.; Park, C.R.; Fujimoto, H.; Shiraishi, M.; Inagaki, M. Specification for a standard procedure of X-ray diffraction measurements on carbon materials. Carbon 2004, 42, 701–714. [Google Scholar] [CrossRef]
  35. Sharma, A.; Kyotani, T.; Tomita, A. Comparison of structural parameters of PF carbon from XRD and HRTEM techniques. Carbon 2000, 38, 1977–1984. [Google Scholar] [CrossRef]
  36. Fujimoto, H. Theoretical X-ray scattering intensity of carbons with turbostratic stacking and AB stacking structures. Carbon 2003, 41, 1585–1592. [Google Scholar] [CrossRef]
  37. Badenhorst, H. Microstructure of natural graphite flakes revealed by oxidation: Limitations of XRD and Raman techniques for crystallinity estimates. Carbon 2014, 66, 674–690. [Google Scholar] [CrossRef] [Green Version]
  38. O’Neill, A.; Khan, U.; Coleman, J.N. Preparation of High Concentration Dispersions of Exfoliated MoS2 with Increased Flake Size. Chem. Mater. 2012, 24, 2414–2421. [Google Scholar] [CrossRef]
  39. O’Neill, A.; Khan, U.; Nirmalraj, P.N.; Boland, J.; Coleman, J.N. Graphene Dispersion and Exfoliation in Low Boiling Point Solvents. J. Phys. Chem. C 2011, 115, 5422–5428. [Google Scholar] [CrossRef]
  40. Cançado, L.G.; Takai, K.; Enoki, T.; Endo, M.; Kim, Y.A.; Mizusaki, H.; Jorio, A.; Coelho, L.N.; Magalhães-Paniago, R.; Pimenta, M.A. General equation for the determination of the crystallite size La of nanographite by Raman spectroscopy. Appl. Phys. Lett. 2006, 88, 163106. [Google Scholar] [CrossRef]
  41. Pimenta, M.A.; Dresselhaus, G.; Dresselhaus, M.S.; Cancado, L.G.; Jorio, A.; Saito, R. Studying disorder in graphite-based systems by Raman spectroscopy. Phys. Chem. Chem. Phys. 2007, 9, 1276–1291. [Google Scholar] [CrossRef] [PubMed]
  42. Podila, R.; Anand, B.; Spear, J.T.; Puneet, P.; Philip, R.; Sai, S.S.; Rao, A.M. Effects of disorder on the optical properties of CVD grown polycrystalline graphene. Nanoscale 2012, 4, 1770–1775. [Google Scholar] [CrossRef] [PubMed]
  43. Arao, Y.; Kubouchi, M. High-rate production of few-layer graphene by high-power probe sonication. Carbon 2015, 95, 802–808. [Google Scholar] [CrossRef]
  44. Kauling, A.P.; Seefeldt, A.T.; Pisoni, D.P.; Pradeep, R.C.; Bentini, R.; Oliveira, R.V.B.; Novoselov, K.S.; Castro Neto, A.H. The Worldwide Graphene Flake Production. Adv. Mater. 2018, 30, e1803784. [Google Scholar] [CrossRef] [PubMed]
  45. Smith, R.J.; Lotya, M.; Coleman, J.N. The importance of repulsive potential barriers for the dispersion of graphene using surfactants. New J. Phys. 2010, 12, 125008. [Google Scholar] [CrossRef]
  46. Yi, M.; Shen, Z.; Liang, S.; Liu, L.; Zhang, X.; Ma, S. Water can stably disperse liquid-exfoliated graphene. Chem. Commun. 2013, 49, 11059–11061. [Google Scholar] [CrossRef]
Figure 1. SEM images of (a) natural graphite and (b) ball-milled graphite (anionic graphite).
Processes 08 00028 g001
Figure 2. Concentration of graphene as a function of centrifugation speed for a constant sonication time of 3 min in 2-propanol (IPA)/water cosolvent.
Processes 08 00028 g002
Figure 3. Atomic force microscopy (AFM) images of exfoliated graphene for dispersion of IPA/water cosolvent centrifuged at 1000 rpm for 10 min.
Processes 08 00028 g003
Figure 4. Effect of centrifugation speed on (a) lateral size and (b) average layer number for IPA/water cosolvent.
Processes 08 00028 g004
Figure 5. Images of graphene dispersion in acetone, methyl ethyl ketone (MEK), and IPA for (a) natural graphite and (b) anionic graphite.
Processes 08 00028 g005
Figure 6. Graphene concentration in each solvent using natural graphite (white bars) and anionic graphite (colored bars).
Processes 08 00028 g006
Figure 7. Length and layer number distribution of graphene exfoliated in (a) acetone, (b) MEK, and (c) IPA. At least 50 flakes were measured by AFM. Length was rounded off to the first digit.
Processes 08 00028 g007
Figure 8. Raman spectra of anionic graphene films deposited on PTFE membranes for a sonication time of 3 min (centrifugation: 500 rpm for 10 min) in various solvents.
Processes 08 00028 g008
Figure 9. Relationship between graphene crystallite size and damage ratio. White plots are the data corrected in this study, and red plots are the data corrected the previous study.
Processes 08 00028 g009
Figure 10. Recycling of the sediment: (a) schematic of the recycling process and (b) graphene concentration as a function of recycling number.
Processes 08 00028 g010
Figure 11. Characterization of exfoliated graphene powder by XRD. Inset: graphene powder collected by vacuum filtering of graphene dispersion in IPA/water cosolvent.
Processes 08 00028 g011
Figure 12. Dominant mode of exfoliation for anionic graphite of different sizes. The absorbed salt (blue-colored one) generates negative charging by dissociation in liquid. The edge fragmentation occurs dominantly by sonication. During edge fragmentation, some functionalization occurs (red-colored one, presumably H and OH).
Processes 08 00028 g012
Table 1. d-Spacing and crystal thickness of graphite powder obtained by XRD measurement.
Graphited (002) nmThickness Lc (002) nmCrystal Size La (110) nm
Natural graphite (Wako)0.3357230792
Graphite before milling (Aldrich)0.33541578>1000
Milled graphite (anionic graphite)0.3354665>1000 (3280)
Exfoliated anionic graphene0.335857.5>1000 (1170)

