Abstract
Fruit packaging is a time-consuming task due to its low automation level. The gentle handling required by some kinds of fruits and their natural variations complicates the implementation of automated quality controls and tray positioning for final packaging. In this article, we propose a method for the automatic localization and pose estimation of apples captured by a Red-Green-Blue (RGB) camera using convolutional neural networks. Our pose estimation algorithm uses a cascaded structure composed of two independent convolutional neural networks: one for the localization of apples within the images and a second for the estimation of the three-dimensional rotation of the localized and cropped image area containing an apple. We used a single shot multi-box detector to find the bounding boxes of the apples in the images. Lie algebra is used for the regression of the rotation, which represents an innovation in this kind of application. We compare the performances of four different network architectures and show that this kind of representation is more suitable than using state-of-the-art quaternions. By using this method, we achieved a promising accuracy for the rotation regression of 98.36%, considering an error range lower than 15 degrees, forming a base for the automation of fruit packing systems.
1. Introduction
The food industry has been showing an increasing demand for high-quality products [1]. The fruit consumption in Germany amounted to more than 65 kg per head on average in the year 2016 [2]. The turnover in fruit and vegetable processing in Germany during the same period reached approximately 10.5 billion € [3], distributed over more than 240 companies with more than 31,700 employees involved in this field [4,5]. The processes chain for fruit harvesting and sale can be summarized in the following steps. First, the fruit is collected, washed and distributed according to its size, color, shape or weight. These factors are used to classify the fruit according to their quality. The fruit is usually stored and prepared to be transported as bulk cargo. Once it reaches the distribution centers, the fruit is packaged, labeled and sent to the markets for sale. Fruit packaging usually consists of positioning the fruit in cartons or trays. The fruit should be inspected manually to discard fruit with defects or in poor condition. In order to package the fruit in trays, the fruit must lay with a determinate orientation such that the package and the fruit will not be affected. In the case of apples, the stem is carefully positioned to avoid tearing the plastic film used for packaging.
The final presentation of the product and damage prevention are the main reasons to place pressure-sensitive fruits, such as apples, pears, and kiwis, in trays. The packaging is currently done with expensive and inflexible machinery, which increases the operational cost of the product. The process can be automated and integrated with existing systems using robotic arms that can collaborate with the employees, but the position and possible defects of the fruit must be identified first. Advances in vision-based systems are becoming an essential part of the production and logistics sector, representing one of the key concepts of Industry 4.0 [6]. The use of advanced machine-learning tools such as deep-learning can allow advanced image processing with high adaptability to variable conditions. In this article, we propose a vision-based system able to identify the position and orientation of apples in a picture taken from a charge-coupled device (CCD) camera. For this purpose, we propose a cascaded system architecture using one convolutional neural network (CNN) to detect the apples and their bounding box and a second CNN to estimate the rotation of each apple.
2. Related Literature
The use of convolutional neural networks (CNNs) has been revolutionary for image classification tasks; in most cases, the results obtained are more accurate and more accessible to achieve than conventional methods [7]. Pose estimation is a challenging task that includes the 3D location and orientation of an object in space. Finding the pose of an object using images can be approached using CNNs. In order to perform classification, the continuous space should be fragmented into the desired number of classes, but this approach would produce uncertainty depending on the number of classes.
Additionally, the relationship between consecutive classes is ignored. An alternative to classification is regression, which returns a continuous value instead of the discrete classes. Due to its inherent property of continuity, most recent attempts for orientation estimation are done by regression [8,9,10].
The use of CNNs for pose estimation was proposed by Xiang et al. with a new CNN architecture named PoseCNN [10]. PoseCNN predicts 3D rotation by regressing it to a quaternion representation. The network could handle occlusion and symmetric objects by means of two new loss functions. PoseCNN is based merely on vision data, proving the feasibility of 6D pose estimation without additional sensors. Nevertheless, it shows that obtaining the orientation of small objects with less texture is less precise, and apples or similar objects were not included in the dataset.
Deep-6DPose is another network able to find the pose using CNNs. The network localizes the object in one branch and a second branch determines the rotation and depth. This method uses regression, but instead of using the quaternion representation like other methods, it uses Lie algebra for the rotation estimation, which allows the network to predict each element independently without constraint [8]. Instead of using only one CNN for pose estimation, it is also possible to create a cascaded architecture, as proposed by Rad and Lepetit, with the BB8 architecture [9]. BB8 uses a CNN for object detection and another CNN to predict the 3D bounding box of the detected object in a Red-Green-Blue (RGB) image. Finally, the pose is estimated by finding the correspondence between the projected corners and the 3D ground control points of bounding box corners. The disadvantage of this method is that the possible mismatch of the predicted corners can lead to inaccurate prediction of the pose.
Periyasamy et al. have presented a similar approach for the regression of the unit quaternion representation of the orientation [11]. Two CNNs were created to find the pose estimation based on direct regression. A dataset with RGB and RGB-Depth (RGB-D) images was designed to train the networks. The 3D orientation and 2D position were obtained from the network; the distance of the object was obtained using depth information from the RGB-D image. The method was used in complex bin-packing scenarios. Kehl et al. presented a similar approach using both RGB and RGB-D images [12]. They extended the use of a single shot multibox detector (SSD) to a pose estimator and called the network SSD-6D. The 3D rotation estimation is based on viewpoint and in-plane rotation classification.
Previous work has also addressed the orientation detection of apples using CNNs. Giefer et al. used laser triangulation to obtain images containing depth information [13]. The images were rendered using surface normal information to train existing CNNs architectures. The accuracy of the models was evaluated considering distortions lower than 15 degrees for each axis. The best result was obtained using InceptionRes-NetV2, showing a validation accuracy of 92.68%. Eizentals and Oka presented a method for the pose estimation of green pepper [14]. A laser range finder was used to obtain surface points of the fruits to which a model matching was applied to find the stem position. In Lin et al., a method for the detection and pose estimation of guavas by means of low-cost RGB-D sensors was proposed, which achieved a promising precision of 98.3% [15]. Park et al. proposed a method for 6D pose estimation of natural objects using point clouds [16]. They tested their approach using bananas and apples. They evaluated accuracy using Acc15 together with a maximum average distance with corresponding critical parts. They obtained an average accuracy of 0.79 for bananas and 0.68 for apples. Nevertheless, they did not distinguish stalk concave and the opposite concave from the apples. Lehnert et al. used fused data from and RGB-D camera and an eye-in-hand camera to represent their data [17]. They then used superellipsoid fitting to get the pose of sweet peppers, obtaining an average deviation error of 0.042 m for the position and 30.16° for the orientation in all axis. The main disadvantage of the majority of previous research is that the pose estimation techniques need depth data captured by either laser range finders, depth cameras or a combination of laser projection and a camera. To our knowledge, no other fruit pose estimation methods use CNNs and RGB images only. With our proposed method, we reduce the required hardware to a single RGB-camera.
3. Methods
3.1. Representation of Orientation of a Rigid Body
The orientation of a particular object is expressed by the rotation about its three axes and can be represented by a rotation matrix with the constraints:
and:
According to a special case of Euler’s rotation theorem, a single rotation with the rotational angle θ around the axis with is equivalent to any combination of rotations [18]. All rotation matrices of space with size belong to a so-called rotation group of size n. Hence, all rotation matrices of the third dimension represent elements of the rotation group [19]. Using Euler angles for pose estimations can lead to a problem called Gimbal lock, where two of the three rotation axes lay parallel to each other and, because of that, one degree of freedom is lost [20]. Due to that fact, we want to evaluate the suitability of two different approaches represented by quaternions and Lie algebra.
In contrast to Euler angles, quaternions are unambiguous and allow a rigid body to be rotated without the occurrence of singularities. Thereby, a four-dimensional vector space with one real component, the scalar part, and three imaginary components, the vector part, is created, which can be expressed as:
where 1, i, j, k build the basis of the quaternion over R with the real-valued coefficients a, b, c, d. By normalizing the quaternion by means of division by its magnitude, we obtained a unit quaternion with a magnitude equal to one. Due to the so-called antipodal symmetry, two possible quaternion representations exist for object orientation, which is Q and −Q [21]. By restricting the solution to the half-positive-space a > 0, we obtained a unique quaternion.
Lie algebra is an algebraic structure, and is defined by a vector space [22]. According to Lie’s third theorem, which is part of the Lie group–Lie algebra correspondence, every Lie algebra of finite dimension is associated to a particular Lie group, which enables a mapping from one into the other. Due to the fact that every rotation group represents a Lie group, rotation matrices can be mapped to a Lie algebra. Logarithmic maps serve for mapping from a Lie group to a Lie algebra, while exponential maps serve for the mapping from a Lie algebra to a Lie group. Elements of the Lie algebra of the third dimension are skew-symmetric matrices of size with the rotation vector and can be defined by:
with:
During the training of our neural network, we regressed the rotation vector w. Therefore, the logarithmic map:
with:
was used to obtain the skew-symmetric matrix from a rotation matrix. The exponential map, called Rodrigues formula:
with:
maps the Lie algebra element to a rotation matrix. With rotation angles near to zero, the second and third coefficients of the Taylor expansion were suitable to be used [23].
3.2. Image Capturing
For the capture of apple images, we used a CMOS (Complementary metal-oxide-semiconductor) RGB camera with 1.3 megapixels and up to 60 frames per second (fps). Furthermore, we attached two LED (light-emitting diode) rings for illumination purposes. A schematic illustration of the image capturing setup can be seen in Figure 1.
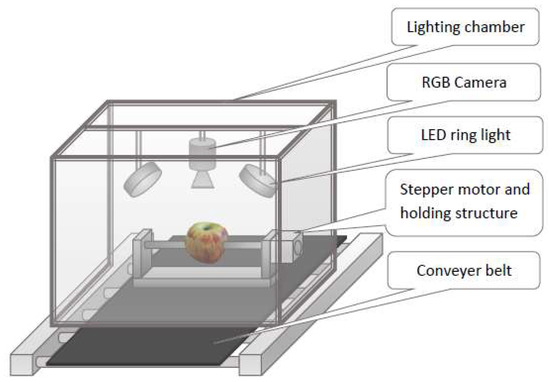
Figure 1.
Image capturing system.
We built up a database of apples containing views in 10-degree intervals, leading to 614 images per apple with a size of 640 × 512 pixels. For the whole dataset, we used 20 apples, and hence generated 12,280 images. For our localization and orientation detection networks, 80% of the images were used for training and 20% for evaluation purposes. Each image was annotated with seven numbers, which are represented by the X- and Y-coordinates of the upper left corner of the bounding box framing the apple, the X- and Y-coordinates of the lower right corner of the bounding box and the three Euler angles representing the rotation. These labels serve as ground-truth data. Due to the presumed symmetry of an apple around its Y-axis, only the rotation around the X- and Z-axis are considered. Figure 2 illustrates the rotation axis used in this work.
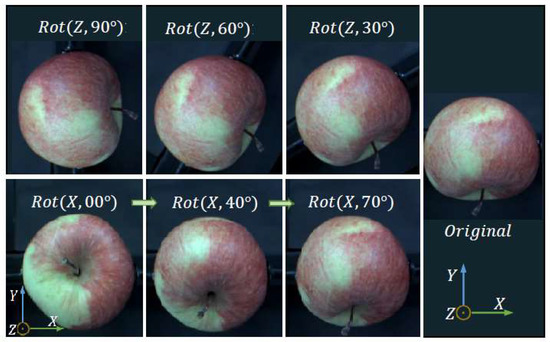
Figure 2.
Rotation axes of apples used.
Furthermore, we constructed a rotation system using a stepper motor for the automatic rotation around the apple X-axis, while the rotation around the Z-axis was made manually.
3.3. Convolutional Neural Network Architecture
To obtain the location and orientation of a captured object, we used a two-stage convolutional neural network [9]. The approach of cascading multiple CNNs allowed us to achieve high accuracies because of the task-specificity of each stage of the network. Furthermore, each stage can be trained by optimizing one specific loss function for the particular task. The neural network consists of two parts, which are represented by the position predictor for the object localization by means of bounding boxes and the object pose predictor for the estimation of the rotation angles. In the first step, the bounding box of each apple visible in an input image is regressed, and afterward, each image part within a bounding box is used for the pose estimation. For proper rotation detection, the particular object of which the orientation should be estimated has to fill the whole input image. The pipeline structure is illustrated in Figure 3.
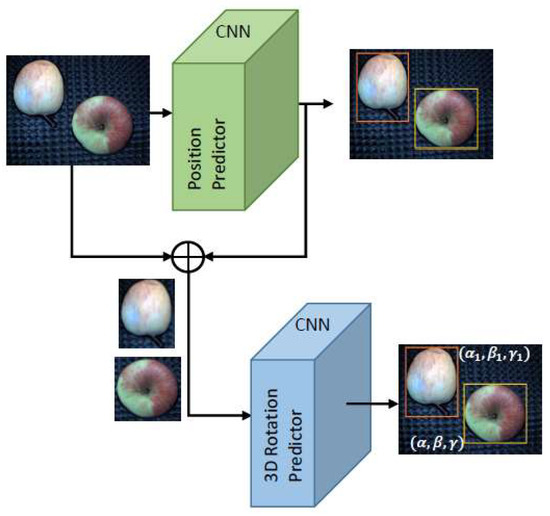
Figure 3.
Pipeline of the proposed system using cascaded convolutional neural networks (CNNs).
For the localization stage of our CNN, we use a single shot multibox detector (SSD) model which is based on the VGG-16 image classification network [24]. To find the three-dimensional orientation of an apple, we implemented the network architecture Deep-6DPose, which is one of the few models that can estimate the rotation using only RGB information [8]. Primarily, this network uses Lie algebra representation for the pose estimation. We used the standard configuration in one training sequence and additionally adapted the network to work with quaternion representation in a second run to compare these two approaches. Therefore, we changed the number of output nodes from three to four to match the number of quaternion components. Furthermore, we used a Hyperbolic tangent activation for the last layer to restrict the predicted values to the range [−1,1], and added an L2 normalizer to the network to obtain the Euclidean norm of the predicted output.
We compared the results of the Deep-6DPose model to implementations of three standard classification networks that are adjusted to perform a regression both of the quaternion and the Lie algebra representation of the apple pose. According to [25], the networks with the best accuracies belong to Inception [26], ResNet [27] and VGGNet [28].
3.4. Configuration
The standard loss function used for the SSD localization network is a combination of a confidence loss and a localization loss and defined by:
N represents the amount of matched default boxes with the ground truth boxes. If this value equals zero, the factor 1/N is set to zero. Using the hyper-parameter , the impacts of each loss function part can be balanced. The confidence is defined by a softmax loss function between the predicted and the ground-truth class [29]:
with:
For the localization loss, a smooth L1 loss, which is a robust alternative for the mean absolute error due to its lower sensitivity to outliers, between the predicted and the ground-truth bounding box was used:
with:
As a metric for evaluating the object detector predictions, we used the mean average precision (mAP) described in [30].
The loss function used for the Deep-6DPose network for the pose estimation is the mean absolute error (MAE), which is defined by:
To obtain a metric for evaluating the performance of the regression, we introduced the metric acc15, which is defined by the ratio between predictions with errors less than 15 degrees and the total number of predicted outputs. Thus we created an equivalent of the accuracy metric, which is used for classification networks, for our regression problem.
3.5. Training and Evaluation
We used 80% of our dataset for training samples and the remaining 20% for validation. For both stages of the CNN structure, we evaluated the performance of different optimizers represented by stochastic gradient descent (SGD) [31], Adam [32] and Adadelta [33], and used batch sizes of size ten because this is the limitation of our GPU. During the training we applied different types of data augmentations, for example, cropping, Gaussian and saturation noise. Early stopping was used to stop the network as soon as no improvement of our defined accuracy metric for 30 epochs was achieved, which was determined as an appropriate value before. Using that, a fixed number of epochs is not necessary. Both early stopping and image augmentation help to prevent overfitting.
We applied a 5-fold cross-validation to analyze whether our model is well-generalized and if it showed a proper behavior in practice. Therefore, we sub-divided our dataset into five equally sized subsets and used one part as validation and the remaining parts as training sets. This step was repeated five times until every subset has been used as a validation set. The mean of the validation accuracies of the five runs was used to compare the models. The results can be observed in Figure 4.
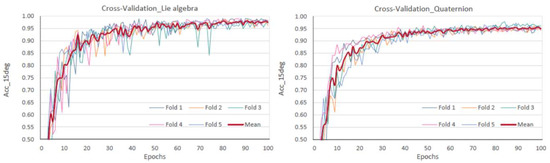
Figure 4.
5-fold cross validation: Lie algebra (left) and quaternion representation (right).
Additionally, the loss graph during testing for each iteration, shown in Figure 5, indicates that overfitting is being avoided. It is important to take into account that the values of the loss cannot be compared, since quaternions and Lie algebra have different definitions.
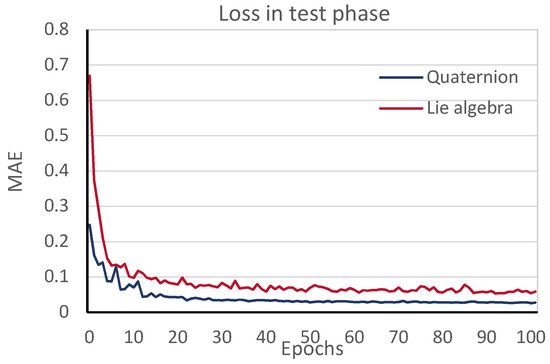
Figure 5.
Testing loss vs. iteration.
4. Results
We obtained the best results for the pose estimation both for the Lie algebra and the quaternion representation by using the Adadelta optimizer. Table 1 shows the comparison of the acc15 accuracies between the Deep-6DPose model and the adjusted standard networks.

Table 1.
Comparison of accuracies.
For our research, an error under 15 degrees does not represent a problem for placing the apples in trays. Nevertheless, other accuracy metrics provide a deeper insight into the results obtained and are shown in Table 2.
Table 2.
Comparison of accuracies.
The Lie algebra representation showed an overall better performance than the quaternion representation, except for the VGG19 network. With an accuracy of more than 98%, the Deep-6DPose model achieved the best result, which was more than three percentage points higher than the second best network (ResNet50). Even the Deep-6DPose model with quaternion representation outperformed the other models, which proves the optimal suitability for orientation detection purposes. Figure 6 shows the comparison of the angle distortion between predicted and ground-truth values. Both axes exhibited similar frequency distributions resembling one half of a Gaussian distribution centered between two and three degrees. Compared to a conference paper by several of the present authors [13], the error of the predicted angle around the X-axis is approximately three degrees less.
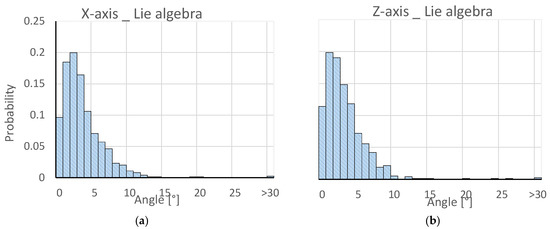
Figure 6.
Frequency distributions around the X-axis (a) and the Z-axis (b).
It is observable that our model performed well on all subsets and that we obtained a mean validation accuracy of 98.79% and 96.77% for the Lie algebra and the quaternion representation, respectively.
The position estimation stage showed the best performance using the SGD optimizer, as was originally proposed for that model. Evaluating the network localization performance with different values for the coefficient α, we obtained the lowest localization loss for a value of α = 10. Since detecting the apple in the image is not a very challenging task, it was always recognized and classified as an apple, so precision and recall are one. For this reason, the value for the intersection over union (IoU) is calculated. The apples were detected and localized in the images with a mean average precision value for the IoU of 100% when using a threshold of 80% intersection and a value of 72% when using a threshold of 90%. This proves the suitability of the chosen model for the localization task.
5. Discussion
In this article, we proposed a method for the pose estimation of apples within images captured with an RGB camera by means of a two-stage CNN system. We compared the performance of four different network models and achieved high accuracies by using a Lie algebra representation for the apple pose. This approach proves optimal suitability for applications where a determination of the precise position and rotation of objects is necessary. We showed the applicability of our method for objects with irregular shapes, which are often found in nature, and thus our method could build a basis for a lot of different applications, for example in the food industry.
For future work, we want to extend our model to obtain the ability of surface defect detection, for example, scratches, fungi or bruises. Additionally, we want to train our network to classify different kinds of fruits, and thus, as a result, establish a fully-automated fruit sorting and packing system.
Author Contributions
Conceptualization, J.D.A.C.; methodology, M.M.B.; validation, L.A.G.; investigation, M.M.B.; writing—original draft preparation, L.A.G.; writing—review and editing, J.D.A.C. and M.F.; visualization, M.M.B.; supervision, M.F.; project administration, L.A.G., J.D.A.C. and M.F.; funding acquisition, M.F.
Funding
This work is part of the research project “CooPick—Collaborative robot-robot-human interaction for fruit laying”, funded by the German Federal Ministry of Economic Affairs and Energy (BMWi), funding code ZF4181406DB7.
Conflicts of Interest
The authors declare no conflict of interest.
References
- Elakkiya, N.; Karthikeyan, S.; Ravi, T. (Eds.) Survey of grading process for agricultural foods by using artificial intelligence technique. In Proceedings of the 2018 Second international conference on electronics, communication and aerospace technology (ICECA), Coimbatore, India, 29–31 March 2018; IEEE: Piscataway, NJ, USA, 2018. [Google Scholar]
- Statista: Pro-Kopf-Konsum von Obst in Deutschland in den Wirtschaftsjahren 2004/2005 bis 2015/2016 (in Kilogramm). Available online: Https://de.statista.com/statistik/daten/studie/6300/umfrage/pro-kopf-verbrauch-von-obst-in-deutschland/ (accessed on 2 February 2019).
- Statista: Umsatz in der Obst- und Gemüseverarbeitung in Deutschland in den Jahren 1995 bis 2017 (in Millionen Euro). Available online: https://de.statista.com/statistik/daten/studie/37936/umfrage/umsatz-in-der-obst--und-gemueseverarbeitung-in-deutschland-seit-1995/ (accessed on 2 February 2019).
- Statista: Anzahl der Beschäftigten in der Obst- und Gemüseverarbeitung in Deutschland in den Jahren 2007 bis 2017. Available online: https://de.statista.com/statistik/daten/studie/37934/umfrage/beschaeftigte-in-der-obst--und-gemueseverarbeitung/ (accessed on 2 February 2019).
- Statista: Anzahl der Betriebe in der Obst- und Gemüseverarbeitung in Deutschland in den Jahren 2008 bis 2017. Available online: https://de.statista.com/statistik/daten/studie/37938/umfrage/betriebe-in-der-obst--und-gemueseverarbeitung/ (accessed on 2 February 2019).
- Zhong, R.Y.; Xu, X.; Klotz, E.; Newman, S.T. Intelligent manufacturing in the context of industry 4.0: A review. Engineering 2017, 3, 616–630. [Google Scholar] [CrossRef]
- Rawat, W.; Wang, Z. Deep convolutional neural networks for image classification: A comprehensive review. Neural Comput. 2017, 29, 2352–2449. [Google Scholar] [CrossRef] [PubMed]
- Do, T.T.; Cai, M.; Pham, T.; Reid, I. Deep-6DPose: Recovering 6D Object Pose from a Single RGB Image. Available online: https://arxiv.org/pdf/1802.10367 (accessed on 15 July 2018).
- Rad, M.; Lepetit, V. (Eds.) BB8: A scalable, accurate, robust to partial occlusion method for predicting the 3D poses of challenging objects without using depth. In Proceedings of the IEEE International Conference on Computer Vision, Venice, Italy, 22–29 October 2017. [Google Scholar]
- Xiang, Y.; Schmidt, T.; Narayanan, V.; Fox, D. Posecnn: A convolutional neural network for 6d object pose estimation in cluttered scenes. arXiv 2017, arXiv:1711.00199. [Google Scholar]
- Periyasamy, A.S.; Schwarz, M. (Eds.) Robust 6D Object Pose Estimation in Cluttered Scenes using Semantic Segmentation and Pose Regression Networks. In Proceedings of the 2018 IEEE/RSJ International Conference on Intelligent Robots and Systems (IROS), Madrid, Spain, 1–5 October 2018; IEEE: Piscataway, NJ, USA, 2018. [Google Scholar]
- Kehl, W.; Manhardt, F.; Tombari, F. (Eds.) SSD-6D: Making RGB-based 3D detection and 6D pose estimation great again. In Proceedings of the IEEE International Conference on Computer Vision, Venice, Italy, 22–29 October 2017. [Google Scholar]
- Giefer, L.A.; Arango, J.D.; Faghihabdolahi, M.; Freitag, M. (Eds.) Orientation Detection of Fruits by means of Convolutional Neural Networks and Laser Line Projection for the Automation of Fruit Packing Systems. In Proceedings of the 13th CIRP Conference on Intelligent Computation in Manufacturing Engineering, Gulf of Naples, Italy, 17–19 July 2019. [Google Scholar]
- Eizentals, P.; Oka, K. 3D pose estimation of green pepper fruit for automated harvesting. Comput. Electron. Agric. 2016, 128, 127–140. [Google Scholar] [CrossRef]
- Lin, G.; Tang, Y.; Zou, X.; Xiong, J.; Li, J. Guava detection and pose estimation using a low-cost RGB-D Sensor in the field. Sensors 2019, 19, 428. [Google Scholar] [CrossRef]
- Park, K.; Prankl, J.; Vincze, M. Mutual Hypothesis Verification for 6D Pose Estimation of Natural Objects. In Proceedings of the 2017 IEEE International Conference on Computer Vision Workshops (ICCVW), Venice, Italy, 22–29 October 2017; IEEE: Piscataway, NJ, USA, 2017. [Google Scholar]
- Lehnert, C.; Sa, I.; McCool, C.; Upcroft, B.; Perez, T. Sweet pepper pose detection and grasping for automated crop harvesting. In Proceedings of the 2016 IEEE International Conference on Robotics and Automation (ICRA), Stockholm, Sweden, 16–21 May 2016; IEEE: Piscataway, NJ, USA, 2016. [Google Scholar]
- Huang, L. A concise introduction to mechanics of rigid bodies. In Multidisciplinary Engineering; Springer: New York, NY, USA, 2012. [Google Scholar]
- Baker, A. Matrix Groups: An Introduction to Lie Group Theory; Springer Science & Business Media: Berlin, Germany, 2012. [Google Scholar]
- Perumal, L. Quaternion and its application in rotation using sets of regions. Int. J. Eng. Technol. Innov. 2011, 1, 35–52. [Google Scholar]
- Saxena, A.; Driemeyer, J.; Ng, A.Y. Learning 3-D object orientation from images. In Proceedings of the IEEE International Conference on Robotics and Automation, Kobe, Japan, 12–17 May 2009; IEEE: Piscataway, NJ, USA, 2009; pp. 794–800. [Google Scholar] [CrossRef]
- Bourbaki, N. Lie Groups and Lie Algebras: Chapters 1–3; Springer: Berlin/Heidelberg, Germany, 1989. [Google Scholar]
- Selig, J.M. Geometrical Methods in Robotics; Springer Science & Business Media: Berlin, Germany, 2013. [Google Scholar]
- Liu, W.; Anguelov, D.; Erhan, D.; Szegedy, C. (Eds.) Ssd: Single Shot Multibox Detector. European Conference on Computer Vision; Springer: Berlin/Heidelberg, Germany, 2016. [Google Scholar]
- Canziani, A.; Paszke, A.; Culurciello, E. An Analysis of Deep Neural Network Models for Practical Applications. arXiv 2016, arXiv:1605.07678. [Google Scholar]
- Szegedy, C.; Ioffe, S.; Vanhoucke, V.; Alemi, A. (Eds.) Inception-v4, inception-resnet and the impact of residual connections on learning. In Proceedings of the Thirty-First AAAI Conference on Artificial Intelligence, San Francisco, CA, USA, 4–9 February 2017. [Google Scholar]
- He, K.; Zhang, X.; Ren, S.; Sun, J. Deep Residual Learning for Image Recognition. 2015. Available online: https://arxiv.org/pdf/1512.03385 (accessed on 15 March 2019).
- Simonyan, K.; Zisserman, A. Very Deep Convolutional Networks for Large-Scale Image Recognition. Available online: https://arxiv.org/pdf/1409.1556 2015 (accessed on 15 March 2019).
- Bishop, C.M. Pattern Recognition and Machine Learning; Springer: Berlin/Heidelberg, Germany, 2006. [Google Scholar]
- Everingham, M.; Winn, J. The PASCAL visual object classes challenge 2012 (VOC2012) development kit. Pattern Analysis, Statistical Modelling and Computational Learning. Tech. Rep. Section 3.3, pg. 12, 2011. Available online: http://host.robots.ox.ac.uk/pascal/VOC/voc2012/devkit_doc.pdf (accessed on 15 March 2019).
- Ruder, S. An overview of gradient descent optimization algorithms. arXiv 2016, arXiv:1609.04747. [Google Scholar]
- Kingma, D.P.; Ba, J. Adam: A method for stochastic optimization. arXiv 2014, arXiv:1412.6980. [Google Scholar]
- Zeiler, M.D. ADADELTA: An Adaptive Learning Rate Method. Available online: https://arxiv.org/pdf/1212.5701 2012 (accessed on 15 March 2019).


© 2019 by the authors. Licensee MDPI, Basel, Switzerland. This article is an open access article distributed under the terms and conditions of the Creative Commons Attribution (CC BY) license (http://creativecommons.org/licenses/by/4.0/).