Abstract
Because of the limitation of mining techniques and economic conditions, large amounts of residual coal resources have been left in underground coal mines around the world. Currently, with mining technology gradually developing, residual coal can possibly be remined. However, when residual coal is remined, caving areas might form, which can seriously affect the safety of coal mining. Hence, grouting technology is put forward as one of the most effective technologies to solve this problem. To study the grouting diffusion in fractured rock mass, this paper developed a visualization platform of grouting diffusion and a three-dimensional grouting experimental system that can monitor the grout diffusion range, diffusion time and grout pressure; then, a grouting experiment is conducted based on this system. After that, the pattern of the grouting pressure variation, grout flow and grout diffusion surface are analyzed. The relationship among some factors, such as the grouting diffusion radius, compressive strength of the grouted gravel, porosity, water-cement ratio, grouting pressure, grouting time, permeability coefficient and level of grout, is quantitatively analyzed by using MATLAB. The study results show that the flow pattern of the grout in fractured porous rock mass has a parabolic shape from the grouting hole to the bottom. The lower the level is, the larger the diffusion range of the grout is. The grouting pressure has the greatest influence on the grouting diffusion radius, followed by the grouting horizon and water-cement ratio. The grouting permeability coefficient has the least influence on the grouting diffusion radius. The grout water-cement ratio has the greatest influence on the strength of the grouted gravel, followed by the grouting permeability. The grouting pressure coefficient has the least amount of influence on the grouting diffusion radius. According to the results, the grouting parameters are designed, and a layered progressive grouting method is proposed. Finally, borehole observation and a core mechanical property test are conducted to verify the application effect. This grouting technology can contribute to the redevelopment and efficient utilization of wasted underground coal resources.
1. Introduction
Due to technique limitations and economic conditions, some relatively outdated coal mining methods, such as the room pillar type and lane column type, have been widely used throughout the world for a considerable portion of coal mining history. Hence, large amounts coal resources (residual coal) that were left behind in the gob to maintain stability were wasted [1]. With the development of mining technology, the redevelopment and utilization of residual coal has become possible. Recycling this part of coal resources can fulfill the requirements for the efficient development and utilization of resources. It is also a requirement for coal mining companies to maintain their long-term development and can have a significant impact on the sustainable development of old mining areas. Residual coal repeated mining refers to the use of mechanized coal mining technology to mine residual coal left in old mining areas [2]. However, several collapsed zones, which seriously influence the production and safety of the coal mines, exist in residual coal repeated mining areas. There are many methods that deal with mining faces that repeatedly cross a collapsed zone [3,4,5,6]. Grouting in the rock mass of a collapsed zone is one of the most effective technologies for solving this problem. Through grouting, the rock mass of a collapsed zone can be cemented into continuous and stable blocks, and the physical and mechanical parameters of the rock mass can be significantly improved. Therefore, the shearer will be able to pass through the caving area safely. Whether the cemented coal and rock mass can meet the requirements after grouting is mainly affected by the diffusion radius of the grout, the strength of the mass and the layout parameters of the grouting holes. In other words, the key to solving this problem is to determine the law of grouting diffusion in a fractured rock mass.
Over the past few decades, extensive research has been conducted on the relationship between grouting factors, the grout diffusion radius and the strength of the mass. In theoretical research of grout diffusion, Marwan Ahmed et al. established a mathematical model of grout seepage based on the partition of the fractured rock mass and analyzed the diffusion characteristic of grout in different areas [7]. Li Shenju et al. studied the grout penetration law in the surrounding rock containing an orthogonal fracture by the permeability tensor method [8]. Di Nucci systematically studied the diffusion law of grout in a one-dimensional fracture via a model test and numerical simulation [9]. Kelessidis V C et al. proposed a different and optimal methodology to determine the three Herschel–Bulkley rheological parameters of drilling fluids [10]. Li Shucai et al. studied the movement law of grout in porous media based on a theoretical model of the percolation threshold effect. This revealed the influence mechanism of the diafiltration effect on grout diffusion and the effective reinforcement range [11]. In the grout diffusion calculation, Huang Yaoguang et al. deduced the basic equation of the unsteady diffusion of grout under a coupling effect of disturbance stress and grouting pressure, considering the effect of the excavation disturbance and grouting pressure attenuation on the diffusion law of grout [12]. Saada Z et al. established the one-dimensional unidirectional grouting model based on grout seepage and deduced the analytical solution of one-dimensional grout diffusion [13]. Rafi et al. deduced the diffusion radius of the Bingham grout in the fractured rock mass [14]. Shimada Hideki et al. deduced the formula for calculating the effective diffusion radius of the Bingham fluid in the soft and broken seam based on the generalized Darcy law and the spherical diffusion theory model [15]. Funehag J et al. obtained the relationship between grouting pressure, seepage velocity, grouting time and grout diffusion radius by simulating the grout flow process in a single fracture [16,17]. In a grouting test, Minto James M. et al. determined the parameters of the grouting pressure and diffusion radius by the field grouting test [18]. Ge Jialiang et al. analyzed the influence of the grouting material, the grout water-cement ratio and its properties, the grouting pressure and other factors on the grouting volume, the grout diffusion radius and the strength of grouted gravel through a grouting simulation test [19].
A fractured rock consists of large, loose rock masses (Figure 1). The grout flows mainly in a macroscopic gap (void) rather than in mesoscopic pores or fractures. However, the above research is mainly focused on the grouting of a jointed fractured rock mass. Only a few studies have been reported on fractured porous rock masses, especially fractured porous rock masses with large porosities (n > 0.4). There is essentially no quantitative formula that can guide grouting construction on-site. Hence, this paper first develops the visualization system of the grouting diffusion range and the three-dimensional grouting experiment system. Based on this system, a grouting changing performance model experiment is performed. This is followed by an analysis of the variation pattern of the grouting pressure, the grout flow pattern, and the diffusion surface pattern of grout. Then, the research results are applied to engineering practice, and the application effect analysis is performed. Finally, discussions and conclusions are presented at the end of this paper. This work can contribute to the redevelopment and efficient utilization of wasted underground coal resources.
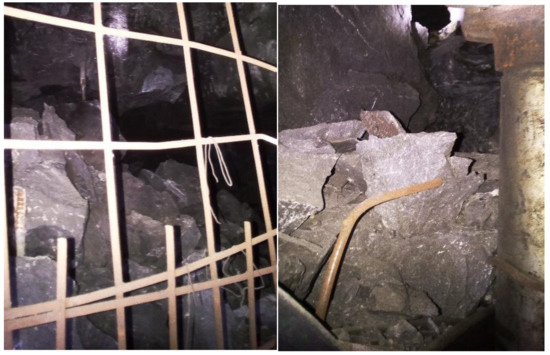
Figure 1.
Fractured porous rock mass.
2. Experimental Method
2.1. Experimental System
To study the law of grouting diffusion in a fractured porous rock mass, a series of grouting experiments were performed in the self-developed three-dimensional visualization grouting experimental system, as shown in Figure 2. The system mainly consists of three parts: grouting test-bed, grouting equipment and visualization platform.
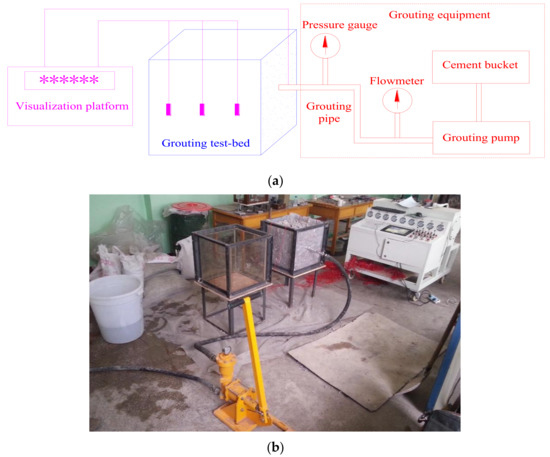
Figure 2.
The overall arrangement of the three-dimensional visualization grouting experiment system: (a) Sketch Map; (b) Practicality picture.
The grouting test-bed, which has dimensions of 0.5 m × 0.5 m × 0.5 m, is a frame welded by angle steel and surrounded by tempered glass. One piece of the tempered glass can be replaced by glass with grouting holes at different positions to simulate different grouting heights. Additionally, the bottom of the test-bed is a piece of wood with five grout overflow holes. The grouting equipment includes a cement bucket, grouting pump, pressure gauge, flowmeter, grouting pipe, stop valve, hole packer, etc. A grouting pump is a kind of manual pressure grouting pump (MG-808, Shangqin High Pressure Grouting Technology Co., Ltd., Shanghai, China). The pressure gauge and flowmeter, which are used to measure the grouting pressure and grouting volume, respectively, are installed on the grouting pipe. The visualization platform is a self-developed platform for monitoring grout diffusion under laboratory conditions. It includes the signal system (Patent No.: ZL 2016200214895), flow sensors, pressure sensors, wire, an industrial personal computer, etc. The visualization system can monitor the grouting pressure, grout diffusion range, the time of grout diffusion to the sensors and the grout diffusion pressure at the sensor during the grouting process. The visualization platform of the grouting diffusion is shown in Figure 3.
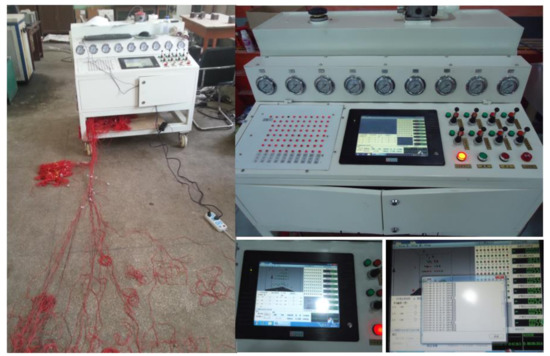
Figure 3.
The visualization platform of the grouting diffusion.
The sensors of the visualization platform are embedded in a grouting test-bed during the laying of the similar rock material, after which the spatial position of the sensors can be displayed on the screen of the visualization platform. When conducting the grouting test, once the grout has spread to the position of the sensor, the corresponding signal light in the screen of the visualization platform will light up, and then the distance between the position of the sensor and the grouting port, and the time and pressure at which the grout flows to the sensor can, be recorded.
2.2. Experimental Plan
A similar simulation of fractured porous rock mass was achieved by controlling the proportions of stones with different morphological characteristics and particle sizes. First, the rock mass at the Shenghua coal mine was sampled to measure the morphological characteristics and porosity before the experiment. Then, according to the obtained morphological characteristics and porosity, suitable stones were selected and mixed to simulate fractured porous rock mass. The grouting material used in the experiment was cement grout. Different groups of experiments were tested by adjusting the porosity of the fractured porous rock mass, the water-cement ratio of grout and the grouting pressure.
Five groups of test plans () were designed according to the uniform experimental design method [20], as shown in Table 1. The dynamic viscosity coefficients of grouts with different water-cement ratios were measured by the viscometer. The permeability and permeability coefficient of a fractured porous rock mass can be obtained by the following formulae [21].

Table 1.
The parameters of different experiments.
In Formulas (1) and (2), e is the permeability, m2; Dp is the average particle diameter, m; n is the porosity; k is the permeability coefficient, m/s; ρ is the grout density, kg/m3; g is the gravity acceleration, m/s2; and η is the dynamic viscosity coefficient, Pa·s.
In this experiment, 26 sensors of the visualization platform were embedded in the grouting test-bed. The sensors were arranged at 50 mm, 200 mm, and 300 mm vertically from the grouting hole. The positions of the sensors in the grouting test-bed are shown in Figure 4, and their coordinates are shown in Table 2.
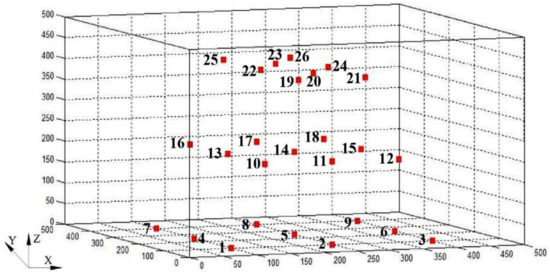
Figure 4.
Sensor positions in the grouting test-bed.
Table 2.
Visualization system sensor coordinates in the grouting test-bed.
2.3. Experimental Procedure
- (1)
- Stones with different particle sizes of 8–10 mm, 15–30 mm and 35–50 mm were selected and mixed evenly to simulate the fractured porous rock mass. Different porosities were obtained by controlling the ratios of stones with different diameters, as shown in Table 3.
Table 3. The proportions of stones with different particle sizes.
- (2)
- The mixed stone material was loaded into the grouting test-bed, and the sensors were arranged at the corresponding position of the grouting test-bed during the loading process.
- (3)
- The coordinates of the sensors were put into visualization platform. After inputting the coordinates, the green dots were displayed at the corresponding positions on the screen. During the grouting process, the green dots became red dots when the grout reached the corresponding sensor position.
- (4)
- Grouts with different water-cement ratios were prepared according to the experimental requirements. After that, the grout was stirred for 15 min in the grout bucket. The amount of grout in each experiment was 40 kg.
- (5)
- The grouting system was connected, the grouting pipe was inserted into the grouting hole, and then the grouting experiment began. The grouting pressure must be controlled within the required experimental range.
- (6)
- After grouting, the grouting pipe was pulled out from the grouting hole, the hole packer was stuffed into the grouting hole, then the grouting equipment was cleaned.
3. Result Analysis
3.1. Grouting Pressure Variation Forms
During the grouting process, the data from the pressure gauge installed on the grouting pipe was recorded in the visualization platform. The variation forms of the grouting pressure were drawn according to these data, as shown in Figure 5. It can be seen that the grouting pressure has four kinds of variation forms in the grouting experiment: (a) linear growth; (b) cyclic growth; (c) fluctuation stability and (d) slow growth. On one hand, there is a buffer for each pressure because of the manual grouting pump used. On the other hand, the grout sometimes flows into the macropores of the broken rock mass and sometimes flows into the narrow gap of the contact surface. As a result, the grouting pressure presents unstable fluctuations. Moreover, unstable fluctuations are probably transition-related due to the Herschel-Bulkley material.
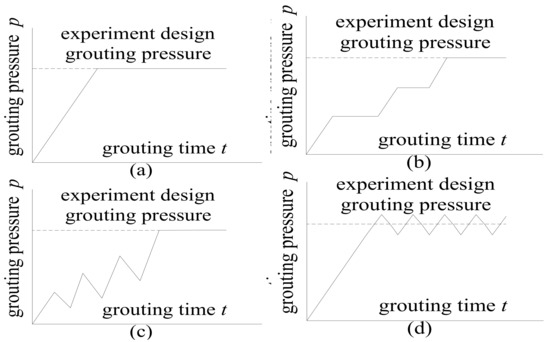
Figure 5.
Variation forms of grouting pressure: (a) Linear growth; (b) Cyclic growth; (c) Fluctuation stability; and (d) Slow growth.
3.2. Grout Diffusion Pattern
After grouting, the position of the sensors corresponding to the signal lamp light in the visualization platform is shown in Figure 6a. A rough range of grout diffusion can be seen from the visualization system, as shown in Figure 6b. To obtain a more accurate grout diffusion pattern, the three-dimensional coordinate data of the sensors were exported from the visualization platform and put into MATLAB (7.14 version, Branch office of MathWorks in China, Beijing, China, 2012). Through these data, the grout diffusion pattern was synthesized by the interpolation method embedded in MATLAB. There are two kinds of interpolation methods in MATLAB when the two known arrays are used as independent variables, namely, two-dimensional interpolation (Interp2) and two-dimensional scattered point interpolation (Griddata). The Interp2 method is characterized by the gradient distribution of independent variables in the range, which can form a regular matrix. The Griddata method is characterized by the scattered distribution of independent variables in the range, which is not a uniform distribution. In this experiment, the two independent variables are the gradient distribution and the regular matrix, which can be formed. Therefore, the Interp2 method is used. The obtained grout diffusion pattern is as shown in Figure 7. It can be seen that the flow pattern of the grout in fractured porous rock mass has a parabolic shape from the grouting hole to the bottom. The lower the level is, the larger the diffusion range of the grout is. In the horizontal direction, the grout diffusion surface around the grouting hole was an asymmetrical circular surface.
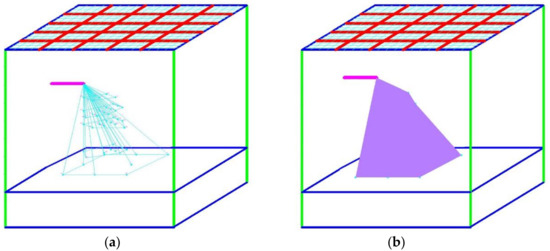
Figure 6.
Range of grout diffusion: (a) Signal lamp lighted; (b) Rough range.
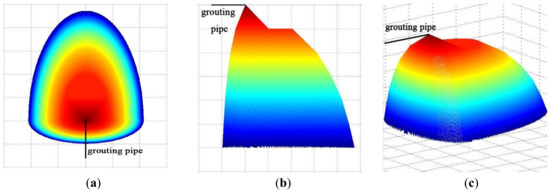
Figure 7.
Grout diffusion pattern: (a) Top view; (b) Side view; and (c) Three-dimensional diagram.
In conclusion, when the height of the grouting pipe, initial velocity of the grout, outlet angle and pore connectivity are determined, the shape of the diffusion surface is certain. Considering that the grout will solidify in a certain period of time, if only through a pipeline grouting, the first injected grout will cement to a solid within a certain range of the outlet, blocking the slurry outlet and reducing grouting efficiency. Therefore, when the spatial shape of the grouting range is determined, the grouting parameters must be designed according to the control range of each grouting pipe.
To obtain quantitative data of the grouting diffusion radius, plastic nets were arranged on three different layers of grouting. After grouting, the diffusion range of the paste on different plastic layers was measured. Considering the convenience of the measurement and later calculation, the diffusion surface of the different layers was circularly processed. Figure 8 shows the grout diffusion range monitoring diagrams for different levels of experiment 1, and Table 4 shows the range of the grout diffusion for different levels during different experiments.
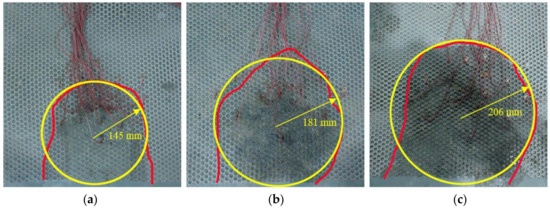
Figure 8.
Grout diffusion range diagram for different levels of experiment 1: (a) 50 mm; (b) 200 mm; and (c) 300 mm.
Table 4.
Range of grout diffusion for different levels during different experiments.
The grouting times for experiments 1–5 were 211 s, 178 s, 192 s, 153 s and 121 s, respectively. According to experimental data in Table 1 and the test data listed in Table 4, MATLAB is used to perform a regression analysis between the diffusion radius of the grout and various factors, such as the water-cement ratio, grouting pressure, grouting time, permeability coefficient, and level of grout. From the data analysis of this test, we can see that there is a power function relationship between the test results and the influencing factors. A linear regression is the basis for solving problems. It is necessary to transform the power function relationship into a linear relationship. Therefore, if we suppose its basic model is:
The above model is a nonlinear model, and the two sides of the above formula are logarithmically obtained:
Assuming , the above model can be transformed into a linear regression model:
In the formula, is a constant, and are the partial regression coefficients of the dependent variable on the independent variable (). The solution is similar to a unitary equation. According to the principle of the least squares method, the square sum of the residuals are determined, and then the solutions of and can be calculated. The resulting regression analysis formula are as follows:
In Formula (6), the regression fitting exponents for grout water-cement ratio (m), grouting pressure (p), grouting time (t), permeability coefficient (k) and level of grout (d) are 0.195, 0.24, 0.172, 0.017, and 0.22, respectively. The larger the coefficient was, the greater the influence of this factor on the diffusion radius of the grout was. Therefore, the factor with the most substantial effect on the diffusion radius of the grout was the grouting pressure in the fractured porous rock mass. That is, when the other factors were fixed, the larger the grouting pressure was, the larger the grout diffusion radius was. The next most important factors were the level of grout and the water-cement ratio, and the factor with the least impact on the diffusion radius of the grout was the permeability coefficient. Therefore, in the grouting of fractured porous rock mass, the grouting pressure has the greatest influence on the grouting diffusion radius, followed by the grouting horizon and water cement ratio, with the grouting permeability coefficient having the least influence on the grouting diffusion radius.
3.3. Grouting Effect Testing
After one day’s worth of grouting, a sampling of the grouting stone bodies was performed, as shown in Figure 9a. It can be determined that in the range of the grout diffusion, the grout diffused evenly, filled densely, and cemented well with the fractured porous rock mass, which can form a skeleton and improve the strength of the rock mass. Without the range of grout diffusion, the fractured porous rock mass was also soaked by water, indicating that the water evolution of the cement slurry is strong.
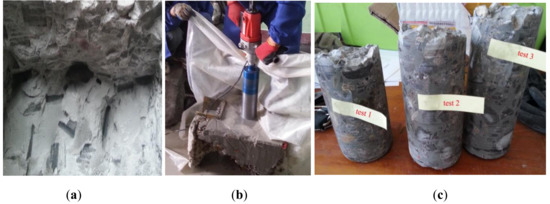
Figure 9.
Coring of the grouting stone bodies: (a) Grouting stone bodies; (b) Coring; and (c) Cores.
After 28 days’ placement in the laboratory, the grouting stone bodies were cored to test the uniaxial compressive strength, as shown in Figure 9b,c. Cores with a diameter of 50 mm and a height of 100 mm were used to obtain the main mechanical properties. The stress-strain curves of the cores of different experiments are presented in Figure 10. The uniaxial compressive strength of a different experiment is listed in Table 5. It can be seen that the stress-strain curves of the five experiments have the same trend, but the uniaxial compressive strength is significantly different.
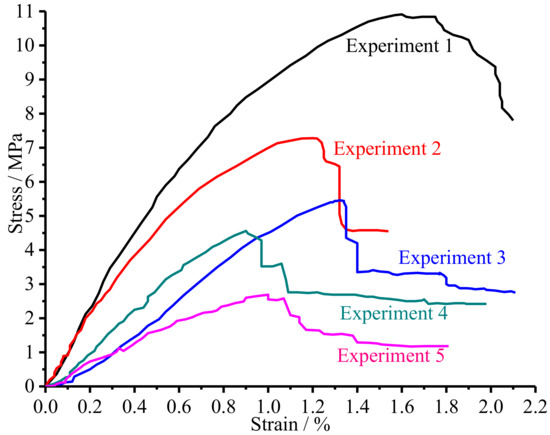
Figure 10.
The stress-strain curves of the core for different experiment.
Table 5.
Uniaxial compressive strength of cores of different testing programs.
According to experiment data in Table 1 and the uniaxial compressive strength of cores listed in Table 5, MATLAB was used to perform a regression analysis between the uniaxial compressive strength of specimens and various factors, such as the porosity, water-cement ratio, grouting pressure, grouting time, etc. The regression analysis formula is as follows:
In Formula (7), the regression fitting exponents for porosity (n), grout water-cement ratio (m), grouting pressure (p), and grouting time (t) are 0.851, −0.954, 0.196, and 0.705, respectively. The negative exponent indicates that the factor and the compressive strength have a negative correlation. Therefore, when grouting the porous fractured coal and rock mass, the grout water-cement ratio has the greatest influence on the strength of the grouted gravel, followed by the grouting permeability. The grouting pressure coefficient has the least influence on the grouting diffusion radius.
4. Field Application Effect and Analysis
In the field, grouting construction often relies only on experience. The result obtained through these experiments can be used to predict the grouting effect and guide the selection of grouting parameters. Therefore, it can overcome the blindness of grouting construction. An engineering practice was performed at the 3101 repeated mining working face of the Shenghua coal mine to verify the experimental results.
4.1. Engineering Geological Conditions
Figure 11 shows the layout of the 3101 repeated mining working face of the Shenghua coal mine. The 3101 repeated mining working face adopts an inclined longwall tilt mining layout, the length of the working face is 300.0 m, and the mining height is 2.5 m. However, there was a collapsed zone in front of the repeated mining working face, which has a tendency length of approximately 25.0 m and a height of approximately 7.0 m.
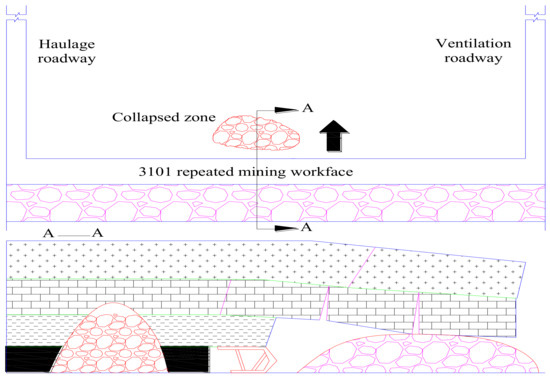
Figure 11.
3101 repeated mining working face.
According to the influence of the grouting consolidation in different layers on safe mining, the consolidation can be divided into a cutting layer and a bearing layer from the bottom to the top. The function of the cut bed is to ensure the stability of the broken surrounding rock after grouting and is easy to cut by a shearer, so the required strength is relatively low. The grouting height of the cutting layer is equal to the mining height, which is 2.5 m. The function of the bearing layer is to form an artificial false roof, which can provide the force surface of the hydraulic support and prevent the influence of gangue caving on the working face. The height of the bearing layer is 4.0 m.
4.2. Grouting Parameters Selection
To ensure that the grout can fully fill the porosity of the fractured surrounding rock and form a stable and continuous cutting layer and bearing layer, the grouting should be injected fully, and its grouting pressure should be significantly increased. The single-hole grouting amount can be estimated according to the following formula [22]:
In Formula (8): Q is the grouting amount of a single hole, m3; A is the consumption coefficient of the cement grout, taking a value of 1.1; L is the expected filling thickness in the drilling direction, m; R is the diffusion radius of the cement grout, m; n is porosity of collapsed zone; and λ is filling coefficient of the grout, taking a value of 1.2.
Because of the different roles of the upper and lower layers, the grouting parameters are also different. According to the existing data on the mine, the strength of the grouted body of the bearing layer needs to be above 8 MPa, and the strength of the grouted body of the cutting layer needs to above 3 MPa. According to the parameters (R, P, Q, n) that were already known and substituting them into Formulas (3) and (4), the grouting parameters in the collapsed zone were obtained, as shown in Table 6.
Table 6.
Single hole grouting parameters of the caving zone.
4.3. Arrangement of Layered Progressive Grouting
To fill the collapsed zone effectively and achieve different effects for different layers, this paper proposed a layered progressive grouting method. The grouting sequence was “from the outside to the inside, from the bottom to the top.” After grouting the cutting layer, the same grouting method was used to grout the bearing layer.
The length of the collapsed zone of the 3101 repeated mining face is 25.0 m. According to the grouting diffusion radius mentioned above, the spacing of the grouting holes in the cutting layer was determined to be 5.0 m, the hole depth is 2.5 m, and the distance between the grouting hole and the floor is 1.5 m. The angle between the horizontal plane and grouting hole is 22°, and the height of the final hole is 2.5 m. Three progressive grouting procedures were required to ensure the formation of a continuous and stable cutting layer 2.5 m in height in the repeated mining area. After the cutting layer was constructed, grouting was performed above the cutting layer to form a bearing layer. The spacing of the grouting holes in the cutting layer was determined to be 8.0 m, the hole depth was 4 m, and the distance between the grouting hole and the floor was 4.5 m. The angle between the horizontal plane and grouting hole was 26°, and the height of the final hole was 6.5 m. Two progressive grouting procedures were required to ensure the formation of a continuous and stable bearing layer 4.0 m in height in the repeated mining area. The reinforcement of the collapsed zone can be fully completed by repeating the grouting procedure five times. Figure 12 shows the diagram of the layered progressive grouting method.
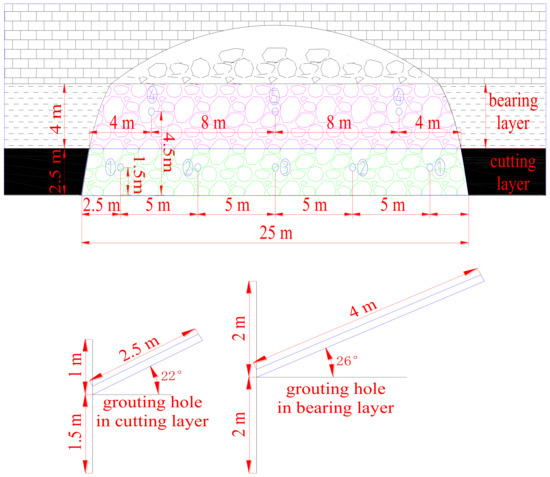
Figure 12.
Layered progressive grouting diagram.
The grouting in the collapsed zone used a model ZBSB-148~23 mining grouting pump; the grout mixing equipment adopted a low-speed mechanical mixer; the drilling equipment selected to form the hole was a YT-28 pneumatic drill, with a drilling diameter of Ф42 mm; and the grouting pipe was composed of a KJR32 high pressure hose and seamless steel tube. Figure 13 shows the partial equipment used for grouting.
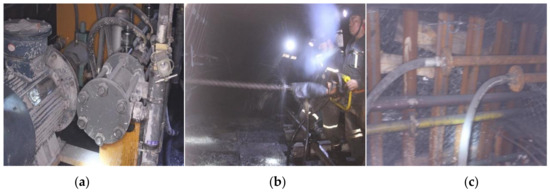
Figure 13.
Field grouting equipment: (a) Grouting pump; (b) Wind coal drill; and (c) Grouting pipe.
4.4. Application Effect Testing and Analysis
To ascertain the grout diffusion range and the consolidation effect of the loose fractured rock mass, a borehole observation and core mechanical property test were performed after grouting in the collapsed zone.
The caving area in front of the working face is essentially formed by the caving coal and rock blocks in the early stage of small coal mine mining. After different sizes of coal and rock blocks were stabilized, a large number of voids of different sizes were produced. It can be seen from the borehole images (Figure 14) that the grout is vein-like and discontinuously distributed after filling the voids between the blocks. This shows that the selected cement grout has good fluidity and that the grout diffused into the voids and formed a network skeleton after condensation. The whole structure of loose fractured rock mass was changed by grouting.
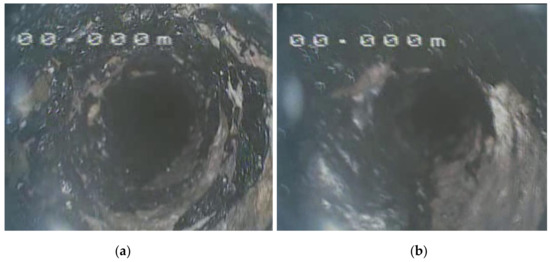
Figure 14.
Borehole images: (a) Bearing layer; (b) Cutting layer.
To study whether the diffusion radius of grout reaches the required range, a horizontal drilling observation was performed at different layers of the bearing layer and cutting layer to observe the diffusion distances of the grout at different positions, as shown in Figure 15a. It can be seen that the minimum radius of the grout diffusion in the cutting layer is 2.8 m, which is beyond the designed radius of 2.5 m, and the minimum radius of the grout diffusion in the bearing layer is 4.4 m, which is beyond the designed radius of 4.0 m. Therefore, the range of grout diffusion reached the design requirements. Moreover, uniaxial compression experiments on the core specimens taken from drilling were conducted, and the stress-strain curve were obtained, as shown in Figure 15b. It can be seen that the uniaxial compressive strength of the core specimens of the bearing layer and the cutting layer were 8.65 MPa and 3.35 MPa, respectively. The actual strengths are higher than the design strengths, and the strength of the fractured porous rock mass significantly increased.
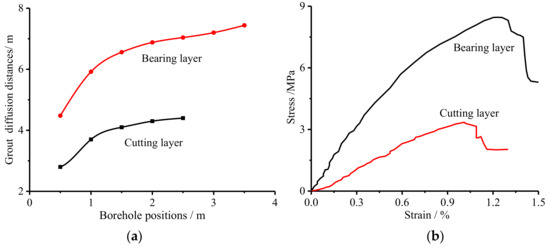
Figure 15.
(a) Diffusion distances of the grout at different positions; (b) Stress-strain curves of the core specimens.
During mining of the grouting area, there was no occurrence of coal wall spalling or tip-to-face roof falling. The working face traversed the old mining caving zone safely and smoothly. The rock mass exposed during the mining is shown in Figure 16. It can be seen that the coal wall and the tip-to-face roof in front of the working face have good integrity. The coal wall is neat after cutting. Thus, a good grouting effect has been achieved.
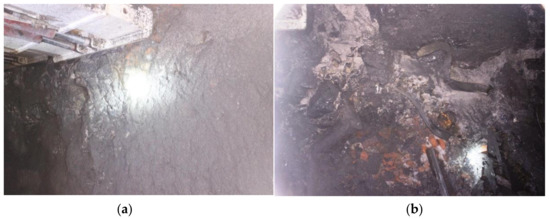
Figure 16.
The rock mass exposed in the grouting area: (a) Coal wall; (b) Tip-to-face roof.
5. Discussion
- (1)
- When grouting in a fractusred porous rock mass, the main diffusion method of grouting is infiltration. The resistance of grout diffusion is mainly caused by friction in the grout and friction between the grout and rock mass medium. The diffusion resistance is small and can be maintained at a low level for an extended period of time. The grouting volume is mainly controlled by the volume and porosity of the fractured rock mass. In engineering practice, the distribution range of the fractured porous rock mass can first be measured, and then the grouting quantity and other related parameters can be calculated. In general, the grouting zone is not a standard sphere, and the equivalent grouting diffusion radius can be used to represent the grouting range.
- (2)
- Grouting in a fractured porous rock mass can improve the strength of the rock mass because grouting can change the properties of the rock mass. On one hand, the grout can improve the surface mechanical properties of the rock mass, reduce the sliding ability of the fractured rock mass, and enhance the tensile and shear strength parameters. On the other hand, the grout can enter the pores of the rock mass and fill the gaps and cracks in the rock mass. Because of the cohesion of the grout, the cohesion and internal friction angle of the rock mass are improved, and the fractured porous rock mass becomes a strong bearing capacity consolidation body, which is difficult to destroy.
6. Conclusions
- (1)
- To study the law of grouting diffusion in a fractured rock mass, this paper developed a visualization platform of the grouting diffusion range and a three-dimensional grouting experimental system. It can monitor the grout diffusion range, diffusion time, grout pressure, etc.
- (2)
- The grouting pressure has four kinds of variation forms in the grouting experiment: linear growth; cyclic growth; fluctuation stability and slow growth.
- (3)
- The flow pattern of the grout in the fractured porous rock mass has a parabolic shape from the grouting hole to the bottom. The lower the level is, the larger the diffusion range of the grout is. In the horizontal direction, the grout diffusion surface around the grouting hole had an asymmetrical circular surface. When the height of the grouting pipe, initial velocity of the grout, outlet angle and pore connectivity are determined, the shape of diffusion surface is certain.
- (4)
- The grouting pressure has the greatest influence on the grouting diffusion radius, followed by the grouting horizon and water-cement ratio. The grouting permeability coefficient has the least influence on the grouting diffusion radius.
- (5)
- The uniaxial compressive strength is significantly different in different experiments. The grout water-cement ratio has the greatest influence on the strength of the grouted gravel, followed by the grouting permeability. The grouting pressure coefficient has the least amount of influence on the grouting diffusion radius.
- (6)
- The results of the study were applied to old mining caving zone grouting reinforcement engineering. According to the results, the grouting parameters were designed and a layered progressive grouting method was proposed. Borehole observation and a core mechanical property test were performed to analyze the application effect. The working face traversed the old mining caving zone safely and smoothly. A good grouting effect was achieved.
Author Contributions
All the authors contributed to publishing this paper. H.L., X.C. and T.W. contributed to the formulation of overarching research goals and aims; D.J. contributed to the experiment; M.Z. and R.H. provided language and picture support.
Funding
This research was funded by the National Natural Science Foundation of China, grant number 51379116 and the Natural Science Foundation of Shandong Province, grant number ZR2016EEM36).
Acknowledgments
The authors would like to express sincere appreciation to the editor and the anonymous reviewers for their valuable comments and suggestions for improving the presentation of the manuscript.
Conflicts of Interest
The authors declare no conflict of interest.
References
- Wang, K.; Gong, P.; Zhang, X.; Lian, Q.; Li, J.; Duan, D. Characteristics and control of roof fracture in caving zone for residual coal mining face. Chin. J. Rock Mech. Eng. 2016, 35, 1–9. [Google Scholar]
- Liu, C.; Gong, P.L.; Wang, K.; Zhang, X.Q.; Liu, Y.D. Roof stability for repeated mining workface passing through abandoned parallel gateway. J. China Coal Soc. 2015, 40, 314–322. [Google Scholar]
- Ghosh, G.K.; Sivakumar, C. Application of underground microseismic monitoring for ground failure and secure longwall coal mining operation: A case study in an Indian mine. J. Appl. Geophys. 2018, 150, 21–39. [Google Scholar] [CrossRef]
- Riedel, I.; Guéguen, P. Modeling of damage-related earthquake losses in a moderate seismic-prone country and cost-benefit evaluation of retrofit investments: Application to France. Nat. Hazards 2018, 90, 639–662. [Google Scholar] [CrossRef]
- Xia, X.; Huang, Q. Study on the dynamic height of caved zone based on porosity. J. Min. Saf. Eng. 2014, 31, 102–107. [Google Scholar]
- Feng, G.; Jia, K.; Shang, B. Application and prospect of super-high-water packing material in mining engineering. Coal Sci. Technol. 2015, 43, 5–9. [Google Scholar]
- Marwan, A.; Zhou, M.M.; Abdelrehim, M.Z.; Meschke, G. Optimization of artificial ground freezing in tunneling in the presence of seepage flow. Comput. Geotech. 2016, 75, 112–125. [Google Scholar] [CrossRef]
- Li, S.J.; Wang, L.G.; Lu, Y.L.; Zhang, B. Slurry diffusion within cracked wall rock during the bolt-grouting process. J. China Univ. Min. Technol. 2011, 40, 874–880. [Google Scholar]
- Di Nucci, C. Unsteady free surface flow in porous media: One-dimensional model equations including vertical effects and seepage face. C. R. Mec. 2018, 346, 366–383. [Google Scholar] [CrossRef]
- Kelessidis, V.C.; Maglione, R.; Tsamantaki, C. Optimal determination of rheological parameters for Herschel-Bulkley drilling fluids and impact on pressure drop, velocity profiles and penetration rates during drilling. J. Pet. Sci. Eng. 2006, 5, 203–224. [Google Scholar] [CrossRef]
- Shucai, L.; Zhuo, Z.; Rentai, L. Analysis of diffusion of grout in porous media considering infiltration effects. Chin. J. Rock Mech. Eng. 2015, 34, 2401–2409. [Google Scholar]
- Huang, Y.; Wang, L.; Lu, Y. Study on the law of slurry diffusion within roadway surrounding rock during the whole section bolt-grouting process. J. Min. Saf. Eng. 2015, 32, 240–246. [Google Scholar]
- Saada, Z.; Canou, J.; Dormieux, L.; Dupla, J.C.; Maghous, S. Modeling of cement suspension flow in granular porous media. Int. J. Numer. Anal. Methods Geomech. 2005, 29, 691–711. [Google Scholar] [CrossRef]
- Rafi, J.Y.; Stille, H. Basic mechanism of elastic jacking and impact of fracture aperture change on grout spread, transmissivity and penetrability. Tunn. Undergr. Space Technol. 2015, 49, 174–187. [Google Scholar] [CrossRef]
- Shimada, H.; Hamanaka, A.; Sasaoka, T.; Matsui, K. Behavior of grouting material used for floor reinforcement in underground mines. Int. J. Mech. Sci. 2014, 28, 133–148. [Google Scholar]
- Funehag, J.; Gustafson, G. Design of grouting with silica sol in hard rock: New methods for calculation of penetration length Part I. Tunn. Undergr. Space Technol. 2008, 23, 1–8. [Google Scholar] [CrossRef]
- Funehag, J.; Gustafson, G. Design of grouting with silica sol in hard rock: New methods for calculation of penetration length Part II. Tunn. Undergr. Space Technol. 2008, 23, 9–17. [Google Scholar] [CrossRef]
- Minto, J.M.; MacLachlan, E.; El Mountassir, G.; Lunn, R.J. Rock fracture grouting with microbially induced carbonate precipitation. Water Resour. Res. 2016, 52, 8810–8827. [Google Scholar] [CrossRef]
- Minto, J.M.; MacLachlan, E.; El Mountassir, G.; Lunn, R.J. Study on grouting simulation experiment and its application. Chin. J. Geotech. Eng. 1997, 19, 28–33. [Google Scholar]
- Fang, K.T.; Ma, C.X. Orthogonal and Uniform Experimental Design; Science Press: Beijing, China, 2001. [Google Scholar]
- Liang, D.; Jiang, Z.; Cao, D. Calculation of hydraulic conductivity in high water-pressure test. J. Min. Saf. Eng. 2016, 33, 324–328. [Google Scholar]
- Yang, Z.Q.; Niu, X.D.; Hou, K.P.; Zhou, Z.H.; Liang, W. Study of grouting diffusion parameters in gravel soil. Rock Soil Mech. 2015, 36, 397–402. [Google Scholar]
© 2018 by the authors. Licensee MDPI, Basel, Switzerland. This article is an open access article distributed under the terms and conditions of the Creative Commons Attribution (CC BY) license (http://creativecommons.org/licenses/by/4.0/).