Abstract
Carbon dioxide (CO2) exhibits strong compressibility and expansion behavior, which enables efficient pressure transmission in tight reservoirs. This property promotes reservoir pressure, improves fracturing fluid flowback, slows production decline, and finally enhances oil recovery. CO2 pre-pad energized fracturing has been widely adopted in shale oil development. However, its theoretical basis and controlling mechanisms are still not well understood. In this study, the energization mechanism of CO2 pre-pad energized fracturing in shale oil reservoirs was investigated. The energization performance was quantitatively evaluated by the pressure coefficient and the energy replenishment range under different geological conditions and operational parameters. The results indicate that pre-injected CO2 increases pressure and reduces effective stress. Part of the CO2 can be permanently stored in the reservoir. The CO2 injection volume is identified as the dominant controlling factor. Increasing the CO2 injection volume expands the energy replenishment range to a maximum of 12,470 m2. Lower injection rates favor CO2 penetration and diffusion, leading to a wider energy replenishment range. An energy replenishment range exceeding 7000 m2 can be achieved when the CO2 injection rate is less than 4 m3/min. Lower reservoir permeability restricts the energization region, whereas longer soaking time allows pressure to diffuse more fully and enhances CO2–oil interaction. The results provide a basis for further optimization and future studies for the CO2 pre-pad energized fracturing in shale oil reservoirs.
1. Introduction
Shale oil has become one of the most important unconventional hydrocarbon resources supporting global energy supply, particularly in North America and China [1]. With the progressive depletion of conventional oil reservoirs, shale oil plays a critical role in sustaining long-term oil production due to its abundant reserves and wide distribution [2]. However, shale oil reservoirs are typically characterized by ultra-low permeability, strong heterogeneity, complex pore-fracture systems, and pronounced stress sensitivity [3]. In current shale oil development, production in the early stage relies primarily on natural reservoir energy under depletion drive. However, once production begins, formation pressure declines rapidly, leading to a rapid loss of reservoir energy and difficulty in sustaining stable long-term production [4,5,6]. This challenge is particularly pronounced in low-pressure shale oil reservoirs, such as the Chang 7 formation of the Ordos Basin, where the formation pressure coefficient typically ranges from 0.77 to 0.82 [7]. Water injection is commonly applied to supplement reservoir energy; however, its effectiveness is limited due to the extremely tight nature of shale reservoirs and their low matrix permeability. In addition, many continental shale oil reservoirs contain relatively high clay contents, and water injection may induce clay hydration and swelling, further impairing reservoir performance [8]. Therefore, there is an urgent need to identify an efficient alternative energy replenishment medium.
Under reservoir conditions, CO2 predominantly exists in a supercritical state, characterized by ultralow viscosity and strong diffusivity, which enables it to penetrate deep into the formation more readily than water. Moreover, CO2 exhibits much higher compressibility than water. CO2 fracturing could reduce breakdown pressure and induce complex fractures [9,10]. During injection, the gradual increase in formation pressure leads to compression of CO2 and storage of elastic energy. During production, as formation pressure declines, CO2 expands and releases this stored energy. Consequently, CO2 serves as an effective medium for reservoir energy replenishment. From an environmental perspective, the utilization of CO2 also provides a promising pathway for carbon capture, utilization, and storage (CCUS), thereby coupling enhanced oil recovery with carbon sequestration [11].
Based on these advantages, various CO2-based stimulation technologies have been proposed and applied, such as CO2 dry fracturing, supercritical CO2 fracturing, CO2 foam fracturing and CO2 quasi-dry fracturing [12,13,14]. Among them, CO2 pre-pad energized fracturing combines the advantages of CO2 fracturing and water-based fracturing. Existing studies have demonstrated that CO2 pre-pad energized fracturing can effectively lower fracture initiation pressure, modify the near-wellbore stress field, and promote the development of complex fracture networks [15,16]. CO2 pre-injection can also promote inter-phase mass transfer, enhance crude oil fluidity, and increase the flowback rate [17,18]. Field tests in several shale plays have also confirmed that the oil production is significantly improved after CO2 pre-pad energized fracturing [19,20]. However, the influence of key operational parameters on its energization performance has not been systematically quantified.
The lack of a comprehensive mechanistic framework limits the accurate evaluation and optimization of CO2 pre-pad energized fracturing in shale oil reservoirs. Therefore, a comprehensive investigation is conducted to elucidate the mechanisms of CO2 pre-pad energized fracturing in shale oil reservoirs. Numerical simulations are performed to systematically assess how both geological conditions (reservoir permeability) and operational parameters (CO2 injection volume, CO2 injection rate and soaking time) influence the energization effect. Particular attention is paid to the impacts of reservoir permeability, CO2 injection volume, injection rate, and soaking time. The results provide critical insights for optimizing stimulation design and improving shale oil recovery. Moreover, such studies contribute to the broader goal of integrating efficient shale oil development with CO2 utilization and storage, thereby supporting both energy security and carbon emission reduction.
2. Methodology
2.1. Model Assumption
Based on the characteristics of shale oil reservoirs, a multiphase flow model for pre-injection of CO2 in shale oil formations is assumed to satisfy the following conditions. (1) The reservoir is considered homogeneous with uniform thickness, and vertical fluid flow is neglected. (2) Hydraulic fractures are simplified as planar fractures, within which the fluid flow is treated as one-dimensional linear flow. (3) The effects of gravity and other secondary forces are ignored. (4) The outer boundary of the reservoir is treated as a no-flow boundary.
2.2. Governing Equations
In simulations of CO2 pre-pad energized fracturing, multiple components and phases, including oil, gas, and water, are involved. The mass conservation equations for the oil, gas, and water phases can be expressed as follows [21]:
where Ni (i = 1, …, nc) denotes the moles of component i per unit grid-block volume, and represents the moles of water per unit grid-block volume. Mass transfer between the hydrocarbon phases and the aqueous phase is assumed to be negligible. Superscripts n and n + 1 indicate the previous and current time steps, respectively. Superscript m takes the value n for explicitly treated grid blocks and n + 1 for fully implicit grid blocks.
The relationship between Ni and porosity, phase molar density, saturation, and component composition can be written as follows:
where , , and denote the molar densities of the oil, gas, and water, respectively, kg/mol. and represent the mole fractions of component i in the oil and gas, respectively.
If the hydrocarbon lies within the two-phase region under a given pressure, temperature, and molar amounts Ni (i = 1, …, nc), the phase compositions and phase split can be determined by solving the thermodynamic equilibrium equations as follows:
where Nig denotes the number of moles of component i in the gas. The moles of component i in the oil phase can be calculated using the following expression:
The relationship between saturation, the moles and molar density can be expressed as follows [22]:
The Langmuir model is commonly adopted to characterize CO2 adsorption behavior. Assuming that the reservoir remains isothermal, gas adsorption is described by the extended Langmuir equation as follows [23]:
where denotes the moles of adsorbed component i per unit mass of rock, mol/kg; represents the maximum mole of component i that can be adsorbed per unit mass of rock, mol/kg; is the constant in the Langmuir adsorption isotherm, 1/kPa; denotes the mole fraction of the adsorbed component i in the gas; j represents the total number of components, and p is pressure, kPa.
CO2 diffusion is described using the Sigmund approach [24]:
where denotes the diffusion coefficient, m2/s; is the mass density of phase k, kg/m3; and represent the reference diffusion coefficient and the reference mass density, respectively; and is the reduced density of phase . Here, the reduced density is defined as a dimensionless parameter, expressed as the ratio of actual density to its critical density.
The dissolution of CO2 in water is calculated using Henry’s law [25]:
where denotes the mole fraction of component i in water; is the fugacity of component i in water, kPa; represents the reference pressure, kPa; is the Henry’s law constant of component i at the reference pressure; denotes the partial molar volume of component i at infinite dilution, m3/mol; R is the universal gas constant; and T is the temperature, °C.
For the residual saturation of CO2 in porous media, the Land model is employed for calculation [26]:
where, denotes the residual gas saturation, is the critical gas saturation, represents the maximum gas saturation, and C is the Land parameter, which can be determined from the critical saturation.
During shale oil development, stress sensitivity is a key factor controlling production performance and ultimate recovery. During fracturing, injecting fluids (CO2 or water) into the shale oil reservoir leads to a rapid increase in pressure and a corresponding reduction in effective stress. As a result, pore space expands and pre-existing microfractures reopen, thereby enhancing reservoir permeability. In contrast, during the production stage, reservoir pressure declines and effective stress increases. Under compaction, pore space is reduced and some fractures partially close, resulting in a decrease in permeability.
The effective stress is dynamically updated as pore pressure evolves during fluid injection, which further influences the permeability and porosity of the formation. The effective stress is calculated as
where, is the effective stress, kPa; is the Biot coefficient. In this study, the total stress field is assumed constant, and the effective stress variation is mainly driven by pore pressure changes induced by CO2 and water injection.
Palmer and Mansoori proposed a relationship describing the variation of fracture permeability as a function of confining pressure and pore pressure, expressed as follows [27]:
where is the initial effective stress, kPa; is the initial permeability, m2; and is the permeability modulus. In this study, is set to 0.3.
2.3. Model Description
To clarify the performance of CO2 pre-pad energized fracturing in shale oil reservoirs, a representative reservoir model was established based on a CO2 pre-pad energized fracturing test well in the Ordos Basin, as illustrated in Figure 1, where the red lines denote hydraulic fractures. The model dimensions are 400 m × 600 m × 40 m, with a cluster spacing of 8 m. The horizontal well is oriented along the X-direction, and the hydraulic fractures are perpendicular to the wellbore. Each fracture has a half-length of 120 m, and the fracture conductivity is set to 20 D·cm. The fractures are assumed to be instantaneously created, and fracture propagation is neglected. Fracture initiation and propagation are not explicitly modeled. Therefore, the calculated pressure evolution reflects the fluid pressure response within an existing fracture system.
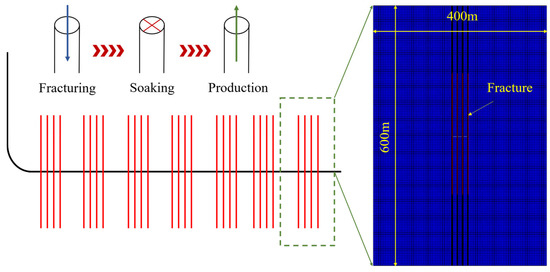
Figure 1.
Reservoir model.
Based on the reservoir petrophysical characteristics, the reservoir temperature is set to 60 °C, the burial depth to 2105 m, the porosity to 10%, and the matrix permeability to 0.01 mD. The ratio of horizontal to vertical permeability is assumed to be 10, and the initial formation pressure is 16 MPa. The detailed model parameters are summarized in Table 1.

Table 1.
Key parameter of the numerical model.
A shale oil compositional model is established using the Peng–Robinson equation of state. The original fluid components are lumped into eight pseudo-components, as listed in Table 2. The oil–water relative permeability curves employed in this study are shown in Figure 2.
Table 2.
Properties of crude oil components.
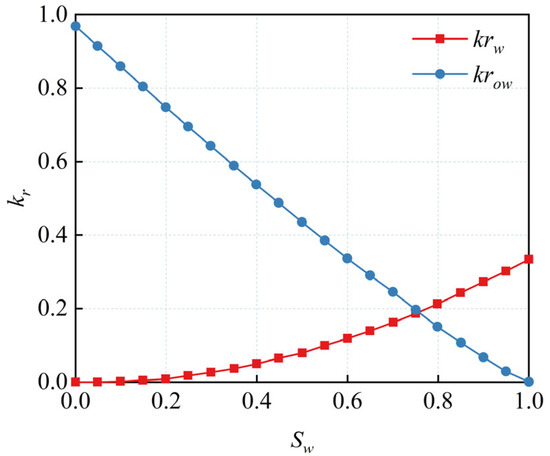
Figure 2.
Relative permeability curve.
Figure 3 shows the historical matching results for oil production. The numerical simulation results closely resemble the historical data, demonstrating the validity of the numerical model.
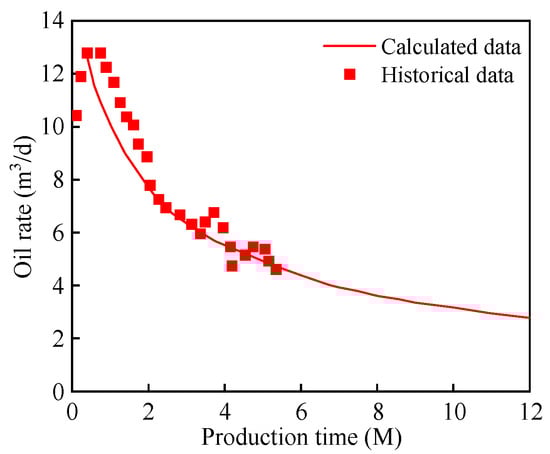
Figure 3.
Historical matching of oil production.
Based on this model, the effects of CO2 injection volume, CO2 injection rate, permeability and soak time on the performance of energy enhancement are discussed. The simulation scheme is shown in Table 3. The pumping sequence is to inject CO2 first, followed by water. It is worth noting that the total injection volume of fluid—the sum of CO2 and water—was fixed at 1200 m3, with a water injection rate of 10 m3/min. In this study, the energization performance was evaluated by the energy replenishment range and the pressure coefficient. The energy replenishment range is defined as the region where pressure changes occur, and the pressure coefficient is defined as the ratio of the average pressure within the energy replenishment range to the initial reservoir pressure.
Table 3.
Simulation scheme.
3. Results
3.1. Characteristics of CO2 Pre-Pad Energized Fracturing
The pressure distributions at different stages of CO2 pre-pad energized fracturing are illustrated in Figure 4. It should be noted that the fracture geometry in this model is assumed to be pre-existing and remains unchanged during the injection process; fracture propagation is not explicitly considered. Therefore, the predicted peak pressure reflects the pressure response of a fixed fracture system. Because the permeability of hydraulic fractures is several orders of magnitude higher than that of the shale matrix, reservoir pressure rapidly propagates along the fractures toward the fracture tips after CO2 injection, resulting in a rapid increase in pressure within the fractures. Meanwhile, a portion of the injected CO2 leaks off from the fracture surfaces into the surrounding matrix, causing a slight pressure increase in the near-fracture region. The maximum pressure occurs inside the fractures and reaches 22.87 MPa. With the subsequent injection of slickwater, the fracture pressure increases further and becomes significantly higher than the surrounding formation pressure, with a peak value of 40.15 MPa. This pronounced pressure rise is mainly attributed to the much lower compressibility of water compared with CO2, which leads to a more efficient pressure buildup. After fracturing is completed and the well is shut in for 1 day, pressure diffuses from the fractures into the reservoir, further expanding the energy replenishment range, while the maximum pressure decreases to 22.62 MPa.
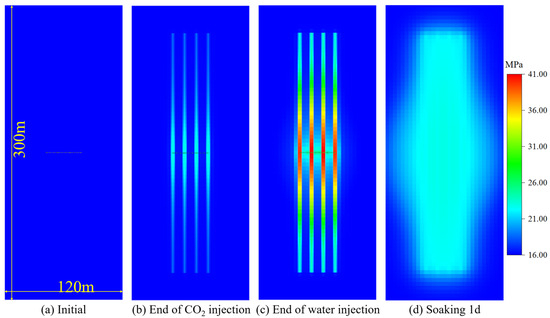
Figure 4.
Pressure distribution during CO2 pre-pad energized fracturing.
At the end of fracturing, the energization region generated by conventional hydraulic fracturing is mainly confined to the fractures and their immediate vicinity, whereas in CO2 pre-pad energized fracturing, the energization region extends beyond the fractures and exhibits a spindle-shaped distribution around the horizontal wellbore, as shown in Figure 5. The energization area at the end of CO2 pre-pad energized fracturing is approximately 1.6 times larger than that of conventional hydraulic fracturing. Under reservoir conditions, CO2 exists predominantly in a supercritical state, characterized by low viscosity and strong diffusivity, which enables it to penetrate tight, low-permeability shale more readily than water. In addition, CO2 is significantly more compressible than water. The compressibility of gaseous CO2 is approximately four orders of magnitude higher than that of water, and even in the supercritical state, the compressibility of CO2 remains about two orders of magnitude greater. Consequently, high-pressure CO2 stores substantial elastic energy at the end of fracturing, which is released through volumetric expansion as pressure declines during the shut-in period. After 1 day of shut-in, the energy replenishment range produced by CO2 pre-pad energized fracturing is approximately 1.3 times that of conventional hydraulic fracturing.
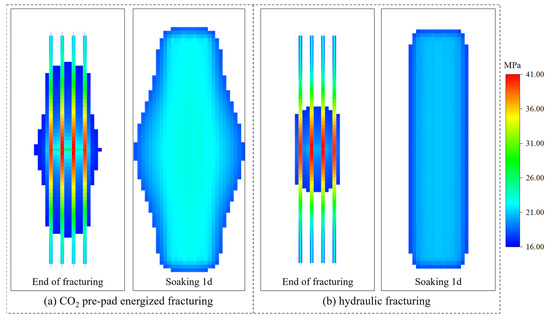
Figure 5.
Pressure distribution of different methods.
According to the effective stress principle, an increase in pore pressure leads to a reduction in effective stress, as shown in Figure 6. The initial effective stress of the reservoir is 23.3 MPa. During the CO2 injection stage, continuous CO2 injection gradually increases formation pressure, resulting in a reduction in effective stress within and around the fractures. The minimum effective stress inside the fractures decreases to 7.02 MPa. Subsequent slickwater injection further reduces effective stress; however, due to the compressive effect induced by fracture opening, the effective stress in the surrounding rock matrix increases to 26.95 MPa. During the shut-in period, pressure diffusion leads to a partial recovery of effective stress within the fractures, while the inter-fracture stress gradually decreases to 25.73 MPa by the end of shut-in.
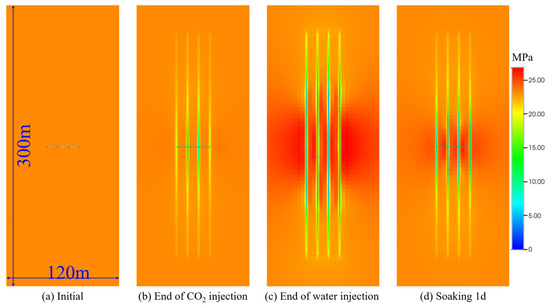
Figure 6.
Distribution of effective stress.
Figure 7 presents the effective stress distributions at different locations along the fracture length and along the horizontal wellbore at various time points during CO2 pre-pad energized fracturing. The red dashed line indicates the initial effective stress. Along the fracture direction, the effective stress exhibits a funnel-shaped distribution, with the minimum effective stress occurring near the perforation clusters. Effective stress gradually increases from the fracture heel toward the fracture tip and rises sharply beyond the fracture tip. During fluid injection, effective stress continuously decreases due to increasing pressure. During the shut-in period, pressure diffusion causes effective stress to increase within approximately 70 m from the perforation points, whereas effective stress further decreases in the range of 70–120 m. In contrast to the fracture-length direction, the effective stress along the horizontal direction displays a “W-shaped” distribution. Effective stress decreases within and around the fractures, and during the early injection stage, the reduction in effective stress is more pronounced for the middle fracture clusters than for the outer clusters. Meanwhile, due to mechanical compression, effective stress increases in the inter-cluster regions and on both sides of the perforated intervals.
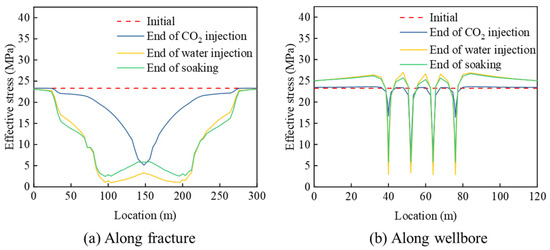
Figure 7.
Effective stress during CO2 pre-pad energized fracturing.
CO2 exhibits a strong viscosity-reduction effect on crude oil, thereby enhancing oil mobility and improving recovery. As shown in Figure 8, within the first 15 min, only a negligible amount of CO2 dissolves into the crude oil, and oil viscosity is primarily controlled by reservoir pressure, increasing with rising pressure. Between 14 and 42 min, the rate of pressure increase slows, a small amount of CO2 dissolves into the oil, and oil viscosity decreases gradually. After 42 min, the reservoir pressure continues to increase, and CO2 dissolution into the oil accelerates. At this stage, oil viscosity becomes nearly independent of pressure and decreases rapidly. By the end of CO2 injection, oil viscosity is reduced by approximately 80% compared with its initial value.
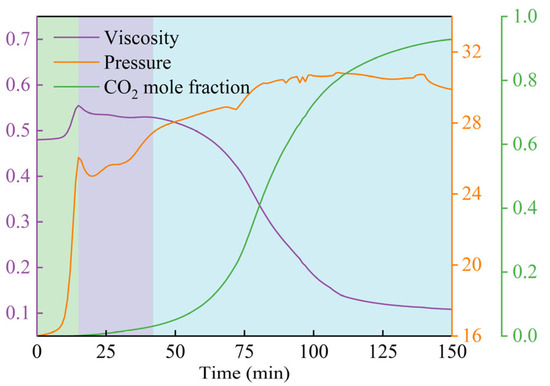
Figure 8.
Variation of oil viscosity, pressure and CO2 mole fraction during CO2 injection.
As shown in Figure 9a, during the early production stage, the daily oil production rate achieved by CO2 pre-pad energized fracturing is higher than that of conventional hydraulic fracturing, although the decline rate is relatively rapid, indicating a pronounced energy replenishment effect of CO2. After approximately 230 days of production, the daily oil production rates of the two fracturing methods converge. After one year of production, the cumulative oil production of CO2 pre-pad energized fracturing is 7.9% higher than that of conventional hydraulic fracturing. During the CO2 pre-pad energized fracturing stage, a total of 6.37 × 10⁶ mol of CO2 is injected. During production, the high CO2 saturation near the wellbore results in a relatively high CO2 production rate in the early stage, with a peak value of 7.09 × 10⁴ mol/d, followed by a rapid initial decline. After 100 days of production, the CO2 production rate decreases to 4767 mol/d, after which the decline rate slows. After one year of production, the CO2 production rate further decreases to 1883 mol/d. By the end of one year, a total of 1.9 × 10⁶ mol of CO2 is produced, corresponding to an effective CO2 storage efficiency of 70.2%. These results demonstrate that CO2 pre-pad energized fracturing provides not only enhanced oil recovery but also favorable potential for geological carbon sequestration.
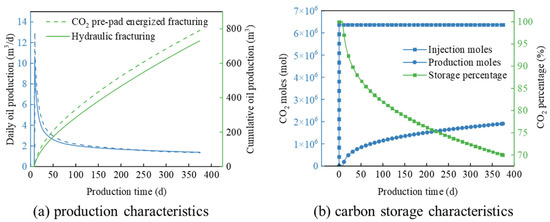
Figure 9.
Production and carbon storage characteristics of CO2 pre-pad energized fracturing.
Moreover, potential CO2 leakage risk is an important concern in energized fracturing operations. Leakage may occur through several pathways, including upward migration along induced hydraulic fractures, reactivation of pre-existing natural fractures or faults, and compromised wellbore integrity. Although theCO2 pre-pad energized fracturing is typically implemented over a short injection duration, excessive injection pressure or inappropriate fracture design may still increase the probability of unintended CO2 migration. Therefore, careful control of injection pressure, optimization of fracture geometry, and real-time monitoring (e.g., micro seismic and pressure surveillance) are recommended to minimize leakage risks. In addition, ensuring casing–cement integrity and avoiding fracture communication with overlying permeable formations are essential for safe field implementation.
3.2. Influence of CO2 Injection Volume
The distribution of pressure variation at the end of CO2 pre-pad energized fracturing is shown in Figure 10. The energy replenishment region is primarily concentrated within the fractures and the surrounding grid blocks, exhibiting a pronounced pressure gradient along the fracture length. Pressure increases toward the fracture center. Around the perforation clusters, the energy replenishment region displays a spindle-shaped pattern, which progressively expands with increasing CO2 injection volume. As the injected CO2 volume increases, the extent of the energy replenishment region gradually enlarges; however, when the CO2 injection volume exceeds 500 m3, the energy replenishment range shows little further growth. When 500 m3 of CO2 was injected, the energy replenishment range was 12,009 m2. When the CO2 injection volume was increased to 700 m3, the affected area only rose to 12,470 m2. In addition, inter-cluster pressure gradually increases with increasing CO2 injection. When the CO2 injection volume reaches 500 m3, pressure communication between clusters is observed, and the connected region continues to expand as the injection volume increases further. With continuous injection of CO2 and water, reservoir pore pressure increases, leading to a reduction in effective stress and an enhancement of reservoir permeability, which in turn promotes inter-cluster connectivity.
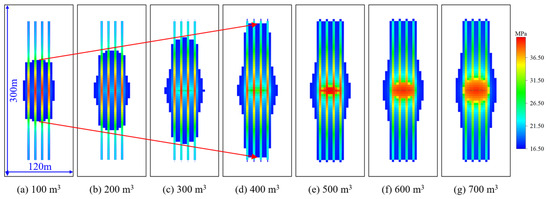
Figure 10.
Distribution of pressure with different CO2 injection volumes.
The energy replenishment range and pressure coefficient under different CO2 injection volumes are summarized in Figure 11. At a constant CO2 injection rate of 2 m3/min, both the energy replenishment range and the average pressure within the energy replenishment region increase with increasing CO2 injection volume. When the CO2 injection volume increases from 100 m3 to 400 m3, the energy replenishment range grows rapidly, increasing by approximately 66%. As the CO2 injection volume reaches 500 m3, the growth rate of the energy replenishment range decreases. When the injection volume exceeds 500 m3, further expansion becomes marginal; specifically, increasing the CO2 injection volume from 500 m3 to 700 m3 results in only a 3.8% increase in energy replenishment range.
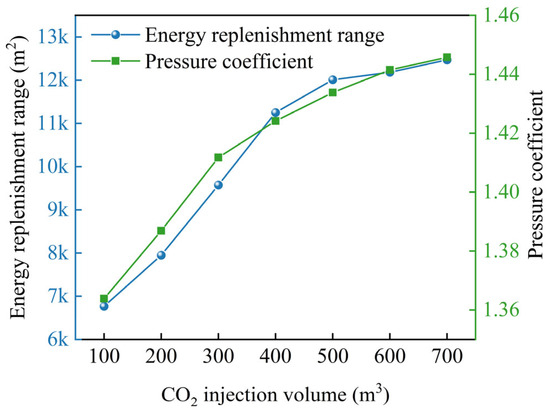
Figure 11.
Energization effect at different CO2 injection volumes.
Analysis of the pressure coefficient indicates that the energization effect is more pronounced at the early stage. As the CO2 injection volume increases from 100 m3 to 300 m3, the pressure coefficient rises from 1.364 to 1.412, corresponding to an increase of approximately 3.5%. When the CO2 injection volume exceeds 300 m3, the growth rate of the pressure coefficient slows. Increasing the injection volume from 300 m3 to 700 m3 leads to an increase in the pressure coefficient from 1.412 to 1.446, representing an increment of about 2.4%. This behavior is mainly attributed to the increase in CO2 saturation within the fractures, which makes further pressure buildup more difficult. Meanwhile, pressure in the reservoir surrounding the fractures gradually approaches a quasi-stable state, thereby weakening the driving force for further CO2 diffusion.
Overall, during CO2 pre-pad energized fracturing, when the single-stage CO2 injection volume is below 300 m3, increasing the injection volume effectively enhances both the energy replenishment area and the pressure coefficient. When the single-stage CO2 injection volume exceeds 300 m3, further increases in injection volume have a diminished effect on the pressure coefficient and primarily contribute to expanding the energy replenishment range. When the single-stage CO2 injection volume exceeds 500 m3, the impacts on both the energy replenishment range and the pressure coefficient become limited. Therefore, the determination of the optimal CO2 injection volume should consider not only the stimulation area and stimulation coefficient but also economic efficiency. In this study, a single-stage CO2 injection volume of 500 m3 is recommended.
3.3. Influence of CO2 Injection Rate
The CO2 injection rate directly controls the pressurization rate and, consequently, the distribution of pressure. As the CO2 injection rate increases, the extent of the energy replenishment range gradually decreases, while a pronounced pressure gradient develops along the fracture length (Figure 12). Higher injection rates result in steeper pressure gradients. At a CO2 injection rate of 1 m3/min, the energy replenishment range is distributed within and around the fractures, and the overall energization region is approximately rectangular, with a maximum pressure of 38.53 MPa. The energy replenishment range has now reached its maximum of 11,635 m2. When the injection rate ranges from 2 to 7 m3/min, the energy replenishment range far from the perforation clusters remains confined to the fractures and adjacent grid blocks and does not extend into the inter-cluster area. In contrast, near the perforation clusters, the energization region exhibits a spindle-shaped pattern. As the injection rate increases, the energy replenishment range between fracture clusters progressively diminishes. When the injection rate exceeds 4 m3/min, the energy replenishment range remains virtually unchanged.
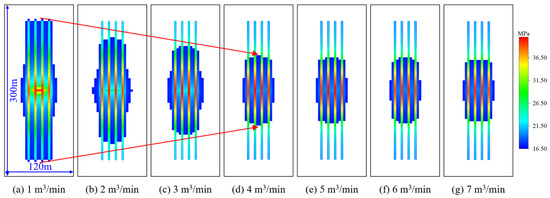
Figure 12.
Distribution of pressure with different CO2 injection rates.
Increasing the CO2 injection rate leads to a gradual reduction in the energy replenishment range. As the CO2 injection rate increases from 1 to 7 m3/min, the energy replenishment range decreases by 41%. The most pronounced reduction occurs when the injection rate increases from 1 to 4 m3/min, during which the energy replenishment range decreases by 38.4%. When the injection rate exceeds 4 m3/min, the energy replenishment range is approximately 7000 m2. At a flow rate of 1 m3/min, CO2 enters the fractures more slowly, resulting in a longer residence time within the fractures. This prolonged residence time promotes CO2 diffusion into the surrounding reservoir, allowing the pressure gradient to propagate laterally away from the fractures and thereby forming a larger energy replenishment range. In contrast, when the CO2 injection rate is greater than 4 m3/min, CO2 enters the fractures more rapidly, causing a sharp pressure increase within the fractures. Under these conditions, CO2 preferentially flows rapidly along the fracture length rather than diffusing into the reservoir matrix. Moreover, the shortened residence time of CO2 within the fractures limits its diffusion into the surrounding rock, leading to a reduced energy replenishment range.
When the CO2 injection rate increases from 1 to 2 m3/min, the pressure coefficient exhibits a particularly pronounced increase of 2.9% (Figure 13). As the injection rate exceeds 2 m3/min, the pressure coefficient continues to increase, but at a progressively slower rate. For the same injected CO2 volume, lower injection rates allow longer diffusion times within the reservoir and a broader pressure expansion range, resulting in a lower average pressure within the energy replenishment region. Conversely, at higher injection rates, the shorter diffusion time leads to rapid pressure accumulation and higher local pressures, yielding a smaller energy replenishment range but a higher average pressure.
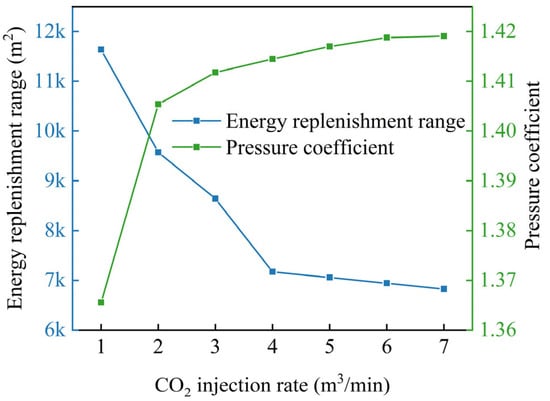
Figure 13.
Energization effect at different CO2 injection rates.
Overall, lower injection rates are more favorable for promoting CO2 penetration and diffusion in the reservoir, thereby generating a larger energy replenishment range. In contrast, higher injection rates tend to induce rapid pressure buildup within the fractures, resulting in a smaller energy replenishment range but higher localized pressure. Therefore, in CO2 pre-pad energized fracturing operations, a trade-off between energy replenishment range and pressure must be carefully considered to optimize the CO2 injection rate and achieve an optimal stimulation effect, rather than pursuing higher injection rates that primarily enhance pressure at the expense of effective areal coverage. In this study, a CO2 injection rate of 2–3 m3/min provides an optimal balance, achieving a relatively large energy replenishment range while maintaining a substantially elevated pressure coefficient.
3.4. Influence of Permeability
Matrix permeability, as a key petrophysical parameter, exerts a strong control on fluid flow behavior within shale reservoirs and therefore directly influences reservoir productivity and ultimate recovery. The pressure distributions for shale reservoirs with different matrix permeabilities are shown in Figure 14. When the matrix permeability is 0.001 mD, the energization region is confined to the fractures and their immediate vicinity, with very limited lateral extension away from the fracture surfaces. The energy replenishment range is only 3451 m2. As the matrix permeability increases to 0.005 mD, the energization region far from the perforation clusters remains distributed within and around the fractures, whereas near the perforation clusters it exhibits a spindle-shaped pattern. The size of this spindle-shaped region gradually increases with increasing permeability. When the matrix permeability further increases to 0.05 mD, the energization region extends to 31,790 m2.
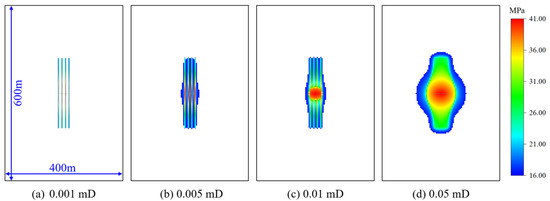
Figure 14.
Distribution of pressure with different permeabilities of matrix.
Reservoirs with higher permeability exhibit a larger energy replenishment range, whereas lower-permeability reservoirs display a higher pressure coefficient (Figure 15). In low-permeability reservoirs, fluid mobility is poor, and the injected CO2 cannot readily diffuse over a large volume. Consequently, pressure tends to concentrate near the injection region, leading to a rapid local pressure buildup and a relatively high pressure coefficient. The pressure coefficient of a reservoir with a permeability of 0.001 mD reaches 1.63. In contrast, in higher-permeability reservoirs, CO2 can diffuse more efficiently throughout the reservoir. Although the total injected volume is the same, the pressure propagates over a broader region, resulting in a more distributed pressure increase and a relatively lower average pressure within the energization region. The pressure coefficient of a reservoir with a permeability of 0.05 mD is 1.34. The energy replenishment range is 8.2 times greater than that of a reservoir with a permeability of 0.001 mD. For low-permeability reservoirs, although high local pressures may develop at an early stage, the limited ability of fluids to spread over a larger region may lead to local pressure saturation or even non-elastic responses, such as microfracture initiation induced by localized stress concentration. As a result, the effectiveness of further pressure buildup becomes constrained.
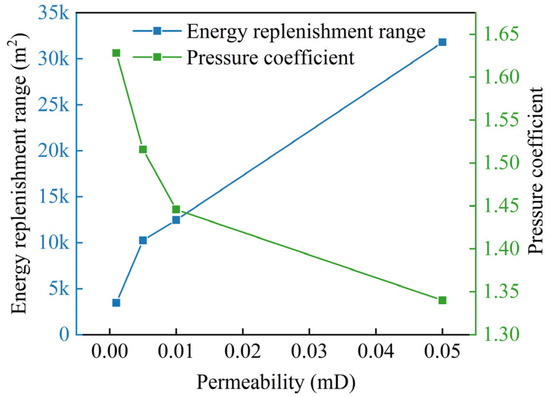
Figure 15.
Energization effect at different permeabilities.
Different injection strategies should be adopted for reservoirs with different matrix permeabilities. For low-permeability reservoirs, a lower injection rate is recommended to avoid rapid accumulation of localized overpressure. In addition, a staged injection strategy with alternating injection and shut-in periods can be employed to gradually expand the affected region, allowing localized high pressure to diffuse outward and thereby increasing the overall energization area. For higher-permeability reservoirs, moderately higher injection rates and cumulative injection volumes can be applied to offset rapid pressure dissipation and to ensure the development of a sufficient pressure gradient.
3.5. Influence of Soaking Time
At the end of CO2 pre-pad energized fracturing, the fracturing fluid is mainly retained within the fractures, whereas CO2 is concentrated near the perforation clusters of the horizontal wellbore. To expand the swept volume of the injected fluids, a shut-in (soaking) period is commonly implemented. During this period, the injected fracturing fluid migrates into the reservoir, where it interacts with crude oil. Meanwhile, CO2 diffuses over a wider range via molecular diffusion and interacts with a larger volume of crude oil, thereby contributing to enhanced production.
Figure 16 illustrates the pressure distributions under different soaking times. Increasing the soaking time leads to a gradual reduction in pressure differentials within the reservoir until pressure equilibrium is approached. The initial formation pressure is 16 MPa. When no shut-in is applied (0 d), pressure is highly concentrated within the hydraulic fractures, with the maximum pressure occurring near the perforations and reaching 40.15 MPa. Most of the reservoir remains unaffected and retains the initial pressure, resulting in a reservoir pressure differential of 24.15 MPa. After a 1-day shut-in, pressure rapidly diffuses into the formation, and the energization region expands. At this stage, the maximum reservoir pressure decreases to 22.62 MPa, and the pressure differential is reduced to 6.62 MPa. After 7 days of shut-in, pressure diffusion continues, with the maximum pressure decreasing to 19.36 MPa and the pressure differential further reduced to 3.36 MPa. When the shut-in time is extended to 15 days, the maximum reservoir pressure declines to 18.42 MPa, and the pressure differential decreases to 2.42 MPa. After a 30-day shut-in, the maximum pressure within the reservoir is 17.71 MPa, and the pressure differential is reduced to 1.71 MPa.
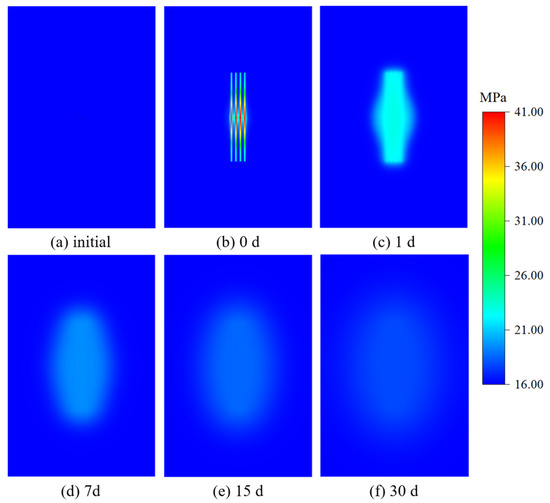
Figure 16.
Pressure distribution at different soaking times.
Figure 17 presents the evolution of the energy replenishment range and average reservoir pressure as a function of soaking time. The results reveal a clear decoupling between spatial energy propagation and pressure retention during the shut-in period. The energy replenishment range at the end of fracturing was 9573 m2. With increasing soaking time, the energy replenishment range expands continuously and nonlinearly, indicating sustained CO2 diffusion and pressure-driven fluid redistribution into the matrix and secondary fracture network. The energy replenishment range increased by 8.35 times after a 30-day well shut-in. This progressive enlargement reflects the high mobility and strong penetration capability of CO2, which enables effective energy transfer from the primary fractures to previously unstimulated regions over time. In contrast, the average reservoir pressure declines rapidly during the early soaking stage and then gradually stabilizes, suggesting that pressure dissipation dominates initially due to leak-off, matrix imbibition, and pressure equilibration, while subsequent pressure loss becomes increasingly limited as the system approaches a quasi-steady state. The combined trends imply that extended soaking enhances the areal effectiveness of energy replenishment but offers diminishing returns in terms of pressure maintenance. From an operational standpoint, an intermediate soaking time (on the order of 10–15 days in this study) provides a favorable compromise, achieving a substantial expansion of the energy replenishment range while avoiding excessive pressure depletion and prolonged non-productive time.
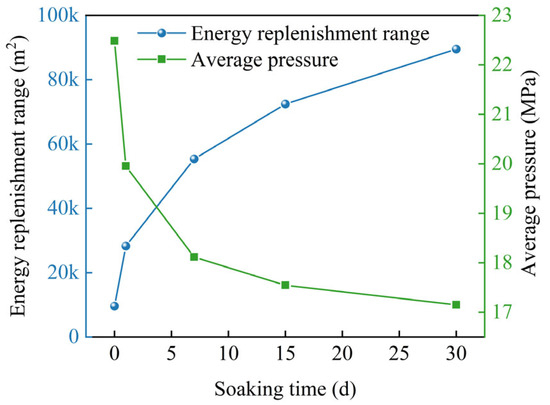
Figure 17.
Energization effect under different soaking times.
The pressure evolution along the monitoring line for different shut-in durations is shown in Figure 18. At the end of CO2 pre-pad energized fracturing, pressure is primarily concentrated within the fractures, with the highest pressure inside the fractures and lower pressure between fractures. The resulting pressure profile exhibits an “M-shaped” distribution. After shut-in, pressure rapidly diffuses toward both sides of the fractures. Along the horizontal wellbore direction, pressure initially increases and then decreases, forming a symmetric distribution with the maximum pressure located at the center. As the soaking time increases, the central pressure gradually decreases, while the pressure-affected distance expands progressively. When the soaking time increases from 1 d to 30 d, the central pressure decreases from 22.62 MPa to 17.71 MPa, whereas the pressure-affected distance increases from 140 m to 298 m, corresponding to an expansion of approximately 1.13 times.
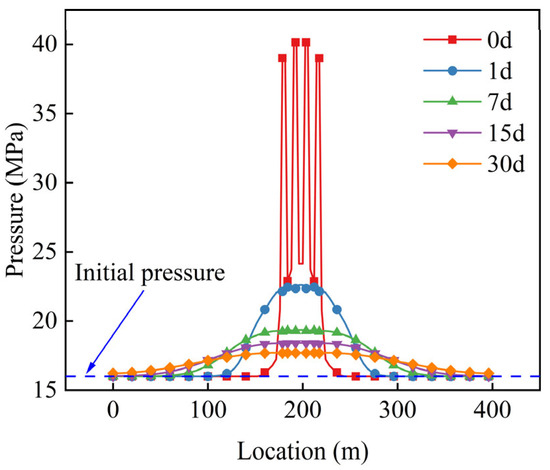
Figure 18.
Pressure distribution along the monitoring line at different soaking times.
Overall, as the soaking time is prolonged, pressure continues to diffuse, and the pressure-affected region expands. However, the average pressure within the energy replenishment range region gradually decreases. In addition, pressure declines rapidly during the early shut-in stage, whereas the rate of pressure decline progressively slows with increasing shut-in duration. Therefore, excessively short soaking periods may fail to fully exploit the diffusion-driven benefits of CO2, whereas overly long soaking times primarily increase energy coverage at the cost of reduced pressure efficiency and economic performance. In this study, it is recommended to shut in the well for 10–15 days to improve the performance of CO2 pre-pad energized fracturing.
4. Conclusions
A numerical model was developed and applied to evaluate the effects of CO2 injection volume, CO2 injection rate, reservoir permeability, and soaking time on the performance of CO2 pre-pad energized fracturing. The main conclusions are summarized as follows:
- (1)
- CO2 pre-pad energized fracturing effectively increases reservoir pressure, reduces effective stress, and decreases crude oil viscosity. Compared with conventional hydraulic fracturing, oil production is increased by 7.9%, while 70.2% of the injected CO2 is stored in the reservoir, indicating a favorable carbon sequestration potential.
- (2)
- CO2 injection volume is a key controlling parameter for the stimulation performance. Increasing the CO2 volume enhances both the energization area and the energization coefficient. In this study, when the CO2 volume exceeds 500 m3, further increases in injection volume result in diminishing improvements in both metrics.
- (3)
- Lower injection rates are more conducive to CO2 penetration and diffusion within the reservoir, leading to a larger energy replenishment range. In contrast, higher injection rates tend to promote rapid pressure accumulation within fractures, resulting in a smaller energy replenishment range but higher pressure. A CO2 injection rate of 2–3 m3/min is recommended in this study.
- (4)
- Lower-permeability reservoirs exhibit rapid local pressure buildup and a higher pressure coefficient, whereas higher-permeability reservoirs facilitate rapid CO2 diffusion and a larger energy replenishment range. Accordingly, different injection strategies should be tailored to reservoirs with different permeabilities.
- (5)
- Extending the soaking time promotes further pressure diffusion and enhances the interaction between CO2 and crude oil, thereby improving the overall effectiveness of CO2 pre-pad energized fracturing. However, prolonged soaking would lead to pressure loss and increased time costs. It is suggested to shut the well for 10 to 15 days after fracturing.
Author Contributions
Conceptualization, G.T. and H.W.; Data Curation, Q.X.; Formal Analysis, L.H.; Funding Acquisition, H.W., B.W. and Y.Z.; Investigation, T.Z. and Q.X.; Methodology, G.T. and Y.F.; Project Administration, H.W.; Resources, H.W. and B.W.; Software, G.T.; Supervision, H.W.; Validation, Y.F. and B.W.; Visualization, Y.Z. and T.Z.; Writing—Original Draft, G.T.; Writing—Review and Editing, Y.F. and B.W. All authors have read and agreed to the published version of the manuscript.
Funding
This research was supported by the Science and Technology Development Project of the Silk Road Economic Belt Innovation Zone, China (Grant No. 2023LQ03005); the Science Foundation of China University of Petroleum, Beijing (Grant No. 2462024YJRC019); and the Open Foundation of Shaanxi Key Laboratory of Lacustrine Shale Gas Accumulation and Exploitation (Grant No. YJSYZX25SKF0003).
Data Availability Statement
The original contributions presented in this study are included in the article. Further inquiries can be directed to the corresponding author.
Conflicts of Interest
Author Liang Hua was employed by the Downhole Technology Service Company, CNPC Bohai Drilling Engineering Co., Ltd. The remaining authors declare that the research was conducted in the absence of any commercial or financial relationships that could be construed as a potential conflict of interest.
References
- Yang, L.; Jin, Z. Global shale oil development and prospects. China Pet. Explor. 2019, 24, 553. [Google Scholar] [CrossRef]
- Guo, W.; Deng, S.; Sun, Y. Recent advances on shale oil and gas exploration and development technologies. Adv. Geo-Energy Res. 2024, 11, 81–87. [Google Scholar] [CrossRef]
- Fu, J.; Li, S.; Niu, X.; Deng, X.; Zhou, X. Geological characteristics and exploration of shale oil in Chang 7 member of Triassic Yanchang Formation, Ordos Basin, NW China. Pet. Explor. Dev. 2020, 47, 931–945. [Google Scholar] [CrossRef]
- Kuang, L.; Wu, S.; Xu, H.; Wu, K.; Shen, Y.; Wang, Z. Key parameters and evaluation methods for large-scale production of lacustrine shale oil. Pet. Explor. Dev. 2025, 52, 883–893. [Google Scholar] [CrossRef]
- Zhou, X.; Li, H.; Zeng, F.; Yu, C.; Ouyang, H.; Jiang, Q. Lightening of Shale Oil Using High-Temperature Supercritical CO2: An Experimental Study. Adv. Geo-Energy Res. 2025, 16, 99–113. [Google Scholar] [CrossRef]
- Tang, H.; He, G.; Ni, Y.; Huo, D.; Zhao, Y.; Xue, L.; Zhang, L. Production decline curve analysis of shale oil wells: A case study of Bakken, Eagle Ford and Permian. Pet. Sci. 2024, 21, 4262–4277. [Google Scholar] [CrossRef]
- Fu, J.; Guo, W.; Li, S.; Liu, X.; Cheng, D.; Zhou, X. Characteristics and exploration potential of muti-type shale oil in the 7th Member of Yanchang Formation, Ordos Basin. Nat. Gas Geosci. 2021, 32, 1749–1761. [Google Scholar] [CrossRef]
- Li, Y.; Zhao, Q.; Lyu, Q.; Xue, Z.; Cao, X.; Liu, Z. Evaluation technology and practice of continental shale oil development in China. Pet. Explor. Dev. 2022, 49, 1098–1109. [Google Scholar] [CrossRef]
- Yang, B.; Ren, Q.; Huang, H.; Wang, H.; Zheng, Y.; Dou, L.; He, Y.; Zhang, W.; Chen, H.; Qiao, R. Fracture Evolution during CO2 Fracturing in Unconventional Formations: A Simulation Study Using the Phase Field Method. Processes 2024, 12, 1682. [Google Scholar] [CrossRef]
- Li, Q.; Li, Q.; Cao, H.; Wu, J.; Wang, F.; Wang, Y. The crack propagation behaviour of CO2 fracturing fluid in unconventional low permeability reservoirs: Factor analysis and mechanism revelation. Processes 2025, 13, 159. [Google Scholar] [CrossRef]
- Zhang, A.; Lei, Y.; Zhang, C.; Tao, J. Enhanced Oil Recovery and CO2 Storage Performance in Continental Shale Oil Reservoirs Using CO2 Pre-Injection Fracturing. Processes 2023, 11, 2387. [Google Scholar] [CrossRef]
- Yang, B.; Wang, H.; Li, G.; Wang, B.; Chang, L.; Tian, G.; Zhao, C.; Zheng, Y. Fundamental study and utilization on supercritical CO2 fracturing developing unconventional resources: Current status, challenge and future perspectives. Pet. Sci. 2022, 19, 2757–2780. [Google Scholar] [CrossRef]
- Zhai, H.; Yu, X.; Meng, X.; Sun, K.; Zhang, X.; Xu, Y.; Wang, H.; Wang, B.; Zheng, Y. CO2 Quasi-Dry Fracturing Technology and Field Application in the Lulehe Formation of the Qaidam Basin. Processes 2026, 14, 216. [Google Scholar] [CrossRef]
- Hou, Z.; Yuan, Y.; Chen, Y.; Feng, J.; Wang, H.; Zhang, X. A review of supercritical CO2 fracturing technology in shale gas reservoirs. Processes 2024, 12, 1238. [Google Scholar] [CrossRef]
- Tian, G.; Wang, H.; Li, G.; Yang, B.; Zhao, C.; Zheng, Y. Experiment investigation on the fracture initiation characteristics of shale saturated with CO2 and brine. In Proceedings of the ARMA US Rock Mechanics/Geomechanics Symposium, Santa Fe, NM, USA, 26–29 June 2022. [Google Scholar] [CrossRef]
- Liu, L.; Ding, R.; Chen, E.; Zhang, C. Investigation of the CO2 Pre-Fracturing Mechanism for Enhancing Fracture Propagation and Stimulated Reservoir Volume in Ultra-Deep Oil Reservoirs. Energies 2025, 18, 96. [Google Scholar] [CrossRef]
- Han, X.; Song, Z.; Wang, J.; Qi, N.; Li, P.; Jiang, J.; Song, Y.; Zhang, K.; Chen, M.; Lyu, Y. Enhanced oil recovery mechanisms of pre-fracturing CO2 injection in high-maturity shale oil reservoirs: Integrated phase behavior experiments and field-scale numerical simulations. Geoenergy Sci. Eng. 2026, 256, 214146. [Google Scholar] [CrossRef]
- Zhou, X.; Wang, Q.; Wei, J.; Cheng, H.; Huang, B.; Shang, D. Study on mechanism of Pre-CO2 fracturing and analysis of sensitive factors for CO2 fracturing backflow in shale oil reservoirs. Int. J. Hydrogen Energy 2025, 117, 409–419. [Google Scholar] [CrossRef]
- Zhang, K.; Qi, Y.; Xue, X.; Tao, L.; Chen, W.; Wu, A. CO2 regional enhanced volumetric fracturing technology for shale oil horizontal wells in Ordos Basin. Pet. Drill. Tech. 2023, 51, 15–22. [Google Scholar] [CrossRef]
- Li, Y.; Zhu, Y.; Li, Z.; Jiang, T.; Xue, Z.; Shen, Z.; Xiao, P.; Yu, H.; Cheng, Z.; Zhao, Q.; et al. Shale oil recovery by CO2 injection in Jiyang Depression, Bohai Bay Basin, East China. Pet. Explor. Dev. 2024, 51, 981–992. [Google Scholar] [CrossRef]
- Alfarge, D.; Wei, M.; Bai, B. Factors affecting CO2-EOR in shale-oil reservoirs: Numerical simulation study and pilot tests. Energy Fuels 2017, 31, 8462–8480. [Google Scholar] [CrossRef]
- Wang, Y.; Cao, R.; Jia, Z.; Wang, B.; Ma, M.; Cheng, L. A multi-mechanism numerical simulation model for CO2-EOR and storage in fractured shale oil reservoirs. Pet. Sci. 2024, 21, 1814–1828. [Google Scholar] [CrossRef]
- Arri, L.E.; Yee, D.; Morgan, W.; Jeansonne, M. Modeling Coalbed Methane Production with Binary Gas Sorption. In Proceedings of the SPE Rocky Mountain Petroleum Technology Conference/Low-Permeability Reservoirs Symposium, Casper, WY, USA, 18–21 May 1992. [Google Scholar] [CrossRef]
- Sigmund, P.M. Prediction of Molecular Diffusion at Reservoir Conditions. Part II—Estimating the Effects of Molecular Diffusion and Convective Mixing in Multicomponent Systems. J. Can. Pet. Technol. 1976, 15, 53–62. [Google Scholar] [CrossRef]
- Enick, R.M.; Klara, S.M. CO2 solubility in water and brine under reservoir conditions. Chem. Eng. Commun. 1990, 90, 23–33. [Google Scholar] [CrossRef]
- Land, C.S. Comparison of calculated with experimental imbibition relative permeability. J. Soc. Pet. Eng. 1971, 11, 419–425. [Google Scholar] [CrossRef]
- Palmer, I.; Mansoori, J. How Permeability Depends on Stress and Pore Pressure in Coalbeds: A New Model. SPE Reserv. Eval. Eng. 1996, 1, 539–544. [Google Scholar] [CrossRef]


Disclaimer/Publisher’s Note: The statements, opinions and data contained in all publications are solely those of the individual author(s) and contributor(s) and not of MDPI and/or the editor(s). MDPI and/or the editor(s) disclaim responsibility for any injury to people or property resulting from any ideas, methods, instructions or products referred to in the content. |
© 2026 by the authors. Licensee MDPI, Basel, Switzerland. This article is an open access article distributed under the terms and conditions of the Creative Commons Attribution (CC BY) license.