Abstract
This study presents the results of an investigation into the carbothermic synthesis of silicon carbide (SiC) from microsilica and petroleum coke. The research combines thermodynamic modeling with experimental validation conducted in an ore-thermal furnace. Thermodynamic calculations were performed using the HSC Chemistry 10 software package to evaluate the influence of temperature and the SiO2/C ratio on phase formation and the conditions of SiC synthesis. The results show that the synthesis process exhibits a strong dependence on temperature and is largely governed by the carbon balance of the charge. At an SiO2/C ratio of 1, the system is carbon-rich, which promotes effective reduction of silicon dioxide. However, at elevated temperatures, these conditions intensify gas-phase reactions and lead to increased silicon losses. The most favorable conditions for silicon carbide formation were achieved at an SiO2/C ratio of 1.5, which is close to the stoichiometric value. This conclusion is confirmed by the maximum degree of SiC recovery obtained under experimental conditions. In contrast, at an SiO2/C ratio of 2, carbon deficiency results in incomplete reduction in SiO2 and a lower yield of the target product. The phase composition of the synthesized samples was analyzed by X-ray diffraction, revealing β-SiC as the dominant crystalline phase. The morphology and structure of the materials were examined using scanning electron microscopy, which confirmed the formation of SiC particles and aggregates with characteristic features. A comparison between calculated and experimental results demonstrates that thermodynamic modeling adequately describes the main trends of the process and can be effectively applied to optimize SiC synthesis conditions during the processing of technogenic silica-containing waste.
1. Introduction
The global production of electrical steel is characterized by increasingly stringent requirements for impurity control and energy efficiency. These trends stimulate the growing demand for high-purity silicon-containing alloys [1,2,3]. As a result, the expansion of electrical steel production is accompanied by a corresponding increase in the consumption of silicon ferroalloys [4].
Silicon-containing ferroalloys are produced in ore-thermal furnaces through high-temperature carbothermic reduction in silica. This process generates significant amounts of dust-like technogenic waste, primarily in the form of microsilica, which is captured by gas-cleaning systems [5,6,7]. Despite its high chemical reactivity and ultrafine particle size, microsilica is currently utilized only to a limited extent and is often stockpiled.
At present, microsilica is widely used in construction materials, particularly as an additive in concrete and asphalt composites [8,9,10,11,12,13,14,15,16,17,18,19,20,21,22,23,24]. In contrast, its application as a silicon source for advanced ceramic materials has received considerably less attention. This limitation is especially evident under conditions close to industrial practice.
Silicon carbide (SiC) is a strategically important material with extensive applications in abrasives, refractories, metallurgy, and modern electronic technologies [25]. However, industrial-scale SiC production in the Republic of Kazakhstan remains poorly developed. This situation results in low export volumes and a strong dependence on imported products [26]. At the same time, Kazakhstan has a well-established high-silicon ferroalloy industry that generates large quantities of microsilica as technogenic waste.
Several methods are used for SiC production, including the Acheson process, self-propagating high-temperature synthesis (SHS), chemical vapor deposition (CVD), and crystal growth techniques such as the Lely and LETI methods [27,28,29]. Among these approaches, the Acheson process remains the dominant industrial route for producing technical-grade SiC due to its simplicity and scalability. In recent years, increasing attention has been focused on energy-efficient and sustainable technologies based on the utilization of silicon-containing industrial waste, including microsilica.
Thermodynamic modeling is an effective tool for analyzing carbothermic reactions and optimizing synthesis parameters. However, the strongly non-equilibrium conditions typical of Acheson-type furnaces can lead to discrepancies between calculated equilibrium data and experimental results [30]. Therefore, experimental validation remains essential, particularly for assessing the influence of temperature and the SiO2/C ratio on SiC formation. The HSC Chemistry software package enables equilibrium calculations that provide valuable insight into phase formation and reaction pathways [31].
The present study aims to investigate the carbothermic synthesis of silicon carbide from technogenic microsilica and petroleum coke under large laboratory-scale conditions. The research combines thermodynamic modeling with experimental validation in an ore-thermal furnace. The obtained results contribute to the development of a technological basis for the utilization of silica-containing technogenic waste under conditions approaching practical industrial implementation.
The scientific novelty of the present study can be summarized as follows:
- -
- the use of technogenic microsilica generated during industrial silicon alloy production as the primary silicon source for SiC synthesis;
- -
- implementation of carbothermic synthesis under large laboratory-scale conditions, exceeding conventional bench-scale experiments and approaching practical technological regimes;
- -
- combined application of thermodynamic modeling and experimental validation to analyze silicon carbide formation;
- -
- systematic investigation of the influence of the SiO2/C ratio and temperature range relevant to real carbothermic processing conditions.
2. Experimental Procedure
2.1. Raw Materials
Technogenic microsilica and petroleum coke were used as the starting materials for silicon carbide synthesis. The microsilica was supplied by «Tau-Ken Temir» LLP (Karaganda, Kazakhstan), a producer of silicon-containing ferroalloys using carbothermic reduction in ore-thermal furnaces. A by-product of this process—microsilica—represents a valuable technogenic raw material containing no less than 96.85 wt.% SiO2 [32].
The chemical composition of microsilica was determined using analytical chemistry methods. The particle size distribution was analyzed using a Fritsch ANALYSETTE 22 MicroTec Plus laser diffraction analyzer (Fritsch GmbH, Idar-Oberstein, Germany).
Microsilica is collected from furnace off-gases by gas-cleaning systems and represents an ultrafine silica-rich technogenic by-product. The chemical composition of the microsilica is presented in Table 1. The material contains predominantly SiO2 (above 94 wt.%), with minor amounts of CaO, Al2O3, Fe2O3, and MgO originating from the impurity composition of the initial raw materials and furnace charge.

Table 1.
Chemical composition of microsilica, %.
Petroleum coke was used as the carbonaceous reducing agent. Its technical composition is presented in Table 2, where A–represents ash content, W–moisture content, V–volatile matter, Csolid–fixed carbon, and Sgeneral–total sulfur. Petroleum coke was selected due to its high fixed carbon content and widespread use in carbothermic metallurgical processes.
Table 2.
Technical composition of the reducing agent, %.
2.2. Briquetting Procedure
To ensure stable furnace operation and reduce dust losses during high-temperature processing, the initial charge materials were subjected to briquetting. Microsilica and petroleum coke were mixed according to the compositions listed in Table 3, corresponding to different SiO2/C ratios. Briquetting was carried out using a ZZXM-4 briquetting machine (Zhengzhou Zhongzhou Briquette Machinery Plant, Gongyi, Henan, China). The width and diameter of the briquetting rolls were 250 mm and 360 mm, respectively, and the total pressing force of the briquetting machine, according to the technical specifications, was 15 t.
Table 3.
Composition of the initial charge materials for briquetting.
The briquettes were produced without the addition of an external binder. Sufficient green strength was achieved through mechanical compaction and the fine particle size of microsilica. The initial briquettes had characteristic sizes of 30–60 mm.
Based on the results of the first synthesis experiment, crushed briquettes with particle sizes of 15–20 mm were prepared for subsequent runs. This modification was introduced to increase the reactive surface area and improve the uniformity of carbothermic reactions. The use of crushed briquettes enhanced the interaction between the silica and carbon components and promoted more intensive SiC formation.
2.3. Furnace and Synthesis Conditions
Experimental studies were conducted in a laboratory ore-thermal furnace with a rated power of 100 kVA. A schematic representation of the furnace is shown in Figure 1.
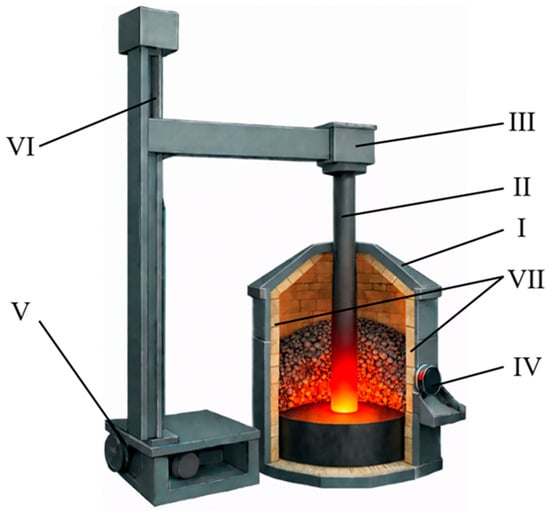
Figure 1.
Schematic of a 100 kVA ore-thermal furnace. I—furnace casing (5 mm thick steel sheet); II—graphite electrode (Ø 100 mm); III—electrode holder; IV—power supply busbar; V—drive motor; VI—threaded rod for electrode positioning; VII—fireclay brick lining (working zone).
The furnace was equipped with a single graphite electrode with a diameter of 100 mm and operated in electrical resistance heating mode. During synthesis, the electrode was electrically connected to the bottom electrode. Heat generation occurred as a result of electric current passing through the charge layer. The furnace lining was made of fireclay bricks. The system was also equipped with an exhaust and dust collection unit.
Temperature control during carbothermic synthesis accounted for the non-uniform thermal field typical of submerged-arc furnaces. Periodic temperature measurements were performed in the reaction zone, primarily in regions adjacent to the electrode. A VR-5/20 thermocouple was used for these measurements. The recorded temperatures in these zones ranged from 1950 to 2000 °C. Continuous temperature monitoring across the entire reaction volume was not feasible due to harsh operating conditions and pronounced temperature gradients. Therefore, the thermal regime was controlled indirectly by maintaining a stable electrical current of 90–95 A. This approach, combined with periodic thermocouple measurements, ensured reproducible synthesis conditions.
The charge was introduced stepwise, with approximately 2 kg added every hour. Each synthesis experiment had a total duration of 7 h. This period included a loading stage of 5 h followed by a holding time of 2 h under stable operating conditions. After completion of the synthesis, the furnace was switched off and allowed to cool naturally to room temperature. The furnace was then dismantled to recover the synthesized products for further analysis.
2.4. Thermodynamic Modeling
Thermodynamic modeling was performed using the HSC Chemistry software, version 10 (Outotec Oyj, Pori, Finland) package, which is based on the Gibbs free energy minimization method. This approach determines the equilibrium composition of a system by identifying the state with the minimum Gibbs free energy under specified conditions. One of its main advantages is that only the quantitative composition of the reactants and the temperature range are required as input parameters. A complete definition of all possible chemical reactions is not necessary [33]. It should be noted that the modeling results distinguish only between condensed and gaseous states. The software does not differentiate between solid and liquid phases within the condensed state.
In the present study, phase analysis of the SiO2–C system was carried out using thermodynamic data from the HSC Chemistry 10 database. This database is part of a comprehensive software package designed for modeling chemical and metallurgical processes. It is regularly updated in accordance with the standards of SGTE (Scientific Group Thermodata Europe). Thermodynamic modeling facilitates the selection of optimal process conditions and supports the proper design of experiments [34].
To investigate the equilibrium composition during SiC synthesis, the «Equilibrium Compositions» module was employed. This module enables the simulation of system behavior under specified thermodynamic conditions. The GIBBS algorithm was used to identify the minimum-energy state of the system. Equilibrium was determined by minimizing the total Gibbs free energy [35]. This approach provides a reliable assessment of phase formation conditions and reaction pathways in high-temperature metallurgical processes.
For thermodynamic calculations of the SiO2–C system using petroleum coke as the reducing agent, the following parameters were specified.
The temperature range was set from 1000 to 3000 °C. This interval allows comparative analysis of element reduction and phase formation over a wide range of synthesis conditions. The pressure was assumed to be 0.1 MPa in all calculations, reflecting the idealized conditions used in thermodynamic modeling. The system volume was defined by the component composition and the specified thermodynamic conditions. All substances were assumed to be uniformly distributed among the phases. During modeling, the system was considered closed, with no mass or energy exchange with the external environment. This assumption allows focus on internal chemical and thermodynamic interactions.
The amount of reducing agent was selected based on extended thermodynamic modeling of the Si–C–O system. Calculations were carried out for a fixed amount of microsilica (100 kg) while varying the amount of petroleum coke from 10 to 150 kg. This range allowed evaluation of the system under carbon-deficient, near-stoichiometric, and carbon-rich conditions. Based on this parametric analysis, three representative compositions were selected for detailed discussion and experimental validation. These compositions corresponded to 100, 70, and 50 kg of petroleum coke per 100 kg of microsilica. They reflect SiO2/C ratios of 1.0, 1.5, and 2.0, respectively, and represent technologically relevant charge conditions commonly encountered in carbothermic SiC synthesis.
2.5. Characterization Methods
The phase composition of the synthesized materials was determined by X-ray diffraction (XRD) analysis using an X’Pert Pro diffractometer (PANalytical B.V., Almelo, The Netherlands) with Cu Kα radiation. The diffraction patterns were used to identify crystalline phases and assess the formation of silicon carbide.
The morphology and microstructure of the synthesized products were examined using scanning electron microscopy (SEM) with a ZepTools ZEM20 microscope (ZepTools Technology Co., Ltd., Tongling, China). Elemental composition and distribution were analyzed using an energy-dispersive X-ray spectroscopy (EDS) system (Oxford Instruments, Abingdon, UK) attached to the SEM.
EDS analysis was applied in a semi-quantitative manner to identify the main elements and impurity phases present in the samples. Due to the limitations associated with carbon quantification by EDS, the technique was primarily used to confirm the presence of silicon and carbon and to identify impurity-rich regions.
3. Results
3.1. Results of Granulometric Analysis of Microsilica
The particle size distribution of technogenic microsilica was determined by laser diffraction using the Fraunhofer approximation. The obtained results confirm that the microsilica is a finely dispersed material with a broad particle size distribution. The results of the granulometric analysis are presented in Figure 2.
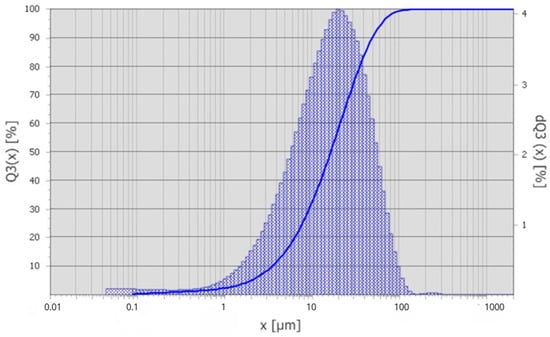
Figure 2.
Differential particle size distribution curve of microsilica.
According to the granulometric analysis in Figure 2, 10% of the particles have sizes below 3.5 µm (d10), while the median particle size (d50) is 16.4 µm. The 90th percentile (d90) corresponds to a particle size of 49.3 µm, and 99% of the particles are smaller than 91.8 µm. The volume-weighted mean diameter D(4,3) 22.39 µm, and the modal particle size is approximately 20.39 µm.
The calculated span value ((d90 − d10)/d50) of 2.77 indicates a relatively wide and polydisperse particle size distribution, which is characteristic of technogenic microsilica collected from gas-cleaning systems of ore-thermal furnaces.
The fine particle size and high dispersion of microsilica contribute to its high reactivity during carbothermic reduction. At the same time, the broad size distribution and the presence of ultrafine fractions explain the tendency of microsilica to agglomerate and form dust during handling. These features justify the application of briquetting as a necessary step to ensure stable furnace operation and effective interaction between silica and carbon during silicon carbide synthesis.
3.2. Results of Briquetting of the Initial Raw Materials
Based on the results of the thermodynamic modeling, three large-scale laboratory experiments on SiC synthesis were carried out. Briquettes prepared from microsilica and petroleum coke with a size of 30–60 mm were used as the starting material (Figure 3). After briquetting of the charge mixture using a briquetting machine, briquettes were obtained, the appearance of which is shown in Figure 3a. Figure 3b shows crushed briquettes used to intensify the SiC synthesis process.
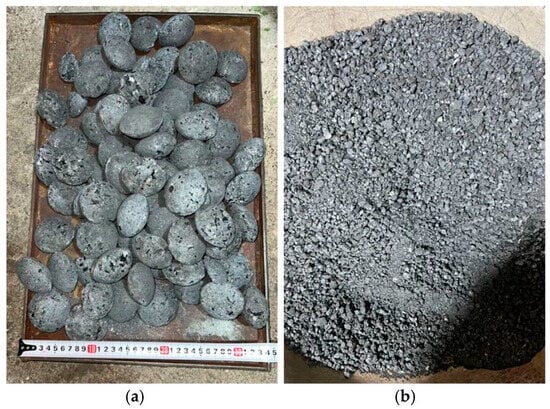
Figure 3.
Briquettes obtained for SiC synthesis: (a) initial large briquettes; (b) crushed briquettes.
3.3. Results of Thermodynamic Modeling
In the thermodynamic modeling of SiC synthesis from microsilica and petroleum coke, the involved compounds were treated as associates: SiO2, SiC, C, CO(g), Si(g), SiO(g), and Si.
Based on the thermodynamic modeling results, plots describing SiC formation at an SiO2/C ratio of 1 were constructed. The graphs illustrating the carbide formation process are presented in Figure 4.
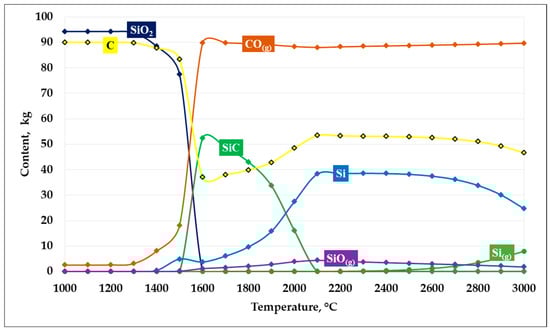
Figure 4.
Dependence of SiC formation on temperature at an SiO2/C ratio of 1.
As shown in Figure 4, the results of thermodynamic modeling of the carbothermic reduction process at an SiO2/C ratio of 1 demonstrate a pronounced temperature dependence of the system’s phase composition. In the temperature range up to 1300–1400 °C, the system is characterized by high thermodynamic stability of the initial components —silicon dioxide and carbon—whose mass fractions remain nearly unchanged, while the formation of reaction products is insignificant.
At temperatures of approximately 1400 °C, reduction reactions begin to proceed actively:
SiO2 + C = SiO + CO
SiO + 2C = SiC + CO
With an increase in temperature above 1450–1500 °C, a sharp decrease in the contents of SiO2 and C is observed, accompanied by an intensive increase in the CO(g) gas phase, indicating the activation of carbothermic reduction. In the temperature range of 1500–1700 °C, the maximum amount of solid SiC is formed, which corresponds to the most favorable thermodynamic conditions for its formation in the system.
Further temperature increase leads to a decrease in SiC stability. At temperatures above 1800–1900 °C, the SiC content decreases, which is associated with its partial decomposition and the involvement of silicon in alternative reactions. Simultaneously, the fraction of elemental silicon (Si), as well as gaseous silicon-containing species—primarily SiO(g)—increases, indicating intensified silicon evaporation and the transfer of part of the material into the gas phase.
In the high-temperature region (above 2200 °C), the system is characterized by the predominance of the CO(g) gas phase and a significant content of metallic silicon, whereas solid SiC becomes thermodynamically less stable. Thus, at an SiO2/C ratio of 1, the most efficient formation of SiC is predicted in the temperature range of 1500–1700 °C, while at higher temperatures, silicon losses to the gas phase increase and the yield of the target product decreases. According to the thermodynamic modeling results, at a temperature of 1600 °C, the conversion of silicon into SiC reaches 87.95%.
It should be noted that at an SiO2/C ratio of 1, the system contains an excess amount of carbon relative to that stoichiometrically required for the SiC formation reaction.
The next thermodynamic modeling calculation was performed at an SiO2/C ratio of 1.5. The obtained calculation results are shown in Figure 5.
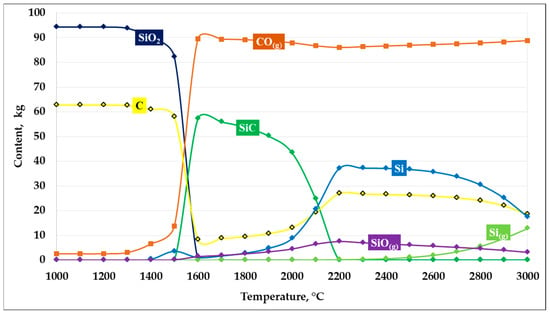
Figure 5.
Dependence of SiC formation on temperature at an SiO2/C ratio of 1.5.
As shown in Figure 5, the results of thermodynamic modeling of the carbothermic reduction of silicon dioxide at an SiO2/C ratio of 1.5 indicate the formation of more favorable conditions for SiC synthesis. This ratio is close to the stoichiometric value (1.66) and provides an optimal carbon balance within the system.
In the temperature range up to 1400 °C, the system is characterized by the stability of the initial components, with no significant changes observed in the phase composition. When the temperature exceeds 1450–1500 °C, intensive carbothermic reduction in SiO2 begins, accompanied by a sharp increase in the CO(g) gas phase and a simultaneous decrease in the concentrations of SiO2 and carbon.
The maximum formation of solid SiC is observed in the temperature range of 1500–1800 °C, where its amount reaches the highest values compared to the other considered compositions. At the same time, the content of free carbon is minimal, indicating its efficient participation in the carbide formation reaction. The presence of a balanced amount of reducing agent promotes both solid-phase and gas-phase mechanisms of SiC formation, including pathways involving the intermediate formation of SiO(g). At a temperature of 1600 °C, the maximum conversion of silicon into SiC reaches 94.52%.
With further temperature increase above 1900–2000 °C, a gradual decrease in SiC content is observed, which is associated with an increasing fraction of elemental silicon and gaseous silicon-containing species, primarily SiO(g) and Si(g). Nevertheless, compared with carbon-excess and carbon-deficient compositions, at an SiO2/C ratio of 1.5 silicon losses to the gas phase are less pronounced, and the temperature interval of stable SiC existence is the widest.
Thus, an SiO2/C ratio of 1.5 can be considered thermodynamically the most favorable due to its proximity to the stoichiometric value, providing the maximum predicted yield of silicon carbide and stability of the target product over a wide temperature range.
The next thermodynamic modeling calculation was performed at an SiO2/C ratio of 2. The modeling results are presented in Figure 6.
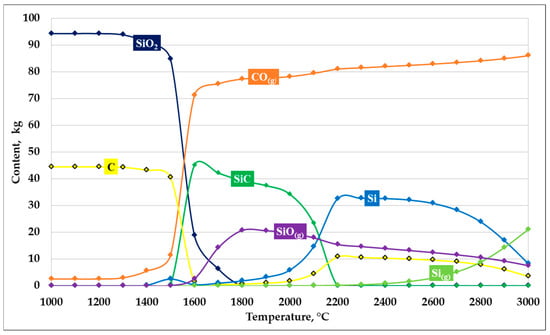
Figure 6.
Dependence of SiC formation on temperature at an SiO2/C ratio of 2.
The results of thermodynamic modeling of the carbothermic reduction of silicon dioxide at an SiO2/C ratio of 2 indicate the formation of unfavorable conditions for SiC synthesis, which is attributed to a pronounced carbon deficiency relative to the stoichiometrically required amount.
In the temperature range up to 1400 °C, the phase composition of the system remains nearly unchanged, with the initial components—primarily silicon dioxide—accounting for the dominant fraction. When the temperature exceeds 1450–1500 °C, reduction in SiO2 begins, accompanied by an increase in the CO(g) gas phase. However, due to the lack of carbon, the process proceeds incompletely, thereby limiting the intensity of carbide formation.
The maximum amount of solid SiC is formed within a narrow temperature interval of 1500–1700 °C and is significantly lower than the corresponding values obtained for compositions close to stoichiometric. With further temperature increase, a sharp decrease in SiC content is observed, which is associated with the inability of SiC to remain stable under carbon-deficient conditions.
Simultaneously, the fraction of gaseous silicon-containing species, primarily SiO(g), increases, indicating enhanced silicon evaporation and its transfer to the gas phase. At temperatures above 2000 °C, a substantial portion of silicon is converted either to elemental form or to the gas phase as Si(g), whereas solid SiC almost completely disappears from the system.
Thus, at an SiO2/C ratio of 2, carbon deficiency leads to incomplete carbothermic reduction of silicon dioxide and intensified silicon losses to the gas phase. The obtained results confirm that carbon-deficient compositions are unfavorable for efficient SiC synthesis.
Based on thermodynamic modeling of SiC synthesis at three different SiO2/C ratios, the optimal synthesis behavior is observed at an SiO2/C ratio of 1.5. This is mainly explained by the proximity of this ratio to the stoichiometric value. However, thermodynamic modeling does not account for a number of factors—such as reaction kinetics, diffusion, impurity content, and others—that influence the actual SiC formation process. Therefore, experimental validation is required.
3.4. Results of Large-Scale Laboratory Tests for SiC Synthesis
The first SiC synthesis variant using large briquettes from the first batch was conducted at a stable current load of 90–95 A. The charge was introduced stepwise into the furnace, followed by a holding stage under steady operating conditions. The synthesis process is shown in Figure 7.
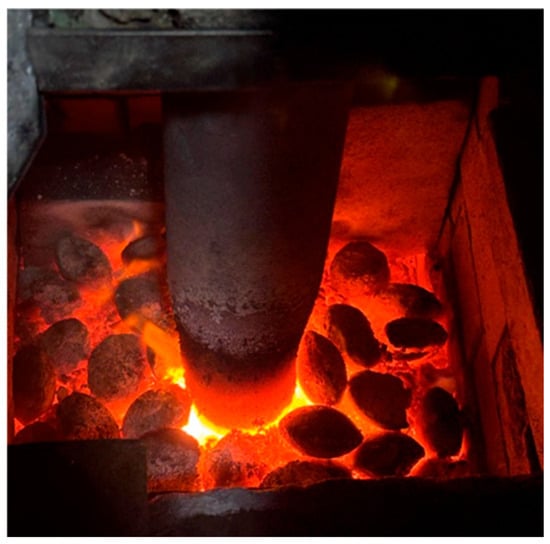
Figure 7.
SiC synthesis process: view of the furnace throat.
During the synthesis process, intensive gas evolution was observed, which was caused by the decomposition and interaction of the charge components. At the initial heating stages, the removal of moisture and volatile compounds occurred, accompanied by gas release. With further temperature increase, reduction reactions of silicon dioxide by carbon proceeded with the formation of carbon monoxide (CO), which was also associated with active gas evolution. This process contributed to the loosening of the briquette structure and enhanced contact between the reactants. At the final stages, SiC formation occurred, as confirmed by both thermodynamic calculations and subsequent experimental investigations.
After completion of the experiment, the furnace was switched off and allowed to cool naturally to room temperature (~24 h). Upon completion of cooling, the left side of the furnace was dismantled to enable further investigations and visual assessment of the process behavior. Figure 8 shows the dismantled furnace.
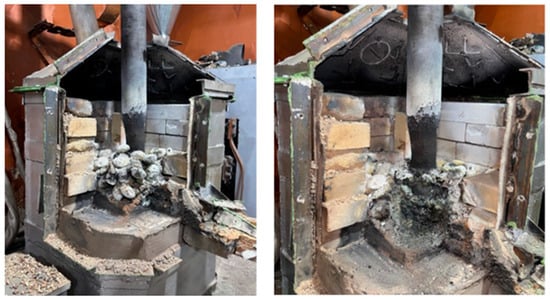
Figure 8.
View of the dismantled furnace after synthesis.
After dismantling the furnace, all obtained products were weighed. In the first synthesis variant, performed at an SiO2/C ratio of 1 using large briquettes, 2.23 kg of sintered product was obtained from 10 kg of charged material, compared to a theoretically possible yield of 3.09 kg. Figure 9 shows the appearance of the obtained sintered material and the charge located near the electrode.
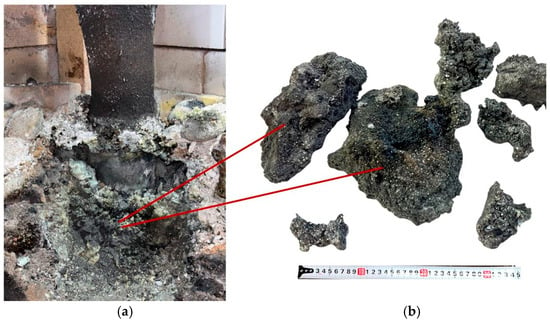
Figure 9.
Sintered materials around the electrode (a) and appearance of the materials (b) after the first synthesis.
After completion of all operations related to dismantling the furnace materials at the end of the synthesis, the furnace was reassembled to carry out the subsequent experiment with the second batch of briquettes. The fireclay lining was restored, the furnace casing was reassembled using bolted joints, and asbestos material was placed at the joints to ensure sealing.
Based on the results of the first experiment, it was established that the obtained briquettes did not react completely, which is attributed to their large size and limited reactivity. In order to intensify the process, the subsequent two experiments were carried out using crushed briquettes, which ensured a more uniform reaction progression and an increased degree of interaction between the components. The size of the crushed charge ranged from 15 to 20 mm. The synthesis process is shown in Figure 10.
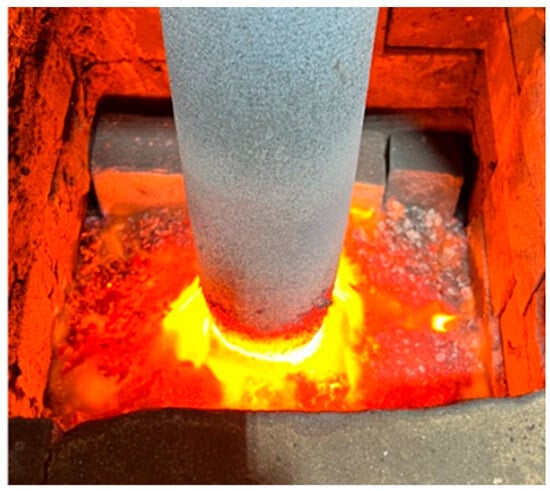
Figure 10.
SiC synthesis process: view of the furnace throat with crushed charge.
When crushed briquettes were used, the synthesis process proceeded more intensively and uniformly. The reduction in particle size provided a larger reactive surface area, which promoted more active interaction between the charge components. As in the first variant, at the initial stages moisture and volatile substances were removed, accompanied by gas evolution. With further heating, reduction reactions of SiO2 by carbon occurred with the formation of carbon monoxide (CO); however, due to improved contact between the reactants, gas evolution was more uniform, and loosening of the material structure proceeded more rapidly.
At the final stages of synthesis, SiC formation was more pronounced, which is confirmed by the experimental results. Visually, a more uniform heating of the charge was achieved, as clearly observed in Figure 10. In contrast, when large briquettes were used, the heating of the charge was visually less uniform (Figure 7).
After completion of the full 7 h synthesis experiment, the furnace was switched off and left to cool. Upon completion of cooling, the left side of the furnace was dismantled in order to conduct further investigations and to visually assess the process behavior, similarly to the first synthesis variant. Figure 11 shows the dismantled furnace with the synthesized materials inside.
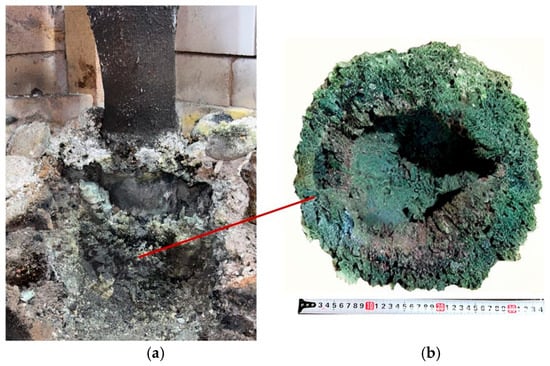
Figure 11.
Sintered materials around the electrode (a) and appearance of the materials (b) after the second synthesis.
After dismantling the furnace, all obtained products were weighed. In the second synthesis variant, performed at an SiO2/C ratio of 1.5 using crushed briquettes, the actual yield was 2.98 kg compared to a theoretical yield of 3.73 kg.
The third synthesis variant was also conducted for 7 h under stable furnace operating conditions. After dismantling the furnace, all obtained products were weighed. In the third variant, performed at an SiO2/C ratio of 2, 1.97 kg of product was obtained from 10 kg of the charge, compared to a theoretical yield of 3.38 kg. Figure 12 shows the appearance of the obtained sintered material and the charge located near the electrode.
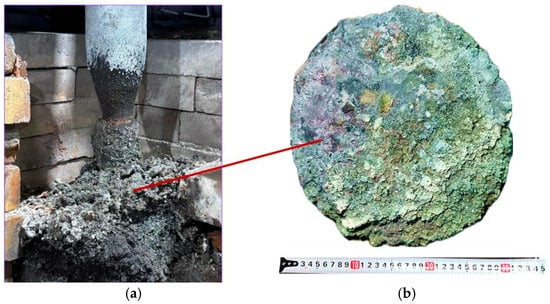
Figure 12.
Sintered materials around the electrode (a) and appearance of the materials (b) after the third synthesis.
3.5. Results of Investigation of the Synthesized Products
The synthesized products obtained as a result of carbothermic reduction in microsilica in an ore-thermal furnace were investigated using a combination of physicochemical characterization methods. Particular attention was paid to the phase composition, morphological features, and elemental distribution of the obtained materials.
The results of scanning electron microscopy of the first large-scale laboratory synthesis are presented in Figure 13.
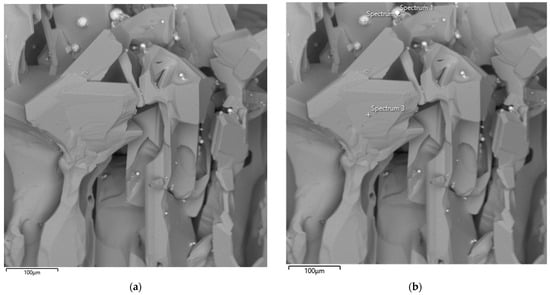
Figure 13.
SEM image of the synthesized SiC product (a) and corresponding EDS elemental analysis (b) after the first synthesis.
The SEM image shows the synthesis product obtained from the first batch of briquettes prepared from microsilica and petroleum coke at an SiO2/C ratio of 1. As can be seen from Figure 13, the synthesized product is characterized by predominantly flat grains. The micrograph reveals large, irregularly shaped crystals with characteristic angular facets, as well as aggregates of sintered particles. The crystal surfaces exhibit both smooth regions and areas with pronounced cracks and growth defects, indicating non-uniform crystallization processes. The observed morphological heterogeneity suggests the coexistence of zones of intensive crystal growth and local recrystallization. The overall structure of the material confirms the formation of a solid SiC phase with well-defined crystalline facets.
Semi-quantitative results obtained by energy-dispersive spectroscopy (EDS) have limited applicability for carbon-containing compounds due to the high uncertainty associated with carbon quantification. Nevertheless, EDS analysis of the main components revealed the presence of only silicon and carbon. Analysis of the bright (white) impurity particles, highlighted by yellow circles in Figure 13, indicated that they consist predominantly of iron, with minor amounts of other impurity elements originating from the initial microsilica. The EDS results are presented in Table 4.
Table 4.
Semi-quantitative EDS analysis of the synthesized product after the first synthesis.
The EDS map sum spectrum confirms that the synthesized product is composed predominantly of silicon and carbon. According to the semi-quantitative analysis, silicon and carbon account for 51.67 wt.% and 44.98 wt.% of the material, respectively, which is consistent with the formation of a silicon carbide phase. A minor oxygen content (2.86 wt.%) is attributed to residual silica or surface oxidation of the particles. Trace amounts of iron (0.48 wt.%) were also detected, likely originating from impurity components of the initial microsilica or interaction with furnace materials. The low concentration of impurity elements indicates a high degree of phase purity of the synthesized SiC.
Figure 14 presents SEM images of the particle morphology of the synthesized product obtained from the second large-scale laboratory synthesis at an SiO2/C ratio of 1.5. SEM analysis made it possible to visualize a clearly defined SiC crystal growth front formed as a result of the interaction between silicon and carbon. Similarly to the first experiment, large crystals exhibit irregular shapes with characteristic angular facets.
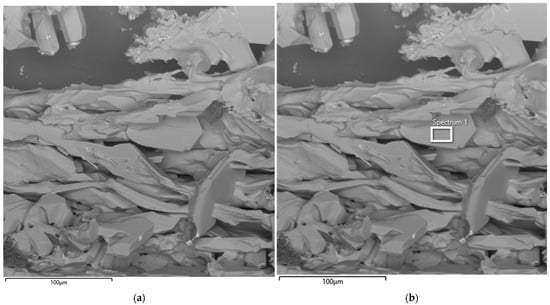
Figure 14.
SEM image of the synthesized SiC product (a) and corresponding EDS elemental analysis (b) after the second synthesis.
The EDS results of the second synthesis are presented in Table 5.
Table 5.
Semi-quantitative EDS analysis of the synthesized product after the second synthesis.
The semi-quantitative EDS analysis of the synthesized product obtained in the second large-scale laboratory synthesis (SiO2/C = 1.5) indicates that the material is predominantly composed of silicon and carbon (Table 5). According to the EDS results, carbon and silicon account for 50.30 wt.% and 45.09 wt.% of the product, respectively, which is consistent with the formation of a silicon carbide phase. The presence of a minor oxygen content (4.60 wt.%) is attributed to residual silica or surface oxidation of the synthesized particles. The absence of detectable metallic impurity elements suggests a relatively high purity of the synthesized product under the selected synthesis conditions.
Figure 15 presents an SEM image of the particle morphology of the synthesized product obtained after the third large-scale laboratory synthesis in an ore-thermal furnace at an SiO2/C ratio of 2. The SiC crystals exhibit predominantly angular shapes with well-defined facets.
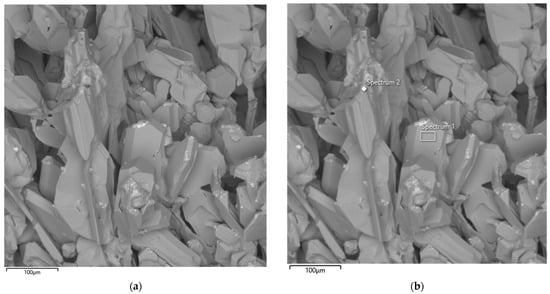
Figure 15.
SEM image of the synthesized SiC product (a) and corresponding EDS elemental analysis (b) after the third synthesis.
The EDS results of the second synthesis are presented in Table 6.
Table 6.
Semi-quantitative EDS analysis of the synthesized product after the third synthesis.
The semi-quantitative EDS analysis of the synthesized product obtained in the third large-scale laboratory synthesis (SiO2/C = 2) indicates that the material is composed predominantly of silicon and carbon. According to the EDS data, silicon and carbon account for 56.84 wt.% and 42.15 wt.% of the product, respectively, which confirms the formation of a silicon carbide phase.
At the same time, trace amounts of aluminum (0.19 wt.%) and iron (0.82 wt.%) were detected. These impurity elements are attributed to the impurity composition of the initial microsilica and possible interaction with furnace structural components during high-temperature processing. The increased relative silicon content and the presence of metallic impurities are consistent with carbon-deficient synthesis conditions, which limit complete carbothermic reduction of silicon dioxide. These results are in good agreement with the XRD data, indicating less favorable conditions for efficient SiC formation at an SiO2/C ratio of 2.
A more accurate method for determining the completeness of the SiC synthesis is X-ray diffraction (XRD) analysis. Figure 16, Figure 17 and Figure 18 present the XRD results for the first, second, and third batches of the synthesized product, respectively.
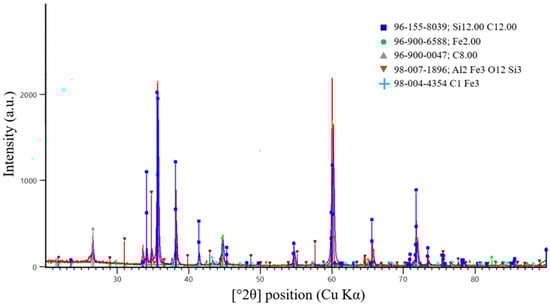
Figure 16.
X-ray diffraction pattern of the first synthesis batch.
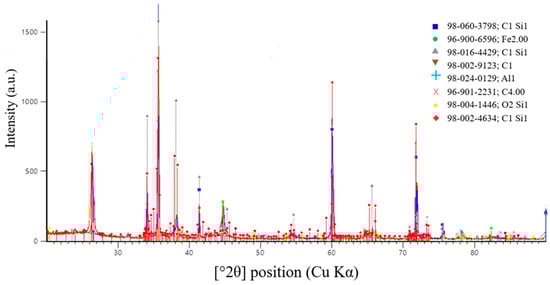
Figure 17.
X-ray diffraction pattern of the second synthesis batch.
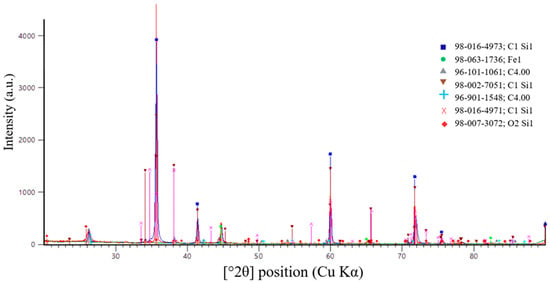
Figure 18.
X-ray diffraction pattern of the third synthesis batch.
According to X-ray diffraction (XRD) analysis of the sample shown in Figure 16, synthesized at an SiO2/C ratio of 1, a multiphase system was formed. Silicon carbide was identified as the dominant phase. The diffraction pattern exhibits intense peaks corresponding to β-SiC, indicating successful carbothermic synthesis and the formation of crystalline SiC.
In addition to the main SiC phase, diffraction peaks associated with residual carbon were detected. This observation indicates the carbon-excess nature of the charge at the selected SiO2/C ratio. The presence of residual carbon is consistent with thermodynamic modeling results, which predict excess reducing agent at SiO2/C = 1. Under these conditions, part of the carbon remains in the solid phase after completion of the synthesis.
Weak diffraction maxima corresponding to iron-containing and aluminosilicide phases (Fe, Fe–Al–Si) were also observed. These phases are most likely formed due to impurity components present in the initial microsilica. The intensities of these peaks are significantly lower than those of the SiC reflections, indicating that they represent secondary impurity phases.
Overall, the XRD results confirm that SiC is the predominant phase formed at an SiO2/C ratio of 1. However, carbon-excess conditions promote the retention of residual carbon and the formation of secondary phases. These effects may negatively influence the degree of recovery and the purity of the target product.
Analysis of the peak positions and relative intensities shows that the main reflections at 2θ values of 35.6°, 41.4°, 60.0°, 71.8°, and 75.4° (Cu Kα radiation) correspond to the (111), (200), (220), (311), and (222) crystallographic planes of cubic silicon carbide, β-SiC (3C-SiC). The dominance of these reflections and the absence of peak splitting characteristic of hexagonal α-SiC polytypes confirm that cubic SiC is the prevailing modification in the synthesized samples.
Figure 17 presents the results of X-ray diffraction (XRD) analysis of the second synthesis batch.
According to X-ray diffraction (XRD) analysis of the sample shown in Figure 17, synthesized at an SiO2/C ratio of 1.5, a predominantly carbide phase with a high degree of crystallinity was formed. Silicon carbide was identified as the main phase. The diffraction pattern shows intense and well-defined peaks corresponding to SiC, indicating efficient carbothermic synthesis at the selected charge composition.
The main diffraction peaks at 2θ values of 35.6°, 41.4°, 60.0°, 71.8°, and 75.4° (Cu Kα radiation) correspond to the (111), (200), (220), (311), and (222) crystallographic planes of cubic silicon carbide. The relative intensities of these reflections are characteristic of β-SiC (3C-SiC). This confirms the predominant formation of the cubic SiC modification.
In addition to the main SiC phase, weak diffraction maxima associated with residual carbon were detected. Their low intensity indicates that only a limited amount of reducing agent remained unreacted. This observation suggests that the selected SiO2/C ratio is close to the stoichiometric value. It is also consistent with the results of thermodynamic modeling.
Minor traces of iron-containing and silicon-containing phases were also observed. These phases are most likely related to impurity components in the initial raw materials or to interactions between the charge and furnace structural elements. Their contribution is minimal and does not significantly influence the phase composition of the target product.
Overall, the XRD results confirm that an SiO2/C ratio of 1.5 provides the most favorable conditions for SiC synthesis. Under these conditions, the cubic β-SiC modification is formed predominantly.
Figure 18 presents the results of X-ray diffraction analysis of the third synthesis batch.
According to X-ray diffraction (XRD) analysis of the sample shown in Figure 18, synthesized at an SiO2/C ratio of 2, a multiphase system was formed. Compared with samples obtained at lower SiO2/C ratios, the fraction of the carbide phase was significantly reduced. Diffraction peaks corresponding to SiC are present; however, their intensity is noticeably lower than that observed for the optimal composition (SiO2/C = 1.5). This indicates less efficient carbothermic synthesis.
The main diffraction peaks at 2θ values of 35.6°, 41.4°, 60.0°, 71.8°, and 75.4° (Cu Kα radiation) correspond to the (111), (200), (220), (311), and (222) crystallographic planes of cubic silicon carbide. The relative intensities of these reflections confirm the presence of β-SiC (3C-SiC) as the carbide phase. However, its content is limited.
In addition to SiC, the diffraction pattern clearly reveals peaks associated with silicon dioxide and residual carbon. This indicates incomplete reduction in SiO2 due to carbon deficiency in the charge. The presence of these phases confirms the unfavorable nature of the selected SiO2/C ratio of 2. This observation is consistent with thermodynamic modeling results, which predict reduced SiC stability under carbon-deficient conditions.
Overall, the XRD results demonstrate that SiC synthesis at an SiO2/C ratio of 2 proceeds incompletely. The predominantly cubic β-SiC phase forms in limited amounts, while a significant portion of silicon remains in oxide phases. These findings confirm that this composition is unfavorable for efficient SiC production.
4. Conclusions
The present study demonstrates that the efficiency of carbothermic synthesis of silicon carbide from microsilica and petroleum coke is not only controlled by the temperature regime. To a decisive extent, it is governed by the carbon balance of the charge. Thermodynamic analysis revealed fundamental differences in phase formation mechanisms associated with variations in the SiO2/C ratio. These differences explain the discrepancies observed between calculated and experimental results.
Carbon-excess compositions promote intensive reduction of silicon dioxide. However, at elevated temperatures, they also intensify gas-phase reactions and increase silicon losses, which limits the effective yield of SiC. In contrast, carbon-deficient compositions are both thermodynamically and technologically unfavorable. Under these conditions, an incomplete reduction in SiO2 and reduced stability of the SiC phase are observed. The most rational charge composition was found to be close to stoichiometric, with an SiO2/C ratio of 1.5. At this ratio, an optimal balance is achieved between the rate of carbide formation and the minimization of gas-phase silicon losses. This conclusion is confirmed by the maximum degree of SiC recovery obtained under ore-thermal furnace conditions.
A comparison of thermodynamic modeling results with large-scale laboratory experiments shows that computational methods adequately describe the general trends of the carbothermic process. These methods can therefore be effectively applied for the preliminary assessment and optimization of charge composition. At the same time, deviations from equilibrium calculations highlight the important role of kinetic effects, heat and mass transfer, and the structure of the briquetted charge under real furnace operating conditions.
Overall, the obtained results confirm the feasibility of a scientifically substantiated approach to the development of silicon carbide production technologies based on technogenic silica-containing waste. They also demonstrate the effectiveness of combining thermodynamic modeling with experimental validation for the design and adaptation of SiC synthesis processes under conditions close to industrial practice.
Author Contributions
Y.M., S.M., A.B. and Z.S.; methodology, Y.M., A.B. and Z.S.; formal analysis, A.B. and Z.S.; investigation, A.Z., S.K. and Z.S.; resources, B.K.; writing—original draft preparation, A.B.; writing—review and editing, Y.M., O.Y., B.K. and Z.S.; visualization, A.A. and S.K.; supervision, A.B.; project administration, Y.M., S.M., A.B., and S.K.; funding acquisition, Y.M. All authors have read and agreed to the published version of the manuscript.
Funding
This research was funded by the Science Committee of the Ministry of Science and Higher Education of the Republic of Kazakhstan (Grant No. AP27510125).
Data Availability Statement
All data and materials generated or analyzed during this study are presented in this article. Additional information is available from the corresponding authors upon reasonable request.
Acknowledgments
The authors gratefully acknowledge the Laboratory of Ferroalloys and Reduction Processes at the Zh. Abishev Chemical-Metallurgical Institute (Karaganda) for their valuable support, technical assistance, and contribution to the experimental work carried out in this study.
Conflicts of Interest
The authors declare no conflicts of interest. The funding organizations had no role in the study design; in the collection, analysis, or interpretation of data; in the writing of the manuscript; or in the decision to publish the results.
References
- Ivo, R.F.; Rodrigues, D.d.A.; Bezerra, G.M.; Freitas, F.N.C.; de Abreu, H.F.G.; Filho, P.P.R. Non-grain oriented electrical steel photomicrograph classification using transfer learning. J. Mater. Res. Technol. 2020, 9, 8580–8591. [Google Scholar] [CrossRef]
- Petrovic, D.S.; Markoli, B.; Ceh, M. The nanostructure of non-oriented electrical steel sheets. J. Magn. Magn. Mater. 2010, 20, 3041–3048. [Google Scholar] [CrossRef]
- Ouyang, G.; Chen, X.; Liang, Y.; Macziewski, C.; Cui, J. Review of Fe-6.5 wt% Si high silicon steel-A promising soft magnetic material for sub-kHz application. J. Magn. Magn. Mater. 2019, 481, 234–250. [Google Scholar] [CrossRef]
- Slater, C.; Ma, X.; Lagorce, G.; Soulard, J.; Davis, C. Novel Alloy Designed Electrical Steel for Improved Performance in High-Frequency Electric Machines. Metals 2025, 15, 1066. [Google Scholar] [CrossRef]
- Makhambetov, Y.; Sadyk, Z.; Zhakan, A.; Burumbayev, A.; Kabylkanov, S.; Myrzagaliyev, A.; Aubakirov, D.; Lu, N.; Akhmetov, A. Electric Arc Metallothermic Smelting of FeCr Using FeAlSiCa as a Reductant. Materials 2025, 18, 4221. [Google Scholar] [CrossRef]
- Makhambetov, Y.N.; Abdirashit, A.M.; Myngzhassar, Y.A.; Burumbayev, A.G.; Zhakan, A.M.; Onuralp, Y. Research on the Possibility of Obtaining Medium-Carbon Ferromanganese from the Djezdinskoe Deposit. Complex Use Miner. Resour. 2024, 331, 101–108. [Google Scholar] [CrossRef]
- Karlina, A.I.; Karlina, Y.I.; Gladkikh, V.A. Investigation of Pozzolan Activity, Chemical and Granulometric Composition of Micro- and Nanosilicon of the Bratsk Ferroalloy Plant. Minerals 2024, 14, 1114. [Google Scholar] [CrossRef]
- Lincy, V.; Rao, V.V.L.K.; Lakshmy, P. A study on nanosilica- and microsilica-added concretes under different transport mechanisms. Mag. Concr. Res. 2018, 70, 1205–1216. [Google Scholar] [CrossRef]
- Ahmed, A.; Hyndman, F.; Kamau, J.; Fitriani, H. Rice Husk Ash as a Cement Replacement in High Strength Sustainable Concrete. Mater. Sci. Forum 2020, 1007, 90–98. [Google Scholar] [CrossRef]
- Muhd Norhasri, M.S.; Hamidah, M.S.; Mohd Fadzil, A. Applications of using nano material in concrete: A review. Constr. Build. Mater. 2017, 133, 91–97. [Google Scholar] [CrossRef]
- Ahmad, A.; Farooq, F.; Niewiadomski, P.; Ostrowski, K.; Akbar, A.; Aslam, F.; Alyousef, R. Prediction of Compressive Strength of Fly Ash Based Concrete Using Individual and Ensemble Algorithm. Materials 2021, 14, 794. [Google Scholar] [CrossRef]
- Akhnoukh, A.K. Improving Concrete Infrastructure Project Conditions by Mitigating Alkali–Silica Reactivity of Fine Aggregates. Constr. Mater. 2023, 3, 233–243. [Google Scholar] [CrossRef]
- Nafees, A.; Javed, M.F.; Khan, S.; Nazir, K.; Farooq, F.; Aslam, F.; Musarat, M.A.; Vatin, N.I. Predictive Modeling of Mechanical Properties of Silica Fume-Based Green Concrete Using Artificial Intelligence Approaches: MLPNN, ANFIS, and GEP. Materials 2021, 14, 7531. [Google Scholar] [CrossRef] [PubMed]
- Mohmmad, S.H.; Shakor, P.; Muhammad, J.H.; Hasan, M.F.; Karakouzian, M. Sustainable Alternatives to Cement: Synthesizing Metakaolin-Based Geopolymer Concrete Using Nano-Silica. Constr. Mater. 2023, 3, 276–286. [Google Scholar] [CrossRef]
- Abna, A.; Mazloom, M. Flexural properties of fiber reinforced concrete containing silica fume and nano-silica. Mater. Lett. 2022, 316, 132003. [Google Scholar] [CrossRef]
- Kondratiev, V.V.; Karlina, A.I.; Guseva, E.A.; Konstantinova, M.V.; Gorovoy, V.O. Structure of Enriched Ultradisperse Wastes of Silicon Production and Concretes Modified by them. IOP Conf. Ser. Mater. Sci. Eng. 2018, 463, 042064. [Google Scholar] [CrossRef]
- Nemarov, A.A.; Lebedev, N.V.; Kondrat’ev, V.V.; Kornyakov, M.V.; Karlina, A.I. Theoretical and Experimental Research of Parameters of Pneumatic Aerators and Elementary Cycle Flotation. Int. J. Appl. Eng. Res. 2016, 11, 10222–10226. [Google Scholar]
- Liu, C.; He, X.; Deng, X.; Wu, Y.; Zheng, Z.; Liu, J.; Hui, D. Application of nanomaterials in ultra-high performance concrete: A review. Nanotechnol. Rev. 2020, 9, 1427–1444. [Google Scholar] [CrossRef]
- Varghese, L.; Rao, V.V.L.K.; Parameswaran, L. Nanosilica-added concrete: Strength and its correlation with time-dependent properties. Proc. Inst. Civ. Eng.—Constr. Mater. 2019, 172, 85–94. [Google Scholar] [CrossRef]
- Wu, L.; Lu, Z.; Zhuang, C.; Chen, Y.; Hu, R. Mechanical Properties of Nano SiO2 and Carbon Fiber Reinforced Concrete after Exposure to High Temperatures. Materials 2019, 12, 3773. [Google Scholar] [CrossRef] [PubMed]
- Amin, M.N.; Ahmad, A.; Khan, K.; Ahmad, W.; Ehsan, S.; Alabdullah, A.A. Predicting the Rheological Properties of Super-Plasticized Concrete Using Modeling Techniques. Materials 2022, 15, 5208. [Google Scholar] [CrossRef]
- Rassokhin, A.S.; Ponamarev, A.N.; Shambina, S.L.; Karlina, A.I. Different types of basalt fibers for disperse reinforcing of fine-grained concrete. Mag. Civ. Eng. 2022, 109, 10913. [Google Scholar] [CrossRef]
- Rassokhin, A.S.; Ponomarev, A.N.; Karlina, A.I. Nanostructured high-performance concretes based on low-strength aggregates. Mag. Civ. Eng. 2022, 110, 11015. [Google Scholar] [CrossRef]
- ARassokhin, S.; Ponomarev, A.N.; Shambina, S.L.; Karlina, A.I. High performance lightweight concretes for 3D printing. Mag. Civ. Eng. 2022, 115, 15510. [Google Scholar] [CrossRef]
- Lee, K.C.; Weis, M. Charge Traps in Wide-Bandgap Semiconductors for Power. Inorganics 2024, 12, 257. [Google Scholar] [CrossRef]
- Observatory of Economic Complexity (OEC). Silicon Carbide Trade Data for Kazakhstan. Available online: https://oec.world/en/profile/bilateral-product/silicon-carbide/reporter/kaz (accessed on 9 January 2026).
- Semeiko, K.V.; Malinovskii, A.I.; Grebenkov, A.Z.; Saenko, S.Y.; Lobach, K.V.; Kustovskaya, A.D.; Lyaposhchenko, A.A.; Sklabinskii, V.I. Development of Technologies for Silicon Carbide Production. Bull. Natl. Nucl. Cent. Repub. Kazakhstan 2021, 30–41. [Google Scholar] [CrossRef]
- Wellmann, P.J. Review of SiC crystal growth technology. Semicond. Sci. Technol. 2018, 33, 103001. [Google Scholar] [CrossRef]
- Zhitnyuk, S.V. Effect of sintering additives on the properties of silicon carbide ceramics. Proc. VIAM 2019, 75, 79–86. [Google Scholar] [CrossRef]
- Makhambetov, Y.; Abdulina, S.; Kabylkanov, S.; Burumbayev, A.; Zhakan, A.; Sadyk, Z.; Akhmetov, A. Production of Chromium–Manganese Ligature from Low-Grade Chromium and Iron–Manganese Ores Using Silicon–Aluminum Alloys as Reductants. Processes 2025, 13, 3158. [Google Scholar] [CrossRef]
- HSC Chemistry. Database Applications—HSC Chemistry. chemIT Services. Available online: https://www.chemits.com/en/software/database-applications/hsc-chemistry.html (accessed on 1 January 2026).
- Tau-Ken Temir Official Website. Available online: https://tks.kz/ru/kremnievyj-zavod-tau-ken-temir/ (accessed on 1 January 2026).
- Kennedy, M.W. Metallurgical Plant Optimization Through the use of Flowsheet Simulation Modelling. In Celebrating the Megascale; Mackey, P.J., Grimsey, E.J., Jones, R.T., Brooks, G.A., Eds.; Springer: Cham, Switzerland, 2014. [Google Scholar] [CrossRef]
- Baigenzhenov, O.; Temirgali, I.; Turan, M.D.; Maldybayev, G.; Sharipov, R.; Kusiorowski, R.; Bandegharaei, A.H. Thermodynamic Pathways and Phase Equilibria in the Si–C–O System Insights from Ellingham and TPP Diagrams. Chem. Methodol. 2026, 10, 395–407. [Google Scholar] [CrossRef]
- Paek, S.W.; Lee, C.H.; Yoon, D.; Lee, S.-J. Simulation of Rare Earth Elements Removal Behavior in TRU Product Using HSC Chemistry Code. J. Nucl. Fuel Cycle Waste Technol. 2020, 18, 207–215. [Google Scholar] [CrossRef]


Disclaimer/Publisher’s Note: The statements, opinions and data contained in all publications are solely those of the individual author(s) and contributor(s) and not of MDPI and/or the editor(s). MDPI and/or the editor(s) disclaim responsibility for any injury to people or property resulting from any ideas, methods, instructions or products referred to in the content. |
© 2026 by the authors. Licensee MDPI, Basel, Switzerland. This article is an open access article distributed under the terms and conditions of the Creative Commons Attribution (CC BY) license.