


Abstract
Enhanced Geothermal Systems (EGS) extend geothermal energy beyond conventional hydrothermal resources but face challenges in creating sustainable heat exchangers in low-permeability formations. This review synthesizes achievements from the Utah Frontier Observatory for Research in Geothermal Energy (FORGE), a field laboratory advancing EGS readiness in 175–230 °C granitic basement. From 2017 to 2025, drilling, multi-stage hydraulic stimulation, and monitoring established feasibility and operating parameters for engineered reservoirs. Hydraulic connectivity was created between highly deviated wells with ~300 ft vertical separation via hydraulic and natural fracture networks, validated by sustained circulation tests achieving 10 bpm injection at 2–3 km depth. Advanced monitoring (DAS, DTS, and microseismic arrays) delivered fracture propagation diagnostics with ~1 m spatial resolution and temporal sampling up to 10 kHz. A data infrastructure of 300+ datasets (>133 TB) supports reproducible ML. Geomechanical analyses showed minimum horizontal stress gradients of 0.74–0.78 psi/ft and N–S to NNE–SSW fractures aligned with maximum horizontal stress. Near-wellbore tortuosity, driving treating pressures to 10,000 psi, underscores completion design optimization, improved proppant transport in high-temperature conditions, and coupled thermos-hydro-mechanical models for long-term prediction, supported by AI platforms including an offline Small Language Model trained on Utah FORGE datasets.
1. Introduction
The transition to sustainable energy systems requires the diversification of renewable resources beyond variable sources such as solar and wind power. Geothermal energy offers unique advantages as a baseload renewable resource capable of continuous operation independent of weather conditions. However, conventional hydrothermal systems are geographically constrained to regions with natural permeability, native fluid, and accessible heat sources [1,2]. EGS technology addresses these limitations by creating engineered subsurface heat exchangers in hot, low-permeability formations through hydraulic stimulation, thereby expanding the geographic potential for geothermal development by orders of magnitude [3,4].
The fundamental EGS concept involves drilling into high-temperature rock formations, creating or enhancing fracture networks through hydraulic stimulation, and establishing circulation pathways between injection and production wells to extract thermal energy. Despite decades of research and field demonstration projects worldwide, including pioneering efforts at Fenton Hill, Soultz-sous-Forêts, and the Cooper Basin, several critical technical challenges have limited commercial deployment. These challenges encompass reservoir creation and sustainability, thermal breakthrough prevention, induced seismicity management, and the economic optimization of drilling and completion operations in high-temperature environments.
FORGE was developed as a dedicated field laboratory to address fundamental scientific and engineering questions limiting EGS deployment. The site selection criteria emphasized geological simplicity, thermal regime suitability, and operational accessibility, resulting in the designation of a location within the Mineral Mountains pluton near Milford, Utah, as shown in Figure 1. The geological setting features a composite Tertiary plutonic complex with multiple intrusive episodes spanning from the Oligocene to Miocene ages (25.4 Ma to 8 Ma), composed primarily of granite, quartz monzonite, and monzonite. The reservoir exhibits basement temperatures of 175 °C at 1990 m depth, reaching 197 °C at a 2296 m depth, matrix permeabilities less than 30 microdarcies (approximately 3 × 10⁻¹⁷ m2), and a well-characterized normal faulting stress regime with the maximum horizontal (principal) stress oriented NNE-SSW [5].
Figure 1.
Geologic map of the Utah FORGE site and vicinity [5].
The scientific objectives of Utah FORGE encompass multiple interconnected research domains: (1) the development and validation of drilling and completion technologies for high-temperature crystalline environments, (2) the optimization of hydraulic stimulation techniques for creating sustainable fracture networks, (3) the integration of real-time monitoring systems for fracture characterization and reservoir management, (4) the advancement of coupled thermo-hydro-mechanical modeling capabilities, and (5) the establishment of a comprehensive data management infrastructure to support reproducible research and technology transfer.
This review paper is intended as a field-scale, site-centered review that synthesizes the specific achievements and lessons learned from the Utah FORGE project. By examining the geological framework, drilling operations, hydraulic stimulation techniques, reservoir modeling approaches, monitoring systems, and thermal–hydraulic performance at this site, this review provides a comprehensive assessment of progress to date. The paper also identifies key research gaps and future directions for advancing EGS technology toward commercial viability. Through this systematic analysis of the Utah FORGE experience, insights emerge for the global development of Enhanced Geothermal Systems as a significant contributor to the renewable energy portfolio.
Scope of the Review Series: Given the extensive multidisciplinary dataset generated over the project’s decade-long history, this comprehensive review is divided into two parts. Part 1 (This Manuscript): This part focuses on the foundational and construction phases of the FORGE EGS reservoir. It synthesizes the geological characterization and the development of the monitoring/modeling ecosystem required to establish hydraulic connectivity. Part 2 (Future Work): This part will focus on the operational and sustainment phases. It will provide a detailed analysis of long-term circulation testing and thermal drawdown dynamics.
2. Utah FORGE Comprehensive Review
2.1. Geological and Structural Framework
The geological and structural framework of the Utah FORGE (Frontier Observatory for Research in Geothermal Energy) site is a complex interplay of lithology, tectonic history, and contemporary stress regimes, which are critical for understanding and developing Enhanced Geothermal Systems (EGS) [5]. Multidisciplinary investigations, including drill cuttings and core analyses, geophysical well logs, seismic surveys, and various geomechanical tests, have provided extensive data for a comprehensive geological understanding of the EGS reservoir [6].
2.1.1. Basement Rock Lithology
The deeper wells at the Utah FORGE site intersect a succession of sedimentary basin fill strata overlying crystalline basement rocks [5]. The basement rocks, which host the EGS reservoir, are broadly categorized into four groups: (1) sheared rhyolite; (2) sheared granitoid; (3) granitoid; and (4) interfingered metamorphic and granitoid rocks [5]. These crystalline rocks are part of the Mineral Mountains batholith, a composite pluton that extends westward beneath the alluvial cover from its outcrops in the Mineral Mountains [5].
The igneous constituents within the granitoid-dominated intervals range from granite to diorite. The principal minerals in these plutonic rocks include plagioclase, K-feldspar, and quartz, accompanied by minor biotite, hornblende, clinopyroxene, apatite, titanite, zircon, and magnetite–ilmenite [5]. The dominant lithologies encountered in well 58-32, for instance, are granite, quartz monzonite, and monzonite. Deep within the drilled basement, felsic granitoids are interleaved with metamorphic rocks, primarily orthogneisses [5]. These orthogneisses are mineralogically and compositionally similar to felsic granitoids, complicating their distinction using standard log responses or macroscopic textures in cuttings [5]. Less common, but more readily recognizable due to their distinctive mineralogies, are metasedimentary rocks like marble, quartzite, and schist, which are found engulfed by granitoids [5].
The crystalline basement rocks at FORGE exhibit very low porosity (e.g., <1% in well 58-32) and very low matrix permeability (e.g., 0.3 mD or low microdarcy range). This low native permeability necessitates the creation of an EGS reservoir through hydraulic stimulation to establish conductive pathways for fluid circulation [7,8]. Secondary minerals, such as clay minerals (kaolinite, smectite, illite, and chlorite), Mg- and Fe-carbonates, epidote, actinolite, albite, quartz, and trace anhydrite and halite, are commonly found [5]. These minerals are typically concentrated in fracture zones, reflecting open-space fillings and the replacement of precursor phases, with paragenetic relationships indicating a cooling trend over time [5].
2.1.2. Geologic History
The geological evolution of the Utah FORGE site is a consequence of several significant tectonic and magmatic events. The oldest rocks in the region are Proterozoic gneisses, with a metamorphic age of ~1.7 Ga (or ~1720 Ma), which form isolated rafts intruded by the younger batholith [9].
The Mineral Mountains batholith was emplaced incrementally, with U-Pb zircon dating indicating plutonic activity starting around 25.4 Ma with hornblende diorite intrusion, followed by younger plutonic rocks at ~18 Ma and 11 to 8 Ma [9,10,11]. Igneous activity also included the emplacement of coeval rhyolite and basalt dikes at ~11–12 Ma and later rhyolite domes along the crest of the Mineral Mountains at ~0.5–0.8 Ma [11].
The broader structural setting of FORGE reflects two distinct tectonic events: late Mesozoic to early Cenozoic compression during the Sevier orogeny, and middle Tertiary to recent extension associated with the Basin and Range province [12,13]. The latter is characterized by active extension, crustal thinning, sporadic seismicity, and localized bimodal volcanism. The Basin and Range extension dates back at least ~17 Ma, producing predominantly north–south trending fault zones [12].
A key event for the FORGE reservoir was the uplift and exhumation of the Mineral Mountains batholith [5]. This process induced early plastic deformation, observed as subtle foliation in granitoids, the development of penetrative fabrics typical of metamorphic lithologies, and the formation of narrow mylonite zones up to 30 cm thick. This plastic deformation was subsequently overprinted by later brittle deformation, including shearing, alteration, and veining, which is most intense at the top of the basement and diminishes with increasing depth [5]. The contact between the basin fill and the crystalline basement represents an inactive, gently westward-dipping (~20–35°) Basin and Range bounding normal fault that was rotated eastward during accelerated uplift and exhumation between 10 and 8 Ma [14].
The region also hosts the Roosevelt Hot Springs hydrothermal system, which is associated with young extensional faults, centers of Quaternary basalt–rhyolite magmatism, and high regional heat flow [15]. Geophysical evidence suggests a bimodal felsic–mafic magmatic heat source and a melt body at mid-crustal depths beneath Roosevelt Hot Springs [7,15]. Hydrothermal circulation in this system is inferred to extend to a 7–10 km depth, with activity spanning at least ~2000 years, and possibly more than 100,000 years [15]. Fluid–mineral equilibria and isotopic compositions indicate the deep circulation of meteoric water, acquisition of heat and magmatic volatiles, and protracted high-temperature water–rock interaction [15]. Open-space-filling minerals show paragenetic relationships that record decreasing temperatures over time, from >300 °C to <225 °C, potentially correlating with cooling during exhumation [5].
2.1.3. Faults and Fractures
Fractures are critical components of the FORGE EGS reservoir, acting as the potential pathways for fluid circulation when stimulated. The distribution of fractures in the EGS reservoir is notably heterogeneous, with localized intervals of intense fracturing [5]. Fracturing is generally more common in the upper basement and decreases with depth [5].
- ✓
- Outcrop Fracture Patterns (Mineral Mountains): Field observations in the Mineral Mountains reveal widespread fracturing in basement rocks with three predominant orientations: (1) strike ~090–110° and dip 70–90°; (2) strike ~010–040° and dip 70–90°; and (3) strike ~180° ± 30° and dip 30° ± 30° towards the west [7]. These fracture sets are believed to have formed either before or early during Basin–Range faulting, with the maximum compressive stress being vertical, consistent with a normal fault regime, followed by ~40° of eastward tilt [7].
- ✓
- Wellbore Fracture Patterns (FMI logs, cores): Geophysical logs, particularly Formation MicroImager (FMI) logs, are extensively used to characterize fracture types and orientations in the basement rocks. Approximately 2000 natural fractures were identified in well 58-32, primarily within the basement rocks, with spacing ranging from <1 to 20 per 10 ft interval [16]. These show a predominance of north–south, east–west, and northeast–southwest orientations. Shallower fractures generally dip to the west at ~30°, similar to the basin fill–basement contact, while deeper fractures (below ~1300 m) show steeply dipping E-W and NE-SW trending sets [5]. Well 16A(78)-32, a highly deviated injection well, showed fewer fractures compared to the vertical wells (58-32, 56-32, 78B-32) [5]. However, conductive fractures in 16A(78)-32 occur in localized clusters in two depth ranges (2362–2529 m and 3209–3218 m), often coinciding with lithologic contacts between granitoid and metamorphic domains [5].
Fractures identified from FMI logs are classified into three categories: (1) conductive/open; (2) partially conductive/partially sealed by mineralization; and (3) resistive/sealed by mineralization [7]. Conductive fractures are interpreted as preferred fluid flow paths and often occur in localized clusters at depth, with variable orientations [7]. Core samples provide fine-scale insights into these features. Planar, semi-planar, and unbroken mineralized fractures are observed, with orientations often aligning with the regional stress field. These planar features are more abundant in the finer-grained, darker-colored, banded gneiss than in the coarser-grained granitoid [17].
Major Faults: Several significant faults and fault systems influence the FORGE site, as follows:
- ✓
- Basin Fill–Crystalline Basement Contact: This gently westward-dipping (~20–35°) interface is interpreted as a rotated and eroded basin-bounding normal fault that accommodated significant local tectonic extension between 10 and 8 Ma [14]. Geophysical surveys image this as a strong seismic reflector with modest topography [7,18].
- ✓
- Opal Mound Fault: This is a major north–south trending, ~7 km long fault that forms the western boundary of the Roosevelt Hot Springs hydrothermal system [7]. It has an inferred steep eastward dip with less than 15 m of down-dip vertical offset [15].
- ✓
- Mag Lee Fault: This east–west striking structure can be traced for ~1 km on the surface. It is believed to intersect the Opal Mound fault to the west [5,15].
- ✓
- Mineral Mountains West Fault System: This is a young system composed of multiple normal fault strands, forming a >20 km long N-S corridor of cuspate scarps [5,7,16]. These are not believed to penetrate the basement.
2.1.4. In Situ Stress Conditions
Understanding the in situ stress field, encompassing the magnitudes and orientations of the principal stresses, is paramount for hydraulic fracturing design, wellbore stability, and mitigating induced seismicity in EGS development [19,20].
Stress Orientation and Magnitude Results
- ✓
- Vertical Stress (Sv or σV): The vertical stress is typically derived by integrating density logs from depth to the surface [12,21]. At the FORGE site, the vertical stress gradient (σV) is consistently estimated at approximately 1.13 psi/ft (equivalent to 25.6 kPa/m or 0.0256 MPa/m) [12,22]. This translates to magnitudes of around 58.6 MPa at 2350 m depth [23], 60.77 MPa [24], or 62.80 MPa [25].
- ✓
- Minimum Horizontal Stress (Shmin or σhmin or σ3): Shmin is a critical parameter for hydraulic fracturing design [19,20]. It is primarily assessed through Diagnostic Fracture Injection Testing (DFIT), leak-off tests, microfrac tests, and G-function analysis [20,26]. Multiple interpretations from various tests provide a range of values:
- Initial estimates from G-function analyses yielded gradients of 0.58–0.63 psi/ft, with 0.62 psi/ft being the most likely value [6,12]. These were subsequently judged to be too low—possibly because of wellbore cooldown and the small volumes injected during stress measurement protocols.
- More recent and comprehensive analyses from well 58-32 stimulations suggest a range of 0.74–0.78 psi/ft (16.7–17.6 kPa/m or ~0.017 MPa/m) as the best estimates for Shmin [22,27]. Some analyses in well 16A(78)-32 inferred values from 0.71 to 0.79 psi/ft.
- Magnitude estimates for Shmin include ~31.0 MPa [23] and ~32.5 MPa at 2350 m TVD [28].
- Geomechanical testing in the vertical pilot well 58-32 demonstrated a critical heterogeneity in reservoir stress properties, characterized by a differential in the inferred minimum horizontal stress (σhmin) gradients between two hydraulically isolated intervals. The deepest interval, designated as Zone 1, consists of an approximate 46 m (147 ft) openhole section below the casing shoe, extending from 2248 m measured depth (MD) to 2294 m MD, with gradient calculations typically referenced to a 2262 m true vertical depth (TVD) [20]. The stress interpretations for Zone 1 yielded gradients ranging from 15.2 to 18.8 MPa/km. In sharp contrast, Zone 2, a cased and perforated section situated uphole (perforated over 3 m from 2123 m to 2126 m MD, and referenced at 2122 m TVD), exhibited “apparent” stress gradients that were consistently higher, ranging from 17.2 to 21.5 MPa/km. This differential in closure pressure magnitudes is attributed to several complex geomechanical and hydraulic factors intrinsic to the reservoir and completion method [29,30]. The primary causative mechanisms include near-wellbore tortuosity and associated frictional losses, which are significantly exacerbated when injecting through perforations and casing compared to the openhole section [30,31], and the activation and dilation of natural fractures in Zone 2—intentionally selected for its abundance of pre-existing, near-critically stressed fractures-that were not oriented perpendicular to σhmin [30], and pronounced poroelastic effects, where fluid dissipation into the abundant natural fracture network generates self-induced “back stress” that increases the local total minimum principal stress, especially noticeable in subsequent injection cycles [30,31].
- ✓
- Maximum Horizontal Stress (SHmax or σHmax or σ2): Determining the magnitude of SHmax is more challenging than Sv or Shmin and is a subject of many investigations. Its orientation, however, is reliably inferred from drilling-induced tensile fractures (DIFs) and borehole breakouts observed in image logs.
- ✓
- Orientation: The azimuth of SHmax is consistently NNE-SSW across the region [12,32]. Specific measurements include ~N35°E from well 58-32 DIFs [33], N10°E to N40°E from well 16A(78)-32 DIFs [33], and an average azimuth of 219° (N39E) from natural fractures and 206° (N26E) from DIFs in well 58-32 [7].
- ✓
- Gradients/Magnitudes:
- Initial G-function analyses suggested 0.68–0.82 psi/ft, with 0.77 psi/ft as the most likely value [12].
- Laboratory experiments simulating reservoir conditions for the maximum principal stress (σ1) at the nominal 2350 m (TVD) site are approximately 63.4 MPa, corresponding to a gradient of 27.0 MPa/km. This estimated stress magnitude was utilized in triaxial direct shear (TDS) experiments conducted on cores retrieved from Utah FORGE wells, notably 16A(78)-32 and 58-32, to quantify rock behavior under in situ conditions [28,29,30,31,32,33,34,35].
- Numerical modeling for well 16A(78)-32 indicated gradients of 0.0218 MPa/m, equivalent to 21.8 kPa/m [36,37] or 0.0199 MPa/m (0.88 psi/ft) [38].
- The breakout analysis in well 16A(78)-32 yielded SHmax gradients ranging from 0.84 to 1.39 psi/ft, heavily dependent on the assumed compressive strength of the granite and whether principal stress rotation occurred [27,39].
- The characterization of the maximum horizontal principal stress (σHmax) in the highly deviated well 16A(78)-32 relied upon the analysis of drilling-induced tensile fractures (DIFs) derived from borehole image logs, utilizing two distinct geomechanical methodologies. Method 1 employed a simplified, direct approach where the governing equation for tensile failure (based on DIFs) was solved, treating the σHmax magnitude as the sole unknown parameter [40]. This technique required the pre-determination of all the other parameters, including the minimum horizontal stress (σhmin) magnitude and an assumed orientation for σHmax (e.g., N25°E). The dependence on a single equation led to scattered results, with inferred σHmax gradients ranging from 0.88 to 1.37 psi/ft, a variability which suggested the potential existence of a strike–slip faulting regime in the deeper formations [40]. In contrast, Method 2 implemented a more rigorous, advanced stress inversion technique that simultaneously constrained three unknown parameters: the magnitude of σHmax, the orientation (azimuth) of σHmax, and the fracture trace angle (ω). By solving three non-linear equations concurrently, Method 2 overcame the input uncertainties inherent in the single-parameter method. This inversion approach provided a more consistent and constrained σHmax estimate of 0.87–1.06 psi/ft, reinforcing an interpretation consistent with a normal to transitional normal–strike–slip faulting regime [40].
- The rigorous constraint of the maximum horizontal principal stress (σHmax) gradient range of 0.83–0.98 psi/ft was achieved by integrating borehole failure analyses from the vertical monitoring well, well 78B-32, with independent minimum horizontal stress (σhmin) measurements from injection tests in well 16A(78)-32. This methodology relied on anchoring the geomechanical model with established parameters, including the vertical stress gradient (σV) of 1.13 psi/ft and pore pressure gradient of 0.433 psi/ft, and importing the σhmin range of 0.71–0.75 psi/ft derived from DFITs in 16A(78)-32. The lower bound of σHmax (0.83 psi/ft) was primarily defined by analyzing drilling-induced tensile fractures (DIFs) observed in the well 78B-32 image logs, where the fracture mechanics approach determined the minimum σHmax required to induce these failures. Conversely, the upper bound (0.98 psi/ft) was constrained by reconciling the presence of borehole breakouts (compressive failures) with the DIFs. Because the intact rock compressive strength yielded unrealistically high σHmax values (up to 1.39 psi/ft), the constrained range of 0.83–0.98 psi/ft implicitly defined the effective compressive strength of the borehole rock, suggesting that failure occurred in weaker, pre-existing fracture zones, consistent with the expected normal faulting regime (σV ≥ σHmax ≥ σhmin) [26,27].
Principal Stress Rotation and Critical Angle Analysis
Principal Stress Rotation: The complex geomechanical analysis required for the Utah FORGE site, particularly in the highly deviated well 16A(78)-32, must fundamentally distinguish and integrate two distinct physical and operational realities: the non-vertical trajectory of the wellbore, which was engineered for practical field operations, and the geophysical possibility of a naturally rotated stress field inherent to the reservoir [39,40]. The wellbore trajectory was intentionally designed to deviate 65° from the vertical, extending laterally at an azimuth of ∼105°. This 65° angle was selected as it represented the approximate limit for moving conventional wireline tools into the well by gravity alone. Although specialized conveyance methods, such as wireline tractors (Petromac), and Thru-Bit logging technology were ultimately required for reliability at this angle, the inclination selection was a direct response to operational constraints, ensuring wireline access for critical log acquisition (e.g., FMI and sonic logs) necessary for reservoir characterization, fracture identification, and subsequent stress determination. Furthermore, the azimuth of ∼105° was chosen to be approximately perpendicular to the anticipated σHmax direction (NNE-SSW), aligning the wellbore along the minimum horizontal stress (σhmin) direction to promote the creation of multiple, borehole-transverse hydraulic fractures, optimizing the well for EGS development [39,40].
The second, independent factor is the geophysical phenomenon of principal stress rotation, where the true principal stress axes (σV, σHmax, and σhmin) may not be perfectly aligned with the customary vertical and horizontal directions. This potential rotation is acknowledged based on geological evidence, specifically the inferred block rotation of the Mineral Mountains, though the region is primarily characterized by Basin and Range extension. The rotation can occur either in the plane of the vertical stress (σV) and σhmin or in the plane of σV and σHmax, leading to principal stresses that are not strictly vertical and horizontal. This non-alignment necessitates a complex, multi-step stress transformation process, shifting the measured in situ principal stress state to the geographical coordinate system and then to the wellbore coordinates. For instance, in well 16A(78)-32, observed borehole breakouts exhibited an angle of 30° with respect to the top bottom line, an anomaly that could be caused either by a 10° deviation between the wellbore azimuth (N105°E) and the anticipated σhmin azimuth (N115°E), or by a 25° rotation of the principal stresses. The requirement to mathematically account for this potential rotation highlights the necessary analytical distinction between the drilling path geometry and the true reservoir stress orientation [39,40].
Critical Angle Analysis: Critical stress analysis has been employed to predict which natural fractures are most likely to reactivate or open first during hydraulic stimulation [7]. This involves evaluating the state of stress on existing fractures relative to their shear strength. Studies suggest that NE-SW striking fractures have the highest likelihood of re-opening first [7]. Critically stressed fractures are those that are stimulated at pore pressures between the hydrostatic level and the minimum principal stress [7]. The interaction of hydraulic fractures with pre-existing natural fractures is a complex process, where natural fractures can be destabilized or stabilized depending on their orientation and location relative to the main hydraulic fracture [23,41].
Poroelastic Effects: Observations from injection tests indicate a rate/volume dependency and phenomena such as “self-shadowing,” “back stress,” or “pseudo poroelasticity” [30,31]. These effects imply that the inferred closure stress can increase with pumping rate/volume and in later injection cycles [30,31]. This “back stress” is attributed to poroelasticity in the equivalent porous medium of the natural fracture network, where the dilation and slippage of natural fractures increase the local total stress in the injection region [30,31]. This highlights the significant role of natural fractures in modulating the geomechanical response of the reservoir during stimulation.
Fault Regime Implications and Regional Context
Fault Regime: The overwhelming evidence from stress analyses at Utah FORGE indicates that the in situ stress state is consistent with a normal faulting regime, where the vertical stress (Sv) is the maximum principal stress (Sv > SHmax > Shmin) [12,22,25]. This aligns with the regional extensional tectonics of the Basin and Range province [5,10,12]. However, some analyses, particularly from certain stress inversion methods or anelastic strain recovery (ASR) measurements, have suggested alternative possibilities. ASR is a core-based methodology utilized to measure the time-dependent recovered strain after core samples, typically granitoid material retrieved from well 16B(78)-32 at depths around 4865 ft (∼1483 m TVD), are extracted and relieved of in situ stress. By monitoring the non-isotropic relaxation of the recovered strain over approximately one month, the method aims to reconstruct the principal stresses experienced by the rock. The results from the ASR analysis suggested alternative possibilities:
Strike-Slip Faulting: Method 1 for SHmax estimation in well 16A(78)-32 yielded scattered results (0.88–1.37 psi/ft), suggesting potential strike–slip faulting in deeper formations [40].
Reverse Faulting/Strike-Slip-Normal: ASR experiments on cores from well 16B indicated a stress regime that could be interpreted as reverse faulting (σ3 = 5940 psi, σ2 = 6820 psi) or strike–slip–normal, with principal stresses slightly off-vertical [27]. These variations might reflect local heterogeneities, transitional regimes, or the challenges in interpreting data from complex environments.
Regional Context: The Utah FORGE site is situated on the eastern side of a broad, asymmetric rift basin within the southeast part of the Basin and Range province [5,15]. This region is characterized by ongoing east–west extension, crustal thinning, and localized bimodal volcanism [5,12]. The adjacent Roosevelt Hot Springs hydrothermal system, which contributes to the regional understanding of geothermal activity, also lies within this extensional setting. Geophysical investigations indicate distinct pressure regimes separated by the Opal Mound fault and a low-velocity zone beneath the western Mineral Mountains, suggesting higher basement temperatures and possibly partial melt in the upper crust [7,12]. These regional geological and structural features provide an overarching context for the local conditions observed at the FORGE site.
2.2. Geophysical Monitoring and Seismicity
Geophysical monitoring, particularly seismic monitoring, is a cornerstone of Enhanced Geothermal System (EGS) development at the Utah Frontier Observatory for Research in Geothermal Energy (FORGE) site. This comprehensive monitoring serves dual purposes: assessing seismic risk and characterizing reservoir development [42]. For seismic risk mitigation, the emphasis is placed on accurate magnitude and ground motion observations, managed through a traffic light system (TLS). Reservoir development monitoring prioritizes microseismic event detection and high-precision location to map and characterize the evolving fracture network [42]. The naturally low-permeability environment at Utah FORGE necessitates hydraulic stimulation to create and enhance fracture systems, making microseismic monitoring crucial for understanding the subsurface response [43,44,45].
2.2.1. Passive and Active Seismic Systems
A multi-scaled seismic monitoring approach has been implemented at Utah FORGE, incorporating diverse seismic network designs and advanced waveform processing techniques to enhance event detection and characterization [42,46].
Surface Monitoring Network
The surface monitoring network at Utah FORGE consists of both permanent and temporary deployments, designed to provide comprehensive coverage and varying levels of resolution [47]. The backbone of this network is the permanent local-scale seismic network operated by the University of Utah Seismograph Stations (UUSS), which includes seismometers and accelerometers located at the surface and in shallow “postholes” (30–40 m deep) [42,47]. A central shallow borehole station, UU. FORK, located directly above the geothermal reservoir, is particularly valuable for detecting seismic activity within the reservoir due to its effective noise reduction [42,47]. This permanent network, integrated into the Utah Regional Seismic Network, is authoritative for the seismic traffic light system, setting magnitude thresholds for induced seismic events to guide injection operations [42,47]. While primarily designed for reliable characterization of M > 1 seismic events, advanced full waveform techniques and calibrated relative locations enable it to provide microseismic event locations for circulation experiments, overcoming its reduced resolution compared to downhole systems.
Temporary deployments have augmented the permanent network, including a nodal array of 150 seismic sensors, which was deployed on the surface during the 2019 stimulation [10]. Another dense nodal geophone deployment in 2022 consisted of 13 patches, each with 16 nodes [48]. These dense arrays provide a mechanism to address specific research questions and temporarily increase focal sphere coverage, though they typically do not allow for real-time monitoring as processing occurs after instrument retrieval [42]. The advantage of deploying clusters of instruments in patches and burying them for noise reduction has been demonstrated [42].
Downhole Monitoring Systems
Downhole monitoring systems are crucial for detecting and accurately mapping low-magnitude microseismicity associated with fracture creation, stimulation, and growth in EGS reservoirs, offering superior signal-to-noise ratios and improved depth resolution compared to surface arrays [43,49]. Various instruments have been deployed in deep boreholes at Utah FORGE:
- ✓
- Geophone Strings: Multi-level geophone strings, typically three-component (3C) digital or analog, have been deployed in monitoring wells such as 56-32, 58-32, 78-32, and 78B-32 [50]. These provide high-precision seismic event catalogs and are considered the most sensitive systems for microseismic monitoring [42]. However, geophone strings face challenges with elevated temperatures, making their long-term operation difficult in the ~200 °C reservoir environment [43]. Their placement typically needs to be shallower than the injection intervals due to temperature limitations, which can impact location accuracy [51]. The use of downhole geophone strings for microseismic monitoring at the Utah FORGE site is fundamentally constrained by the high-temperature environment, thereby imposing significant limitations on both instrument longevity and location accuracy. While initial technological evaluations included tools with temperature ratings up to 195 °C and 225 °C, and analog receivers up to 260 °C [42,50], operational experience revealed that these digital geophone electronics struggled significantly when exposed to ambient borehole temperatures exceeding 180 °C, leading to tool shutdown when internal temperatures reached 160 °C. Critically, to ensure the reliability and longevity of EGS monitoring projects, the current operational policy at Utah FORGE now mandates limiting the temperature exposure for geophone deployment to 150 °C. This enforced temperature ceiling directly dictates the deployment geometry: geophone strings must be placed at the maximum allowable depths based on this temperature restriction, which typically results in the receivers being positioned substantially shallower than the deeper injection intervals (e.g., 1500 to 2000 ft above the 16A(78)-32 injection depths) [42,50]. This suboptimal source–receiver configuration, characterized by receivers being positioned high above the microseismic source area with near-vertical ray paths, severely compromises the azimuthal coverage and aperture of the array, consequently leading to very poor location accuracy, substantial errors in seismic locations, and high uncertainty, especially in the depth coordinate, despite the inherent advantage of lower noise floors compared to surface instruments [42,50].
- ✓
- Distributed Acoustic Sensing (DAS) Cables: Fiber optic cables, acting as Distributed Acoustic Sensors (DAS), have been permanently cemented behind the casing in wells like 78-32, 78B-32, and 16B(78)-32, covering significant lengths of the wellbore [52]. DAS systems measure strain or strain rate with high spatial resolution (e.g., 1 m spatial sampling; 10 m gauge length) and can survive extreme temperatures (up to 265 °C or 500 °C in some cases), making them attractive for long-term monitoring [53]. While DAS is generally less sensitive than 3C geophones and currently cannot directly calculate magnitudes, it provides dense spatial coverage, continuous real-time data, and is effective for event detection and location when integrated with other data [54].
- ✓
- Accelerometers: Accelerometers have been deployed in shallow wells like 68-32, often alongside geophones, to provide additional seismic monitoring data [10].
The deployment geometry of downhole sensors is designed to optimize detection sensitivity and location accuracy, particularly for mapping stimulated fracture volumes and guiding production well placement [43]. Comparisons between DAS and geophones at FORGE have validated DAS’s effectiveness for geothermal monitoring, revealing clearer patterns and greater detail in microseismic event evolution [42].
Active Seismic Surveys
Active seismic surveys complement passive monitoring by providing detailed subsurface structural and velocity information [55].
2.2.2. Microseismic Event Detection and Processing
The detection and processing of microseismic events are critical for understanding the subsurface response to EGS operations.
Detection Algorithms
A variety of detection algorithms have been employed by analysts evaluating Utah FORGE to compile comprehensive microseismic catalogs:
- ✓
- STA/LTA (Short-Term Average/Long-Term Average): This standard detector, sensitive to impulsive phase arrivals, is widely used for event detection in microseismic data [47]. It can be combined with energy-based characteristic functions for more emergent phase arrivals [47].
- ✓
- Subspace Detection Analysis: This method uses singular value decomposition (SVD) to decompose clusters of similar waveforms into basis vectors, which are then scanned against continuous data to find new events belonging to the same family [7,46]. This approach improves the completeness of earthquake catalogs, particularly for periods without additional seismic stations [46].
- ✓
- Matched-Filter Detector: Widely used to develop comprehensive earthquake catalogs by identifying small, previously undetected events (Mw < 0), matched filter detectors are applied to continuous data from borehole stations like FORK to enhance b-value estimations and characterize seismic activity duration [56].
- ✓
- Lassie Detector (pyrocko eco-system): This coherence-based detector exploits the coherence of full-waveform features across the monitoring network and performs well in the high-noise environments that are typical of injection experiments [47]. It combines STA/LTA and energy-based characteristic functions, with the first weighted higher due to generally lower SNRs for P arrivals [47].
- ✓
- Convolutional Neural Networks (CNN): Machine-learning-based approaches, particularly CNNs, are being developed for automatic, real-time event detection and arrival picking in continuous DAS recordings [57]. These networks can be trained on both registered microseismic events and synthetic data to best incorporate local conditions, demonstrating reliable picking of microseismic arrivals even in challenging wavefields [47,57].
Location Techniques
Accurate event location is paramount for mapping fracture networks. Challenges include velocity model biases, particularly from dipping basement boundaries, and reduced resolution from surface networks [47].
- ✓
- Preliminary Locations (Grid Search): Detectors like Lassie provide preliminary event locations through a migration approach using characteristic functions and coherence analysis on a pre-calculated spatiotemporal grid [47]. However, these locations have high uncertainties due to the tuning of the characteristic function for detection rather than precise location [47].
- ✓
- Relative Relocations: Techniques such as double-difference relocations or hierarchical-clustering-based relocations (e.g., GrowClust.jl) exploit common ray paths for closely located events to refine locations by minimizing differences in phase travel times [42,47]. This approach improves precision, especially when calibrating surface network results with high-quality downhole locations [47].
- ✓
- Source Scanning Algorithm: This algorithm considers a grid of candidate source locations, shifts traces by travel time, and stacks them across the array. The maximum stacked amplitude provides an estimate of the hypocenter location and time. This method leverages large numbers of receivers when the signal-to-noise ratio (SNR) is low and allows for the visualization of location uncertainty volumes [58].
- ✓
- Machine Learning-based Direct Location: Deep learning methods, such as those based on the DEtection TRansformer (DETR) network, are being developed to directly locate microseismic events in 3D using simultaneous recordings from both surface and borehole sensors [59]. This approach aims to leverage the strengths of both array types while mitigating their individual limitations [59].
An accurate velocity model is fundamental for microseismic monitoring, often built and calibrated using perforation shots and sonic logs [43]. Improvements can also be obtained through tomography with observed microseismic events [58].
Magnitude Calculation
Microseismic event magnitudes are crucial for assessing seismic risk and reservoir characterization.
- ✓
- Local Magnitude (ML) or Coda Magnitude (MC): These are commonly estimated for earthquakes detected by the local broadband seismic network [46].
- ✓
- Moment Magnitude (Mw): This is often determined for microseismic events, with values ranging from Mw −2.3 to +0.5 during stimulations [48]. The seismic moment (M0) is related to Mw and is also used in calculations [60].
- ✓
- Magnitude of Completeness (Mcomp): Establishing a baseline Mcomp is a requirement for the FORGE project [12,46]. With the local broadband and geophone arrays, the Mcomp for the FORGE area has been reduced to around 0.0, significantly lower than the regional network’s Mcomp of 1.5–1.7 [7,12]. This improvement allows for the detection of much smaller events, crucial for detailed reservoir monitoring [7].
DAS Limitation: A current weakness of DAS systems is their inability to directly calculate magnitude, necessitating magnitude estimations from other seismic monitoring instruments [42].
2.2.3. Induced Seismicity Trends
Understanding induced seismicity trends is vital for both operational safety and reservoir understanding.
The spatial distributions of microseismic events at Utah FORGE exhibit distinct spatial distributions, shedding Light on fracture network development and fluid pathways;
- ✓
- Clustering in Source Zones: Earthquakes proximal to the Utah FORGE site tend to cluster in three main areas: near an active quarry (anthropogenic) near the Milford airport (larger events), and in the Mineral Mountains (tectonic, sometimes influenced by the Blundell Power Plant) [7].
- ✓
- Relationship to Injection and Natural Fractures: During stimulations, microseismic events are primarily localized around the Stimulated Reservoir Volume (SRV) or fracture planes, such as the Stage 3 SRV [41]. However, some larger events can occur at the far edges of the seismic cloud, suggesting farther growth of hydraulic fractures or slip on pre-stressed zones [47]. Events during Stage 1 stimulation migrated upward close to the projected location of well 16B(78)-32 and then back along the 16A(78)-32 well course, interpreted as fluid movement along a natural fracture [9]. Stage 2 and 3 events tended to move away from the wellbore as stimulations progressed, with Stage 3 events following two distinct trends at their upper end, indicating the influence of pre-existing fracture zones [9]. The orientation of the circulation-induced seismic cloud aligns with the expected orientation of a hydraulic fracture [42].
- ✓
- Complex Fracture Networks: The microseismic signatures observed do not always suggest purely planar hydraulic fractures, but rather complex fracture networks interacting with natural weaknesses [61]. Source mechanisms indicate that natural fractures play a role in the stimulated rock volumes [49].
- ✓
- Aseismic Zones: Interestingly, the rock volumes corresponding to Stimulation Stages 1 (S1) and 2 (S2) show an aseismic response despite significant fluid flow, indicating that a lack of microseismic activity does not necessarily imply a lack of conductive stimulated fractures [47]. Conversely, the presence of microseismic activity may not always guarantee the presence of stimulated fractures that enable efficient fluid flow. For instance, a quiescence zone within the S3 stimulation area suggests an aseismic reinflation of a previously opened hydraulic fracture [42].
- ✓
- Decoupling of Seismicity and Conductive Flow in S3: Conversely, the S3 zone, which was mapped by a large-scale microseismic cloud during the 2022 stimulation, was seismically highly productive during the circulation stages C2–C4 [47]. However, the presence of this high seismic activity in S3 did not guarantee efficient fluid flow between the injection well (16A(78)-32) and the production well (16B(78)-32) [47]. The circulation tests showed that overall flow was relatively low despite the successful connection via the fracture network. The seismic response of the reservoir during circulation was unexpectedly high, with magnitudes up to M0.45 [47]. This suggests that due to the complexity and intermittent low conductivity of the fracture network within the granitoid rock, simply targeting the seismic cloud (as was performed when drilling 16B) does not guarantee an adequate connection. Numerical simulations further indicated the insufficient connectivity between the highly seismogenic S3 zone and the producer. The observation of a localized quiescent zone within the highly seismically active S3 stimulated rock volume (SRV) provides direct evidence for aseismic mechanical processes occurring within a macroscopically stimulated region. This specific observation reinforces the complexity of linking microseismicity to reservoir engineering metrics.
During circulation, rock volumes within the S3 zone that had exhibited high microseismicity during the initial stimulation treatments became seismically inactive. This specific “quiescence zone” is interpreted as the result of the aseismic reinflation of a previously opened hydraulic fracture. This zone is physically identifiable by the clear spatial separation between the microseismic activity observed during circulation and the original stimulation activity [47]. In maps of relocated microseismicity, this quiescent area appears as a region filled with white circles, representing the location of the previously opened, but now aseismically refilled, fracture. This phenomenon, while initially unexpected given the abundant seismicity nearby, adheres to mechanical principles where the reopening of an already established hydraulic fracture does not necessarily generate the new seismic slip events required for microseismic detection. The resulting microseismic events during circulation clustered predominantly at the far edges of the S3 seismic cloud, suggesting that fluid injection was propagating the fracture beyond the volume previously stimulated, or activating nearby critically stressed features (Segall and Lu, or Albright and Pearson models) rather than re-slipping the main fracture body.
Temporal Evolution
The temporal evolution of seismicity provides insights into reservoir dynamics and fluid–rock interactions.
- ✓
- During and After Pumping: Microseismic signals are recorded both during pumping and, commonly, immediately after pumping during shut-in, with some sporadic signals continuing for some period [61,62]. A significant portion (at least 75%) of the cumulative seismic moment induced during circulation experiments occurs after shut-in [47].
- ✓
- Delayed/Trailing Seismicity: Most circulation-induced events, particularly at the far margins of previously activated seismic clouds, are induced after shut-in, sometimes hours or even days later [41,47]. This delayed seismicity can be attributed to aseismic slip, pore pressure diffusion through a complex fracture network in tight granitoid rocks, or pore pressure redistributions. The delay reflects the time needed for fluid to refill the reservoir or percolate through it to reach critically stressed pre-existing fractures [47].
- ✓
- Reactivation of Clusters: Waveform-based clustering reveals that most clusters are exclusively active within either stimulation or circulation experiments, but some clusters show cross-experiment reactivations during or shortly after injections, particularly at the far edges of the stimulation S3 seismic cloud [41].
- ✓
- No Activity in C1: For the very first circulation stage C1 (the first of four circulation experiments (C1–C4) conducted in July 2023; C1 occurred after the production well (16B(78)-32) was drilled but before its casing was cemented), no induced microseismic activity in the magnitude range > −0.75 was observed, despite fluid injection [47]. This is attributed to low injection pressures and possibly the presence of already naturally fractured zones that accept fluid without significant shear displacement or seismicity [41].
Magnitude Distributions
The distribution of microseismic magnitudes offers further characterization of the induced events.
- ✓
- Low Magnitudes: Most events detected at Utah FORGE are of small magnitude, with many less than M 1.5, and specifically, for the 2019 stimulation, ranging from Mw −2.0 to −0.5 [50]. For the 2022 stimulations, magnitudes ranged from Mw −2.0 to 0.6, with a maximum magnitude of 0.52 recorded during Stage 3 [48].
- ✓
- b-value Estimation: Matched filter detectors are used to enhance catalogs and produce robust b-value estimations, which are valuable for site-specific seismic mitigation strategies [56]. The b-value is a valuable tool in characterizing the seismic regime, as a higher value indicates a greater proportion of small, low-magnitude events relative to large events, often suggesting greater stress heterogeneity. Conversely, a lower b-value may suggest a higher probability of larger, potentially damaging events. For Stage 1, a numerical model yielded a b-value of 2.4, which is close to the field data [63].
- ✓
- Stimulation Stage Differences: The surface network was not sensitive enough to detect much microseismic activity during Stimulation Stages S1 and S2, detecting only a few of the largest events, whereas most events detected occurred during Stage S3 [47]. This is consistent with downhole catalogs showing significantly fewer and smaller events for S1 and S2 compared to S3 [47].
2.2.4. Waveform Analysis and Advanced Processing
Advanced processing of seismic waveforms enhances the understanding of subsurface processes.
Spectral Analysis
Spectral analysis is used for characterizing noise and identifying signals in seismic data.
- ✓
- Frequency Range: Microseismic events typically have a recorded energy of between 3 kHz and 40 kHz [55]. The dominant frequency range recorded by the closest UUSS network stations (FORK, FSB1, FSB2, FSB3, and FOR2) is between 20 and 40 Hz [47]. Noise from well 16A activities during daylight hours is primarily observed in the 10–30 Hz band, with additional noise in the 50–70 Hz range and a persistent 2–10 Hz noise [56]. This higher-frequency, time-dependent noise is predominantly sourced from anthropogenic activities at the well pad, specifically attributed to pump truck noise associated with circulation or stimulation operations during daylight hours. Noise in the 10–30 Hz band, along with activity in the 50–70 Hz range, correlates directly with these operational activities [64].
- ✓
- Power Spectral Density (PSD): PSD analysis is used to characterize noise characteristics and identify frequency bands associated with operational activities [64].
- ✓
- Frequency Domain Detection: Frequency-domain-based algorithms are employed for detecting microseismicity using dense surface seismic arrays, although applying regional-scale methodologies to very local, small-magnitude events can be challenging due to operational noise [56].
Shear Wave Splitting Analysis
Shear wave splitting (SWS) analysis provides critical insights into rock anisotropy and fracture characteristics.
- ✓
- Anisotropic Properties: SWS of three-component borehole microseismic data reveals the anisotropic properties in both sedimentary and granite rocks at the Utah FORGE site [65].
- ✓
- Natural Fracture Density: Averaged Shear Splitting Rate (SSR) values indicate a higher natural fracture density in sedimentary rock (0.91% ± 0.06%) compared to granite rock (0.72% ± 0.09%). This implies that natural fractures play a significant role in fluid flow and mechanical response [65].
- ✓
- Time-lapse Monitoring: Records of micro-earthquakes induced by fracturing allow for the monitoring of Shear-Wave Splitting Rate (SSR) variations in a time-lapse manner, which can track changes in the fracture network over time [65].
Event Clustering and Similarity Analysis
Waveform-based event clustering helps to identify similar events, potential repeaters, and active features in the subsurface.
- ✓
- Waveform Similarity: The similarity of waveforms from microseismic events, as recorded by a seismometer, is a measure of their similarity in terms of location and mechanisms [47].
- ✓
- Clusty Toolbox: The open-source Python 3.11 toolbox Clusty is used for waveform-based event clustering, covering the entire workflow from preprocessing to cross-correlation calculation and clustering. Tuning parameters like frequency range, cross-correlation thresholds, and clustering parameters are crucial, considering local noise levels and network geometry [47].
- ✓
- Identifying Active Features: Low frequencies and lower thresholds are suitable for mapping active features in the subsurface, allowing for gradual waveform changes within a cluster as events migrate [47].
- ✓
- Cross-Experiment Reactivations: Clustering helps visualize interactions between stimulation and circulation experiments, identifying clusters active in both phases, often at the edges of the seismic cloud from prior stimulations. This points to the limited reactivation of multiple patches along pre-existing fractures [47].
Focal Mechanisms
Focal mechanism solutions provide insights into the type of deformation (e.g., tensile vs. shear slip) generating microseismic signals.
- ✓
- Shear Displacements: Detected microseismic signals are predominantly associated with shear displacements, interpreted as either heterogeneities along hydraulic fractures or the critical release of native shear stresses on natural fractures [49].
- ✓
- Tensile vs. Shear Stimulation: The analysis of microseismic records illustrates the geomechanical features of the reservoir rock mass response to stimulation, depicting contributions from both hydraulic fracturing (tensile opening) and shear stimulation mechanisms [41].
- ✓
- Normal Faulting Events: Preliminary studies on microseismic source mechanisms from the 2022 stimulations at FORGE show a dominance of strike–slip events, with some normal fault displacement events occurring deeper within the microseismic cloud [49].
2.2.5. Integrated Interpretation and Modeling
Integrated interpretation and modeling combine diverse datasets to build a holistic understanding of the EGS reservoir.
Integration with Hydraulic Data
Microseismic data ARE correlated with hydraulic parameters to understand fluid flow and fracture behavior.
- ✓
- Pressure–Seismicity Relationship: The onset of microseismicity often corresponds to zones experiencing pressure increases rather than fluid flow alone. Delayed seismicity can be diffusion dominated, reflecting pressure diffusion through the rock mass after shut-in [41]. The FORGE experiments demonstrate a clear decoupling of hydraulic transport and seismic response, confirming that pressure perturbation, not bulk fluid volume movement, is the primary driver of microseismicity [41]. The circulation and stimulation experiments provided compelling evidence that supports the decoupling of fluid transport and seismic energy release. Aseismic Fluid Flow (S1 and S2): During circulation tests (C1–C4), the rock volumes associated with Stimulation Stages 1 (S1) and 2 (S2) exhibited aseismic behavior despite absorbing approximately 70% (170 m3) of the injected fluid volume during C4. This phenomenon demonstrates that substantial, conductive fluid flow, likely through high-permeability, pre-existing natural fractures (DFN), does not necessarily result in detectable microseismicity. The inferred lack of seismicity in S1 and S2 is often attributed to unfavorable fracture orientation, the high cohesive strength of natural fractures, or pressures not exceeding the previous maximum stresses (Kaiser effect) [41]. Seismicity Linked to Pressure Increase (S3): Conversely, the majority of the microseismic events detected during the circulation tests (C2–C4) were concentrated within the stimulated rock volume (SRV) of Stage 3 (S3), which was the most seismically productive zone. Numerical simulations and field data analysis confirm that MEQ activity in S3 correlates predominantly with zones experiencing pressure increases. Numerical modeling suggests that the onset of microseismicity on the periphery of the S3 SRV requires a critical pore pressure increase (Δp) of roughly 2–3 MPa. This observation underscores that pressure perturbation, which reduces the effective normal stress and promotes shear slip, is the primary driver for seismicity in the tight granitoid rock, rather than the bulk volumetric flow [41,47]. Diffusion-Dominated Delayed Seismicity (Trailing Seismicity): The seismic response at FORGE was markedly dominated by events occurring after the pump was shut in (shut-in/trailing seismicity). At least 75% of the cumulative seismic moment induced during the circulation tests (C2–C4) occurred after the injection ceased. This pronounced delay, which included the maximum magnitude events (M ≤ 0.45), is highly characteristic of a diffusion-dominated process within the low-permeability granitoid reservoir. The delay reflects the time required for fluid pressure to percolate through the complex fracture network or rock mass, eventually reaching critically stressed pre-existing fractures at distal locations, leading to slip. This is also linked to aseismic slip and poroelastic coupling, where stress redistribution during shut-in can increase induced seismicity rates in distal locations [41,47].
- ✓
- Pumping Rate and Pressure: Microseismic event rates are observed in conjunction with pumping rates and surface/bottomhole pressures [41]. For instance, seismicity rates may drop during an intentional sudden shut-in during Stage 2 in 2022. After the pumping is resumed, it is difficult to discern if the degree of seismic activity returns to its original level.
- ✓
- Fracture Opening and Slip: Hydraulic stimulation can lead to shear slip and permeability enhancement in granite fractures. The availability of new volume for water to flow into, due to fracture opening, is a key factor, though it may not always be accompanied by seismicity [32].
Integration with Geomechanical Models
Microseismic data is crucial for constraining geomechanical models and understanding reservoir responses.
- ✓
- Discrete Fracture Network (DFN) Models: Microearthquake (MEQ) catalogs are used to create post-stimulation DFN models that potentially capture significant flow pathways [66]. Some DFN fractures are generated to match observed microseismic event locations, while others are stochastic [25]. These models help describe complex fracture patterns resulting from hydraulic fracturing in naturally fractured granites [60].
- ✓
- Numerical Simulations: Lattice-based codes like XSite, which implement synthetic rock mass (SRM) models using the Distinct Element Method (DEM) and lattice method, are used to simulate hydraulic stimulation and circulation tests [63]. These models can simulate microseismic events and compare them with field data to validate the created fracture network geometry and b-value [60].
- ✓
- Reservoir Characterization: Microseismicity is used to characterize fracture density, size distribution, and orientation, which are crucial for determining effective permeability and fluid flow pathways [67]. Numerical history matching, utilizing mapped microseismicity, evaluates the role of natural fractures and their virgin hydraulic conductivity and mechanical properties in constraining slippage, dilation, and hydraulic opening [32].
- ✓
- Mixed-Mode Stimulation: The strong correlation between seismic activity and SRV development suggests a mixed-mode stimulation mechanism involving both hydraulic fracture propagation and interaction with natural fractures, leading to their reactivation [41].
Integration with Fiber Optic Data
The integration of microseismic data with fiber optic distributed sensing (DAS, DSS, and DTS) provides a powerful, high-resolution approach to EGS monitoring.
- ✓
- Complementary Strengths: DAS and geophones have complementary strengths and weaknesses for microseismic monitoring; their integration helps overcome individual limitations [58]. DAS, with its high spatial resolution, can identify large strain changes as potential fracture intersections [68]. The integration can resolve the circular location ambiguities of DAS and decrease the depth uncertainty of surface arrays [58] because a single straight DAS fiber only measures the axial component of strain, which fails to provide the polarization information necessary to constrain the azimuthal angle of the source around the well, resulting in a ring-shaped uncertainty region in the horizontal plane. The large aperture of the surface geophone array is highly effective at constraining the event’s epicenter (horizontal location), thereby collapsing the circular uncertainty ring inherent to the DAS data and selecting the unique preferred location [58].
- ✓
- Strain Measurements (DAS/DSS): DAS measures strain or strain rate, which can be directly related to rock deformation and fracture opening/closing [69]. Low-frequency strain measurements can constrain fracture geometry [69]. During fluid circulation tests, fiber optic cables provide real-time, induced strain and temperature measurements with high spatial resolution and sensitivity [54]. Modeling simulates fluid circulation and computes fiber optic response by plotting strain rates along the producer over time, which can be compared to field measurements [54].
- ✓
- Temperature Measurements (DTS): Distributed Temperature Sensing (DTS) measures temperature along the fiber optic cable, which can indicate fracture intersections or fluid pathways [68].
- ✓
- Real-time Monitoring: The combination of DAS microseismic monitoring and strain sensing allows for the real-time observation of fracture networks, providing insights into fracture dynamics and connectivity [53]. This can revolutionize fracture monitoring by providing high temporal sampling snapshots of fracture evolution, supporting the optimization of stimulation strategies [70].
- ✓
- Fracture Imaging: DAS microseismic reflections can be used for high-resolution hydraulic fracture imaging, revealing internal structures within the granitoid bedrock and delineating hydraulic fractures induced by circulation tests [71]. These internal structures can be correlated with well log data and core analyses, potentially reflecting mineralogical changes and natural fractures [71].
2.3. Petrophysical Measurement Techniques and Data Acquisition
Utah FORGE, with its extensive dataset from numerous wells, core analyses, geophysical surveys, and injection tests, serves as a benchmark for advancing EGS [5]. The objective is to provide data for robust Earth, continuum, and Discrete Fracture Network (DFN) models, which are essential for predicting reservoir behavior, optimizing hydraulic stimulation, and mitigating risks [72].
2.3.1. Lithology and Mineralogy
The EGS reservoir at Utah FORGE is primarily hosted within crystalline basement rocks beneath an alluvial fan and basin fill strata. The intact basement rock is described as a hard, granitic formation [47].
- ✓
- Crystalline Basement (Granitoid, Rhyolite, Orthogneiss, Schist, and Quartzite): The basement is broadly categorized into four groups: (1) sheared rhyolite; (2) sheared granitoid; (3) granitoid; and (4) interfingered metamorphic and granitoid rocks [5]. Igneous rock compositions within granitoid intervals range from granite to diorite, with changes occurring over variable length scales (<1 to >300 m) [5]. Below approximately 2300 m (TVD), metamorphic rocks are primarily orthogneisses, with minor marble, quartzite, and schist engulfed by granitoid. Metasedimentary rocks make up a small proportion (~10 to <100 m thick) of the reservoir rocks [5].
- ✓
- Mineral Composition: The typical mineralogy of this granitoid includes quartz, plagioclase, K-feldspar, biotite, titanite, and hornblende. Orthogneisses are mineralogically and compositionally similar to felsic granitoids [5]. The other minerals present are clinopyroxene, apatite, zircon, and magnetite–ilmenite [73]. The clay minerals, illite and chlorite, constitute <5% of the rock [74]. Diagnostic detection of orthogneiss can rely on sillimanite and garnet, though these occur in low abundances (<1 wt%) [5].
- ✓
- Secondary Mineralization: Secondary minerals, including clay minerals, Mg- and Fe-carbonates, minor epidote, actinolite, albite, quartz, trace anhydrite, and halite, are concentrated in fracture zones [5]. This open space filling and replacement reflects cooling over time [5]. Notably, an unusual carbonate rhomb and fine-grained quartz vein filling occurs sporadically in the basement interval. Secondary minerals can range from <1 to >90 wt% in concentration, correlating strongly with fracture subsets [5]. Impermeable features in core samples are interpreted as closely spaced, curviplanar mineralized fractures [17].
- ✓
- Geochemical Reactivity: Silica sand proppant is unsuitable for future stimulation activities due to dissolution at reservoir temperatures, with bauxite showing laboratory success [28]. The presence of secondary mineralization, particularly carbonates, implies a potential for dissolution/precipitation reactions under EGS operating conditions, contributing to scaling risks [17].
2.3.2. Thermal Properties
The Utah FORGE site is characterized by a high-temperature, thermally conductive regime, indicative of its EGS potential, contrasting with the convective heat transfer of the nearby Roosevelt Hot Springs [5,7,13].
- ✓
- Reservoir Temperature
At the depths drilled, target reservoir temperatures are generally greater than 175 °C [47]. The specific well measurements at FORGE include the following:
- ✓
- Well 58-32: Wireline logs recorded a maximum temperature of 197 °C (387 °F) at a bottomhole measured depth of 2296 m (7536 ft), while subsequent analyses accounting for thermal equilibrium determined a static formation temperature of 199 °C (390 °F) at total depth. Regarding the modeling bound definition, while the top of the reservoir (175 °C isotherm) was measured at 1990 m relative to the Kelly bushing, this boundary is reported as 1983 m (6507 ft) when corrected to Ground Level (GL) [7,10,12,67].
- ✓
- Well 16A(78)-32: The interpreted static shows a formation temperature of 220 °C (428 °F) at a true vertical depth (TVD) of approximately 8560 ft (10,987 ft measured depth. The direct wireline measurement (log data) shows a maximum temperature of 219 °C (426 °F) at a measured depth of 3274 m (10,741 ft); this value represents a specific data point captured by the logging tool at that depth, likely prior to full thermal equilibration or at a depth slightly shallower than the total depth. For the purpose of numerical simulations and general reservoir characterization, the bottomhole temperature is frequently rounded up or estimated to be on the order of 230 °C (446 °F). This value is often adopted in models to represent the thermal regime of the deep granitic reservoir or the “near-toe” conditions for heat extraction simulations. Early preliminary measurements also indicated temperatures at the toe would exceed 228 °C (442 °F) [9,32,51,61].
- ✓
- Well 56-32 and Well 78B-32: The interpreted estimate shows that the temperature profiles for these deep monitoring wells are consistent with the field-wide thermal gradient of approximately 70 °C/km, with the static bottomhole temperatures estimated between 215 °C and 225 °C depending on total vertical depth [7,71,73,75,76].
- ✓
- Thermal Gradients
Wells drilled into the basement rocks at Utah FORGE display linear temperature gradients, averaging 70 °C/km [5,7,13,16,73]. This gradient closely matched the predicted FORGE reservoir gradient [16]. The temperatures in the model region are predicted to range between 60 °C and 250 °C [6]. The gradient in well 58-32 specifically varied between 60° and 90 °C/km depending on bedrock thermal conductivity [7].
- ✓
- Thermal Conductivity
The matrix thermal conductivity for this granitoid is reported as 4.0 W/m-K. For the grain material, a thermal conductivity of 3.15 W/m K has been used in modeling [6]. Cuttings analysis, however, yields 2.0 W m−1 K−1 for sedimentary materials [6]. The measured thermal conductivity values for the granitoid rock in well 58-32 ranged from 2.0 W/m°C in quartz-poor dioritic rock to 3.9 W/m°C in more quartz-rich granite, measured at room temperature [7]. The overall range of thermal conductivity has also been reported to range from 2.27 to 3.58 W/m K [35]. Thermal conductivity is largely controlled by the quartz content of the rock, with higher quartz content correlating with higher thermal conductivity [7]. It also decreases with increasing temperature, necessitating a 10–15% reduction from room temperature measurements for reservoir conditions [7].
- ✓
- Thermal Diffusivity
The thermal diffusivity was found to be 9.71 × 10⁻⁷ m2/s for the reservoir rock [77]. Laboratory core tests indicate 1.4 × 10⁻⁶ m2/s (0.00218 in2/s) [35].
- ✓
- Specific Heat Capacity
Mass-Based Specific Heat Capacity (J/kg K or J/kg °C)
The variability in reported mass-based specific heat values stems from whether they represent direct laboratory measurements, average matrix properties, or input parameters for large-scale numerical simulations:
- ✓
- Laboratory-Derived Values: Direct measurements on selected cuttings and core samples retrieved from well 58-32 demonstrated specific heats, ranging between 0.7 and 1.0 kJ/kg. °C (700 to 1000 J/kg. °C) [7]. This value range is substantiated as being site-specific by the fact that the measurements were performed on FORGE rock samples (granitoid) and were shown to typically increase with temperature across the reservoir temperature range (25 °C to 200 °C).
- ✓
- Reference Matrix Values: A commonly cited reference value for the granitoid matrix in constitutive and native state models is approximately 790 J/kg. °K (~8.0 × 10² J kg−1 K−1). This value is based on cuttings analysis, the literature reports, and subsequent model calibration for the FORGE granitoid material [6].
- ✓
- Numerical Modeling Inputs: The value of 2063 J/kg. °K is specifically cited in numerical modeling validation exercises as a property value for the FORGE granitoid rock grain density used within the FALCON code to simulate the thermal, hydraulic, and mechanical behavior of the geothermal reservoir [67]. The value of 1200 J/kg. °K is another matrix heat capacity value utilized in specific fluid circulation simulations for Utah FORGE wells.
- ✓
- Total System Value: The total specific heat capacity calculated for stress analysis modeling in well 58-32, accounting for both formation (99%) and fluid (1%) components, was 830 J/(kg. °K), emphasizing the site-specific fluid–rock interaction [20].
- ✓
- Sedimentary Overburden: The value for the overlying sedimentary materials, 8.30 × 10² J Kg−1. °K−1 was used as an input parameter for the FORGE native state model [6].
Volumetric Specific Heat Capacity (kJ/m3 C or kJ/m3 K)
Volumetric heat capacity (ρCp) measures the amount of heat stored per unit volume of rock. The reported values reflect the calculated properties for the bulk reservoir volume, based on measured density and matrix specific heat.
- ✓
- Reservoir Calculation: The reported reservoir volumetric specific heat of 2517.5 kJ/m3⋅°C is a parameter used in volumetric heat-in-place calculations specifically for the FORGE EGS fracture network [75].
- ✓
- Simulation Inputs: The reported range of 1900–2200 kJ/m3 is consistent with calculations using the reference mass-based values and measured bulk density (ρ ≈ 2670 to 2750 kg/m3). For instance, one numerical simulation specifies the volumetric heat capacity of the rock (Cs) as 1950 kJ/K/m3 [19].
- ✓
- Thermal Expansion Coefficient
The thermal expansion coefficients () used for the initial steady-state (native state) modeling efforts at the FORGE site were explicitly defined based on lithology, drawing from the calibrated literature values.
Thermal Expansion Coefficients Used in Steady-State Modeling
The following specific, non-uniform, temperature-invariant thermal expansion coefficients for the two primary lithological units in the native state model were used:
- ✓
- Granitoid Reservoir Rock: . This value was applied to the low-permeability crystalline basement rock which hosts the EGS reservoir [6,67].
- ✓
- Sedimentary Overburden: . This lower value was assigned to the overlying basin fill sedimentary units [6].
These values were adopted from the literature for initial modeling.
Scientific Necessity for Temperature-Dependent Coefficients
The acknowledgment that temperature-dependent thermal expansion coefficients are critical for long-term operational modeling is a statement of crucial scientific and engineering necessity, driven by the profound role of thermoelastic coupling in the physics of EGS.
- Mechanism of Thermoelastic Coupling:
- ✓
- Thermal Contraction and Stress Alteration: During long-term fluid circulation, cold injection fluid (e.g., K or ) enters the high-temperature reservoir rock (up to ). This sustained cooling induces significant thermal contraction in the granitoid matrix. The contraction imposes substantial thermoelastic tensile stresses on the surrounding rock and fractures.
- ✓
- Fracture Dilation and Enhanced Conductivity: This thermally induced tensile stress reduces the effective normal stress acting across existing fractures, causing them to reopen and dilate. Simulations incorporating thermoelasticity for FORGE predict that cooling-induced stresses, potentially reaching thousands of psi, can lead to maximum fracture apertures exceeding 1.5 inches, dramatically increasing fracture conductivity and injectivity [54].
- ✓
- Dynamic Reservoir Evolution: The mechanical stability and geometry of the fracture network are therefore not static but are highly dynamic functions of the thermal field. Accurate, site-specific, temperature-dependent values are necessary because the magnitude of the resulting thermal stress is proportional to and the temperature change (). Implementing temperature-dependent coefficients allows models to accurately forecast critical phenomena such as sharply rising injectivity over the first few months of circulation and potential long-term fracture growth (both upward and downward) driven by thermoelastic effects [26,36].
In essence, using simple, static coefficients is appropriate only for initial steady-state assessments; accurate forecasting of the operational performance, longevity, and fracture evolution of the FORGE reservoir requires the precise quantification of the thermal sensitivity of the rock’s mechanical properties. While the reported temperatures vary between 197 °C and 240 °C, this variance is primarily driven by depth discrepancies between the vertical pilot well (58-32) and the deeper deviated injection wells, and earlier transient log temperatures (<210 °C) should be discarded for reservoir capacity estimation as they reflect drilling-induced cooling. The most robust parameter for the numerical modeling of the EGS doublet is the static reservoir temperature of 225–229 °C, which represents the thermally equilibrated state at the injection depth (~2.5 km TVD).
2.3.3. Hydraulic Properties
The EGS reservoir at the Utah FORGE is characterized by very low natural porosity and permeability, making hydraulic stimulation essential for creating adequate fluid pathways [5,53,78]
Porosity
- ✓
- Matrix Porosity
Intact basement lithologies exhibit very low porosities, generally less than 0.5% [5,6,7,62,76,79]. Laboratory measurements on core samples confirm porosities of less than 0.5% [79]. The granite, quartz monzonite, and monzonite that are dominant within the plutonic rocks form a strong, low-porosity reservoir [12]. Values as low as 0.1% (0.001) are reported for matrix porosity in modeling parameters [80]. This low matrix porosity is characteristic of igneous systems without significant fracturing [62].
- ✓
- Fracture Porosity (Discrete Fracture Network—DFN):
In the Discrete Fracture Network (DFN) models used for the simulations at FORGE, fractures are typically assigned a porosity of 1 × 10⁻³ (0.1%), while other areas of the model are assigned a lower porosity of 1 × 10⁻⁴ (0.01%) [81]. The DFN is upscaled to provide continuum modelers with 3D properties such as fracture porosity [72]. The mean fracture porosity values, determined through calibration processes for DFNs, range from approximately 0.46% [79] to 0.66% [66]. Larger fractures are assumed to have larger mechanical and hydraulic apertures, contributing to fracture porosity. The mechanical aperture contributes to fracture porosity [72].
- ✓
- Depth Trend and Lithological Influence:
Sedimentary Cover: Overlying sedimentary units show a range of porosities from 25% to 10%, which generally decreases with increasing depth due to compaction [5,7]. Specifically, in the deep alluvial section of well 58-32, porosity decreases from around 15% to 11%, becoming much tighter at depths below 4300 feet where it remains relatively constant at 1% to 2% [7]. For basin-fill aquifers, a porosity of 1.2 × 10⁻¹ (12%) has been derived [6].
Crystalline Basement: Within the granitoid basement, the linear fracture intensity (P10), a measure of fracture density, decreases with depth [6,79]. This decrease in fracture intensity correlates with a corresponding drop in bulk porosity at the transition from monzodiorite to monzonite lithology, observed at approximately a 1300 m measured depth in well 58-32 [79]. Shallower basement depths show higher local porosity due to increased fracture intensity [79].
Upscaled Porosity: The upscaled porosity derived from DFN models serve as a fundamental physical property input required for continuum reservoir simulation efforts at the Utah FORGE site. The DFN explicitly models the three-dimensional geometry, orientation, and connectivity of natural fractures (NF) within the low-permeability crystalline host rock. Since continuum methods, utilizing finite difference or finite volume schemes, require continuous properties represented by a representative elementary volume (REV), the discrete fracture geometries must be volumetrically averaged or “upscaled” to yield bulk rock parameters like fracture porosity (ϕF), directional permeability, and the sigma factor. This methodology is exemplified by the well 58-32 Zone 2 DFN, a subset focused on the specific perforated and highly fractured interval in the pilot well, which provides the calibrated upscaled values necessary for local geomechanical and hydraulic simulation studies, ensuring that the model parameters align with the overall measured hydraulic response of the reservoir [72]. The porosity and density measurements constrain the composition and fluid storage capacity of the reservoir rock mass. The average bulk porosity for the granitoid reservoir, derived primarily from the well 58-32 neutron porosity log, was estimated to range between and at reservoir depths (below ft). This bulk value, however, contrasts sharply with the extremely low intrinsic matrix porosity () of the intact granitoid, which was measured from core samples to be typically less than . This significant difference implies that nearly all of the measurable storage capacity in the FORGE reservoir is attributable to the fracture porosity component () [5,6]. Correspondingly, numerical models assign the rock matrix an ultra-low porosity of typically (0.1%) or less. The rock grain density () for the granitoid is typically reported as 2630 kg/m3 or 2750 kg/m3, and the measured bulk density for the low-porosity granite matrix is around 2.67 g/cm3. These low-porosity and high-density values characterize the tight, thermally conductive granitoid that requires enhancement to function as an EGS reservoir.
Permeability
- ✓
- Matrix Permeability
The intact rock matrix at the Utah FORGE is characterized by very low permeabilities, generally ranging from nano-Darcy’s to a few tens of micro-Darcy’s.
- ✓
- The laboratory measurements on intact granite samples from well 16A(78)-32 indicate permeabilities of less than or equal to 0.0001 mD, and even less than 10 nD for the rock matrix [34].
- ✓
- Earlier permeability measurements on well 58-32 cores suggested a maximum matrix permeability of 0.022 mD, which is two orders of magnitude higher than more recent findings [34].
- ✓
- For simulation purposes, various matrix permeability values have been used:
- ✓
- A model-derived permeability for granitoid is 1.15 × 10⁻¹⁸ m2 [67].
- ✓
- In a base case simulation, the matrix permeability was assumed to be 1 × 10⁻¹⁸ m2 [8].
- ✓
- A general “system permeability” of one microdarcy (approximately 1 × 10⁻¹⁸ m2) is considered reasonable.
- ✓
- Field observations and DFITs in well 58-32 indicate effective reservoir permeabilities typically less than 30 microdarcies (approximately 3 × 10⁻¹⁷ m2) [12].
- ✓
- The average in situ permeability of the granitoid reservoir is estimated to be 4.7 × 10⁻¹⁷ m2 from well testing performed in Phase 2B [72]. Phase 2B was a critical stage within the multi-phase development initiative of the FORGE project, following Phase 1 (desktop studies) and preceding Phase 3 (site establishment and operations). During Phase 2B, extensive site characterization and down-selection activities were executed, primarily involving the drilling, completion, and testing of the deep vertical pilot well, well 58-32 (drilled to 2296 m or 7536 ft), specifically to obtain direct measurements of the temperature, rock type, stress, and intrinsic permeability of the underlying granitoid reservoir rock. The technical data gathered in Phase 2B, including the low permeability values derived from injection tests and core analysis in well 58-32 (suggesting values typically less than 30 microdarcies or ), ultimately confirmed the suitability of the Utah site for EGS development and established the first reference DFN and native state models [12,82].
- ✓
- Laboratory evaluations generally show granite permeability in the low micro-Darcy range, with some specific core samples ranging from 10 to 50 micro-Darcy under reservoir conditions [62,74]. Other measurements indicate 0.1 to 0.6 µD [35].
- ✓
- The overall low matrix permeability is a fundamental characteristic of the igneous system, necessary for the site to function as a conductive geothermal regime where active stimulation is required to create an effective natural fracture system [62].
- ✓
- A discrepancy exists between laboratory core measurements (ultra-low matrix permeability: 10−19 to 10−21 m2) and field-scale well tests (bulk permeability: 10−16 m2); this difference is consistent with the presence of a critically stressed natural fracture network that dominates flow at the field scale. For native state flow modeling, we recommend using the bulk value of 10−16 m2 (approx. 0.1 mD). However, for leak-off calculations during hydraulic fracturing simulations, the lower matrix permeability (<1 μD) is more appropriate to describe fluid loss into the rock blocks.
- ✓
- Fracture Permeability/Conductivity
Despite the presence of thousands of natural fractures, natural connectivity in the FORGE reservoir is generally insufficient for economic fluid flow, necessitating hydraulic stimulation [83,84,85,86].
- ✓
- Enhancement by Shearing
- ✓
- New fractures and subsequent shear stimulation can enhance permeability significantly. Initial shear fracturing can increase the fracture permeability by a factor of 104 or more, reaching magnitudes of at least 1 mD [34]. In some cases, a five-orders-of-magnitude (105) increase in permeability has been observed, which has sustained over time [28,34].
- ✓
- The subsequent shearing of existing fractures can further increase permeability by an order of magnitude [27].
- ✓
- For a high-temperature experiment (FS09), the bulk permeability increased from 1.2 mD at a 0.5 mm fracture displacement to 52.8 mD at a 2 mm cumulative displacement, a 44-factor increase [27].
- ✓
- The average aperture increase of ten times in sheared fractures implies a permeability increase of three orders of magnitude [87].
- ✓
- Laboratory tests on artificially sheared fractures showed that conductivity increased by approximately two orders of magnitude [88].
- ✓
- Hydraulic fracturing aims to generate sufficient surface area for heat exchange, with typical targets for production rates of approximately 50 L/s, creating hundreds of fractures per well [89].
- ✓
- Modeling Values
- ✓
- In Discrete Fracture Network (DFN) models, fractures are commonly assigned a permeability of 1 × 10⁻¹⁴ m2, while other (matrix) areas are assigned 1 × 10⁻¹⁶ m2 [81].
- ✓
- The DFN can be upscaled to provide continuum modelers with 3D properties such as the fracture porosity, directional permeability, and sigma factor [72].
- ✓
- The upscaled average directional fracture permeabilities in cell coordinate directions for the granitoid are 6.5 × 10⁻¹⁷ m2, 6.5 × 10⁻¹⁷ m2, and 7.0 × 10⁻¹⁷ m2 [6].
- ✓
- Hydraulic fracture permeability from GeoFrac-R3D results is assumed to be 1000 Darcy (approximately 9.87 × 10⁻¹⁰ m2), corresponding to a fracture aperture of about 3.4 mm based on the cubic law [78]. The estimated upscaled permeability at the production well was about 0.1 mD [78]. Fracture permeability is expected to be in the Darcy range for economic EGS [28].
- Modeled and Upscaled Permeability
The values, shown in Table 1, derived from numerical models, represent the anticipated conductivity of the engineered flow pathways necessary for achieving commercial-scale fluid circulation.
Table 1.
Modeled and upscaled permeability.
- Measured and Field-Inferred Permeability Values
The actual measured permeabilities, shown in Table 2, of the reservoir rock fall many orders of magnitude below the modeled fracture conductivity, validating the characterization of FORGE as a low-permeability EGS site requiring massive stimulation.
Table 2.
Measured and field-inferred permeability values.
Conductivity Definition: Fracture conductivity is calculated from the experimental data by multiplying permeability by the fracture aperture. The initial fracture conductivity is generally low due to high minimum horizontal stress.
- ✓
- Anisotropy
The granitoid materials forming the EGS reservoir are assigned a heterogeneous and anisotropic permeability field, which is derived from the reference DFN models developed for the site [6].
The calibrated anisotropic permeability values from various DFN models for the Utah FORGE site include the following:
- ✓
- kxx = 0.09–0.21 mD, kyy = 2.40–5.64 mD, kzz = 1.20–2.82 mD [41,86].
- ✓
- kxx = 0.11–0.22 mD, kyy = 3.00–5.88 mD, kzz = 1.50–2.94 mD [86].
- ✓
- kxx = 0.06–0.30 mD, kyy = 1.68–8.22 mD, kzz = 0.84–4.11 mD [86].
The anisotropy ratio has been observed to be 1:30:15 (kxx, kyy, kzz) in some models [86]. These anisotropic permeability directions are based on the well inclination and azimuth, not strictly the northeast direction [86].
Anisotropy is primarily correlated with the natural fracture directions, which include two dominant sets: a preferential direction just east of north, and a less developed east–west system.
However, the overall natural fracture anisotropy is speculated to be relatively small due to the presence of two essentially orthogonal fracture systems [62].
- ✓
- Stress Sensitivity
Permeability is significantly affected by the in situ stress state and the fluid pressure, undergoing dynamic changes in response to thermal–hydro–mechanical–chemical (THMC) coupling.
- ✓
- Fracture Closure and Opening
Increasing effective stress can lead to asperity compaction and breakage, resulting in fracture closure and a subsequent decrease in permeability [34,74]. Permeability decreases with increasing confining stress, becoming less stress-dependent at high confining pressures when most fissures are closed [74,88].
Conversely, fluid injection reduces the effective normal stress on pre-existing fractures, increasing their aperture and thus enhancing the overall hydraulic conductivity of the reservoir [36]. As pressure inside a fracture increases by thousands of psi, the fracture dilates, and its conductivity increases [54].
- ✓
- Shear Slip Effects
Shear slip induced by fluid injection is a primary mechanism for permeability enhancement [34]. However, subsequent shear slip may not yield the same magnitude of increase in permeability as the initial fracturing event, particularly at high temperatures, possibly due to smoothed fracture surfaces or compaction of soft filling materials [34].
New fractures can enhance permeability by four to five orders of magnitude, whereas the subsequent shearing of an existing fracture results in only an order of magnitude increase [28].
- ✓
- Thermal Effects
The cooling of the reservoir rock due to cold fluid injection can induce thermal stresses that further increase fracture width and injectivity, especially near the injection well [54].
However, during prolonged cooling, fracture permeability can experience a significant reduction by a factor of 102 [34].
Long-term circulation can lead to fracture extension due to cooling-induced thermal stresses, which might increase heat exchange surface area but also risks enhanced fluid loss [36].
- ✓
- Episodic Nature
The low modern permeabilities, despite evidence of paleo-permeability, suggest that fracturing and the subsequent sealing by mineral precipitation were episodic [5]. The permeability structure is likely maintained by episodic fracturing and seismicity [15].
2.3.4. Mechanical and Elastic Properties
Understanding the geomechanical properties and in situ stress state is paramount for designing effective hydraulic stimulation treatments and mitigating induced seismicity [61].
Density (Grain, Bulk)
- ✓
- Rock Grain Density: A value of 2.75 × 10³ kg m−3 (2750 kg/m3) for granitoid is reported from core–cuttings analysis and model calibration [6]. The density of granite and intermediate rock types typically ranges from 2.54 to 2.65 g/cm3 [7], while dioritic compositions generally show higher densities, ranging from 2.65 to 2.90 g/cm3 [7]. A “reduction density of 2.67 g/cm3” was also utilized to compute the Complete Bouguer Gravity Anomaly [7,18]. For sedimentary materials, the grain density derived from cuttings analysis and model calibration is 2.50 × 10³ kg m−3 (2500 kg/m3) [6]. An “average starting density” of 2.42 g/cm3 (2420 kg/m3) for alluvium is also reported [7].
- ✓
- Bulk Density: the Average bulk densities for granite are reported as being around 2.67 ± 0.08 g/cm3 and 2.62 ± 0.08 g/cm3 [6]. It is also noted that dioritic densities can approach 3.0 g/cm3 (3000 kg/m3), which slightly exceeds the upper bound of the general rock density range [7].
Vp, Vs, E, ν, G, and K
- ✓
- Young’s Modulus (E): At the FORGE site, static Young’s Modulus for granitoid exhibits a range of values. The specific values reported include 56.9 GPa [67], 45.9 GPa, and 54.54 GPa (7,910,000 psi) for the granite at the 3225 m measured depth in well 16A [26], 50 GPa [78], and 54.6 GPa [37]. The acoustic measurements of dynamic modulus show an axial modulus of 8.2 × 10⁶ psi, with values ranging from 7.3 × 10⁶ to 10.7 × 10⁶ psi at different orientations, indicating material anisotropy [27]. Overall, Young’s Modulus is generally stated to range from 55 to 62 GPa [35], with 55 GPa being a frequently used value in models [24,25].
- ✓
- Poisson’s Ratio (ν): Several values for Poisson’s ratio are reported. A drained Poisson’s ratio of 0.32 is explicitly given [67]. A value of 0.30 is cited for granitoid [6] and also for sedimentary materials [6], while 0.26 is also frequently used in models. Poisson’s ratio is broadly stated to range from 0.26 to 0.4 [35].
- ✓
- Shear Modulus (G): The Shear Modulus is reported as 2.116 × 10⁴ MPa [76].
- ✓
- Bulk Modulus (K): While the Bulk Modulus is not always explicitly given, a Bulk Modulus of 5.4 × 10¹⁰ Pa is provided for both matrix and fracture material in some models [80]. The Dynamic Bulk Modulus (KD) is calculated from dipole sonic data [7], and the Static Bulk Modulus (KS) is determined from triaxial tests on core samples [7]. The Drained Bulk Modulus (K) and Grain Bulk Modulus (Ks) are also measured in laboratory tests [74]. Instead, rock compressibility, equivalent to Bulk Compressibility (BC), is often utilized, where for E = 4.5 × 10¹⁰ Pa and ν = 0.25, the rock compressibility is 3.3 × 10⁻⁵ 1/MPa [72,79].
- ✓
- Vp (Compressional Wave Velocity) and Vs (Shear Wave Velocity): Dipole Shear Sonic Imager (DSSI): Logs are routinely acquired at the FORGE site, providing compressional (DTC) and shear (DTS) wave travel times for calculating dynamic elastic properties [6,90]. Sonic tools were used to detect natural fractures located 30 to 50 feet away from the wellbore by processing the full waveform of the sonic log to identify reflectors [91]. Monitoring also involves slow shear waves using sonic curves during imaging results. In terms of specific velocities in granite, the average values of Vp at 19,000 ft/s and Vs at 11,000 ft/s are derived from sonic logs [45]. Shear wave velocity (Vs) profiles derived from Distributed Acoustic Sensing (DAS) data and Spatial Autocorrelation (SPAC) methods indicate that the shear velocity of the granitic rock just below the sediment–bedrock interface varies from approximately 2.1 to 2.4 km/s [44]. Sonic velocity also generally tends to be higher in diorite compared to granitic rock types and increases with depth [7].
Biot’s α
A value of 0.60 is reported in the literature for granitoid materials and utilized in modeling [6]. It is also explicitly mentioned that for ultra-low prmeability granite, the Biot coefficient will be nearly zero and, after fracturing, this coefficient is expected to approach unity [35].
Unconfined Compressive Strength, Tensile Strength, Cohesion, Friction Angle, Fracture Toughness, and Shear Fracture Compressibility
- ✓
- Uniaxial Compressive Strength (UCS): Laboratory core tests from intact FORGE core samples indicate that Uniaxial Compressive Strength (UCS) ranges from 13,200 to 18,300 psi (91.01 to 126.17 MPa) [26], with these values being explicitly used in wellbore stress models for wells such as 78B-32 [26]. Other general estimates for UCS range broadly from 10,000 to 30,000 psi [91]. The granite rock is characterized as having high strength, although it may not be as strong as some quartzites or hard limestones [91].
- ✓
- Tensile Strength (T): For granite, the tensile strength is explicitly reported as 1605 psi (11.07 MPa) [26]. For schistose quartzite, a tensile strength of 10 MPa is given [68]. In the context of Discrete Fracture Networks (DFN), tensile strength can be zero for permeable frictional DFN models [84] or 2 MPa for models considering a stronger DFN [63,91].
- ✓
- Cohesion: For shear cohesion, values are reported to range from 1.0 to 6.0 MPa, with recent measurements indicating a narrower range of 2.5–3.5 MPa [35]. These ranges are derived from laboratory triaxial direct shear test data, with the updated values reflecting more recent analyses [35]. The other specific shear cohesion values reported for samples include an effective cohesion of 5.82 MPa for FS09 and 4.82 MPa for FS02 (FS09 and FS02 are specific cylindrical core samples prepared from subsurface material retrieved from the highly deviated injection well 16A(78)-32 at the Utah FORGE site), obtained from Mohr–Coulomb residual strength estimates of fractured specimens [28]. The intact cohesion for granite samples has been estimated to range from 7.4 to 8.1 MPa, with a friction angle of 32° to 48° [34]. For numerical models, a cohesion of 2 MPa is used for granitoid based on a Mohr–Coulomb frictional model [21]. In Discrete Fracture Network (DFN) models, cohesion for a “stronger DFN” is investigated at 10 MPa [63,84], while for “weak DFN” and natural fractures, cohesion is often assumed to be zero [84]. Faults are also assumed to have a cohesion of 0.05 MPa [87], and “Impermeable Cohesive DFN” can have a cohesion of 20 MPa in some scenarios [38,68].
- ✓
- Friction Angle: For the friction angle, prior measurements ranged from 23° to 38° (approximately 0.40 to 0.66 radians), with updated measurements showing a range of 29° to 41° (approximately 0.51 to 0.72 radians) [35]. Specific laboratory measurements on core samples provide friction angles of 32° and 48° [34], and a general range of 30° to 50° [38]. A friction angle of 36° is used in some models for the granitoid [21], while for Discrete Fracture Networks (DFN), a friction angle of 37° is commonly adopted [25,29,84]. Notably, a friction angle of 45° for natural fractures (NF) is consistently used in various models [37,92].
- ✓
- Fracture Toughness (KIC): The Mode-I fracture toughness (KIC) for reservoir rock is explicitly reported as 2.48 MPa.m0.5 [93]. The other values for granite in various models include 1.75 MPa.m1/2 [38], 3 MPa.m1/2 [84], and 2.6 MPa.m1/2 [9]. For schistose quartzite, fracture toughness is specifically given as 3 MPa.m1/2 [68].
- ✓
- Shear Fracture Compressibility: This is measured to be in the range of 0.025 to 0.032 1/MPa (equivalent to 25 to 32 1/GPa or 2.5 × 10⁻⁸ to 3.2 × 10⁻⁸ Pa−1) [28,35]. Experiments show that higher temperatures can lead to increased fracture compressibility, with the values observed reaching up to 4.6 × 10⁻⁸ Pa−1 (46 1/GPa) [28]. For context, the overall formation compressibility for the FORGE site is broadly bracketed between 1.0 × 10⁻⁸ and 2.5 × 10⁻⁸ 1/Pa [29] and specifically given as 5 × 10⁻¹¹ Pa−1 for the reservoir and 10 × 10−11 Pa−1 for the mechanically Stimulated Reservoir Volume (SRV) in some models [54].
Stress Regime (Sv, SHmax, Shmin, and Anisotropy)
The modern stress regime at the FORGE site is largely consistent with regional Basin and Range east–west extension, generally characterized as a normal faulting environment [5]. However, analyses also indicate the possibility of strike–slip faulting at deeper formations [39,40], and reverse faulting events have been observed from microseismicity interpretations from the Stage 3 stimulation [40], with some ASR results also suggesting a reverse faulting or strike–slip–normal regime [27].
- ✓
- Vertical Stress (Sv): A gradient of 1.13 psi/ft (25.56 MPa/km) is consistently reported, calculated by integrating the density log from the depth to the surface [12,22]. The other gradients include 0.02401 MPa/m [77] and 0.0256 MPa/m [94], with values like 0.025 MPa/m (1.10 ft/ft) also used. The vertical stress magnitude (Sv) is reported as 62.80 MPa (9108 psi) for a TVD of 8490 ft (2587.8 m) [84], and 64.11 MPa (9298.4 psi) at 8490 ft TVD [94], and 65.2 MPa in some simulations [19], while another value of 60.77 MPa (8800 psi) is also noted [24].
- ✓
- Minimum Horizontal Stress (Shmin): Gradients show some variability. The ranges of 0.58–0.63 psi/ft [12] and 0.74–0.78 psi/ft (16.7–17.6 kPa/m) are often cited as the best inference for Shmin [10]. Specific values include 0.73 psi/ft (16.51 MPa/km) [40,95], 0.65 psi/ft [31,96], and 0.71–0.75 psi/ft [26]. Other gradients from modeling and specific zones include 0.01403 MPa/m [77], 0.014 MPa/m (14 kPa/m) [69], 14 MPa/km [34], 0.017 MPa/m (0.75 psi/ft) [38,94], and 0.0165 MPa/m [36,93]. The magnitude of Shmin is reported as 43.99 MPa (6380.2 psi) [94,97], with estimates from DFITs at 2540 m (approx. 8333 ft) ranging from 40.8 to 43.1 MPa [47], and another simulation using 44.5 MPa [19].
- ✓
- Maximum Horizontal Stress (SHmax): Gradients are reported to range from 0.68 to 0.82 psi/ft [12], with a most likely value of 0.77 psi/ft [12]. Other gradients include 0.98 psi/ft (20.29 MPa/km) [95], 0.01467 MPa/m [77], 0.0189 MPa/m (0.84 psi/ft) [63,84], 0.0218 MPa/m [36,93], and 17.4 MPa/km [34]. Estimates from breakouts and drilling-induced fractures vary, with Method 1 yielding 0.88–1.37 psi/ft and Method 2 yielding a more reliable 0.87–1.06 psi/ft [40]. A constrained SHmax range of 0.83–0.98 psi/ft is also given [26], while the earlier estimates from breakouts ranged from 0.84 to 1.39 psi/ft depending on the rock strength assumptions [27,39]. The SHmax orientation consistently trends NNE-SSW, inferred from induced tensile fractures in image logs from multiple wells, confirming consistency across the region [5,10,12,30]. The magnitude of SHmax is reported as 48.80 MPa (7078 psi) [84], 49.49 MPa (7177.9 psi) [94], 50.7 MPa [19], 53 MPa [41], 53.2 MPa [78], and 64.11 MPa (9298.4 psi) [97].
- ✓
- Anisotropy: The sources indicate that the principal stress due to overburden can be rotated slightly away from vertical [27,39]. The discontinuous breakouts observed in wells (specifically 16A(78)-32 and 78B-32) suggest formation heterogeneity or in situ stress heterogeneity [39]. Evidence of stress anisotropy is also present in parameters like the minimum horizontal stress coefficient, which ranges from 0.22 to 0.64 Pa/Pa [35]. Moreover, the acoustic testing of granitoid cores indicates a strong anisotropy with approximately a 30% change in dynamic modulus with sensing direction [27].
- ✓
- Mechanical data at FORGE shows a consistent bias, whereby the dynamic moduli derived from acoustic logs are 10–20% higher than the static moduli measured on core samples. For hydraulic fracturing simulations, static properties are required to accurately predict fracture width and propagation pressure. A static Young’s Modulus (EE) of 50–55 GPa and a Poisson’s Ratio (ν) of 0.25 are believed to be reasonable values for the reservoir granite. Furthermore, the stress regime is consistently defined as normal faulting (σV > σHmax > σhmin), with a fracture gradient of approximately 0.75 psi/ft.
2.3.5. Hydraulic Fracturing
Hydraulic fracturing is the primary mechanism for establishing the necessary permeability and connectivity in the tight FORGE reservoir.
HF Geometry (Length, Height, Aperture, and Complexity)
- ✓
- Length and Height: Numerical simulations are extensively employed to predict fracture geometry and growth at the FORGE site. Models predict a fracture height of approximately ~235 m and fracture length of ~130 m for the base model with induced apertures greater than 0.2 mm, values which were achieved using a pumped volume of 600 barrels (95.4 m3) [84]. Other simulations for Stage 3, assuming microseismicity cloud as a basis, suggest a fracture height of ~300 m and fracture length of ~300 m. Increasing the pumping time from 20 to 40 min in GeoFrac-R3D simulations led to fracture lengths of 315 m and heights of 83 m [78]. The expectation of asymmetric height growth is consistent with modeling results, attributed to stress regimes and lithology. This can manifest as upward growth or combined upward and downward growth, influenced by stress gradients and gravity [36].
- ✓
- Aperture: Models use two definitions: mechanical aperture, contributing to fracture porosity, and hydraulic aperture, controlling permeability [72]. The information on mechanical apertures comes from FMI data. The initial hydraulic apertures of natural fractures in DFN models range from 50 to 190 µm [25,68]. More specifically, values from 50 to 100 µm are considered optimal for matching pressure histories [94]. Modeling suggests hydraulic fracture apertures are in the 0.2–3.0 mm range. Newly created hydraulic fractures in simulations show apertures greater than 0.2 mm defining the stimulated height [84]. The largest fracture apertures of hydraulically inflated fractures can reach 5 mm [21]. A permeability of 1000 Darcy theoretically corresponds to a ~3.4 mm fracture aperture based on the cubic law [78]. An assumed initial aperture for modeling thermal cooling is 0.18 mm, which increases to 0.21 mm due to injection. Aperture can increase due to shear displacement [28]. FMI and Stoneley wave analyses are actively used to estimate hydraulic fracture width and characterize fractures [72]. Fluid transport within the fracture network is governed by the cubic law, which relates the volumetric flow rate (q) to the pressure gradient (∇P) and the cube of the hydraulic aperture (w). This formulation inherently assumes that fluid flow remains within the laminar regime (low Reynolds number), neglecting inertial effects and the turbulence that may occur only in the immediate vicinity of the wellbore during high-rate injection.
- ✓
- Complexity: The complexity of the fracture network is a significant characteristic for FORGE reservoir characterization. Fiber optic data indicates complex fracture behavior, including observations of multiple fracture branches [54,68], non-uniform conductivity, and varying fracture stiffness [54]. The interaction with natural fractures is a key factor leading to a moderately complicated Stimulated Reservoir Volume (SRV) consisting of a hydraulic fracture (HF)/natural fracture (NF) network. Microseismic data during circulation suggests complex dynamics of opening, propagating, and closing hydraulic fractures. The fluid flow often occurs through existing fracture networks [36,93]. This complexity, including tortuosity and near-wellbore effects, requires higher pressure to achieve fluid flow [32,47]. Models explicitly represent Discrete Fracture Networks (DFNs) to capture these interactions.
Breakdown and Closure Pressure
- ✓
- Breakdown Pressure: The high strength of the granitic rock at FORGE initially led to the anticipation that breakdown would be difficult, which proved true in some cases, with one zone unable to be broken down even at 6500 psi (44.82 MPa) surface pressure [29,32]. The surface pressure was restricted to 6500 psi in that instance because it was a treatment down tubing with isolation between a packer and a retrievable bridge plug.
- ✓
- Closure Pressure (σc): This is a critical parameter, and its interpretation is complex. Specifically, flowback tests for Zone 2 yielded closure stress gradients of 14.3–14.9 MPa/km, or 14.7–15.4 MPa/km [29,30], which are substantially lower than the values of 17.2–21.5 MPa/km from the step rate and extended shut-in tests [29,30]. Diagnostic Fracture Injection Tests (DFITs) and G-function analysis are standard methods used to estimate closure stress. An alternative method using bottomhole temperature data and G-function analysis is also proposed, which can provide a clear signature of fracture closure and an unambiguous selection of the closure point [20,29].
Leak-off: The low matrix permeability of granite (1.16 µD) is a significant factor, anticipated to minimize fluid leak-off during fracture creation [67]. However, in naturally fractured reservoirs like FORGE, fluid leak-off is a critical consideration during stimulation. Field observations revealed that a fluid leak-off of around 30% was observed during Stage 1 and Stage 3 stimulation [36,37]. The interaction of hydraulic fractures with the Discrete Fracture Network (DFN) can lead to fluid leak-off. This leak-off into the DFN can dominate the reservoir response, especially with slick water treatments [63]. Additional natural fractures may be added in models to match leak-off volume, particularly for long injection times and rates [36,37]. Numerical simulations suggest that natural fracture networks significantly affect injection pressure performance due to fluid diversion into the DFN as localized leak-off and deformation [38].
Proppant Selection: At the FORGE site, proppant was not used in the initial small-scale hydraulic fracturing treatments in well 16A(78)-32 (Stages 1, 2, and 3), primarily to eliminate the risk of screening out due to anticipated tortuous connections between the wellbore and hydraulic fractures [61,98,99]. However, in the third stage of well 16A(78)-32, low concentrations of micro-proppants (<300 mesh, possibly 400 mesh) were pumped. This micro-proppant is a man-made material with a particle size distribution of 5 to 200 microns and a mean diameter of 25 microns [61]. The primary purpose of adding these micro-proppants was to serve as an indicator for demarcating the fracture network when the production well 16B(78)-32 was later drilled and intersected the stimulated zones, in addition to tracer analysis [32]. Interestingly, analyses of the pressure response indicated that the micro-proppant did not have any noticeable impact on hydraulic fracture propagation behavior [32].
Sand is generally considered unsuitable as a proppant for long-term use at FORGE due to dissolution at the high reservoir temperatures, as the silica would degrade [61,91]. Given the challenges, it is anticipated that proppants will likely be required in the future to ensure adequate fracture conductivity for economic Enhanced Geothermal Systems (EGS). High temperatures also significantly reduce the viscosity of fracturing fluids, leading to more severe proppant settling and the formation of small, propped fracture networks near the injection point [93]. To mitigate these issues, the use of relatively light and smaller proppants is recommended to maintain conductivity in naturally fractured reservoirs [93]. However, a smaller proppant size is counter to the need to create highly conductive fractures in EGS settings.
In later stimulation campaigns at FORGE, including subsequent stages in well 16A(78)-32 (April 2024 stimulations from Stage 3R to Stage 10) and stimulations in the production well 16B(78)-32, silica sand (100-mesh and 40/70-mesh) was used as the proppant [14]. Proppant concentrations of up to 1.5 ppg were used, following methodologies from unconventional oil and gas stimulations [14]. Some stages in 16A(78)-32, such as Stage 6A and Stage 7, experienced high surface treating pressures, preventing proppant placement. However, Stage 8 (16A) successfully placed over 1.08 million pounds of 100-mesh and 40/70-mesh proppant, and Stage 9 (16A) placed 730,632 pounds. An ultra-lightweight proppant (ULWP) (30/80-mesh) was also pumped in Stage 10 (16A) [14]. In the production well 16B(78)-32, proppant (100-mesh and 40/70-mesh silica sand) was placed in Stages 1 and 2, aiming to enhance connections with fractures from 16A. For the pilot well 58-32 drilled very early in the FORGE campaign, 200-mesh calcium carbonate was pumped during a Diagnostic Fracture Injection Test (DFIT) to slightly prop fractures and improve identification in image logs [12,100,101].
Natural Fracture (NF) Interaction: At the FORGE site, some analysts postulate that hydraulic fractures (HFs) show a strong tendency to preferentially propagate along or reactivate pre-existing natural fractures (NFs) [93]. This behavior is attributed to the high toughness of the intact granitic rock, which makes it difficult to create new fractures in virgin rock and thus favors the interaction with existing discontinuities [7,28]. This interaction is a critical factor in the development of the Stimulated Reservoir Volume (SRV) at FORGE.
The interaction between the induced hydraulic fractures and the pre-existing natural fractures creates a complex SRV, which is a recurring observation from both modeling and field data [93]. Microseismic data, image logs, and core analyses consistently reveal this complexity, showing evidence of multiple fracture branches, non-uniform conductivity, and the reactivation of natural fractures coupled with hydraulic fracture propagation [32,68]. Fluid flow often occurs through these complex networks of existing fractures, which can lead to tortuosity and near-wellbore complexities requiring higher pressures for fluid flow. This complexity, including varying fracture orientations and conductivities, affects fluid diversion and overall reservoir performance, influencing injectivity, thermal exchange, and microseismicity [41,86]. Distributed Acoustic Sensing (DAS) data further confirms these complex interaction patterns, showing fracture intersections that do not align with classical planar hydraulic fracture growth, but rather follow reactivated natural fracture pathways [68,97].
Natural fractures intersecting perforation tunnels at a favorable angle relative to the in situ stress directions can significantly enhance fracture initiation in hard rocks [24]. This principle guided the design of perforation intervals in wells like 16A(78)-32, where perforations were positioned to maximize the chance of encountering natural fractures and facilitate breakdown in the high-strength granitic reservoir [24]. Conversely, a lack of contact with natural fractures can increase breakdown pressure. Extensive Discrete Fracture Network (DFN) models are developed using FMI logs, outcrop data, and microseismic information to characterize these natural fractures, including their types, orientations, geometry, and conductivity. These models are crucial for simulating well stimulation, local stress evolution, flow pathway analysis, and predicting thermal breakthrough. Natural fractures have been observed to vary widely in spacing and orientation, with localized intervals of intense fracturing often occurring at lithologic contacts between granitoids and metamorphic rocks [5].
Coupled Geomechanical Models (Stress–Perm Evolution, Fracture Closure, and Induced Seismicity): Models are widely employed for simulating complex reservoir behavior at the FORGE site. These models account for the dynamic interactions between fluid flow, heat transfer, rock deformation, and chemical reactions, which are crucial for understanding the longevity and effectiveness of Enhanced Geothermal Systems (EGS).
- ✓
- Stress–Permeability Evolution: Shear slip significantly increases fracture permeability, with measured increases by a factor of 104 or more, reaching magnitudes of at least 1 mD, and this increase is sustained over time [34,55]. This enhancement is critical for achieving economic fluid circulation. Permeability changes are influenced by a combination of thermal, hydrological, mechanical, and chemical (THMC) processes, where each interacts with the system to collectively result in either the fracture opening or closure [34]. Cooling-induced thermal stress can indeed cause fracture extension during long-term operations [15]. This thermal stress, combined with mechanical loading, can lead to fracture conductivity degradation over time [88], but also has the potential to cause additional normal stress on adjacent fractures or to increase injectivity [47,54]. As more fluid is injected into the reservoir, greater “back stress” is applied against the hydraulic fracture, leading to higher closure stress [30,31]. Natural fracture networks are noted to enhance this poroelasticity effect [30,31].
- ✓
- Fracture Closure: Fracture closure stress is inferred from various injection and flowback tests [22]. Diagnostic Fracture Injection Tests (DFITs) are commonly conducted to assess closure stress and permeability. These tests involve injecting a small fluid volume and monitoring pressure decline after shut-in. Methods like G-function analysis are traditionally used to pick closure pressure. However, the presence of natural fractures and coupled processes can complicate pressure data interpretation. In one instance, closure stress was found to increase with pumping rate/volume, attributed to poroelastic effects and the dilation/slippage of natural fractures. A novel approach using bottomhole temperature data and G-function analysis is also proposed, offering a clearer and unambiguous signature of fracture closure [20].
- ✓
- Induced Seismicity: Microseismic activity is continuously monitored to map reservoir growth and manage seismic hazards [29,47]. The microseismic activity rates and magnitudes (<M0.45) during circulation experiments are similar to those observed during stimulations [47], which was unexpected for fluid flow through pre-stimulated rock volumes [47]. Microseismicity is predominantly induced after shut-in, sometimes hours or even days later [47]. This is attributed to the complex dynamics of opening, propagating, and closing hydraulic fractures in the absence of major conductive features [41,47]. Delayed seismicity can also be explained by aseismic slip and pore pressure diffusion, which is considered a dominant driver of instability for shear slip and microseismicity. Poroelastic coupling and the redistribution of pore pressure after shut-in can also lead to increased seismicity in distal reservoir locations [41,47].
- ✓
- The risk of induced seismicity at FORGE is considered low [12,62], with the immediate footprint being aseismic prior to development. Low-magnitude events are typically monitored with downhole geophone strings, while surface networks primarily characterize M > 1 events for traffic light systems [47]. The absence of microseismic activity does not always imply a lack of conductive stimulated fractures, and conversely, the presence of microseismic activity may not guarantee efficient fluid flow. The Kaiser effect, which postulates that seismicity only occurs when stress magnitudes exceed previous pressures, is sometimes violated, with microseismic events triggered at pressures lower than initial stimulation [41]. Aseismic behavior can occur during the reinflation of previously activated fracture networks. Stress shadow effects from hydraulic fractures can also influence the stability of natural fractures and induce or suppress seismicity [41]. In the tight granitoid rock at FORGE, fracture growth can continue for a limited time after shut-in due to low permeability [47].
2.3.6. Characterization Methods
A wide array of advanced techniques is employed for comprehensive characterization at the Utah FORGE, encompassing various scales from core analysis to regional geophysical surveys. These methods are crucial for understanding the subsurface, developing stimulation strategies, and monitoring reservoir evolution in this Enhanced Geothermal System (EGS) laboratory.
- ✓
- Coring and Drilling: The FORGE site has seen extensive drilling activity, with seven wells drilled since 2018, including two closely spaced, highly deviated wells (16A(78)-32 as injection, 16B(78)-32 as production) for stimulation and circulation testing [5]. The initial three wells (58-32, 68-32, 78-32) were vertical and used for characterization and seismic monitoring [5]. Subsequent vertical wells (56-32, 78B-32) are also primarily for seismic monitoring. Well 58-32, a pilot well, was drilled to 2293.6 m (7525 ft) MD, penetrating over 1200 m of granite for the characterization of temperature, rock type, permeability, and stress [20]. The drilling of the injection well 16A(78)-32, completed in January 2021, involved a 65° inclination angle from vertical to a total depth of 10,987 ft. The production well 16B(78)-32 was completed in June 2023, with its deviated leg specifically designed to intersect the stimulated fracture network created by injection into 16A(78)-32 (fracturing stages 1 through 3 in well 16A(78)-32 pumped in 202#). The drilling data from 16A(78)-32 has been the focus of research on drilling performance and improving efficiency [102,103,104,105]. This includes adapting physics-based, limiter-redesign drilling practices from the oil and gas industry and analyzing stuck pipe events using physics-based simulations and anomaly detection techniques [106,107]. Drill core intervals were obtained from wells like 58-32 (e.g., 2073–2076 m and 2268–2274 m MD) and 16B(78)-32 (e.g., 4865–4870 ft) for petrographic, mineralogical, and mechanical property analysis [5]. Cutting samples were also collected at regular intervals (e.g., 3 m or 10 ft spacing) and analyzed to validate geophysical log responses and for comprehensive mineralogical and petrographic characterization using X-ray diffraction (XRD) and scanning electron microscopy (SEM) techniques [5].
- ✓
- Wireline Logs: A comprehensive suite of geophysical wireline logs is routinely acquired in FORGE wells to characterize rock properties and subsurface conditions. For well 58-32, these include triple combo (density, porosity, and resistivity), Array Induction, Gamma Ray, FullBore Micro Imager (FMI), and Dipole Shear Sonic Imager (DSSI) [5,30]. The FMI logs are useful for identifying natural and drilling-induced fractures, and local stress directions, and estimating hydraulic fracture width. FMI and Ultrasonic Borehole Imager (UBI) logs are used in both vertical monitoring wells and deviated injection wells [40] to complement FMI logging. Spectral gamma ray logs have been run in well 16A, revealing anomalies that correlate with stimulation intervals, and are key to characterizing rock types [14]. Dipole Shear Sonic Imager (DSSI) logs are used to obtain compressional (DTC) and shear (DTS) wave travel times for calculating dynamic elastic properties [7]. Stoneley wave data, generated at low frequencies (below 500 Hz), are used in conjunction with FMI to investigate conductive fractures and estimate hydraulic fracture width beyond the borehole wall, essentially “pressure testing” fractures [8]. Distributed Acoustic Sensing (DAS) cables are permanently installed in boreholes (e.g., 78-32 to 3280 ft and 78B-32 to ~4000 ft, and 16B(78)-32 behind casing) to provide continuous seismic and strain monitoring with high spatial resolution [47,53,70]. However, temperature limitations on logging tools (e.g., 300–350 °F, with MWD tools commonly having a 275 °F limit) can restrict data acquisition in the high-temperature reservoir [61]. Recently, pulsed neutron surveys have been run in wells 16A(78)-32 and 16B(78)-32.
- ✓
- Laboratory Experiments: Extensive laboratory experiments are conducted on drill cuttings and core samples from FORGE wells to constrain geological and geomechanical models. These include petrographic analysis, X-ray diffraction (XRD), and scanning electron microscopy (SEM) to identify minerals, evaluate rock textures, and quantify mineral abundances [5]. Thermal conductivity, density, magnetic susceptibility, and spectral gamma ray measurements are performed on the cuttings and core [7]. Triaxial tests are used to determine rock strength, elastic properties, and permeability [55]. More specialized tests include friction–stability–permeability measurements and velocity stepping tests to examine permeability evolution. Laboratory experiments also constrain the Biot Coefficient and Skempton’s B coefficient. Anelastic Strain Recovery (ASR) tests on core from well 16B(78)-32 were performed to infer in situ stresses at depth [27]. Uniaxial Compressive Strength (UCS) and Brazilian (diametrical compression) testing are conducted on samples from well 16B(78)-32, sometimes using 3D Digital Image Correlation (3D-DIC) to monitor deformation [108].
- ✓
- Injection Tests: A scientific injection campaign was conducted at the FORGE site in 2017 and 2019 in well 58-32, including pump-in/shut-in, pump-in/flowback, and step rate tests [30,96,109]. These tests were performed in various zones (openhole and cased/perforated sections) isolated by packers and bridge plugs [19,38]. The primary objective is to interpret in situ stress, particularly minimum horizontal stress (Shmin), and reservoir permeability, as well as fracture closure stress [30,96,109]. Diagnostic Fracture Injection Tests (DFITs) are a key component of this, with pressure data used in G-function analysis to recover stress conditions. A novel technique, temperature-G function analysis, is also applied, utilizing significant temperature changes during injection to provide a clear signature of fracture closure [20,109]. Subsequent stimulations in well 16A(78)-32 (2022 and 2024) also involved DFITs and flowback tests.
2.4. Research Gaps
2.4.1. Geology Research Gaps
Accurate Characterization of Lithology Distribution
Determining the distribution of granitoid and orthogneiss at the deep basement levels is complicated by their mineralogical similarities and comparable geophysical log responses. The lack of macroscopic textures in drill cuttings further hinders their diagnostic detection. This makes lithology occurrences unpredictable and changes in igneous rock composition difficult to map over various length scales [5].
Resolution of Fine-Scale Geological Features
Features such as fracture zones, which are critical to EGS development, are too fine in scale to be reliably detected and characterized by drill cuttings collected at standard (e.g., 30 m) spacing [5].
Identification of Significant Faults and Fracture Zones for DFNs
Despite progress in identifying some features, a continuing challenge is the identification of all significant faults or fracture zones that can be explicitly added to Discrete Fracture Network (DFN) models as discrete features [110].
Explanation of Fracture Orientation and Intensity Differences
There is still difficulty in explaining why the interpreted fracture orientations and intensities varied significantly between the highly deviated injection well (16A(78)-32) and the vertical wells (58-32 and 56-32) used in the earlier DFN models. One hypothesis suggests reservoir compartmentalization by faults, but other explanations may exist [110].
Mapping Subsurface Fracture Density from Outcrops
While outcrop fracture density is considered a reasonable representation of the subsurface, the extent to which it precisely replicates subsurface fracture density remains a challenge to fully confirm. Also, in the subsurface, these fractures are largely healed and do not take in fluid before stimulation [110].
2.4.2. Petrophysics Research Gaps
Understanding and Predicting Fracture Connectivity and Permeability Evolution
The reservoir rocks, while fractured, inherently lack connectivity to support the natural flow of water [11,73], necessitating stimulation. However, even after stimulation, the fractured rock permeability is often still not enough to allow water to circulate between wells efficiently [78].
There is a lack of comprehensive and fully validated workflows addressing the coupled thermo–hydro–mechanical–chemical (THMC) processes that control the long-term evolution of fracture permeability. This includes understanding how sustained stress under hydrothermal conditions impacts fracture aperture through compression, shear failure, mineral dissolution, and precipitation [34].
A key question for EGS viability is the geometry, connectivity, permeability, and long-term performance of the engineered fracture network in hot, hard rock environments [53]. The precise role of natural fractures—whether they can be effectively exploited or if they pose problematic challenges for EGS development—remains an active area of investigation [35]. Predicting the combined effect of temperature, flow, mechanics, and chemistry on the forecasted effectiveness of fractures for heat extraction and power production is a significant data and modeling gap [35].
Flow Control and Conformance
Achieving mechanical or chemical control of fracture systems to ensure conformance (i.e., equal distribution of fluid flow through multiple fracture stages) is a significant challenge. This is especially difficult due to self-catalyzing effects, where cooled fractures can widen and preferentially take more fluid, leading to short-circuiting and reduced sweep efficiency [62]. There is a need for mechanical or chemical devices for controlling flow to ensure commercial success [62].
2.4.3. Seismic Research Gaps
Correlation of Microseismicity with Conductive Fractures
The presence of microseismic activity does not always guarantee the presence of stimulated fractures that can enable efficient fluid flow, and, conversely, the lack of microseismic activity does not imply the lack of stimulated (conductive) fractures. Poorly stimulated volumes may exist within zones mapped by large-scale microseismic clouds [47]. The microseismic rates and magnitudes observed during circulation experiments were similar to those during stimulations, which was unexpected for fluid flow through pre-stimulated rock volumes, indicating a gap in understandings of seismic response in such phases [47].
Microseismic activity is predominantly induced after shut-in, a phenomenon attributed to the complex dynamics of opening, propagating, and closing hydraulic fractures in the absence of major conductive features that allow substantial flow. While common in other geologic scenarios, this still highlights the need for better understandings of delayed seismicity and its relationship to effective fracture networks [47].
Resolution and Cost-Effectiveness of Seismic Monitoring
There is a reduced resolution of the permanent (surface/shallow borehole) seismic network compared to downhole geophone monitoring [47]. This poses a challenge for obtaining the detailed microseismic event locations necessary for detailed reservoir studies, particularly for events below M0. The trade-offs in the accuracy of event location for all microseismic data acquisition methods (surface arrays, downhole geophones, and DAS) remain a challenge, with DAS having circular ambiguities and surface arrays suffering from high noise [58].
The excessive costs associated with drilling deep monitoring wells and deploying temporary downhole geophone strings create a need for more cost-efficient monitoring setups that retain sufficient detection capabilities over the lifespan of EGS projects [47].
Seismic Imaging of Internal Reservoir Structures
The intricate internal structures within the basement (granitoid) remain a significant challenge to image, primarily due to data quality and low imaging resolution, especially when using surface-based seismic methods that are heavily affected by the strong granite–alluvium interface [71].
Confidence in the dipping angle of imaged reflectors is limited due to very restricted illumination from sources near the well end, and the migration aperture could be improved with more data input. More complete rock physics analyses are required to validate interpretations linking imaged reflectors to lithology/mineralogy changes [71].
Understanding Poroelastic Effects and Induced Seismicity Mechanisms
There is no dedicated study that uses bottomhole temperature data to infer closure stress from extended shut-in tests based on a physical hypothesis [20]. The physics of induced seismicity in hot dry rock remains poorly understood, with phenomena like the violation of the Kaiser effect during reinjection into previously stimulated volumes highlighting this gap [41]. Aseismic slip and pore pressure diffusion are likely explanations for delayed seismicity, but their complex interplay in tight granitoid requires further study [47].
Further analysis is needed to detect the potential changes associated with hydraulic fracturing from VSP/DAS data [70]. There is a need to further explore advanced denoising methods for passive seismic imaging to improve efficiency and reduce bias, as well as to conduct a sensitivity analysis of the velocity model to understand its impact on image quality [64].
3. Results
The FORGE project has yielded substantial scientific and engineering achievements in advancing EGS technology in high-temperature (175–230 °C) granitic basement rock. The key findings demonstrate the successful creation of hydraulic connectivity between deviated wells separated by 300 ft vertical spacing through tensile-dominated fracture networks. This connectivity was validated by sustained circulation tests achieving injection rates up to 15.0 bpm at reservoir depths of 2–3 km.
Advanced monitoring systems were extensively integrated, including DAS, DTS, and microseismic arrays. These systems provided real-time fracture propagation diagnostics with spatial resolution of approximately 1 m and temporal sampling up to 10 kHz. The project established a comprehensive data infrastructure, encompassing over 300 datasets totaling more than 133 TB, which supports reproducible research and machine learning applications.
Geomechanical analysis revealed minimum horizontal stress gradients of 0.74–0.78 psi/ft and fracture orientations predominantly aligned N-S to NNE-SSW, consistent with the direction of the maximum horizontal stress. Near-wellbore tortuosity effects were identified as contributors to the elevated treating pressures, reaching up to 10,000 psi.
Microseismic monitoring at Utah FORGE involved a multi-scaled approach, utilizing both surface and downhole systems, and enabled the detection of events ranging from Mw −2.3 to +0.5. The magnitude of completeness (Mcomp) for the FORGE area was reduced to around 0.0, significantly lower than regional networks, allowing for the detection of much smaller events crucial for detailed reservoir monitoring. Observations revealed that microseismic events primarily clustered within the Stimulated Reservoir Volume (SRV) but sometimes migrated to the far edges of the seismic cloud, suggesting broader hydraulic fracture growth or slip on pre-stressed zones. Complex fracture networks interacting with natural weaknesses were also identified through microseismic signatures. Delayed seismicity, often occurring hours or days after shut-in, was a notable temporal trend, attributed to aseismic slip, pore pressure diffusion, and poroelastic coupling. Interestingly, some rock volumes exhibited an aseismic response despite significant fluid flow, indicating that a lack of microseismic activity does not necessarily equate to a lack of conductive stimulated fractures.
In later, larger-scale stimulations (April 2024 campaign), silica sand (100-mesh and 40/70-mesh) was successfully placed in all but two stages, with Stage 8 in well 16A(78)-32 placing over 1.08 million pounds of proppant. These decisions were made in the context of a scientific project where sand was readily available, despite known issues with its dissolution at high reservoir temperatures. It is also possible that hydraulic fractures, possibly more so for slickwater, strongly tend to propagate along or reactivate pre-existing natural fractures due to the fracture toughness of the intact granitic rock.
Complementing this data infrastructure, we have developed and successfully deployed artificial intelligence-driven platforms to enhance immediate data accessibility. This includes an offline Small Language Model (SLM) pre-trained on Utah FORGE datasets, and a fully operational web-based platform for intelligent data categorization and rapid retrieval, which is currently accessible at https://forge.amramadan.com (1 October 2025). These tools are currently in use for facilitating reproducible research, while future work will focus on integrating real-time predictive capabilities.
4. Discussion
The achievements at Utah FORGE represent a significant step forward for Enhanced Geothermal Systems, addressing long-standing technical challenges that have limited commercial deployment, such as reservoir creation and sustainability, thermal breakthrough prevention (under evaluation currently), induced seismicity management, and the economic optimization of operations in high-temperature environments. The project’s success in establishing hydraulic connectivity in low-permeability crystalline formations at depths of 2–3 km, achieving sustained injection rates up to 20 bpm, quantitatively validates the technical feasibility of EGS.
The detailed geological and structural characterization of the FORGE site, including its normal faulting stress regime with maximum horizontal stress oriented NNE-SSW, has been crucial in understanding fracture development and guiding stimulation designs. The inherent low matrix permeability of the granitoid basement necessitates hydraulic stimulation to create conductive pathways, a core principle of EGS that has been effectively demonstrated.
The integration of advanced real-time monitoring technologies, particularly DAS, DTS, and microseismic arrays, provides unprecedented diagnostic capabilities for fracture propagation. This multi-sensor approach is vital for understanding the complex subsurface response to stimulation, offering superior signal-to-noise ratios and improved depth resolution compared to surface arrays. The observation of complex fracture networks interacting with natural weaknesses, rather than purely planar hydraulic fractures, underscores the importance of the existing geological fabric in EGS reservoir development. The propensity for hydraulic fractures to propagate along or reactivate natural fractures in high-strength granitoid rock is a critical insight for future stimulation strategies.
Comparative Value of Monitoring Technologies: A comparative assessment reveals distinct engineering values for each system. Surface seismic networks are indispensable for regulatory compliance (traffic light systems) and constraining epicentral locations but often suffer from depth uncertainty and surface noise. Downhole geophones provide the highest sensitivity for detecting low-magnitude microseismicity (M < 0); however, their engineering value at FORGE is operationally constrained by temperature limits (<150 °C), often necessitating shallower deployment that compromises azimuthal coverage1. Distributed Acoustic Sensing (DAS) offers the most significant operational advantage for deep EGS: it provides continuous, high-spatial-resolution (~1 m) strain data directly at reservoir temperatures (>200 °C), where electronics fail. Its primary limitation—azimuthal ambiguity—is best mitigated by integrating it with surface arrays, making the hybrid DAS–surface approach the recommended standard for future EGS real-time fracture diagnostics
The temporal evolution of seismicity, particularly delayed events occurring after shut-in, is a complex phenomenon attributed to aseismic slip, pore pressure diffusion, and poroelastic coupling. This highlights that fluid–rock interactions continue beyond active pumping, influencing reservoir dynamics and posing challenges for real-time risk mitigation. Furthermore, the observation of aseismic zones where fluid flow occurs without detectable microseismic activity, alongside instances where seismicity does not guarantee efficient flow, reveals the intricate relationship between hydraulic and seismic responses. This complexity necessitates advanced modeling and interpretation techniques to accurately characterize stimulated volumes and flow pathways.
The challenges encountered with proppant, such as the unsuitability of sand due to dissolution at high temperatures and the difficulties in placement due to reduced fluid viscosity, point to critical areas for material science innovation in EGS. While micro-proppant could serve as a tracer and silica sand was used for scientific purposes, optimizing proppant transport and its long-term integrity in high-temperature environments remains a key research priority for commercial viability. Similarly, the impact of near-wellbore tortuosity on elevated treating pressures emphasizes the need for optimized completion designs to ensure efficient and sustainable injections.
The project’s comprehensive data infrastructure and enabled third party development of AI-driven platforms for data accessibility and knowledge extraction significantly enhance the utility of the FORGE site as a research laboratory. These platforms will facilitate reproducible research and machine learning applications, accelerating the understanding and optimization of EGS.
Deviations from Prior EGS Paradigms: Data collected at Utah FORGE has fundamentally refined several prior assumptions regarding EGS development in crystalline basement:
- ✓
- Hybrid Fracture Propagation: Contrary to early EGS models that envisioned either pure shear stimulation (hydroshearing) or simple planar tensile fractures, field data confirms a hybrid mechanism. Microseismic clouds and fiber optic strain data indicate that stimulation involves the tensile opening of new wings that concurrently reactivate and connect with the pre-existing natural fracture network, creating a complex, rather than planar, flow path.
- ✓
- Seismic–Hydraulic Decoupling: Prior studies often assumed microseismicity tracks the real-time fluid front. However, FORGE data reveals a distinct decoupling, where a significant portion of fracture growth and seismicity occurs after shut-in. This “trailing” seismicity indicates that pore–pressure diffusion continues to drive shear failure well after hydraulic energy input has ceased.
Finally, placing the Utah FORGE results in the context of the most recent theoretical and experimental advances in heat transfer is essential for future forecasting. New modeling frameworks by Heinze and Gunatilake [109] have demonstrated that fracture spacing is the single most critical parameter governing the sustainability of outflow temperatures in EGS, with denser networks significantly delaying thermal breakthrough compared to coarse networks. Their work links Nusselt, Reynolds, and Prandtl numbers to show that while flow rate drives advection, the geometric density of the network dictates the efficiency of the thermal sweep. Complementing these modeling insights, recent laboratory experiments on fractured granite by Liu et al. [110] have quantified the complex interplay between matrix conduction and fracture convection. Their data reveals a distinct ‘hindering effect’, where unconnected fractures can act as thermal barriers depending on their dip angle relative to the heat source, creating non-linear regional temperature gradients within the granite matrix. Fluid transport within the fracture network is governed by the cubic law, which relates the volumetric flow rate (q) to the pressure gradient (∇P) and the cube of the hydraulic aperture (w3). This formulation inherently assumes that fluid flow remains within the laminar regime (low Reynolds number, typically Re < 10), neglecting inertial effects. However, significant deviations arise in the immediate vicinity of the wellbore during high-rate injection, where Reynolds numbers can exceed critical thresholds (Re > 100). Recent studies by Liu et al. [110], and Heinze and Gunatilake [109] demonstrate that in these high-velocity regimes, inertial effects (Forchheimer flow) and turbulence become dominant; while this invalidates the linear pressure–flow relationship of the cubic law, it significantly enhances the convective heat transfer coefficient at the fracture–matrix interface
5. Conclusions
The Utah FORGE project has unequivocally demonstrated the technical feasibility of creating and sustaining engineered geothermal reservoirs in challenging, low-permeability crystalline rock formations, successfully establishing hydraulic connectivity between deviated wells through tensile-dominated fracture networks at significant depths. Operating within high-temperature environments of 175–230 °C, the project has provided critical insights into the operational parameters required for EGS development.
Significant scientific understanding has been advanced through comprehensive geological, geomechanical, and microseismic analyses. The project has illuminated the complex interplay between induced hydraulic fractures and pre-existing natural fracture networks, revealing that these interactions are fundamental to reservoir development and permeability enhancement. Insights into phenomena such as near-wellbore tortuosity, poroelastic effects, and delayed, post-shut-in seismicity have deepened our understanding of fluid–rock interactions in these unique environments.
Operational methodologies have been established and refined through the deployment of advanced real-time monitoring systems, including DAS, DTS, and microseismic arrays, which provide unprecedented diagnostics for fracture characterization. The creation of a robust data infrastructure and the development of AI-driven platforms represent a pioneering step towards enhanced data accessibility, knowledge extraction, and reproducible research in geothermal energy.
Broader Implications for Future EGS Deployment: Synthesizing the decade of operations at Utah FORGE reveals several critical lessons for global EGS development. (1) Seismic Management: Operators must account for the decoupling of hydraulic transport and seismic response, particularly the prevalence of delayed, post-shut-in seismicity driven by pore-pressure diffusion. (2) Material Durability: Standard completion materials transferred from unconventional oil and gas, such as silica sand, may be chemically unstable in >200 °C geothermal brines, underscoring the urgent need for high-temperature proppant innovation.
While validating technical feasibility, the FORGE project has also clarified the path to commercialization by identifying critical research priorities. These include the need for optimizing proppant transport and integrity in high-temperature conditions and developing more sophisticated coupled thermo-hydro–mechanical models for long-term reservoir performance prediction.
Looking forward, future research directions are clearly defined, focusing on high-temperature fracture mechanics, comprehensive THMC coupling, high-resolution subsurface imaging (especially with AI and joint inversion), real-time AI-based monitoring for adaptive management, improved predictive capabilities for induced seismicity, and integrated mitigation strategies.
Ultimately, the Utah FORGE initiative provides broader implications for the global energy landscape. By expanding geothermal energy extraction beyond conventional hydrothermal resources, it offers a baseload renewable energy source capable of continuous operation independent of weather conditions. The valuable insights gained from this field-scale laboratory are instrumental for the global development of Enhanced Geothermal Systems, positioning them as a significant and sustainable contributor to the future renewable energy portfolio.
Author Contributions
Conceptualization, A.R.; methodology, A.R.; software, M.A.G.; validation, A.R., M.A.G., and M.Y.S.; formal analysis, A.R.; investigation, A.R.; resources, M.Y.S. and J.M.; data curation, M.A.G.; writing—original draft preparation, A.R.; writing—review and editing, A.R., M.A.G., and J.M.; visualization, A.R. and J.M.; supervision, M.Y.S. and J.M.; and project administration, M.Y.S. All authors have read and agreed to the published version of the manuscript.
Funding
This research received no external funding.
Data Availability Statement
The datasets generated and analyzed during the current study are available in a publicly accessible repository. Specifically, the data are hosted in the Utah FORGE project repository maintained by the University of Utah Energy & Geoscience Institute. Complete data access and associated metadata are available at the Geothermal Data Repository (https://gdr.openei.org/forge, (1 October 2025)) and through the Utah FORGE initiative portal (https://forge.amramadan.com, (1 October 2025)). Where applicable, specific data subsets used for analyses and modeling are accessible via the Digital Object Identifiers (DOIs) cited within the manuscript. No additional datasets beyond those referenced were generated during the preparation of this review.
Conflicts of Interest
The authors declare no conflict of interest.
References
- US Department of Energy. Enhanced Geothermal Systems. Geothermal Technologies Office. Available online: https://www.energy.gov/eere/geothermal/enhanced-geothermal-systems (accessed on 10 April 2025).
- US Department of Energy. Enhanced Geothermal Systems Demonstration Projects. Geothermal Technologies Office. Available online: https://www.energy.gov/eere/geothermal/enhanced-geothermal-systems-demonstration-projects (accessed on 10 April 2025).
- Smith, M. Enhanced Geothermal Systems: Introduction and Issues for Congress; CRS Report No. R47256; Congressional Research Service: Washington, DC, USA, 2022.
- US Department of Energy. Department of Energy Selects University of Utah Site for $140 Million Geothermal Research and Development. 2018. Available online: https://www.energy.gov/articles/department-energy-selects-university-utah-site-140-million-geothermal-research-and (accessed on 10 April 2025).
- Jones, C.; Simmons, S.; Moore, J. Geology of the Utah Frontier Observatory for Research in Geothermal Energy (FORGE) Enhanced Geothermal System (EGS) site. Geothermics 2024, 122, 103054. [Google Scholar] [CrossRef] [Scilit]
- Podgorney, R.; Finnila, A.; Simmons, S.; McLennan, J. A Reference Thermal-Hydrologic-Mechanical Native State Model of the Utah FORGE Enhanced Geothermal Site. Energies 2021, 14, 4758. [Google Scholar] [CrossRef] [Scilit]
- Allis, R.; Moore, J.N. (Eds.) Geothermal characteristics of the Roosevelt Hot Springs System and Adjacent FORGE EGS Site, Milford, Utah; Utah Geological Survey & Energy & Geoscience Institute, University of Utah: Salt Lake City, UT, USA, 2019. [Google Scholar]
- Hornby, B.E. Hydraulic fracture width determination using integration of Stoneley wave “pressure testing” with electrical borehole scans in FORGE Geothermal project. In Proceedings of the Second International Meeting for Applied Geoscience & Energy Society of Exploration Geophysicists and American Association of Petroleum Geologists, Houston, TX, USA, 28 August–1 September 2022; pp. 262–266. [Google Scholar] [CrossRef] [Scilit]
- Moore, J.; McLennan, J.; Pankow, K.; Finnila, A.; Dyer, B.; Karvounis, D.; Bethmann, F.; Podgorney, R.; Rutledge, J.; Meir, P.; et al. Current Activities at the Utah Frontier Observatory for Research in Geothermal Energy (FORGE): A Laboratory for Characterizing Creating Sustaining Enhanced Geothermal Systems. In Proceedings of the 57th U.S. Rock Mechanics/Geomechanics Symposium, Atlanta, GA, USA, 25–28 June 2023. [Google Scholar] [CrossRef] [Scilit]
- Moore, J.; McLennan, J.; Pankow, K.; Simmons, S.; Podgorney, R.; Wannamaker, P.; Jones, C.; Rickard, W.; Xing, P. The Utah Frontier Observatory for Research in Geothermal Energy (FORGE): A laboratory for characterizing, creating and sustaining enhanced geothermal systems. In Proceedings of the 45th Workshop on Geothermal Reservoir Engineering (SGP-TR-216), Stanford, CA, USA, 10–12 February 2020; Stanford University: Stanford, CA, USA, 2020. [Google Scholar]
- Simmons, S.F.; Jones, C.; Rose, P.; Moore, J. The geochemistry of flowback and produced waters at Utah FORGE and their implications for EGS production. In Proceedings of the 50th Workshop on Geothermal Reservoir Engineering (SGP-TR-229), Stanford, CA, USA, 10–12 February 2025; Stanford University: Stanford, CA, USA, 2025. [Google Scholar]
- Moore, J.; McLennan, J.; Allis, R.; Pankow, K.; Simmons, S.; Podgorney, R.; Wannamaker, P.; Rickard, W. The Utah Frontier Observatory for Geothermal Research (FORGE): Results of Recent Drilling and Geoscientific Surveys. Geothermal Resources Council Transactions, Geothermal Resources Council. Geotherm. Resour. Counc. Trans. 2018, 42, pp. 1128–1143. Available online: https://www.geothermal-library.org/index.php?mode=pubs&action=view&record=1034044 (accessed on 10 January 2025).
- Simmons, S.; Jones, C.; Kirby, S.; Wannamaker, P.; Pankow, K.; Moore, J. The interplay of impermeable crystalline basement rocks, tectonic fracturing, and magmatic intrusion in the development of geothermal resources at Utah FORGE and Roosevelt Hot Springs. In Proceedings of the 49th Workshop on Geothermal Reservoir Engineering (SGP-TR-227), Stanford, CA, USA, 12–14 February 2024; Stanford University: Stanford, CA, USA, 2024. [Google Scholar]
- England, K.; Li, P.; Xing, P.; Moore, J.; McLennan, J. 2024 Enhanced Geothermal System Hydraulic Fracturing Campaign at Utah FORGE. In Proceedings of the SPE Hydraulic Fracturing Technology Conference and Exhibition, The Woodlands, TX, USA, 4–6 February 2025. [Google Scholar] [CrossRef] [Scilit]
- Simmons, S.F.; Allis, R.G.; Kirby, S.M.; Moore, J.N.; Fischer, T.P. Interpretation of hydrothermal conditions, production–injection induced effects, and evidence for enhanced geothermal system-type heat exchange in response to >30 years of production at Roosevelt Hot Springs, Utah, USA. Geosphere 2021, 17, 1997–2026. [Google Scholar] [CrossRef] [Scilit]
- Simmons, S.F.; Kirby, S.; Bartley, J.; Allis, R.; Kleber, E.; Knudsen, T.; Miller, J.; Hardwick, C.; Rahilly, K.; Fischer, T.; et al. Update on the geoscientific understanding of the Utah FORGE site. In Proceedings of the 44th Workshop on Geothermal Reservoir Engineering (SGP-TR-214), Stanford, CA, USA, 11–13 February 2019; Stanford University: Stanford, CA, USA, 2019. [Google Scholar]
- Jones, C.G.; Simmons, S.S.; Moore, J.N. Characterization of drill core from hydraulically stimulated crystalline rock following hydraulic fracturing at the Utah FORGE geothermal test site. In Proceedings of the 50th Workshop on Geothermal Reservoir Engineering (SGP-TR-229), Stanford, CA, USA, 10–12 February 2025; Stanford University: Stanford, CA, USA, 2025. [Google Scholar]
- Wannamaker, P.E.; Simmons, S.F.; Miller, J.J.; Hardwick, C.L.; Erickson, B.A.; Bowman, S.D.; Kirby, S.M.; Feigl, K.L.; Moore, J.N. Geophysical activities over the Utah FORGE site at the outset of Project Phase 3. In Proceedings of the 45th Workshop on Geothermal Reservoir Engineering (SGP-TR-216), Stanford, CA, USA, 10–12 February 2020; Stanford University: Stanford, CA, USA, 2020. [Google Scholar]
- Fei, F.; Wang, C.; Cusini, M.; Frash, L.P.; Kroll, K.A. Modeling of diagnostic fracture injection tests for in situ stress characterization of the Utah FORGE reservoir. In Proceedings of the 49th Workshop on Geothermal Reservoir Engineering (SGP-TR-227), Stanford, CA, USA, 12–14 February 2024; Stanford University: Stanford, CA, USA, 2024. [Google Scholar]
- Xing, P.; McLennan, J.; Moore, J. Minimum in-situ stress measurement using temperature signatures. Geothermics 2022, 98, 102282. [Google Scholar] [CrossRef] [Scilit]
- Finnila, A.; Podgorney, R. Exploring hydraulic fracture stimulation patterns in the FORGE reservoir using multiple stochastic DFN realizations and variable stress conditions. In Proceedings of the 45th Workshop on Geothermal Reservoir Engineering (SGP-TR-216), Stanford, CA, USA, 10–12 February 2020; Stanford University: Stanford, CA, USA, 2020. [Google Scholar]
- Moore, J.; McLennan, J.; Allis, R.; Pankow, K.; Simmons, S.; Podgorney, R.; Wannamaker, P.; Bartley, J.; Jones, C.; Rickard, W. The Utah Frontier Observatory for Research in Geothermal Energy (FORGE): An international laboratory for enhanced geothermal system technology development. In Proceedings of the 44th Workshop on Geothermal Reservoir Engineering (SGP-TR-214), Stanford, CA, USA, 11–13 February 2019; Stanford University: Stanford, CA, USA, 2019. [Google Scholar]
- Kamali, A.; Ghassemi, A.; McLennan, J.; Moore, J. Analysis of FORGE DFIT considering hydraulic and natural fracture interactions. In Proceedings of the 44th Workshop on Geothermal Reservoir Engineering (SGP-TR-214), Stanford, CA, USA, 11–13 February 2019; Stanford University: Stanford, CA, USA, 2019. [Google Scholar]
- Fu, W.; Damjanac, B.; Radakovic-Guzina, Z.; Podgorney, R.; McLennan, J. Modeling near-wellbore tortuosity at Utah FORGE site. In Proceedings of the 50th Workshop on Geothermal Reservoir Engineering (SGP-TR-229), Stanford, CA, USA, 10–12 February 2025; Stanford University: Stanford, CA, USA, 2025. [Google Scholar]
- Radakovic-Guzina, Z.; Damjanac, B.; Fu, W.; Finnila, A.; Podgorney, R.; McLennan, J. Coupled hydro-mechanical back-analysis of circulation program at FORGE in July of 2023. In Proceedings of the 49th Workshop on Geothermal Reservoir Engineering (SGP-TR-227), Stanford, CA, USA, 12–14 February 2024; Stanford University: Stanford, CA, USA, 2024. [Google Scholar]
- Ye, Z.; Fang, Y.; Ghassemi, A.; McLennan, J. APreliminary Wellbore In-Situ Stress Model for Utah FORGE. In Proceedings of the 56th U.S. Rock Mechanics/Geomechanics Symposium, Santa Fe, NM, USA, 26–29 June 2022. [Google Scholar] [CrossRef] [Scilit]
- Ingraham, M.D.; Ghassemi, A. Anelastic Strain Recovery as a Measure of in Situ Stresses at FORGE. In Proceedings of the 58th U.S. Rock Mechanics/Geomechanics Symposium, Golden, CO, USA, 23–26 June 2024. [Google Scholar] [CrossRef] [Scilit]
- Bijay, K.C.; Frash, L.P.; Iyare, U.C.; Li, W.; Madenova, Y.; Smith, M.; Kroll, K. High-temperature triaxial direct shear testing for Utah FORGE. In Proceedings of the 50th Workshop on Geothermal Reservoir Engineering (SGP-TR-229), Stanford, CA, USA, 10–12 February 2025; Stanford University: Stanford, CA, USA, 2025. [Google Scholar]
- Xing, P.; Damjanac, B.; Moore, J.; McLennan, J. Flowback test analyses at the Utah Frontier Observatory for Research in Geothermal Energy (FORGE) site. Rock Mech. Rock Eng. 2022, 55, 3023–3040. [Google Scholar] [CrossRef] [Scilit]
- Xing, P.; McLennan, J.; Moore, J. In-Situ Stress Measurements at the Utah Frontier Observatory for Research in Geothermal Energy (FORGE) Site. Energies 2020, 13, 5842. [Google Scholar] [CrossRef] [Scilit]
- Xing, P.; Winkler, D.; Rickard, B.; Barker, B.; Finnila, A.; Ghassemi, A.; Pankow, K.; Podgorney, R.; Moore, J.; McLennan, J. Interpretation of in-situ injection measurements at the FORGE site. In Proceedings of the 45th Workshop on Geothermal Reservoir Engineering (SGP-TR-216), Stanford, CA, USA, 10–12 February 2020; Stanford University: Stanford, CA, USA, 2020. [Google Scholar]
- McLennan, J.; England, K.; Rose, P.; Moore, J.; Barker, B. Stimulation of a High-Temperature Granitic Reservoir at the Utah FORGE Site. In Proceedings of the SPE Hydraulic Fracturing Technology Conference and Exhibition, The Woodlands, TX, USA, 31 January–2 February 2023. [Google Scholar] [CrossRef] [Scilit]
- Fercho, S.; Norbeck, J.; Dadi, S.; Matson, G.; Borell, J.; McConville, E.; Webb, S.; Bowie, C.; Rhodes, G. Update on the geology, temperature, fracturing, and resource potential at the Cape Geothermal Project informed by data acquired from the drilling of additional horizontal EGS wells. In Proceedings of the 50th Workshop on Geothermal Reservoir Engineering (SGP-TR-229), Stanford, CA, USA, 10–12 February 2025; Stanford University: Stanford, CA, USA, 2025. [Google Scholar]
- Iyare, U.C.; Frash, L.P.; KC, B.; Meng, M.; Kroll, K.; Smith, M.; Davila, G.; Li, W.; Madenova, Y.; Marina, O.; et al. Measurements of thermo-hydro-mechanical-chemical coupling in granite shear fractures at FORGE using the triaxial direct-shear test method. In Proceedings of the 49th Workshop on Geothermal Reservoir Engineering (SGP-TR-227), Stanford, CA, USA, 12–14 February 2024; Stanford University: Stanford, CA, USA, 2024. [Google Scholar]
- Frash, L.P.; Iyare, U.C.; KC, B.; Meng, M.; Smith, M.; Kroll, K. High Temperature Triaxial Direct-Shear Testing for FORGE and Field Scale Implications. In Proceedings of the 58th U.S. Rock Mechanics/Geomechanics Symposium, Golden, CO, USA, 23–26 June 2024. [Google Scholar] [CrossRef] [Scilit]
- Ghassemi, A.; Ratnayake, R. Hydraulic Fracturing in Geothermal Reservoirs: The Utah Forge EGS and Newberry Superhot Projects. In Proceedings of the SPE Hydraulic Fracturing Technology Conference and Exhibition, The Woodlands, TX, USA, 4–6 February 2025. [Google Scholar] [CrossRef] [Scilit]
- Kumar, D.; Ghassemi, A.; Liu, B. 3D Modeling and Analysis of Utah FORGE Reservoir Stimulation. In Proceedings of the SPE/AAPG/SEG Unconventional Resources Technology Conference, Denver, CO, USA, 17–19 June 2023. [Google Scholar] [CrossRef] [Scilit]
- Xing, P.; Damjanac, B.; Radakovic-Guzina, Z.; Finnila, A.; Podgorney, R.; Moore, J.; McLennan, J. Numerical simulation of injection tests at Utah FORGE site. In Proceedings of the 46th Workshop on Geothermal Reservoir Engineering (SGP-TR-218), Stanford, CA, USA, 16–18 February 2021; Stanford University: Stanford, CA, USA, 2021. [Google Scholar]
- Xing, P.; Wray, A.; Arteaga, E.I.V.; Finnila, A.; Moore, J.; Jones, C.; Borchardt, E.; McLennan, J. In-situ stresses and fractures inferred from image logs at Utah FORGE. In Proceedings of the 47th Workshop on Geothermal Reservoir Engineering (SGP-TR-223), Stanford, CA, USA, 7–9 February 2022; Stanford University: Stanford, CA, USA, 2022. [Google Scholar]
- Ye, Z.; Ghassemi, A. The updated wellbore stress models for Utah FORGE. In Proceedings of the 49th Workshop on Geothermal Reservoir Engineering (SGP-TR-227), Stanford, CA, USA, 12–14 February 2024; Stanford University: Stanford, CA, USA, 2024. [Google Scholar]
- Ghassemi, A.; Ye, Z.; Lee, S.H.; Ajo-Franklin, J. Fluid flow, rock deformation, and seismic response during Utah FORGE circulation tests. In Proceedings of the 50th Workshop on Geothermal Reservoir Engineering (SGP-TR-229), Stanford, CA, USA, 10–12 February 2025; Stanford University: Stanford, CA, USA, 2025. [Google Scholar]
- Pankow, K.; Dyer, B.; Rutledge, J.; Karvounis, D.; Niemz, P.; Whidden, K.; Meier, P.; Jaques, P.; Petersen, G.; Eaton, D.; et al. Lessons from Utah FORGE for seismic monitoring of engineered geothermal systems. In Proceedings of the 50th Workshop on Geothermal Reservoir Engineering (SGP-TR-229), Stanford, CA, USA, 10–12 February 2025; Stanford University: Stanford, CA, USA, 2025. [Google Scholar]
- Rutledge, J.; Dyer, B.; Bethmann, F.; Meier, P.; Pankow, K.; Wannamaker, P.; Moore, J. Downhole Microseismic Monitoring of Injection Stimulations at the Utah FORGE EGS Site. In Proceedings of the 56th U.S. Rock Mechanics/Geomechanics Symposium, Santa Fe, NM, USA, 26–29 June 2022. [Google Scholar] [CrossRef] [Scilit]
- Zhang, H.; Pankow, K.L. High-resolution Bayesian spatial autocorrelation (SPAC) quasi-3-D Vs model of Utah FORGE site with a dense geophone array. Geophys. J. Int. 2021, 225, 1605–1615. [Google Scholar] [CrossRef] [Scilit]
- Nadimi, S.; Forbes, B.; Finnila, A.; Podgorney, R.; Moore, J.; McLennan, J.D. Hydraulic Fracture/Shear Stimulation in an EGS Reservoir: Utah FORGE Program. In Proceedings of the 52nd U.S. Rock Mechanics/Geomechanics Symposium, Seattle, WA, USA, 17–20 June 2018. [Google Scholar]
- Pankow, K.L.; Potter, S.; Zhang, H.; Moore, J. Local seismic monitoring at the Milford, Utah FORGE site. GRC Trans. 2017, 41, 415–422. [Google Scholar]
- Niemz, P.; McLennan, J.; Pankow, K.L.; Rutledge, J.; England, K. Circulation experiments at Utah FORGE: Near-surface seismic monitoring reveals fracture growth after shut-in. Geothermics 2024, 119, 102947. [Google Scholar] [CrossRef] [Scilit]
- Whidden, K.M.; Petersen, G.; Pankow, K.L. Seismic monitoring of the 2022 Utah FORGE stimulation: The view from the surface. In Proceedings of the 48th Workshop on Geothermal Reservoir Engineering (SGP-TR-224), Stanford, CA, USA, 6–8 February 2023; Stanford University: Stanford, CA, USA, 2023. [Google Scholar]
- Rutledge, J.; Pankow, K.; Niemz, P.; Dyer, B.; Karvounis, D. Microseismic source mechanisms during a Utah FORGE injection stimulation. In Proceedings of the 50th Workshop on Geothermal Reservoir Engineering (SGP-TR-229), Stanford, CA, USA, 10–12 February 2025; Stanford University: Stanford, CA, USA, 2025. [Google Scholar]
- Pankow, K.; Mesimeri, M.; McLennan, J.; Wannamaker, P.; Moore, J. Seismic monitoring at the Utah Frontier Observatory for Research in Geothermal Energy. In Proceedings of the 45th Workshop on Geothermal Reservoir Engineering (SGP-TR-216), Stanford, CA, USA, 10–12 February 2020; Stanford University: Stanford, CA, USA, 2020. [Google Scholar]
- Bailey, J.R.; Ning, Y.D.; Bourdier, J.; Momoh, I.; Prasad, P. Application of Machine Learning to Create a Discrete Fracture Network Model for Utah FORGE Fracture Injections. In Proceedings of the SPE Hydraulic Fracturing Technology Conference and Exhibition, The Woodlands, TX, USA, 6–8 February 2024. [Google Scholar] [CrossRef] [Scilit]
- McLennan, J. Utah FORGE: Well 16A(78)-32 Stimulation Data (April, 2022); Geothermal Data Repository; Energy and Geoscience Institute at the University of Utah: Salt Lake City, UT, USA, 2022. [Google Scholar] [CrossRef]
- Ajo-Franklin, J.; Becker, M.; Chamraczuk, M.; Coleman, T.; Correa, J.; Freifeld, B.; Kim, J.; Ghassemi, A.; Ma, Y.; Maldaner, C.; et al. Distributed fiber-optic sensing deployment in a deep EGS production well at Utah FORGE: Preliminary results and lessons learned. In Proceedings of the 50th Workshop on Geothermal Reservoir Engineering (SGP-TR-229), Stanford, CA, USA, 10–12 February 2025; Stanford University: Stanford, CA, USA, 2025. [Google Scholar]
- Ou, Y.; Liu, Q.; Hu, J.; Zhao, Z.; Sharma, M. Evaluating Fluid Circulation in Enhanced Geothermal Systems at the Forge Site Using Thermo-Hydro-Mechanical Models and Fiber-Optic Distributed Strain Measurements. In Proceedings of the SPE Annual Technical Conference and Exhibition, New Orleans, LA, USA, 23–25 September 2024. [Google Scholar] [CrossRef] [Scilit]
- Kneafsey, T.J.; Dobson, P.F.; Ajo-Franklin, J.B.; Guglielmi, Y.; Valladao, C.A.; Blankenship, D.A.; Schwering, P.C.; Knox, H.A.; White, M.D.; Johnson, T.C.; et al. EGS Collab Project: Status, Tests, and Data. In Proceedings of the 53rd U.S. Rock Mechanics/Geomechanics Symposium, New York City, NY, USA, 23–26 June 2019. [Google Scholar]
- Dzubay, A.; Mesimeri, M.; Whidden, K.M.; Wells, D.; Pankow, K. Developing a comprehensive seismic catalog using a matched-filter detector during a 2019 stimulation at Utah FORGE. In Proceedings of the 47th Workshop on Geothermal Reservoir Engineering (SGP-TR-223), Stanford, CA, USA, 7–9 February 2022; Stanford University: Stanford, CA, USA, 2022. [Google Scholar]
- Boitz, N.; Tegtow, W.; Shapiro, S. Machine-learning based arrival-picking in continuous DAS recordings—Application to the Utah FORGE EGS project. In Proceedings of the Fourth International Meeting for Applied Geoscience & Energy Expanded Abstracts; Society of Exploration Geophysicists and American Association of Petroleum Geologists: Houston, TX, USA, 2024; pp. 553–557. [Google Scholar] [CrossRef] [Scilit]
- Binder, G.; Abatchev, Z. Joint microseismic event location with surface geophones and downhole DAS at the FORGE geothermal site. In Proceedings of the First International Meeting for Applied Geoscience & Energy Expanded Abstracts; Society of Exploration Geophysicists: Houston, TX, USA, 2021; pp. 2001–2005. [Google Scholar] [CrossRef] [Scilit]
- Yang, Y.; Saad, O.M.; Alkhalifah, T. Deep learning-based 3D microseismic event direct location using simultaneous surface and borehole data. J. Geophys. Res. Mach. Learn. Comput. 2024, 1, e2024JH000365. [Google Scholar] [CrossRef] [Scilit]
- Cao, M.; Sharma, M.M. Geomechanical Modeling of Fracture Growth in Naturally Fractured Rocks: A Case Study of the Utah FORGE Geothermal Site. In Proceedings of the SPE/AAPG/SEG Unconventional Resources Technology Conference, Denver, CO, USA, 13–15 June 2023. [Google Scholar] [CrossRef] [Scilit]
- Society of Petroleum Engineers. Utah FORGE: Engineering an enhanced geothermal system [Online course]. SPE Streaming. Available online: https://streaming.spe.org/course-utah-forge-engineering-an-enhanced-geothermal-system (accessed on 13 June 2022).
- McLennan, J. Petrolern P.A.S.S Talk#3 by Dr John McLennan: Utah FORGE [Video]. YouTube. Available online: https://www.youtube.com/watch?v=85CS6ymxICQ (accessed on 9 October 2020).
- Xing, P.; Damjanac, B.; Radakovic-Guzina, Z.; Torres, M.; Finnila, A.; Podgorney, R.; Moore, J.; McLennan, J. Comparison of modeling results with data recorded during field stimulations at Utah FORGE site. In Proceedings of the 48th Workshop on Geothermal Reservoir Engineering (SGP-TR-224), Stanford, CA, USA, 6–8 February 2023; Stanford University: Stanford, CA, USA, 2023. [Google Scholar]
- Kim, J.; Ajo-Franklin, J.; Shadoan, T.; Sobolevskaia, V.; Correa, J.; Freifeld, B. A dense linear array for passive seismic imaging of geothermal structural features: The FOAL experiment at Utah FORGE. In Proceedings of the Third International Meeting for Applied Geoscience & Energy Expanded Abstracts.; Society of Exploration Geophysicists and American Association of Petroleum Geologists: Houston, TX, USA, 2023; pp. 935–939. [Google Scholar] [CrossRef] [Scilit]
- Li, Y.; Li, D.; Huang, L.; Zheng, Y.; Wannamaker, P.; Moore, J. Anisotropic properties in the sedimentary and granite rocks at the Utah FORGE geothermal site revealed by shear-wave splitting of 3-component borehole microseismic data. In Proceedings of the Second International Meeting for Applied Geoscience & Energy Expanded Abstracts; Society of Exploration Geophysicists and American Association of Petroleum Geologists: Houston, TX, USA, 2022; pp. 3619–3623. [Google Scholar] [CrossRef] [Scilit]
- Finnila, A.; Damjanac, B.; Podgorney, R. Development of a Discrete Fracture Network Model for Utah FORGE using Microseismic Data Collected During Stimulation of Well 16A(78)-32. In Proceedings of the 48th Workshop on Geothermal Reservoir Engineering (SGP-TR-224), Stanford, CA, USA, 6–8 February 2023; Stanford University: Stanford, CA, USA, 2023. [Google Scholar]
- Almetwally, A.G.; Wheeler, M.F.; Podgorney, R.K. Simulation of EGS Fracturing Dynamics Using Phase-field Finite Element. In Proceedings of the 50th Workshop on Geothermal Reservoir Engineering (SGP-TR-229), Stanford, CA, USA, 10–12 February 2025; Stanford University: Stanford, CA, USA, 2025. [Google Scholar]
- Tounsi, H.; Damjanac, B.; Radakovic-Guzina, Z.; Fu, W.; Finnila, A.; Xing, P.; Podgorney, R. A Coupled Hydro-Mechanical Analysis of Impact of DFN on Reservoir Stimulation at FORGE. In Proceedings of the 50th Workshop on Geothermal Reservoir Engineering (SGP-TR-229), Stanford, CA, USA, 10–12 February 2025; Stanford University: Stanford, CA, USA, 2025. [Google Scholar]
- Mellors, R.J.; Sherman, C.; Fu, P.; McLennan, J.; Morris, J.; Ryerson, F.; Morency, C. Potential Use of Distributed Acoustic Sensors to Monitor Fractures and Microseismicity at the FORGE EGS site. In Proceedings of the 44th Workshop on Geothermal Reservoir Engineering (SGP-TR-214), Stanford, CA, USA, 11–13 February 2019; Stanford University: Stanford, CA, USA, 2019. [Google Scholar]
- Correa, J.; Ajo-Franklin, J.; Wood, T.; Freifeld, B.; FOGMORE@FORGE team. Preliminary Analysis of Continuous Seismic Monitoring at Utah FORGE: Tracking Fracture Evolution with Distributed Acoustic Sensing and Permanent Seismic Sources. In Proceedings of the 50th Workshop on Geothermal Reservoir Engineering (SGP-TR-229), Stanford, CA, USA, 10–12 February 2025; Stanford University: Stanford, CA, USA, 2025. [Google Scholar]
- Ma, Y.; Ajo-Franklin, J.; Chamarczuk, M.; Patterson, J.; Vera Rodriguez, I.; Podrasky, D.; Coleman, T.; Maldaner, C. Illuminating geothermal reservoir structure: DAS microseismic imaging at Utah FORGE. In Proceedings of the Fourth International Meeting for Applied Geoscience & Energy, SEG Technical Program Expanded Abstracts; Society of Exploration Geophysicists and American Association of Petroleum Geologists: Houston, TX, USA, 2024; pp. 548–552. [Google Scholar] [CrossRef] [Scilit]
- Finnila, A.; Doe, T.; Podgorney, R.; Damjanac, B.; Xing, P. Revisions to the Discrete Fracture Network Model at Utah FORGE Site. In Proceedings of the 2021 Geothermal Rising Conference: Using the Earth to Save the Earth, GRC 2021, San Diego, CA, USA, 3–6 October 2021. [Google Scholar]
- Simmons, S.F.; Moore, J.; Allis, R.; Kirby, S.; Jones, C.; Bartley, J.; Kleber, E.; Knudsen, T.; Miller, J.; Hardwick, C.; et al. A revised geoscientific model for FORGE Utah EGS Laboratory. In Proceedings of the 43rd Workshop on Geothermal Reservoir Engineering (SGP-TR-213), Stanford, CA, USA, 12–14 February 2018; Stanford University: Stanford, CA, USA, 2018. [Google Scholar]
- Zhou, X.; Ghassemi, A. Experimental Determination of Poroelastic Properties of Utah FORGERocks. In Proceedings of the 56th U.S. Rock Mechanics/Geomechanics Symposium, Santa Fe, NM, USA, 26–29 June 2022. [Google Scholar] [CrossRef] [Scilit]
- Holt, R. EGS well test analysis from the perspective of conventional geothermal reservoir engineering. In Proceedings of the 50th Workshop on Geothermal Reservoir Engineering (SGP-TR-229), Stanford, CA, USA, 10–12 February 2025; Stanford University: Stanford, CA, USA, 2025. [Google Scholar]
- Ratnayake, R.; Ghassemi, A. Forward Modeling of Utah FORGE 2024 Hydraulic Stimulation: Fiber Signatures & Seismicity. In Proceedings of the SPE/AAPG/SEG Unconventional Resources Technology Conference, Houston, TX, USA, 17–19 June 2024. [Google Scholar] [CrossRef] [Scilit]
- Kumar, D.; Ghassemi, A. Multistage hydraulic fracturing of EGS wells with application to FORGE. In Proceedings of the 44th Workshop on Geothermal Reservoir Engineering (SGP-TR-214), Stanford, CA, USA, 11–13 February 2019; Stanford University: Stanford, CA, USA, 2019. [Google Scholar]
- Lee, S.H.; Ghassemi, A. Numerical simulation of fluid circulation in hydraulically fractured Utah FORGE wells. In Proceedings of the 47th Workshop on Geothermal Reservoir Engineering (SGP-TR-223), Stanford, CA, USA, 7–9 February 2022; Stanford University: Stanford, CA, USA, 2022. [Google Scholar]
- Finnila, A.; Forbes, B.; Podgorney, R. Building and utilizing a discrete fracture network model of the FORGE Utah site. In Proceedings of the 44th Workshop on Geothermal Reservoir Engineering (SGP-TR-214), Stanford, CA, USA, 11–13 February 2019; Stanford University: Stanford, CA, USA, 2019. [Google Scholar]
- Podgorney, R.; Munday, L.; Liu, J.; Finnila, A.; Damjanac, B.; Xing, P.; Radakovic-Guzina, Z. Thermal-Hydraulic-Mechanical (THM) modeling of fluid flow and heat/tracer transport between injection and production wells at the Utah FORGE site. In Proceedings of the 48th Workshop on Geothermal Reservoir Engineering (SGP-TR-224), Stanford, CA, USA, 6–8 February 2023; Stanford University: Stanford, CA, USA, 2023. [Google Scholar]
- Bao, J.; Lee, J.; Yoon, H.; Pyrak-Nolte, L. Subsurface Characterization Using Bayesian Deep Generative Prior-Based Inverse Modeling for Utah FORGE Enhanced Geothermal System. In Proceedings of the 57th U.S. Rock Mechanics/Geomechanics Symposium, Atlanta, GA, USA, 25–28 June 2023. [Google Scholar] [CrossRef] [Scilit]
- Balamir, O.; Rivas, E.; Rickard, W.M.; McLennan, J.; Mann, M.; Moore, J. Utah FORGE reservoir: Drilling results of deep characterization and monitoring well 58-32. In Proceedings of the 43rd Workshop on Geothermal Reservoir Engineering (SGP-TR-213), Stanford, CA, USA, 12–14 February 2018; Stanford University: Stanford, CA, USA, 2018. [Google Scholar]
- Jones, C.G.; England, K.; Simmons, S.; Rose, P.; Mella, M.; Barker, B.; McLennan, J.; Moore, J. Stimulation, tracers and geochemistry at Utah FORGE. In Proceedings of the 48th Workshop on Geothermal Reservoir Engineering (SGP-TR-224), Stanford, CA, USA, 6–8 February 2023; Stanford University: Stanford, CA, USA, 2023. [Google Scholar]
- Xing, P.; Damjanac, B.; Radakovic-Guzina, Z.; Finnila, A.; Podgorney, R.; Moore, J.; McLennan, J. Numerical investigation of stimulation from the injection well at Utah FORGE site. 2021 Geothermal Rising Conference: Using the Earth to Save the Earth, GRC 2021, San Diego, CA, USA, 3–6 October 2021. [Google Scholar]
- Podgorney, R.K.; Finnila, A.; Ghassemi, A.; McLennan, J.; Moore, J. Reference native state and stimulation models of the Utah FORGE site. In Proceedings of the 43th Workshop on Geothermal Reservoir Engineering; Stanford University: Stanford, CA, USA, 2020; SGP-TR-216. [Google Scholar]
- Lee, S.H.; Ghassemi, A.; Ajo-Franklin, J.; Becker, M. Numerical modeling of stimulation and circulation in Utah FORGE wells. In Proceedings of the 49th Workshop on Geothermal Reservoir Engineering; Stanford University: Stanford, CA, USA, 2024; SGP-TR-227. [Google Scholar]
- Riahi, A.; Pettitt, W.; Damjanac, B.; Varun; Blanksma, D. Numerical Modeling of Discrete Fractures in a Field-Scale FORGEEGSReservoir. In Proceedings of the 52nd U.S. Rock Mechanics/Geomechanics Symposium, Seattle, WA, USA, 17–20 June 2018. [Google Scholar]
- Nadimi, S.; Forbes, B.; Moore, J.; Ye, Z.; Ghassemi, A.; McLennan, J.D. Experimental evaluation of effect of hydro-shearing on fracture conductivity at the Utah FORGE site. In Proceedings of the Stanford Geothermal Workshop, Stanford, CA, USA, 11–13 February 2019; Stanford University: Stanford, CA, USA, 2019. [Google Scholar]
- Utah FORGE. Utah FORGE Geothermal Webinar Series—Volume 1 [Video]. YouTube. Available online: https://www.youtube.com/watch?v=dHY3-UNX8lQ (accessed on 22 October 2022).
- Mustafa, A.; Kelley, M.; Lu, G.; Bunger, A.P. Unsupervised Machine Learning for Delineating Stratigraphy in Subsurface Reservoirs for the Utah FORGE Geothermal Project Ayyaz Mustafa. In Proceedings of the 58th U.S. Rock Mechanics/Geomechanics Symposium, Golden, CO, USA, 23–26 June 2024. [Google Scholar] [CrossRef] [Scilit]
- McLennan, J. Utah FORGE: Hydraulic Fracturing for An Enhanced Geothermal System (EGS) [Video]. MIT Earth Resources Laboratory. YouTube. Available online: https://www.youtube.com/watch?v=rlLVTf2EjpI (accessed on 1 October 2025).
- Xing, P.; Edelman, E.; Vega-Ortiz, C.; Jones, C.; DeOreo, S.; Stark, M.; Wriedt, J.; McLennan, J. Evaluation of drilling performance at The Geysers with machine learning methods using geologic data. In Proceedings of the 50th Workshop on Geothermal Reservoir Engineering (SGP-TR-229), Stanford, CA, USA, 10–12 February 2025; Stanford University: Stanford, CA, USA, 2025. [Google Scholar]
- Kumar, D.; Liu, B.; Ghassemi, A. 3D Modeling of the Utah Forge Reservoir Stimulation with Proppant Transport and Deposition. In Proceedings of the SPE Annual Technical Conference and Exhibition, San Antonio, TX, USA, October 16–18, 2023. [Google Scholar] [CrossRef] [Scilit]
- Xing, P.; Damjanac, B.; Radakovic-Guzina, Z.; Finnila, A.; Podgorney, R.; Moore, J.; McLennan, J. Numerical Simulation of Hydraulic Fracturing Stimulation Enhanced Geothermal System Well at Utah Forge Site. In Proceedings of the 55th U.S. Rock Mechanics/Geomechanics Symposium, Virtual, 18–25 June 2021. [Google Scholar]
- Ghassemi, A.; Ye, Z.; Ratnayake, M. The role of thermo-poroelastic effects on drilling induced fractures in the Utah FORGE Well 16A(78)-32. In Proceedings of the 49th Workshop on Geothermal Reservoir Engineering (SGP-TR-227), Stanford, CA, USA, 12–14 February 2024; Stanford University: Stanford, CA, USA, 2024. [Google Scholar]
- Xing, P.; Goncharov, A.; Winkler, D.; Rickard, B.; Barker, B.; Finnila, A.; Ghassemi, A.; Podgorney, R.; Moore, J.; McLennan, J. Flowback Data Evaluation at FORGE. In Proceedings of the 54th U.S. Rock Mechanics/Geomechanics Symposium, physical event cancelled, 28 June–1 July 2020. [Google Scholar]
- Liu, Q.; Cao, M.; Ou, Y.; Sharma, M. Hydraulic Fracturing Design in Geothermal Wells: A Utah FORGE Case Study. In Proceedings of the SPE Hydraulic Fracturing Technology Conference and Exhibition, The Woodlands, TX, USA, 4–6 February 2025. [Google Scholar] [CrossRef] [Scilit]
- McClure, M.W.; Irvin, R.; England, K.; McLennan, J. Numerical modeling of hydraulic stimulation and long-term fluid circulation at the Utah FORGE project. In Proceedings of the 49th Workshop on Geothermal Reservoir Engineering (SGP-TR-227), Stanford, CA, USA, 12–14 February 2024; Stanford University: Stanford, CA, USA, 2024. [Google Scholar]
- Agentur Enerchange. Focus on Geothermal: John McLennan (University of Utah): Utah FORGE—Status and Lookahead [Video]. YouTube. Available online: https://www.youtube.com/watch?v=mr7pLw0d_uI (accessed on 27 May 2025).
- Ishibashi, T.; Watanabe, N.; Asanuma, H.; Watanabe, K. Preliminary investigation of the hydraulic stimulation for a field-scale FORGE candidate geothermal reservoir. In Proceedings of the 25th Formation Evaluation Symposium of Japan, 25–26 September 2019; Fukushima Renewable Energy Institute, AIST, and RENERGIES Ltd.: Koriyama City, Japan, 2019. [Google Scholar]
- Xing, P.; England, K.; Moore, J.; McLennan, J. Analysis of the 2024 circulation tests at Utah FORGE and the response of fiber optic sensing data. In Proceedings of the 50th Workshop on Geothermal Reservoir Engineering (SGP-TR-229), Stanford, CA, USA, 10–12 February 2025; Stanford University: Stanford, CA, USA, 2025. [Google Scholar]
- Junichi, S.; Ramon, L.; Francisco, B.; Steve, J.; John, M.; Duane, W.; Matt, S.; Self, J. Oil and Gas Drilling Optimization Technologies Applied Successfully to Unconventional Geothermal Well Drilling. In Proceedings of the SPE Annual Technical Conference and Exhibition, Dubai, United Arab Emirates, 21–23 September 2021. [Google Scholar] [CrossRef] [Scilit]
- Montes, A.C.; Ashok, P.; van Oort, E. Comparing Drilling Anomaly Prediction by Purely Data-Driven and Hybrid Analysis Methods—Case Study of Utah FORGE Geothermal Wells. In Proceedings of the IADC/SPE International Drilling Conference and Exhibition, Galveston, TX, USA, 5–7 March 2024. [Google Scholar] [CrossRef] [Scilit]
- Montes, A.C.; Ashok, P.; van Oort, E. Stuck Pipe Prediction in Utah FORGE Geothermal Wells. In Proceedings of the SPE Annual Technical Conference and Exhibition, San Antonio, TX, USA, 16–18 October 2023. [Google Scholar] [CrossRef] [Scilit]
- Nath, F.; Cabezudo, E. Unraveling Damage Variables in Hot Dry Rocks: An Optical Investigation of Geothermal Rocks from UTAH FORGE. In Proceedings of the SPE Annual Technical Conference and Exhibition, New Orleans, LA, USA, 23–25 September 2024. [Google Scholar] [CrossRef] [Scilit]
- Eltaleb, I.; Rezaei, A.; Soliman, M.Y.; Dindoruk, B. A Signal Processing Approach for Analysis of Fracture Injection Test in Geothermal Reservoirs: A Case Study on the Utah FORGE Formation. In Proceedings of the SPE Hydraulic Fracturing Technology Conference and Exhibition, Virtual, 4–6 May 2021. [Google Scholar] [CrossRef] [Scilit]
- Finnila, A.; Jones, C. Updated reference discrete fracture network model at Utah FORGE. In Proceedings of the 49th Workshop on Geothermal Reservoir Engineering (SGP-TR-227), Stanford, CA, USA, 12–14 February 2024; Stanford University: Stanford, CA, USA, 2024. [Google Scholar]
- Energy & Geoscience Institute. Stimulation of a High-Temperature Granitic Reservoir at the Utah FORGE Site [Video]. YouTube. Available online: https://www.youtube.com/watch?v=lZBPoWfjEjE (accessed on 20 October 2025).
- Heinze, T.; Gunatilake, T. Estimating the heat transfer in fractured geothermal reservoirs. Energy 2025, 321, 135008. [Google Scholar] [CrossRef] [Scilit]
- Liu, K.; Xi, B.; Gao, P.; He, S.; Dong, Y.; Chen, L. Experimental study on heat transfer characteristics of rock mass with single fracture in geothermal reservoir. Therm. Sci. Eng. Prog. 2025, 62, 103631. [Google Scholar] [CrossRef] [Scilit]
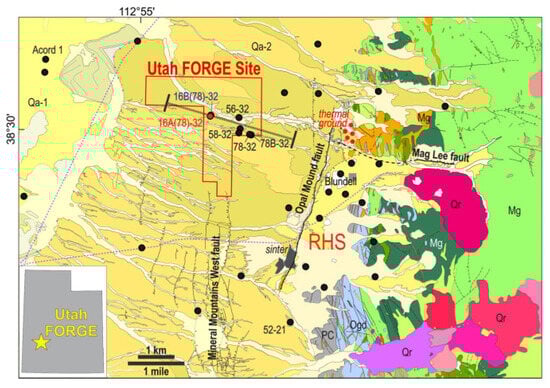
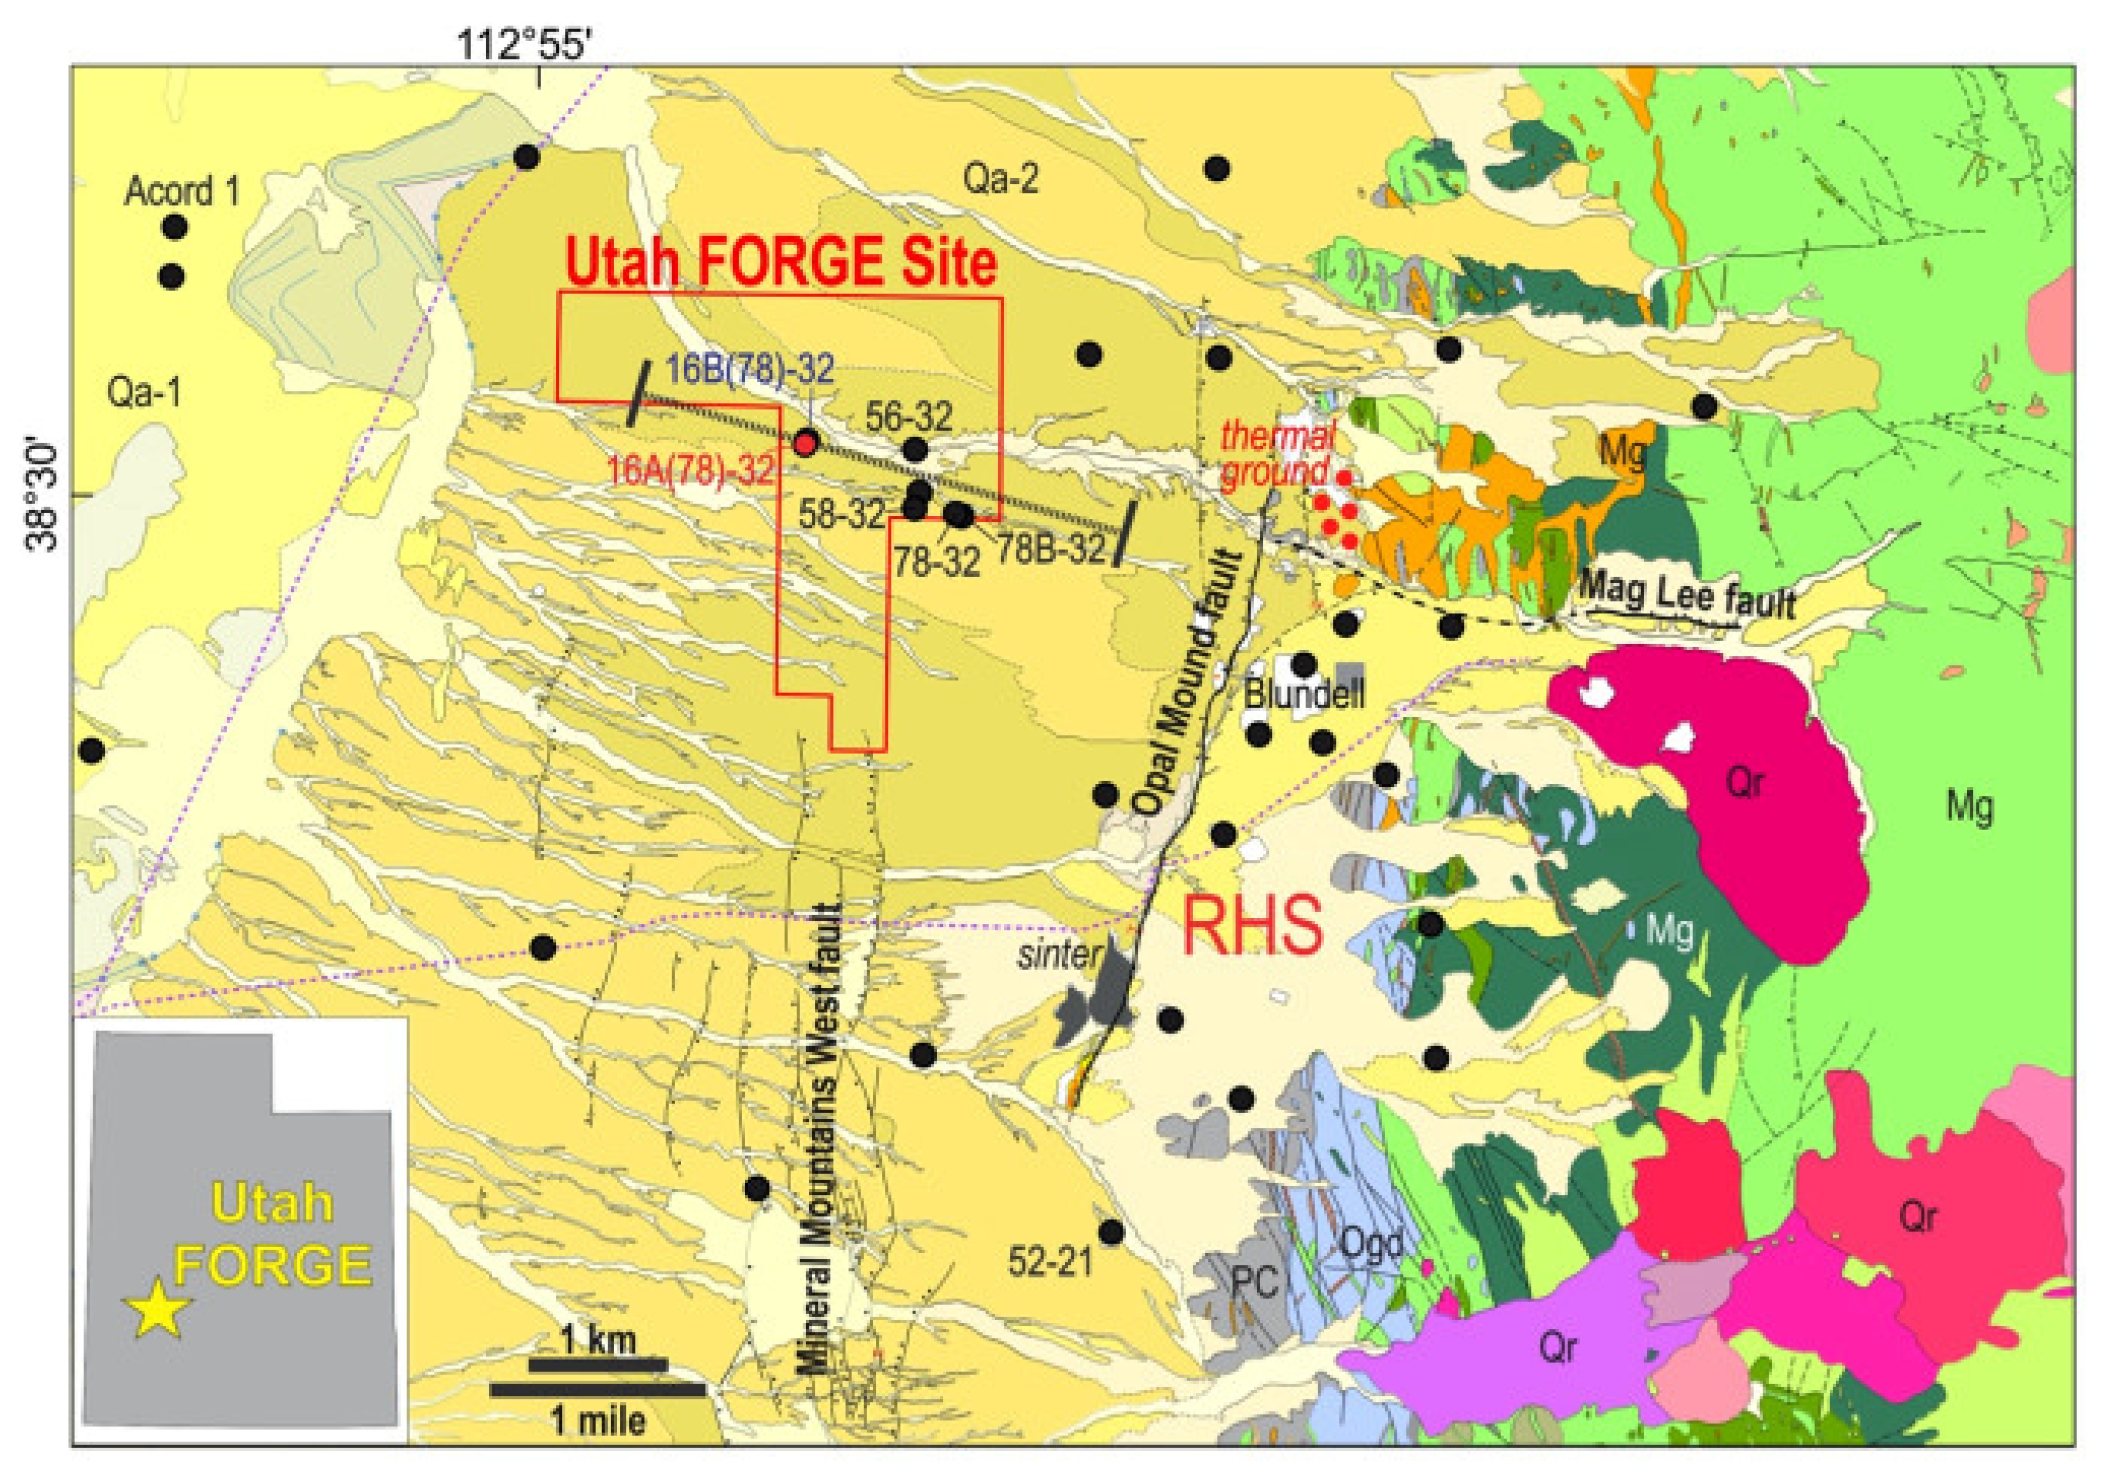

Disclaimer/Publisher’s Note: The statements, opinions and data contained in all publications are solely those of the individual author(s) and contributor(s) and not of MDPI and/or the editor(s). MDPI and/or the editor(s) disclaim responsibility for any injury to people or property resulting from any ideas, methods, instructions or products referred to in the content. |
© 2026 by the authors. Licensee MDPI, Basel, Switzerland. This article is an open access article distributed under the terms and conditions of the Creative Commons Attribution (CC BY) license.