Abstract
Microbial lipid production from renewable carbon sources, particularly lignocellulosic hydrolysates, is a promising alternative to plant-derived oils and fats for food applications, as it can minimize the land use by utilizing agricultural wastes and byproducts from food production. In this context, a standard approach to prevent oxygen limitation at reduced air gassing rates during long-term aerobic microbial processes is to operate bioreactors at increased pressure for elevating the gas solubility in the fermentation broth. This study investigates the effect of absolute pressures of up to 2.5 bar on the conversion of the carbon sources (glucose, xylose, and acetate), growth, and lipid biosynthesis by Cutaneotrichosporon oleaginosus converting a synthetic nutrient-rich lignocellulosic hydrolysate at low air gassing rates of 0.1 vessel volume per minute (vvm). Increasing pressure delayed xylose uptake, reduced acetic acid consumption, and reduced biomass formation. Lipid accumulation decreased with increasing pressure, except for fermentations at 1.5 bar, which achieved a maximum lipid content of 83.6% (±1.6, w/w) (weight per weight in %). At an absolute pressure of 1.5 bar, a lipid yield from glucose, xylose, and acetic acid of 38% (w/w) was reached after 6 days of fermentation. The pressure sensitivity of C. oleaginosus may pose challenges on an industrial scale due to the dynamic changes in pressure when the yeast cells pass through the bioreactor. Increasing liquid heights in full-scale bioreactors will result in increased hydrostatic pressures at the bottom, substantially reducing lipid yields, e.g., to only 23% (w/w) at 2.0–2.5 bar, as shown in this study. However, further scale-up studies with dynamic pressure regimes (1–2.5 bar) may help to evaluate scale-up feasibility.
1. Introduction
In the context of the growing demand for renewable carbon sources and sustainable alternatives to fossil sources, the concurrence between the utilization of agricultural goods for food production and, on the other hand, as a feedstock for biofuels and chemicals is still an unsolved problem for the development of a circular and climate-neutral economy [1,2]. Addressing concerns about the environment and the sustainable and socially acceptable utilization of agricultural goods, various approaches are being studied to utilize agricultural waste streams and byproducts as alternatives to valuable raw materials for food production. Agricultural byproducts, such as wheat bran, sugar beet press pulp, or straw, are available in large quantities and are primarily burned for energy generation (thermal utilization) or, to a limited extent, as animal feed supplement [3]. Promising approaches to utilizing residual waste from agricultural production are based on chemo-enzymatic hydrolysis, which releases sugar monomers such as glucose, xylose, or arabinose [4,5,6]. Research on the transformation of these sugars from various hydrolysates has intensified, with an increasing focus on microbial lipid production, such as single-cell oils (SCO), which can be synthesized by oleaginous yeast and serve as an environmentally friendly substitute for palm oil and cocoa butter or a versatile feedstock for biofuels and oleochemicals [7,8,9,10,11].
Furthermore, oleaginous yeasts are capable of utilizing acetic acid as a carbon source for SCO production without nitrogen or phosphorus limitation [12,13,14,15]. Biogenic acetic acid can be obtained by gas fermentation of syngas (H2, CO2, CO) derived from the gasification of lignocellulosic biomass residues [16]. The efficiency of homo-acetate production from syngas by, e.g., Acetobacterium woodii or Clostridium aceticum, has been demonstrated in various studies [17,18,19,20,21]. The sustainable microbial utilization of lignocellulosic biomass (sugar monomers after chemo-enzymatic hydrolysis, and acetic acid after gasification of the remaining lignocellulosic biomass residues, e.g., lignin) followed by gas fermentation, is a promising approach towards a climate-neutral production of chemicals. However, due to limitations in process efficiency and economic applicability, integrating microbial lipid production into waste valorization strategies remains a key challenge for developing sustainable alternatives to palm oil, cocoa butter, and other food-related products.
Among the diverse group of oleaginous yeasts, Cutaneotrichosporon oleaginosus, which was originally isolated from dairy production waste is considered one of the most promising candidates for the sustainable production of SCO owing to its ability to accumulate more than 80% of its dry cell weight as lipids under appropriate process conditions [15,22]. In comparison, other well-studied oleaginous yeasts, such as Yarrowia lipolytica and Lipomyces starkeyi, were found to accumulate lipid contents up to 40%, and 70%, respectively [23]. C. oleaginosus is also recognized for its metabolic flexibility, capable of utilizing a wide range of carbon sources, including glucose, xylose, and various volatile fatty acids [24,25,26], and furthermore lactose [27], N-acetylglucosamine [28], and glycerin [29], as well as waste from agriculture [30]. This broad range of carbon sources, which can be utilized for lipid formation by C. oleaginosus, highlights its potential for utilizing waste streams derived from food production. Regarding the capacities of oleaginous microorganisms for sustainable lipid production, various approaches, ranging from genetic engineering to bioprocess development, are studied intensively [23,31]. Moreover, C. oleaginosus has great potential for industrial applications in lipid production due to its ability to withstand varying environmental conditions, such as pH shifts from pH 6–9 [32].
Following extensive research on the effects of nutrient limitations on aerobic lipid biosynthesis by C. oleaginosus [12,13,14], physical parameters such as absolute pressure have been poorly investigated. Due to the slow aerobic lipid formation with C. oleaginosus, which requires process times of up to 9 days [15], the power input and sterile gas supply for aeration must be minimized to reduce operating costs. To avoid oxygen limitations, the total operating pressure in the bioreactor can be increased, especially at high cell densities. Additionally, in industrial-scale stirred tank or gas-lift bioreactors, fluid column height can result in elevated hydrostatic pressures of several bars at the bottom where the gas phase is dispersed, depending on the bioreactor geometry [33,34,35]. It is well known that elevated pressure affects microbial physiology by altering gas solubilities, mass transfer rates, and the partial pressures of gases such as oxygen and carbon dioxide (CO2) [36,37,38]. Recently, it has been demonstrated that increased or decreased total pressure may alter metabolic fluxes towards enhanced metabolite production in some yeast species, such as Saccharomyces cerevisiae [34,35]. However, no such investigations are known with C. oleaginosus, which outlines a major limitation towards industrial scalability.
This study investigates the unknown impact of pressure on the process performances of C. oleaginosus, specifically in terms of substrate consumption, growth, and lipid biosynthesis during aerobic fed-batch cultivations in a controlled lab-scale stirred tank bioreactor with a low sterile air gassing rate of 0.1 vvm. The absolute constant pressures applied (1.5 bar, 2.0 bar, and 2.5 bar) correspond to typical pressures at the bottom of a bioreactor during scale-up with liquid heights of 5 m, 10 m, and 15 m, respectively. Fed-batch fermentations at 1.0 bar were used as reference. The synthetic medium used for these investigations was a simulated nutrient-rich lignocellulosic hydrolysate containing glucose and xylose in a 2:1 ratio [39,40]. The synthetic hydrolysate was employed to avoid variations in the composition of real hydrolysates and to provide a standardized baseline under defined conditions before applying real hydrolysates. For lipid biosynthesis, acetic acid was fed pH-controlled to the synthetic hydrolysate, as C. oleaginosus is capable of directly utilizing acetate for energy conservation through lipid accumulation via the Kennedy pathway [41]. The aim was to elucidate the physiological and metabolic responses of C. oleaginosus to elevated pressures at a low sterile air gassing rate. The study works with established media and standardized methods. To elaborate on the influence of increased pressure on fermentation process performance with C. oleaginosus, this study examines the effect of four different total pressures in fully controlled stirred tank reactor (STR) batch processes with synthetic hydrolysate. The pH is controlled by titration with acetic acid. The dissolved oxygen (DO) concentration is kept constant by the power input (stirrer speed), keeping the gassing rate at 0.1 vvm. The sub strate uptake rates (sugars, acetic acid, and oxygen, as well as the product formation rates (biomass, lipids, and CO2) are determined time-resolved to get a detailed insight into the process performances and carbon distributions at varying total pressures.
2. Materials and Methods
2.1. Yeast Strain and Cultivation Medium
Cutaneotrichosporon oleaginosus (ATCC 20509) was obtained from the German Collection of Microorganisms and Cell Cultures (DSMZ) (Braunschweig, Germany) as a freeze-dried culture. In the DSMZ register, the previously mentioned strain is listed under the number DSM 11815. For long-term stability of the strain, freeze-dried cells were grown with yeast extract peptone dextrose (YPD) medium (20 g L−1 peptone, 10 g L−1 yeast extract, 20 g L−1 glucose), mixed with 25% (v/v) of glycerin (Sigma Aldrich, Saint Louis, MO, USA), and subsequently stored at −80 °C as cryo-stocks.
To prepare precultures, one cryo-stock was suspended in 200 mL YPD medium. Precultures were first incubated in at 30 °C and 150 rpm for 3 days. Subsequently, a fraction of the preculture was transferred into fresh YPD medium in shaking flasks and incubated at 30 °C and 250 rpm for 1 day. The lipid production medium was adapted from [15]. The medium composition is shown in Table 1 and 10 mL of a trace-element solution (Table 2) was added per liter of medium. Except for the trace-element solution, glucose and xylose, which were separately sterilized, all components were mixed and sterilized in a steam sterilizer.

Table 1.
Composition of the production medium used for the microbial oil production.
Table 2.
Composition of the trace-element solution used in the production medium.
2.2. Stirred Tank Bioreactor with pH-Dependent Acetic Acid Supplementation
All processes were conducted in a STR with a total volume of 42 L (Techfors42, Infors HT, Bottmingen, Switzerland) depicted in Figure 1. The initial working volume was 25 L. The process variables were controlled through software (Iris 6.0, Infors HT, Bottmingen, Switzerland) and the exhaust gas composition was monitored using a gas analyzer (BlueInOne Ferm, BlueSens gas sensor GmbH, Herten, Germany). The DO concentration was controlled at 30% air saturation by the automated stirrer speed control between 300–1000 rpm. The stirrer was equipped with three 6-blade Rushton turbines, spaced approximately 20 cm apart. The volumetric gas flow rate was set to 2.5 L min−1 with pressurized air, which corresponds to a gassing rate of 0.1 vvm at the beginning of the fed-batch process. For automated pH titration, 6 M potassium hydroxide (KOH) and 100% acetic acid were connected to the peristaltic pump station of the STR control unit. Acetic acid, which is crucial for the formation of lipids by C. oleaginosus without nitrogen or phosphorus limitation [15,22,42], was solely added for pH titration. Additionally, foam formation was suppressed by adding 20% (v/v) of antifoam agent (Antifoam 204, Sigma Aldrich, Taufkirchen, Germany) with a controlled peristaltic pump, which was triggered by a foam-level sensor. The STR filled with medium without sugars was sterilized in place via heat sterilization at 121 °C for at least 20 min. All other solutions were either heat sterilized or sterilized through filtration before aseptic transfer into the STR.
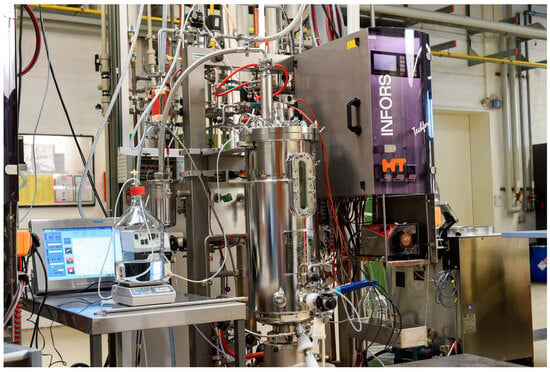
Figure 1.
Photograph of the stirred tank bioreactor setup for the cultivation of C. oleaginosus on a 25 L scale at varying absolute pressures with pH controlled co-feeding of acetic acid at the Chair of Biochemical Engineering (TUM).
2.3. Cell Dry Weight and Optical Density
Cell dry weight (CDW) was determined gravimetrically by centrifugation at 20,817 rcf for 10 min in a mixture (1:1) of the sample and 99% (v/v) ethanol (Carl Roth GmbH, Karlsruhe, Germany) in pre-dried and pre-weighted tubes. Ethanol was added to ensure the sedimentation of all cells, even those with high lipid contents. The supernatant was discarded, and the cell pellet was dried to constant weight at 80 °C for at least 48 h before final weighing. The cell density of the samples throughout the processes was determined in triplicate by measuring the optical density at a wavelength of 600 nm (OD600) using a UV-vis spectrometer (Genesys 10S UV-VIS, Thermo Fisher Scientific Inc., Waltham, MA, USA). The samples were diluted with phosphate-buffered saline solution (PBS) (8 g L−1 NaCl (Carl Roth GmbH, Karlsruhe, Germany), 0.2 g L−1 KCl (Carl Roth GmbH, Karlsruhe, Germany), 1.44 g L−1 Na2HPO4 (Carl Roth GmbH, Karlsruhe, Germany), 0.24 g L−1 KH2PO4 (Carl Roth GmbH, Karlsruhe, Germany)) to keep the optical density within the linear correlation range of the UV-Vis spectrometer. The CDW concentration was estimated based on the measured OD600 by correlating the gravimetrically determined cell dry weight and the spectrometrically determined optical density.
2.4. Substrate Analysis
High Performance Liquid Chromatography (Agilent 1100 LC, Agilent Technologies Inc., Santa Clara, CA, USA) was applied to measure the concentrations of the monosaccharides and acetic acid using an ion exchange column (Aminex HPX-87H, 300 mm × 7.8 mm, Bio-Rad Laboratories Inc., Hercules, CA, USA) with a refractive index (RI) detector (Agilent 1200 G1362A RID, Agilent Technologies Inc., Santa Clara, CA, USA). 5 mM sulfuric acid was used as the mobile phase with a flow rate of 0.5 mL min−1, and the RI detector was operated at 65 °C.
Phosphate concentrations were determined with an enzymatic assay kit (Phosphate Assay Kit, Megazyme Ltd., Wicklow, Ireland, SKU: 700004326) to evaluate the C/P ratio of the medium. Calibration was done through standardization with the diluted standard solution (cPhosphate = 0.05 mg mL−1). The limit of detection of the phosphate assay is 0.16 mg L−1.
2.5. Fatty Acid Composition and Lipid Content
The lipid content was analyzed using gas chromatography (GC). Conversion to fatty acid methyl esters (FAMEs) was adapted from literature [22,43,44]. Lyophilized biomass (5 mg) was weighed into a glass vial, 490 µL toluene and 10 µL of an internal standard with a concentration of 10 g L−1 of a C19 fatty acid (Sigma Aldrich, CAS-No.: 646-30-0) and 10 g L−1 of a C12-Triacylglycerid (Sigma Aldrich, CAS-No.: 538-24-9) in toluene were added and mixed for 5 min at 800 rpm and room temperature. Then, 1 mL of 0.5 M sodium methoxide in methanol (Sigma Aldrich, CAS-No.: 124-41-4) was added, and the mixture was heated to 80 °C while shaking for 20 min. After cooling on ice, 1 mL of 1.25 M HCl in methanol (Sigma Aldrich, CAS-No.: 132228-87-6) was added, then reheated to 80 °C for 20 min. Subsequently, the sample was cooled on ice, mixed with 400 µL deionized water at 800 rpm for 2 min, and FAMEs were extracted by adding 1 mL hexane and shaking at 800 rpm for 10 min at room temperature. After centrifugation at 3000 rcf for 10 min, 200 µL of the organic phase was transferred into a GC vial and analyzed via gas chromatography (GC-2010 Plus, Shimadzu Deutschland GmbH, Duisburg, Germany). After injection at 220 °C, separation was achieved through a fused silica column (FAMEWAX, Restek GmbH, Bad Homburg, Germany) using helium as a carrier phase. The column temperature was set to 120 °C at the beginning, then the temperature was increased to 220 °C with a rate of 7 °C min−1 and was kept constant for 20 min. A flame ionization detector (FID) operated at 250 °C was used to identify the FAMEs. The fatty acids were identified through standardization with FAME Marine Oil Standard (Restek GmbH, SKU: 35066) a mixture containing 20 fatty acids from C14:0 to C24:1. This standard mixture was used because the range of FAMEs suits the expected FAMEs produced by C. oleaginosus, as well it represents the typical range of FAMEs found in food-related fats and oils. The total lipid concentration was calculated by summing the concentrations of all individual lipid species detected in the organic phase (excluding the internal standard). The lipid content of the yeast cells is the total lipid mass found in the samples divided by the lyophilized biomass that was used for extraction. The lipid content of the cells was determined by dividing the lipid concentration in the organic phase by the lyophilized biomass concentration in the organic phase. The analytical limit for the FAMEs determined with this GC method ranges from 0.01 to 0.1 µg L−1.
2.6. Elemental Analysis
The carbon, hydrogen, nitrogen, and sulfur (CHNS) contents of the complex components of the medium were determined using a CHNS elemental analyzer (Euro EA CHNS Elemental Analyzer, HEKAtech GmbH, Wegberg, Germany). Elemental analysis was used to determine the ratio of carbon to nitrogen (C/N), carbon to phosphate (C/P), and to monitor the sulphur content in the reaction medium. Both values are crucial parameters for the tracing of the lipid production with C. oleaginosus. During analysis, each sample was combusted in pure oxygen at 1800 °C. The resulting gas mixture, consisting of CO2, H2O, N2, and SO2, was introduced into a gas chromatography column, where the components were separated using helium as the carrier gas. The separated gases were then quantified by a thermal conductivity detector. The contents of C, H, N, and S were calculated based on the mass of each element detected relative to the initial sample mass. Each sample was measured in triplicate.
2.7. Carbon Balance and Yield of Lipids
The carbon introduced into the medium during the process originated from acetate, sugars, peptone, yeast extract, and vitamins. The yeast cells utilized carbon primarily for biomass production, energy conservation, and lipid biosynthesis. The carbon balance was established by integrating data from elemental analysis, fatty acid analysis, substrate consumption, CO2 formation, and cell dry weight measurements. The mass balance for carbon was calculated as follows:
The total mass of the introduced carbon is MC,in, the total mass of the carbon recovered from analysis is MC,out, the total mass of sugars fed to the medium is MS, the total mass of acetic acid fed is MAc, the total mass of complex components fed is MComplex, the mass of biomass produced is MX, the mass of lipid produced is MLipid and MCO2 is the total mass of CO2 that is released through the off gas. The fraction of carbon of sugars is xC,S, the fraction of carbon of acetic acid is xC,Ac, the fraction of carbon of complex components is xC,Complex, the fraction of carbon of biomass is xC,X, the fraction of carbon of intracellular lipids is xC,Lipid and the fraction of carbon of CO2 is xC,CO2.
For the determination of the carbon recovery, Equation (2) was used where RC is the carbon recovery in percent.
The carbon yield to lipids (ηC) is defined as the lipids produced per carbon fed to the process:
3. Results and Discussion
3.1. Consumption of Carbon Sources by C. oleaginosus at Various Pressures
Four pressure conditions (1.0, 1.5, 2.0, and 2.5 bar) were tested and kept constant throughout all processes. The medium used for the production of SCO was composed, as mentioned in Section 2.2, to simulate a resource-saving diluted hydrolysate from straw or other lignocellulosic carbon sources [45]. Furthermore, no nitrogen or phosphorus limitation was present in the medium at the beginning of the processes with C/N = 29.17 g g−1, and C/P = 15.51 g g−1, respectively.
After inoculation, glucose was consumed immediately by the yeast cells within 2 days at 1.0, 1.5, and 2.5 bar, or after 2.5 days at 2.0 bar (Figure 2a). Initially, xylose was consumed simultaneously at reduced rates (Figure 2b). After total consumption of the glucose, xylose was consumed as rapid as the glucose before. This has already been observed in literature [12,26,46]. From Figure 2b, it is evident that with increasing pressure, the conversion of xylose varies. Xylose was consumed entirely after approximately 2.5 days at an absolute pressure of 1.0 bar, whereas at 2.5 bar, complete consumption was delayed to around 3.5 days.
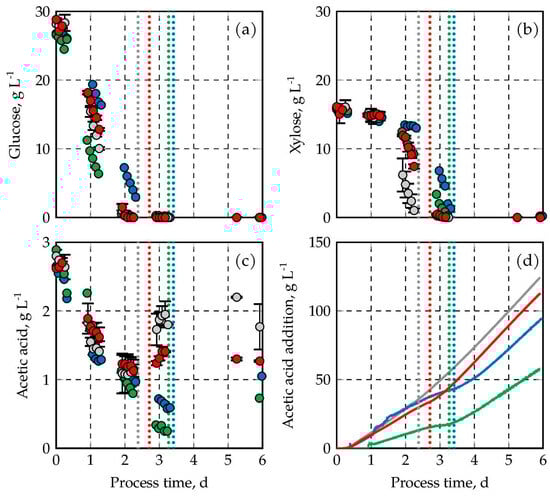
Figure 2.
Substrate consumption of C. oleaginosus at various absolute pressures in fed-batch operated stirred tank bioreactors with pH-controlled acetic acid feeds. In (a) the glucose concentration is shown, in (b) the concentration of xylose, in (c) the concentration of acetic acid, and in (d) the mass of added acetic acid is depicted. The results are indicated in gray (1.0 bar), red (1.5 bar), blue (2.0 bar), and green (2.5 bar). DO was kept at 30% air saturation at all times. The fed-batch processes at 1.0 bar, and 1.5 bar were performed in duplicates (min–max values are shown by error bars). Total sugar consumption is indicated by vertical dotted lines.
The third carbon source used during these processes was acetic acid. With an initial concentration of 2.5 g L−1, pure acetic acid was added throughout the pH-controlled fed-batch processes via the pH titration. The acetic acid concentrations varied between 0.25–2.5 g L−1 in all fed-batch processes (Figure 2c). The addition of acetic acid is shown in Figure 2d as function of the process time related to the initial reactor volume. Total acetic acid addition ranged from 57.5–124.3 g L−1 with the highest uptake at 1.0 bar.
Within the first three days of cultivation, just a small difference in acetic acid addition was found between the processes operated with varying pressures with the exception of the cultivation at 2.5 bar, which showed a highly reduced addition of acetic acid. Afterwards, pH-controlled acetic acid addition varies. The highest acetic acid addition, with 124.3 g L−1, was achieved after 6 days at an absolute pressure of 1.0 bar. The second highest acetic acid uptake was observed at an absolute pressure of 1.5 bar (112.9 g L−1). Further increasing the pressure led to a consecutive reduction in acetic acid addition, reaching 94.7 g L−1 and 57.5 g L−1 at 2.0 bar, and 2.5 bar, respectively.
In literature, a similar uptake of the sugars glucose and xylose was shown at atmospheric pressure during the utilization of a lignocellulosic hydrolysate with a pH based acetic acid feed [22]. The consumption rates of acetic acid have not been reported in the literature until now. However, based on the acetate concentration, which ranges between 0.3–3.0 g L−1, in combination with acetic acid addition, the values determined in this study align with the overall observations in previous investigations at atmospheric pressure [26,42].
The delayed uptake of glucose and xylose with increasing pressure indicates reduced metabolic activity (the metabolic rates are displayed in Table A1). Even though the addition of acetic acid through the pH-based feeding was reduced with increasing pressures, acetate concentrations between 0.3–3.0 g L−1 were measured in all yeast fermentations until harvest (Figure 2c), indicating no acetate limitation was present.
3.2. Biomass and Lipid Formation by C. oleaginosus at Various Pressures
The total CDW formation of C. oleaginosus, as shown in Figure 3a, was reduced with increasing pressures applied. At 1.0 bar, the CDW concentration reaches 54.5 (±1.2) g L−1 after 6 days, whereas at 1.5 bar it decreases to 40.0 (±0.3) g L−1. Further increases in pressure to 2.0 and 2.5 bar result in even stronger reductions in biomass formation, with final CDW concentrations of 34.3 g L−1, and 30.15 g L−1, respectively.
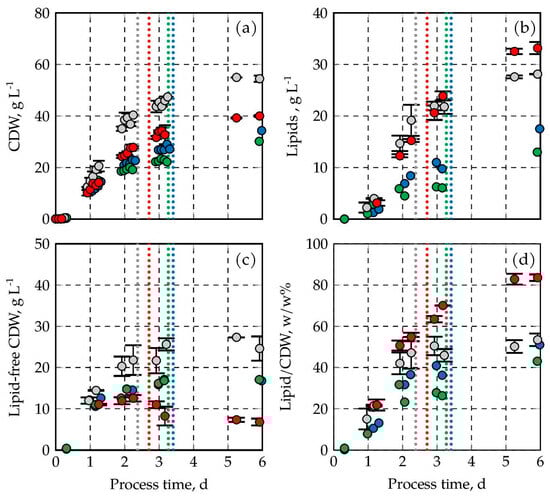
Figure 3.
CDW and lipid formation of C. oleaginosus. In (a), the CDW is depicted throughout the process, in (b), the lipid concentration is shown, in (c), the lipid-free CDW is represented, and in (d), the ratio of lipid to CDW is shown. The results are indicated in gray (1.0 bar), red (1.5 bar), blue (2.0 bar), and green (2.5 bar). DO was kept at 30% air saturation at all times. The fed-batch processes at 1.0 bar, and 1.5 bar were performed in duplicates (min–max values are shown by error bars). Total sugar consumption is indicated by vertical dotted lines.
The total cell dry weight is composed of the cell mass of C. oleaginosus and the intracellular microbial oil droplets (lipids). The cell mass formation of the four processes without lipids is shown in Figure 3c as lipid-free CDW concentrations. At atmospheric pressure, the lipid-free CDW concentration was constant within the estimation error after the initial sugar concentrations were depleted, resulting in a maximum of 27.3 g L−1 lipid-free CDW. No further propagation of the oil forming yeast cells was observed as well after sugar depletion at 2 bar and 2.5 bar. Both processes reached 17.1 g L−1 lipid-free CDW. This clearly shows that no further (significant) cell mass growth is observed with acetic acid as a carbon source, independent of the absolute pressure. The situation was totally different at 1.5 bar. The lipid-free CDW concentration decreased significantly after sugar depletion, from 12.5 g L−1 to 6.8 g L−1, indicating that cell lysis occurred at this pressure. The four lipid production processes can be divided into two groups. High final lipid concentrations were measured at 1.0 bar and 1.5 bar, while lower lipid concentrations were observed at higher pressures (Figure 3b). The most productive process for the formation of microbial oils was operated at 1.5 bar, yielding final lipid concentrations of 33.2 (±1.2) g L−1. Higher absolute pressures resulted in a significant reduction in lipid concentrations, reaching 17.5 g L−1 at 2.0 bar and 13.0 g L−1 at 2.5 bar after 6 days. Compared to atmospheric pressure, this means a decrease of 37.8% and 53.8%, respectively. Low lipid-free CDW concentrations and high final lipid concentrations at 1.5 bar mean a high final lipid content of the C. oleaginosus cells of 83.6% (±1.6) (w/w) (Figure 3d). This is outstanding compared to all other processes with final lipid contents in the biomass of 43.1–53.4% (w/w).
No prior studies have investigated the effects of pressure on process performance with this oleaginous yeast. Solely data are available for other yeasts such as Saccharomyces cerevisiae. It was shown that at a reduced absolute pressure of 0.24 bar, the sugar consumption (molasses and sucrose) was increased compared to an aerobic process at atmospheric pressure, and furthermore, the final concentration of cells increased with decreasing pressure in the batch process [47]. The effects of increased pressures (pabs = 6–15 bar) were studied as well in aerobic fed-batch processes with exponential feeding using a complex medium with 60 g L−1 glucose and 5 g L−1 yeast extract [48]. The authors showed that the aerobic growth of S. cerevisiae was strongly reduced at pressures above 10 bar. Although the pressures investigated in our studies with C. oleaginosus were significantly lower (1–2.5 bar compared to 6–15 bar), C. oleaginosus showed an inhibition towards CDW formation. In comparison to previous studies with very much higher aeration rates of up to 1.5 vvm at 1 bar [15], the lipid content of C. oleaginosus in our study reaches approximately the same values (≥80% (w/w)) at an absolute pressure of 1.5 bar, even though biomass formation is significantly reduced to about half of that previously shown. This suggests that the general assumption of increased gas transfer rates at elevated pressures results in increased metabolic activity, as indicated by lipid accumulation.
The differences observed in the cultivation of C. oleaginosus at various pressures indicate that specific physiological effects occur, especially at 1.5 bar, which lead to cell lysis and increased lipid contents. With increasing pressure, the solubility of CO2 in the medium is also increasing, which is described as altering the metabolic activity and cell viability in other yeasts and bacteria [38]. In addition, pressure-induced membrane tension can trigger hypo-osmotic-like responses in yeast, activating mechanosensitive ion channels located in the plasma membrane or organelles, which ultimately may lead to membrane leakage and cell lysis [49,50]. Increased lipid accumulation at 1.5 bar can be considered as a metabolic shift in response to external stress factors. The reason for the specific cell lysis occurring at 1.5 bar still remains unsolved and should be investigated in further experiments.
The composition of the fatty acid profile is presented in Table 3. It shows that up to 2 bar, the proportions of the fatty acids vary slightly. Just at a chain length of C18 a trend towards unsaturated fatty acids can be observed. When the pressure is increased to 2.5 bar, the proportion of unsaturated fatty acids in the C18 range is increased significantly. Compared to other investigations towards the lipid composition of microbial lipids from C. oleaginosus converting real lignocellulosic hydrolysate [22,51], the proportions found in this study seem to fit in the overall fatty acid range. Even though the proportion of C18:1 fatty acid with a value of about 50% of the fatty acids found in the microbial lipids is about 10% higher than in the recent study, the overall composition is comparable to those found in rape seed oil [52] or cocoa butter [53] and therefore suitable for the food production sector.
Table 3.
Proportion of the fatty acids found at the end of each process conducted at various pressures.
3.3. CO2-Formation and Respiratory Coefficients of C. oleaginosus at Various Pressures
The CO2 concentrations measured in the exhaust gas of the fed-batch processes, the total amounts of CO2 released per liquid volume, and the CO2 evolution rates (CER) are depicted in Figure 4a–c over process time. The summed-up CO2 production decreased with increasing absolute pressures of the four fed-batch processes with the lowest pressure showing the highest total CO2 production. CER and CO2 concentrations in the exhaust gas varied with the pressures as well, and followed the same patterns as a function of process time. First, a strong increase to a maximum, followed by a decrease until the sugars were totally consumed, before a second increase occurred after switching to pure acetate metabolism by the oleogenic yeast cells. Highest CO2 concentrations of up to 13.9% (v/v) were measured in the cultivation at atmospheric pressure. Decreasing maxima of the CO2 concentrations in the exhaust gas became obvious with increasing pressure (10.8%, 9.3%, and 8.4% CO2 at 1.5, 2.0, and 2.5 bar, respectively). CER and CO2 concentrations in the exhaust gas indicate exactly the process times when xylose was totally consumed by C. oleaginosus after 2.4, 2.7, 3.3, and 3.4 days with increasing pressures (indicated by vertical dotted lines in the Figures).
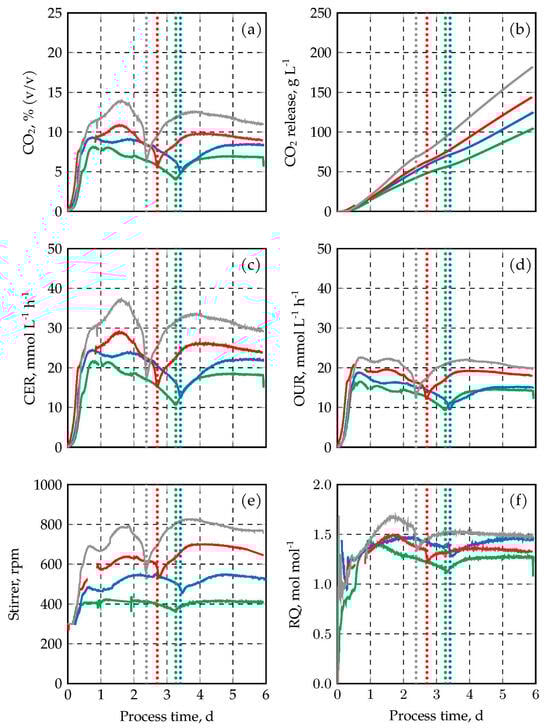
Figure 4.
CO2 concentrations (a), total amounts of CO2 released per liquid volume (b), and CER (c), OUR (d), agitation rate (e), and RQ (f) of C. oleaginosus. The results are indicated in gray (1.0 bar), red (1.5 bar), blue (2.0 bar), and green (2.5 bar). DO was kept at 30% air saturation at all times. The fed-batch processes at 1.0 bar and 1.5 bar were performed in duplicates (min–max values are shown by error bars). Total sugar consumption is indicated by vertical dotted lines.
The reduction in CO2 concentrations in the exhaust gas and the reduced CER at elevated pressures may be a consequence of the reduced metabolic activity of C. oleaginosus. Gas–liquid mass transfer in a stirred tank bioreactor depends on the partial pressures in the gas-phase, the solved gas concentrations in the liquid phase, the volumetric power input and the gassing rate. The solved oxygen concentrations in the liquid phase were kept constant at 30% air saturation by varying the volumetric power input (stirrer speed). Thus, with increasing total pressures the maximum stirrer speeds should decrease. This is clearly shown in Figure 4e.
The oxygen uptake rates (OUR), as shown in Figure 4d, did not follow exactly the patterns of the CER. As a consequence, the respiratory coefficients (RQ) varied as a function of process time (Figure 4f). After an initial increase up to the process times when the maxima of the CER were observed, the RQs decreased until the sugars were consumed by C. oleaginosus. Afterwards, a second increase was observed in all fermentation processes. The highest RQ of 1.68 mol CO2 produced/mol O2 consumed was measured in the fed-batch process at 1.0 bar after 1.7 days. The maxima of the other processes were 1.55, 1.48, and 1.44 mol CO2 produced/mol O2 consumed with increasing pressures. The theoretically expected RQ of oleogenic yeasts with acetate as sole carbon source is 1.4 mol CO2 produced/mol O2 consumed without cell mass formation [54]. This fits within the estimation error of our RQ data after sugar depletion (RQ = 1.3–1.5).
In the literature, there is no information available regarding the exhaust gas composition, as well as the uptake or production rates of gas components concerning C. oleaginosus. The data presented in this study underscore the necessity for further research towards the exact metabolic effect of pressure on this yeast. The reduction in metabolic activity of C. oleaginosus, as indicated by the decrease in CER and OUR, warrants further investigation.
For comparison, other aerobic processes with S. cerevisiae were examined to determine the CER during brewing fermentation [55]. The aforementioned study reveals that the CER throughout the process time up to 42 h is comparable to the CER observed with C. oleaginosus in this study. A similar comparison can be made regarding the OUR, where previous investigations with S. cerevisiae showed homologous values to those revealed in this study [56]. Although both comparisons have limitations, primarily due to the divergence of the microorganisms and the process time, they confirm that yeast cells produce a similar exhaust gas composition.
3.4. Lipid Yields with C. oleaginosus at Various Pressures
With 38% (w/w) the lipids yield was highest after 6 days in the fermentation process at 1.5 bar. Second best was the process operated at 1.0 bar (31% (w/w)). Increasing the pressure to 2.0 and 2.5 bar resulted in lipid yields of 23%. This indicates that pressures above 1.5 bar reduce the ability of C. oleaginosus for the microbial oil production.
The lipid yields with sugars applying nitrogen (molar C/N ratio in the medium of 300–900) or phosphorus limitation (molar C/P ratio in the medium above 9000) at 1 bar were around 23% (w/w) [45], and 31–32% [12,51] with C. oleaginosus. The molar C/N ratio in our studies, ranging from 15 to 30, and the C/P ratio, ranging from 16 to 31, indicate no nitrogen or phosphorus limitation at any time (Table 4). Here, the C/N and C/P ratios are shown exemplary for the process at 1.5 bar. The ratios for all other processes were nearly identical.
Table 4.
Molar ratios of carbon to nitrogen (C/N) and carbon to phosphorus (C/P) in the medium at the beginning and the end of the fermentation process after feeding of acetic acid at 1.5 bar.
The theoretical maximum lipid yield reported for C. oleaginosus is 33% (w/w) if glucose is used as sole carbon source [57]. Acetic acid co-feeding without nutrient limitation at a slightly elevated pressure of 1.5 bar, as shown in our study, thus improves the lipid yield considerably (38% (w/w)).
A lipid yield of 33.6% (w/w) was already reported with C. oleaginosus in a fed-batch process, converting genuine lignocellulosic hydrolysate with co-feeding of acetic acid at 1 bar [22]. This lipid yield is slightly improved compared to our results at 1 bar (31% (w/w)), most probably to the genuine lignocellulosic hydrolysate adding further nutrients to the fermentation process. The microbial oil yield improving properties of real hydrolysate was already shown with C. oleaginosus converting microalgae hydrolysate at atmospheric pressure with phosphorous limitation, which resulted in a lipid yield of 43% (w/w) in a membrane bioreactor compared to a synthetic hydrolysate with sugars (31% (w/w)) [12].
The distribution of carbon fed to the fermentation processes with C. oleaginosus is summarized in Figure 5, which shows that CO2 is the primary product at all absolute pressures. Increasing the pressure resulted in a reduction of carbon fixed in the lipid-free biomass from 20% at 1.0 bar to 17% at 2.5 bar, a reduction of carbon fixed in lipids from 25% to 21%, and an increase of carbon released as CO2 from 55% to 62%, except for the outstanding fermentation process at 1.5 bar. Only 13% of the carbon was fixed in lipid-free biomass or is released as CO2 (51%), but 36% was fixed in the microbial oil. The data show methodical robustness, because the carbon balances of all fermentation processes were closed with carbon recoveries between 99–103% (Table 5).
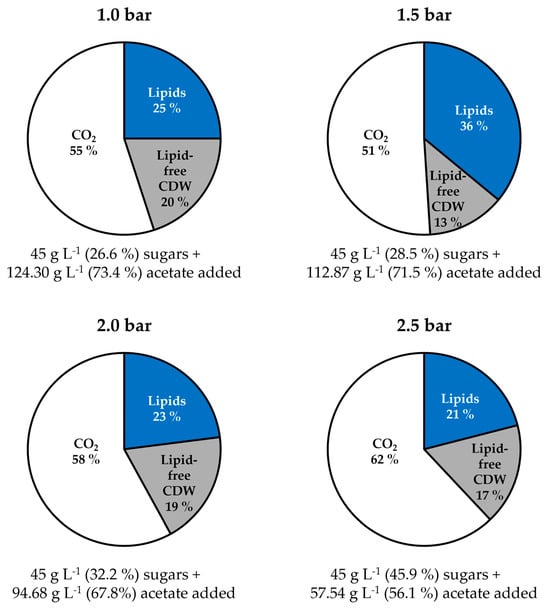
Figure 5.
Final molar carbon distribution in the products (%) produced by C. oleaginosus at various absolute pressures in fed-batch operated stirred tank bioreactors with pH-controlled acetic acid feeds.
Table 5.
Carbon recovery of the fed-batch processes with C. oleaginosus at varying absolute pressures.
4. Conclusions and Outlook
The pressure sensitivity of C. oleaginosus during sugar conversion with pH-controlled co-feeding of acetic acid, together with the outstanding lipid yields of 38% (w/w) at 1.5 bar total pressure, indicates potential challenges for scale-up at low air gassing rates (0.1 vvm). In full-scale bioreactors, the increased liquid height leads to higher hydrostatic pressures at the bottom. This may significantly reduce lipid yields, as observed in this study at constant absolute pressures of 2.0–2.5 bar, corresponding to a liquid height of 10–15 m in reactors operated at atmospheric pressure. In industrial scale bioreactors, yeast cells continuously circulate through zones of low and high pressure, with pressure fluctuations occurring on a multi-minute timescale. Future lab-scale studies with dynamic pressure regimes (1–2.5 bar) are needed to evaluate scale-up feasibility.
Another issue that deserves attention during scale-up is the intrinsic heterogeneity in large-scale bioreactors. With increasing bioreactor volumes, concentration gradients are evolving, especially for substances that are fed into the bioreactor at a single position but consumed throughout the entire reactor volume, such as oxygen through aeration, resulting in DO gradients, or titration agents (acetic acid), resulting in pH- and acetate-gradients. Effects on the metabolism of yeast cells may occur if the substrates become temporarily limiting or if the cells pass through zones with unfavorable pH. In our lab-scale studies, acetate was not a limiting substrate (Figure 2d), and the DO set-point of 30% air saturation was chosen far away from limiting conditions for C. oleaginosus [51].
More than 50% of the carbon fed was released as CO2, a typical outcome of many aerobic fermentation processes. The proportion of carbon released through the exhaust gas represents one of the major limitations to carbon efficiency in aerobic processes. The capture and reuse of biogenic CO2 would thus be necessary to achieve a climate-neutral production of chemicals from renewable resources and to improve process efficiency. Capturing CO2 from various gas mixtures is well-studied and widely utilized in industrial applications [58,59].
In the past, various approaches have been investigated to produce acetic acid from biogenic CO2 and H2 in gas fermentation processes. With further research done towards the implementation of (i) autotrophic gas fermentation processes for acetate production on an industrial scale, and (ii) microbial oil production processes from lignocellulosic hydrolysates and acetic acid, the sustainable utilization of waste streams (agricultural residues) from food processing is a promising perspective for the reduction in climate-active gases in this sector.
It must be noted that the extraction of yeast oils, which are typically accumulated in lipid bodies within the yeast cells, is a challenging task. Several approaches are currently being investigated, ranging from ultrasonic-assisted extraction with a lipid yield of 37% to high-pressure homogenization with a lipid yield of 75% [60].
However, as long as the metabolic understanding of the pressure-dependent lipid biosynthesis of C. oleaginosus is lacking, which was not the subject of this work, neither can pressure-independent oil-producing C. oleaginosus cells be designed by metabolic engineering, nor can the scale-up risks be overcome. The application of omic tools (fluxom, transcriptom, and proteom analysis) in fermentations at varying absolute pressures may provide crucial insights into the molecular mechanisms that govern lipid metabolism under pressure and guide future strain optimization strategies in C. oleaginosus.
Author Contributions
Conceptualization, F.H. and D.W.-B.; methodology, validation, formal analysis, and investigation, F.H., N.K. and E.P.; writing—original draft preparation, F.H.; writing—review and editing, F.H. and D.W.-B.; visualization, F.H.; supervision, D.W.-B.; project administration, D.W.-B.; funding acquisition, D.W.-B. All authors have read and agreed to the published version of the manuscript.
Funding
This research was funded by the Federal Ministry of Research, Technology and Space (BMFTR, Berlin, Germany) within the research project ‘H2-Reallabor Burghausen/ChemDelta Bavaria’ under grant number 03SF0705B.
Data Availability Statement
Data presented in this manuscript are available upon request from the corresponding author.
Acknowledgments
The authors thank Manuel Seiler at the Analytical Department of the TUM Catalysis Center (CRC) for performing the elemental analysis. Thanks to Ingmar Polte, Ann-Lena Thurn, Fabian Mittermeier, and Ayse Koruyucu at the Chair of Biochemical Engineering (TUM), and Emil Korzin, and Simon Gregg at the TUM Pilot Plant for Industrial Biotechnology, Garching, Germany for technical support and many helpful discussions. The fruitful cooperation within the ‘H2-Reallabor Burghausen/ChemDelta Bavaria’ with Thomas Brück and Daniel Garbe at the Werner Siemens-Chair of Synthetic Biotechnology (TUM) is acknowledged as well. The support of Fabian Herrmann by the TUM Graduate School is acknowledged as well.
Conflicts of Interest
The authors declare no conflicts of interest. The funders had no role in the design of the study; in the collection, analyses, or interpretation of data; in the writing of the manuscript; or in the decision to publish the results.
Abbreviations
The following abbreviations are used in this manuscript:
| vvm | Vessel Volumes per Minute |
| w/w | Weight per Weight in % |
| SCO | Single-Cell Oils |
| DO | Dissolved oxygen concentration |
| STR | Stirred Tank Reactor |
| YPD | Yeast-Peptone-Dextrose |
| DSMZ | Deutsche Sammlung für Mikroorganismen und Zellkulturen Braunschweig |
| KOH | Potassium hydroxide |
| CDW | Cell Dry Weight |
| OD600 | Optical Density at a wavelength of light of 600 nm |
| PBS | Phosphate-buffered saline solution |
| RI | Refractive Index |
| GC | Gas Chromatography |
| HPLC | High-Performance Liquid Chromatography |
| FAMEs | Fatty Acid Methyl Esters |
| FID | Flame Ionization Detector |
| CHNS | Carbon-Hydrogen-Nitrogen-Sulfur |
| C/N | Ratio of Carbon to Nitrogen |
| C/P | Ratio of Carbon to Phosphorus |
| MC,in | Mass of Carbon introduced |
| MC,out | Mass of Carbon recovered |
| MS | Mass of Sugars |
| xC, S | Fraction of Carbon in Sugars |
| MAc | Mass of Acetic Acid |
| xC, Ac | Fraction of Carbon in Acetic Acid |
| MComplex | Mass of Complex Components |
| xC,Complex | Fraction of Complex Components |
| MX | Mass of Biomass |
| xC,X | Fraction of Carbon in Biomass |
| MLipid | Mass of Lipids |
| xC,Lipid | Fraction of Carbon in Lipids |
| MCO2 | Mass of Carbon Dioxide |
| xC,CO2 | Fraction of Carbon in CO2 |
| RC | Carbon Recovery |
| ηC | Yield of carbon to lipids |
| Pabs | Absolute Pressure |
| CER | Carbon Emission Rate |
| OUR | Oxygen Uptake Rate |
| RQ | Respiratory Coefficient |
Appendix A
Table A1.
Physiological and production parameters of the cultures at different operating pressures.
Table A1.
Physiological and production parameters of the cultures at different operating pressures.
| Pressure | CX,max, g L−1 | CLipid,max, g L−1 | xLipid, % (w/w) | YLipid, g g−1 | rAcetic A,max, g L−1 h−1 | qGlucose,max, mmol gCDW−1 h−1 | qXylose,max, mmol gCDW−1 h−1 |
|---|---|---|---|---|---|---|---|
| 1.0 bar | 54.97 | 28.12 | 53.45 | 0.31 | 1.03 | 0.113 | 0.128 |
| 1.5 bar | 39.99 | 33.17 | 83.60 | 0.38 | 0.83 | 0.204 | 0.068 |
| 2.0 bar | 34.33 | 17.51 | 51.02 | 0.23 | 0.66 | 0.179 | 0.026 |
| 2.5 bar | 30.15 | 12.98 | 43.06 | 0.23 | 0.41 | 0.120 | 0.048 |
References
- Mueller, S.A.; Anderson, J.E.; Wallington, T.J. Impact of biofuel production and other supply and demand factors on food price increases in 2008. Biomass Bioenergy 2011, 35, 1623–1632. [Google Scholar] [CrossRef]
- Nonhebel, S. Global food supply and the impacts of increased use of biofuels. Energy 2012, 37, 115–121. [Google Scholar] [CrossRef]
- Singhania, R.R.; Patel, A.K.; Pandey, A. Biotechnology for agricultural waste recycling. In Current Developments in Biotechnology and Bioengineering; Elsevier: Amsterdam, The Netherlands, 2017; pp. 223–240. [Google Scholar]
- Mittermeier, F.; Fischer, F.; Hauke, S.; Hirschmann, P.; Weuster-Botz, D. Valorization of wheat bran by co-cultivation of fungi with integrated hydrolysis to provide sugars and animal feed. BioTech 2024, 13, 15. [Google Scholar] [CrossRef] [PubMed]
- Knesebeck, M.; Schäfer, D.; Schmitz, K.; Rüllke, M.; Benz, J.P.; Weuster-Botz, D. Enzymatic one-pot hydrolysis of extracted sugar beet press pulp after solid-state fermentation with an engineered Aspergillus niger strain. Fermentation 2023, 9, 582. [Google Scholar] [CrossRef]
- Passoth, V.; Sandgren, M. Biofuel production from straw hydrolysates: Current achievements and perspectives. Appl. Microbiol. Biotechnol. 2019, 103, 5105–5116. [Google Scholar] [CrossRef]
- Sreeharsha, R.V.; Mohan, S.V. Obscure yet promising oleaginous yeasts for fuel and chemical production. Trends Biotechnol. 2020, 38, 873–887. [Google Scholar] [CrossRef]
- Passoth, V. Lipids of yeasts and filamentous fungi and their importance for biotechnology. In Biotechnology of Yeasts and Filamentous Fungi; Sibirny, A.A., Ed.; Springer International Publishing Imprint: Berlin/Heidelberg, Germany, 2017; pp. 149–204. [Google Scholar]
- Duman-Özdamar, Z.E.; Martins Dos Santos, V.A.P.; Hugenholtz, J.; Suarez-Diez, M. Tailoring and optimizing fatty acid production by oleaginous yeasts through the systematic exploration of their physiological fitness. Microb. Cell Factories 2022, 21, 228. [Google Scholar] [CrossRef]
- Bettencourt, S.; Miranda, C.; Pozdniakova, T.A.; Sampaio, P.; Franco-Duarte, R.; Pais, C. Single cell oil production by oleaginous yeasts grown in synthetic and waste-derived volatile fatty acids. Microorganisms 2020, 8, 1809. [Google Scholar] [CrossRef]
- Konzock, O.; Matsushita, Y.; Zaghen, S.; Sako, A.; Norbeck, J. Altering the fatty acid profile of Yarrowia lipolytica to mimic cocoa butter by genetic engineering of desaturases. Microb. Cell Factories 2022, 21, 25. [Google Scholar] [CrossRef]
- Meo, A.; Priebe, X.L.; Weuster-Botz, D. Lipid production with Trichosporon oleaginosus in a membrane bioreactor using microalgae hydrolysate. J. Biotechnol. 2017, 241, 1–10. [Google Scholar] [CrossRef]
- Hassan, M.; Blanc, P.J.; Granger, L.-M.; Pareilleux, A.; Goma, G. Influence of nitrogen and iron limitations on lipid production by Cryptococcus curvatus grown in batch and fed-batch culture. Process Biochem. 1996, 31, 355–361. [Google Scholar] [CrossRef]
- Zhou, W.; Tang, M.; Zou, T.; Peng, N.; Zhao, M.; Gong, Z. Phosphate removal combined with acetate supplementation enhances lipid production from water hyacinth by Cutaneotrichosporon oleaginosum. Biotechnol. Biofuels 2019, 12, 148. [Google Scholar] [CrossRef] [PubMed]
- Masri, M.A.; Garbe, D.; Mehlmer, N.; Brück, T.B. A sustainable, high-performance process for the economic production of waste-free microbial oils that can replace plant-based equivalents. Energy Environ. Sci. 2019, 12, 2717–2732. [Google Scholar] [CrossRef]
- Harahap, B.M.; Ahring, B.K. Acetate production from syngas produced from lignocellulosic biomass materials along with gaseous fermentation of the syngas: A review. Microorganisms 2023, 11, 995. [Google Scholar] [CrossRef]
- Kantzow, C.; Mayer, A.; Weuster-Botz, D. Continuous gas fermentation by Acetobacterium woodii in a submerged membrane reactor with full cell retention. J. Biotechnol. 2015, 212, 11–18. [Google Scholar] [CrossRef]
- Kantzow, C.; Weuster-Botz, D. Effects of hydrogen partial pressure on autotrophic growth and product formation of Acetobacterium woodii. Bioprocess Biosyst. Eng. 2016, 39, 1325–1330. [Google Scholar] [CrossRef]
- Demler, M.; Weuster-Botz, D. Reaction engineering analysis of hydrogenotrophic production of acetic acid by Acetobacterium woodii. Biotechnol. Bioeng. 2011, 108, 470–474. [Google Scholar] [CrossRef]
- Straub, M.; Demler, M.; Weuster-Botz, D.; Dürre, P. Selective enhancement of autotrophic acetate production with genetically modified Acetobacterium woodii. J. Biotechnol. 2014, 178, 67–72. [Google Scholar] [CrossRef]
- Mayer, A.; Schadler, T.; Trunz, S.; Stelzer, T.; Weuster-Botz, D. Carbon monoxide conversion with Clostridium aceticum. Biotechnol. Bioeng. 2018, 115, 2740–2750. [Google Scholar] [CrossRef]
- Rerop, Z.S.; Stellner, N.I.; Graban, P.; Haack, M.; Mehlmer, N.; Masri, M.; Brück, T.B. Bioconversion of a lignocellulosic hydrolysate to single cell oil for biofuel production in a cost-efficient fermentation process. Fermentation 2023, 9, 189. [Google Scholar] [CrossRef]
- Ringel, M.; Paper, M.; Willing, M.; Schneider, M.; Melcher, F.; Stellner, N.I.; Bruck, T. Sustainable Lipid Production with Cutaneotrichosporon oleaginosus: Insights into Metabolism, Feedstock Valorization and Bioprocess Development. Microorganisms 2025, 13, 1988. [Google Scholar] [CrossRef] [PubMed]
- Evans, C.T.; Ratledge, C. A comparison of the oleaginous yeast, Candida curvata, grown on different carbon sources in continuous and batch culture. Lipids 1983, 18, 623–629. [Google Scholar] [CrossRef] [PubMed]
- Liu, J.; Huang, X.; Chen, R.; Yuan, M.; Liu, J. Efficient bioconversion of high-content volatile fatty acids into microbial lipids by Cryptococcus curvatus ATCC 20509. Bioresour. Technol. 2017, 239, 394–401. [Google Scholar] [CrossRef] [PubMed]
- Gong, Z.; Zhou, W.; Shen, H.; Yang, Z.; Wang, G.; Zuo, Z.; Hou, Y.; Zhao, Z.K. Co-fermentation of acetate and sugars facilitating microbial lipid production on acetate-rich biomass hydrolysates. Bioresour. Technol. 2016, 207, 102–108. [Google Scholar] [CrossRef]
- Moon, N.J.; Hammond, E.G.; Glatz, B.A. Conversion of cheese whey and whey permeate to oil and single-cell protein. J. Dairy Sci. 1978, 61, 1537–1547. [Google Scholar] [CrossRef]
- Wu, S.; Hu, C.; Zhao, X.; Zhao, Z.K. Production of lipid from N-acetylglucosamine by Cryptococcus curvatus. Eur. J. Lipid Sci. Technol. 2010, 112, 727–733. [Google Scholar] [CrossRef]
- Meesters, P.A.E.P.; Huijberts, G.N.M. High-cell-density cultivation of the lipid accumulating yeast Cryptococcus curvatus using glycerol as a carbon source. Appl. Microbiol. Biotechnol. 1996, 45, 575–579. [Google Scholar] [CrossRef]
- Seo, Y.; Lee, I.; Han, J. Cultivation and lipid production of yeast Cryptococcus curvatus using pretreated waste active sludge supernatant. Bioresour Technol. 2013, 135, 304–308. [Google Scholar] [CrossRef]
- Duman-Ozdamar, Z.E.; Julsing, M.K.; Martins Dos Santos, V.A.P.; Hugenholtz, J.; Suarez-Diez, M. Model-Driven Engineering of Yarrowia lipolytica for Improved Microbial Oil Production. Microb. Biotechnol. 2025, 18, e70089. [Google Scholar] [CrossRef]
- Di Fidio, N.; Minonne, F.; Antonetti, C.; Raspolli Galletti, A.M. Cutaneotrichosporon oleaginosus: A versatile whole-cell biocatalyst for the production of single-cell oil from agro-Industrial wastes. Catalysts 2021, 11, 1291. [Google Scholar] [CrossRef]
- Chmiel, H.; Weuster-Botz, D. Bioreaktoren. In Bioprozesstechnik; Springer Spektrum: Berlin/Heidelberg, Germany, 2018; pp. 157–229. [Google Scholar]
- Nadal-Rey, G.; McClure, D.D.; Kavanagh, J.M.; Cassells, B.; Cornelissen, S.; Fletcher, D.F.; Gernaey, K.V. Development of dynamic compartment models for industrial aerobic fed-batch fermentation processes. Chem. Eng. J. 2021, 420, 130402. [Google Scholar] [CrossRef]
- Nadal-Rey, G.; McClure, D.D.; Kavanagh, J.M.; Cornelissen, S.; Fletcher, D.F.; Gernaey, K.V. Understanding gradients in industrial bioreactors. Biotechnol. Adv. 2021, 46, 107660. [Google Scholar] [CrossRef] [PubMed]
- Lopes, M.; Belo, I.; Mota, M. Over-pressurized bioreactors: Application to microbial cell cultures. Biotechnol. Prog. 2014, 30, 767–775. [Google Scholar] [CrossRef] [PubMed]
- Garcia-Ochoa, F.; Gomez, E. Bioreactor scale-up and oxygen transfer rate in microbial processes: An overview. Biotechnol. Adv. 2009, 27, 153–176. [Google Scholar] [CrossRef]
- Jones, R.P.; Greenfield Paul, F. Effect of carbon dioxide on yeast growth and fermentation. Enzym. Microb. Technol. 1982, 4, 210–223. [Google Scholar] [CrossRef]
- Liang, Y.; Jarosz, K.; Wardlow, A.T.; Zhang, J.; Cui, Y. Lipid production by Cryptococcus curvatus on hydrolysates derived from corn fiber and sweet sorghum bagasse following dilute acid pretreatment. Appl. Biochem. Biotechnol. 2014, 173, 2086–2098. [Google Scholar] [CrossRef]
- Li, B.Z.; Balan, V.; Yuan, Y.J.; Dale, B.E. Process optimization to convert forage and sweet sorghum bagasse to ethanol based on ammonia fiber expansion (AFEX) pretreatment. Bioresour. Technol. 2010, 101, 1285–1292. [Google Scholar] [CrossRef]
- Dourou, M.; Aggeli, D.; Papanikolaou, S.; Aggelis, G. Critical steps in carbon metabolism affecting lipid accumulation and their regulation in oleaginous microorganisms. Appl. Microbiol. Biotechnol. 2018, 102, 2509–2523. [Google Scholar] [CrossRef]
- Gong, Z.; Shen, H.; Zhou, W.; Wang, Y.; Yang, X.; Zhao, Z.K. Efficient conversion of acetate into lipids by the oleaginous yeast Cryptococcus curvatus. Biotechnol. Biofuels 2015, 8, 189. [Google Scholar] [CrossRef]
- Griffiths, M.J.; van Hille, R.P.; Harrison, S.T.L. Selection of direct transesterification as the preferred method for assay of fatty acid content of microalgae. Lipids 2010, 45, 1053–1060. [Google Scholar] [CrossRef]
- Pfaffinger, C.E.; Schöne, D.; Trunz, S.; Löwe, H.; Weuster-Botz, D. Model-based optimization of microalgae areal productivity in flat-plate gas-lift photobioreactors. Algal Res. 2016, 20, 153–163. [Google Scholar] [CrossRef]
- Sànchez i Nogué, V.; Black, B.A.; Kruger, J.S.; Singer, C.A.; Ramirez, K.J.; Reed, M.L.; Cleveland, N.S.; Singer, E.R.; Yi, X.; Yeap, R.Y.; et al. Integrated diesel production from lignocellulosic sugars via oleaginous yeast. Green Chem. 2018, 20, 4349–4365. [Google Scholar] [CrossRef]
- Gong, Z.; Shen, H.; Wang, Q.; Yang, X.; Xie, H.; Zhao, Z.K. Efficient conversion of biomass into lipids by using the simultaneous saccharification and enhanced lipid production process. Biotechnol. Biofuels 2013, 6, 36. [Google Scholar] [CrossRef] [PubMed]
- Guadalupe-Daqui, M.; Chen, M.; Sarnoski, P.J.; Goodrich-Schneider, R.M.; MacIntosh, A.J. Impacts of reduced (vacuum) pressure on yeast fermentation as assessed using standard methods and automated image analysis. Fermentation 2023, 9, 155. [Google Scholar] [CrossRef]
- Belo, I.; Pinheiro, R.; Mota, M. Morphological and physiological changes in Saccharomyces cerevisiae by oxidative stress from hyperbaric air. J. Biotechnol. 2005, 115, 3097–3404. [Google Scholar] [CrossRef]
- Nakayama, Y.; Yoshimura, K.; Iida, H. Organellar mechanosensitive channels in fission yeast regulate the hypo-osmotic shock response. Nat. Commun. 2012, 3, 1020. [Google Scholar] [CrossRef]
- Gustin, C.M.; Zhou, X.-L.; Martinac, B.; Kung, C. A mechanosensitive ion channel in the yeast plasma membrane. Science 1988, 242, 762–765. [Google Scholar] [CrossRef]
- Koruyucu, A.; Blums, K.; Peest, T.; Schmack-Rauscher, L.; Brück, T.; Weuster-Botz, D. High-cell-density yeast oil production with diluted substrates imitating microalgae hydrolysate using a membrane bioreactor. Energies 2023, 16, 1757. [Google Scholar] [CrossRef]
- Przybylski, R. Canola/Rapeseed Oil. In Vegetable Oils in Food Technology; Wiley-Blackwell: Hoboken, NJ, USA, 2011; pp. 107–136. [Google Scholar]
- Chen, Y.W.; Mackley, M.R. Flexible chocolate. Soft Matter 2006, 2, 304–309. [Google Scholar] [CrossRef]
- Ratledge, C.W.; James, P. The biochemistry and molecular biology of lipid accumulation in oleaginous microorganisms. In Advances in Applied Microbiology; Allen, I., Laskin, J.W.B., Gadd, G.M., Eds.; Elsevier: Amsterdam, The Netherlands, 2002; Volume 51, pp. 1–52. [Google Scholar]
- Daoud, I.S.; Searle, B.A. On-Line Monitoring of Brewery Fermentation by Measurement of Co2evolution Rate. J. Inst. Brew. 1990, 96, 297–302. [Google Scholar] [CrossRef]
- Kirk, T.V.; Marques, M.P.; Radhakrishnan, A.N.; Szita, N. Quantification of the oxygen uptake rate in a dissolved oxygen controlled oscillating jet-driven microbioreactor. J. Chem. Technol. Biotechnol. 2016, 91, 823–831. [Google Scholar] [CrossRef]
- Ratledge, C. Microbial oil and fats: An assessment of their commercial potential. Prog. Ind. Microbiol. 1982, 16, 119–206. [Google Scholar]
- Thiedemann, T.M.; Wark, M. A compact review of current technologies for carbon capture as well as storing and utilizing the captured CO2. Processes 2025, 13, 283. [Google Scholar] [CrossRef]
- Fernández, J.R. An overview of advances in CO2 capture technologies. Energies 2023, 16, 1413. [Google Scholar] [CrossRef]
- Zainuddin, M.F.; Fai, C.K.; Ariff, A.B.; Rios-Solis, L.; Halim, M. Current Pretreatment/Cell Disruption and Extraction Methods Used to Improve Intracellular Lipid Recovery from Oleaginous Yeasts. Microorganisms 2021, 9, 251. [Google Scholar] [CrossRef]


Disclaimer/Publisher’s Note: The statements, opinions and data contained in all publications are solely those of the individual author(s) and contributor(s) and not of MDPI and/or the editor(s). MDPI and/or the editor(s) disclaim responsibility for any injury to people or property resulting from any ideas, methods, instructions or products referred to in the content. |
© 2026 by the authors. Licensee MDPI, Basel, Switzerland. This article is an open access article distributed under the terms and conditions of the Creative Commons Attribution (CC BY) license.