Abstract
The growing share of renewable energy resources highlights the need for reliable energy management in frequency regulation. Multi-type battery energy storage system (M-BESS) aggregators are promising resources, yet their heterogeneous costs, capacities, and lifetimes make conventional state-of-charge (SOC) balancing insufficient. This paper develops a coordinated SOC and state-of-health (SOH) balancing method for M-BESS energy management under frequency regulation. An aggregator profit model is first formulated to integrate energy trading benefits and frequency regulation revenues. Then, a dispatchability model is established to capture differences in unit capacity, degradation cost, and operating states, ensuring stable response to frequency regulation signals. Based on these models, a coordinated allocation framework is designed to balance SOC and SOH while improving dispatchability. Case studies with real project data show that the proposed method limits the maximum profit loss ratio to 0.95%, enhances SOH consistency, and improves dispatchability accuracy by more than 10% compared with conventional SOC-based approaches. These results confirm that the method can achieve a practical trade-off between economic benefit, battery health, and reliable participation in frequency regulation markets.
1. Introduction
1.1. Introduction and Background
The ongoing energy transition and China’s dual-carbon targets, which aim to peak carbon emissions and achieve carbon neutrality, have jointly accelerated the large-scale integration of intermittent renewable energy. Among these resources, wind power and photovoltaic energy are the most prominent contributors. As the penetration level of renewables continues to rise, the power system is confronted with a structural shortage of flexibility, and the annual demand for flexible regulating resources keeps climbing [1,2]. Among such resources, BESSs have emerged as the fastest-growing technology thanks to their highly agile charge–discharge characteristics [3,4]. Contemporary battery energy storage power station (BESS) implementations mainly rely on lithium-ion, flow, and sodium–sulfur batteries, each exhibiting distinct advantages and challenges in terms of cost and performance [5,6,7].
To make full use of existing land, infrastructure, and electrical interfaces—while retaining the ability to adapt rapidly to evolving market requirements—an increasingly attractive solution is to aggregate multi-type battery energy storage power stations (M-BESSs) under a single operator. Recent deployments illustrate the growing interest in heterogeneous storage aggregation. In Gansu Province, a 50 MW flywheel facility operates alongside a 50 MW, 200 MWh all-vanadium redox-flow battery and a 200 MW, 400 MWh graphene-composite battery under a single operator. A multi-technology aggregator has also entered pilot operation in Chile’s National Electric System. These cases underscore the practical relevance of managing performance diversity within a unified coordination scheme.
In typical applications, multiple independent storage subsystems of different chemistries—installed at the same grid node and funded by the same investor—are centrally managed by one aggregator [8]. Yet present-day operational strategies seldom account for the pronounced heterogeneity among these subsystems in terms of capital cost, cycle life, response accuracy and speed, rated capacity, and rated power [9]. Consequently, overall profitability remains sub-optimal; moreover, disparate operating hours, duty cycles, and internal characteristics cause divergent state of charge (SOC) and state of health (SOH) trajectories, jeopardizing sustained asset performance [10]. Enhancing aggregator revenue and improving dispatchability therefore calls for management schemes that explicitly respect performance diversity. Recognizing that an aggregator’s profit is primarily determined by operating costs and compensation from the grid, the present work focuses on optimizing these two factors.
In this context, M-BESS aggregators are becoming vital participants in frequency regulation and ancillary-service markets. However, the inherent heterogeneity in battery lifetime and capacity makes conventional SOC-based strategies insufficient to safeguard both dispatchability and long-term economic viability. This emerging challenge calls for integrated approaches that explicitly coordinate SOC and SOH within a unified optimization framework.
1.2. Literature Review and Research Gaps
1.2.1. Revenue Modeling
When evaluating frequency regulation income, the levelized cost of electricity (LCOE)—which quantifies the comprehensive cost per unit of electric energy—serves as a core metric for assessing regulation costs. Cao et al. [11] derives the LCOE from capital and O&M expenses but neglects charging costs. Cruz et al. [12,13] incorporate charging costs and, for a single-technology BESS, propose LCOE-based power allocation strategies. Moving a step further, Shang et al. [14] extends the LCOE concept to M-BESSs, yet omits the regulation-specific costs borne in ancillary-service markets. Wang et al. [15] analyzes an LCOE that includes regulation effects, but fails to capture practical complexities such as response accuracy and speed. Elkholy et al. [16] examines storage revenues in real-world regulation scenarios from an investment standpoint, treating daily charge/discharge energy as fixed and overlooking the dynamic impact of operational patterns. Overall, these LCOE-centered approaches inadequately coordinate disparities in rated power, energy capacity, and response performance, leading to modest compensation in frequency regulation markets [17,18]. Hence, a more comprehensive revenue model tailored to M-BESS operation is required.
1.2.2. Dispatchability Modeling
Sustaining robust dispatchability—the ability of a station to maintain optimal operating status and ensure continuous power delivery—is another central issue. SOC is widely accepted as the key indicator of dispatchability, and thus SOC-oriented power-sharing rules dominate current practice. Elkholy et al. [16] introduces an SOC-threshold method for M-BESSs without detailing control implementation, while Horrillo et al. [19] proposes the power distribution mechanism of MSC-EMS based on SOC and realizes the control of the system. Xiao et al. [20] divides BESSs into multiple subgroups of battery energy storage, which can independently respond to power instructions. Chang et al. [21] further proposes a two-layer structure method. The upper layer defines the fluctuation coefficient to avoid overcharging and over-discharging, and the lower layer calculates the SOC allocation factor to allocate power instructions. Nevertheless, these methods disregard how command tracking impacts SOC across batteries of unequal capacity, often causing abrupt SOC swings and poor balancing. Li et al. [22] attempts SOC self-recovery by decomposing and reconstructing power commands based on the proportionality between SOC and cumulative discharge, but focuses exclusively on single-technology plants. Most prior work addresses only SOC and overlooks SOH—another decisive health metric. Liu et al. [23] augments SOC balancing with SOH considerations by classifying outlier groups and enforcing dual-indicator balancing rules. Still, the studies above seldom discuss communication architectures. Accordingly, this paper adopts a fixed-time consensus algorithm to coordinate inter-unit data sharing. Despite marked progress in SOC control, handling capacity and life-span diversity together with SOH management in a distributed M-BESS remains largely unexplored.
The analysis above reveals two critical gaps in current M-BESS research: (1) Revenue Optimization: heterogeneity in investment costs, response accuracy, and speed renders traditional SOC-balancing power allocation strategies incapable of extracting the full value of each storage subsystem, preventing profit maximization for the aggregator. (2) Dispatchability Preservation: Divergent capacities and life spans drive significant differences in SOC and SOH during regulation. Existing strategies fail to provide effective balancing under distributed architectures, ultimately undermining station-level dispatchability.
In summary, this paper aims to propose a distributed power allocation strategy for M-BESS aggregators that jointly considers revenue maximization and dispatchability. By integrating SOC and SOH into the modeling framework and validating with real AGC data, the study addresses existing gaps in profitability modeling and lifetime consistency.
1.3. Proposed Methodology and Contributions
To address these issues, we develop a distributed SOC-and-SOH balanced power allocation strategy that simultaneously maximizes frequency regulation revenue and maintains dispatchability for M-BESS assets, as summarized in Figure 1.
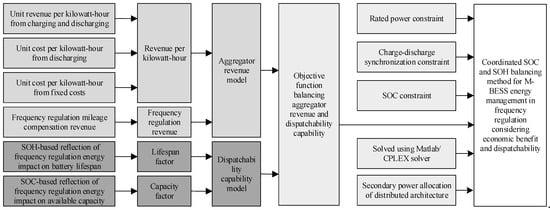
Figure 1.
Implementation process of power allocation strategy for multi-type energy storage power station.
Development of a comprehensive revenue model: we incorporate differences in regulation performance, capital expenditure, and unit-energy costs to construct an LCOE-based energy-revenue term. Historical data and mileage payments are then used to develop a comprehensive frequency regulation revenue model.
Establishment of a dispatchability model: SOH quantifies the life-cycle degradation caused by regulation energy, while SOC measures the available capacity. These two indicators are synthesized into lifetime and capacity factors, which together form the dispatchability model for M-BESSs.
Design of a distributed power allocation strategy: based on the aforementioned models and considering distributed communication, we design a power allocation strategy that integrates the frequency regulation revenue model and the dispatchable capacity model.
Simulation results show that the power allocation method proposed in this paper can effectively handle optimization problems in scenarios involving battery energy storage systems with different performance characteristics and improve energy storage revenue.
Data Collection and Preprocessing: real-time collection of SOC and SOH data from battery storage systems and automatic generation control (AGC) regulation commands from the grid, ensuring data completeness and real-time accuracy.
Revenue Calculation and LCOE Model Construction: calculate the frequency regulation revenue and use the LCOE model to comprehensively assess the cost and revenue of the battery storage units.
Dispatchability Factor Calculation: calculate the dispatchability factor of the battery storage systems, ensuring optimal dispatchability under varying SOC and SOH states.
Power Allocation and Optimization: use the CPLEX optimization solver to design the power allocation strategy, ensuring SOC and SOH balance.
State Update and Adjustment: real-time adjustment of SOC and SOH states through feedback mechanisms, ensuring long-term health and optimal operation of the battery system.
2. Aggregator-Side Revenue Model for Frequency Regulation
Owing to pronounced differences in cost structure and regulation performance among battery technologies and manufacturing batches, the contribution of each subsystem to the overall M-BESS revenue is highly non-uniform. Hence, the proposed modeling framework evaluates aggregator income from two complementary perspectives—cost composition and performance assessment.
Assume the aggregator operates an M-BESS comprising n categories of battery storage systems denoted by n1, n2, …, nn. When the station provides frequency regulation service, every category earns two kinds of revenue: energy-throughput revenue—the remuneration per unit of delivered energy after deducting the LCOE; regulation-performance revenue—the mileage-based compensation defined in the Implementation Rules for the Guangdong Frequency-Regulation Ancillary-Service Market. Because the total regulating capacity of the station is fixed, capacity-reservation payments are omitted.
2.1. Revenue per Kilowatt-Hour
Consider battery system j belonging to category nj. Its instantaneous energy-throughput revenue is
where is the unit compensation price offered by the grid operator; is the LCOE of system in category ; is the output power of system at time t; is the command dispatch interval.
Firstly, from the perspective of cost composition, this study constructs a calculation model for the LCOE under frequency regulation scenarios, drawing on the methodology of the life-cycle LCOE for energy storage systems.
Following the cost-breakdown method of Ref. [12], the net present value (NPV) of the total life-cycle cost, , for a storage system with a service life of years is [24]
where is the initial capital expenditure; is the annual operation-and-maintenance (O&M) cost; is the replacement cost; is the charging-energy cost; is the discount rate.
Because the present study focuses on short-term M-BESS scheduling, replacement events are neglected, yielding:
where is the wholesale electricity price; is the energy taken from the grid per charge cycle; is the number of cycles per year; is the average depth of discharge; is the round-trip efficiency; collects all fixed costs and represents the discounted sum of charging expenses.
According to Ref. [12], the annual dispatched energy, that is the energy actually fed into the grid, is the net amount delivered during one year. Its discounted total over the entire life-cycle is [25]
where denotes energy storage capacity; denotes self-discharge losses; is the aging factor; and denotes the degradation-related efficiency loss.
Previous studies typically assume a constant depth of discharge (DoD) across the lifetime of a storage system. In practice, regulation commands are stochastic, and a battery may perform multiple shallow charging and discharging operations within a single dispatch interval. Such irregular cycling modifies the effective energy throughput and creates a non-linear relationship between the discharged energy and the nominal DoD, which must be accounted for in accurate LCOE estimation.
Invoking Symons’ Hypothesis 1, the calendar life of a battery can be expressed as the sum of its effective ampere-hour throughput. When the rated cycle life is reached, the cumulative discharged energy equals the effective throughput; hence, the total lifetime energy is taken as a constant:
where is the discharge depth per cycle; is the rated number of cycles. Accordingly, the life-cycle cost per unit energy becomes
where aggregates all fixed costs on a unit-energy basis; represents the charging-energy cost per unit of discharged energy.
Because electro-chemical heat generation, ohmic conduction losses, and other internal phenomena preclude 100% round-trip efficiency [26], combining Ref. [12] with the foregoing analysis yields the following:
Based on the first capacity calculation, the cost for this time can be simplified further since it does not involve annualization:
Because discharging an energy packet consumes during charging and to restore the initial state, assuming that , it follows that
where is the discharged energy during the regulation action. The formula for calculating the unit cost of the entire life-cycle of each energy storage system in the process is as follows:
Among them, is a function related to the discharge scheduling capacity, which consists of the fixed investment unit electricity cost and the discharge unit cost generated by the discharge.
In the frequency regulation context, charging is dictated by the grid and supplies energy to the battery, so the associated electricity purchase is not treated as a cost to the storage owner. By contrast, discharging reduces the battery’s stored energy and constitutes the essential cost of providing regulation service. Thus, the cycle-specific LCOE for battery j in category ni becomes
Identical charge–discharge efficiencies are assumed across all batteries.
In summary, is a function related to the amount of electricity discharged each time. For a single regulation command of duration , the virtual discharged energy of system is
Hence, the instantaneous energy-throughput revenue factor becomes
2.2. Frequency Regulation Revenue
To capture performance heterogeneity—namely the different accuracy and speed with which individual batteries track AGC commands—we introduce a performance-reward coefficient for each storage system (technology class ). The value of is calculated from historical operating data as the eight-hour moving average of the system’s regulation mileage compensation. Based on this coefficient, the performance-based revenue factor of battery is
where is the product of the average absolute deviation between the actual output of the battery after each response and the commanded output, and the unit mileage-price paid by the grid operator. When historical data are missing, the deviation series is filled by linear interpolation.
In summary, the benefit factor for battery energy storage system j in category ni is
Among these, , , do not change over time and are only related to the energy storage category, reflecting the benefits of different energy storage categories in responding to power commands.
2.3. Materials and Methods
2.3.1. Research Object
This study focuses on an M-BESS project in Guangdong Province, China. The station comprises two heterogeneous subsystems, denoted as n1 and n2:
n1 subsystem: Six lithium-ion battery units, each rated at 1000 kWh with 1000 kW power capacity. The initial SOH is 0.95, and the designed service life is three years (2190 cycles).
n2 subsystem: Four all-vanadium redox flow battery units, each rated at 2000 kWh with 2000 kW power capacity. The initial SOH is 0.98, and the designed service life is six years (4380 cycles).
2.3.2. Data Sources
Regulation signals: a 4 h continuous automatic generation control (AGC) dataset obtained from the Guangdong power grid, with frequency deviation limited to ±0.2 Hz and a dispatch interval of 500 ms.
Cost data: Bloomberg New Energy Finance (2022–2025) projections of electrochemical energy storage EPC costs (1.29 CNY/Wh by 2025) and Guangdong grid charging price (0.333 CNY/kWh).
Market rules: the Implementation Rules for the Guangdong Frequency-Regulation Ancillary Service Market, which specify the settlement mechanism, penalty standards, and AGC performance assessment criteria.
2.3.3. Modeling and Computational Framework
Revenue model: based on the LCOE [12], incorporating life-cycle costs and regulation mileage payments to quantify aggregator revenues.
Dispatchability model: constructed under Symons’ postulate [16], where lifetime factors are derived from SOH trajectories (0–1.0) and capacity factors are formulated from SOC levels (0.2–0.8).
Optimization approach: The allocation problem is formulated as a mixed-integer programming model and solved using CPLEX 12.9 with a convergence tolerance of 1 × 10⁻⁴. Power set-points are derived by aligning optimization outputs with AGC commands.
Simulation platform: MATLAB/Simulink 2022b is employed for dynamic validation, with a resolution of 500 ms to ensure strict consistency with AGC dispatch intervals.
3. Dispatchability Capability Modeling of Energy Storage Systems
3.1. Design of Power Station Lifetime Factor
To safeguard the overall dispatchability of an M-BESS and, at the same time, respect the economic interests of every subsystem, we introduce a lifetime factor that evaluates the real-time aging status and residual potential of each battery.
According to Symons’ postulate, a battery must be retired once either its cumulative effective energy throughput reaches the rated throughput, or its accumulated cycle count equals the rated cycle life.
Hence, the ratio of the effective energy discharged during the operation to the rated throughput can be interpreted as the equivalent number of cycles consumed in that operation. Take discharge as an example. There are [27]
where is the rated depth of discharge; represents the equivalent number of cycles consumed by the battery at a power of .
Considering that the probability of fault-free operation of an energy storage system is highest when its is at the rated cycle count N, and that the energy storage system will be taken offline when the drops to 0 and no longer meets operational requirements, this paper defines as the ratio of the current remaining cycle count to the rated cycle count after responding to a power command, that is
Among these, represents the remaining cycle count at time t; represents the equivalent cycle count for this discharge; and represents the rated cycle count. Therefore, the life performance factor of battery energy storage system j in category is constructed as follows [28]:
where is the rated capacity of battery energy storage system in category ; is discharge as positive; indicates after energy storage system responds to power command ; indicates when least likely to exit and in this paper.
Similarly, during charging can be obtained as
In summary, there are
From the above formula, we can see that .
3.2. Design of System Capacity Factor
To ensure that the M-BESS consistently maintains a certain level of dispatch capability and to avoid penalties from the power grid due to the inability of some BESSs to discharge as a result of excessively low , this paper proposes a refined dispatch strategy. When the energy storage system as a whole is performing a discharging operation, BESS units with relatively high are expected to contribute more power output; conversely, when the of these systems is lower than that of others, their output should be reduced to maintain overall discharging balance.
Similarly, for BESS units with relatively low , when the system is undergoing a charging operation, they are expected to absorb more power to fully utilize their available capacity; whereas, when their is higher than that of other systems, their power intake should be reduced to avoid overcharging, which could negatively affect battery health and lifespan.
Taking the discharging process as an example, when the of the storage system is 0.8, the system is in its optimal state and can provide stable support to the grid. When the drops to 0.2, the storage system should cease operation to prevent damage from over-discharge, thereby ensuring the safety and longevity of the system. Therefore, the power factor of BESS within category during discharging can be expressed as
where represents the rated capacity of the battery energy storage system within category ; denotes discharge as positive; indicates the energy storage system not responding to power commands prior to , and .
Similarly, the power factor during charging is
Therefore, there are
Since during discharging, the upper limits of parameters and are set to 0.8, and during charging, the lower limits of parameters and are set to 0.2, situation does not occur. Meanwhile, an exponential function is employed to further promote balancing [29].
where denotes the average value of parameter at time ; represents the SOC-balancing control coefficient.
Similarly, an exponential function is employed to further promote balancing:
where denotes the average value of parameter at time ; represents the balancing control coefficient.
In summary, the performance factor of battery energy storage system within category is given by
4. Balanced Power Allocation Strategy
While pursuing maximum revenue, in order to maintain the dispatchability of the energy storage station and to achieve a reasonable power allocation under frequency regulation scenarios [30], this paper designs a balanced power allocation strategy by integrating the aggregator’s frequency regulation revenue model with the dispatchability capability model.
4.1. Objective Function
The power allocation objective function, which takes into account both revenue and dispatchability, is formulated as
where is a parameter describing the influence of SOC and SOH. Considering the differences in performance such as lifespan and capacity among different categories of systems, this paper constructs parameter by drawing inspiration from the evaluation mechanism of the Guangdong Power Grid.
According to the Implementation Rules for the Guangdong Ancillary Services Market, if the performance assessment of automatic generation control (AGC) operation fails to meet the standard, the AGC compensation for that period will be canceled. Based on this mechanism, and considering that grid-connected energy storage systems may fail the assessment due to performance issues such as limited lifespan or reduced capacity—thereby incurring additional costs—parameter is constructed as follows:
In the equation, represents the frequency regulation power command.
Given that the entry threshold in the Guangdong market requires the comprehensive performance index to be no less than , and assuming the unit price for frequency regulation mileage compensation is , the parameter is set as
Then
The objective function constructed accordingly can be expressed as
4.2. Constraints
To ensure the safe and efficient operation of the system, the following constraints are considered in the design of the charging and discharging strategy for the energy storage system:
(1) Rated Power Constraint: During charging and discharging, the output power of the battery energy storage system must not exceed its rated power. This means that during discharging operations (considered as positive operations), the battery’s output power must be maintained within the manufacturer-specified maximum power limits to prevent overload and potential damage [31].
(2) Charging/Discharging Exclusivity Constraint: At any given moment, the energy storage system can perform either charging or discharging, but not both simultaneously. This ensures that bidirectional flows do not occur under the same instruction, thereby avoiding ineffective energy cycling and unnecessary resource waste.
(3) SOC Lower Bound Constraint: the SOC of the battery must not fall below a predefined lower limit to avoid deep discharge, which can accelerate battery degradation and potentially lead to irreversible damage.
(4) SOC Upper Bound Constraint: similarly, the battery’s SOC must not exceed a predefined upper limit to prevent overcharging.
In summary, the proposed strategy must satisfy the following constraints:
Rated Power Constraint (discharge considered positive):
In the equation, represents the rated power of the energy storage system.
Charging/Discharging Exclusivity Constraint:
SOC Constraint:
4.3. Solution Algorithm and Analysis
The solution to the objective function composed of the M-BESS frequency regulation revenue model (Equation (18)) and the M-BESS dispatchability capability model (Equation (33)) is obtained using the CPLEX solver [32]. The optimization problem combines the revenue model with the dispatchability model and is solved using CPLEX to obtain unit-level set-points. Inputs include the current SOC and SOH, historical response accuracy and speed, and the grid instruction, which may be a clearing result or a pre-issued command. The computed set-points allocate power across heterogeneous units so as to maximize revenue while preserving dispatchability. After each instruction is executed, SOC and SOH are updated and the optimization is repeated in a rolling manner.
To further enhance the response accuracy and scheduling efficiency of the M-BESS system, this paper introduces a distributed communication mechanism. Traditional centralized control methods face challenges such as communication delays and data synchronization issues in the coordinated scheduling of multiple energy storage systems. In contrast, distributed communication enables real-time information sharing among storage systems, ensuring that each energy storage unit can quickly respond upon receiving grid power instructions. Additionally, this paper employs a fixed-time consistency algorithm to ensure that the energy storage systems reach a consensus on control decisions within a short period, thereby achieving more precise power distribution and optimized scheduling. This approach not only optimizes the system’s frequency regulation benefits and dispatchability but also improves the overall stability and flexibility of the system.
4.4. Secondary Power Allocation Between Identical Energy Storage Systems in a Distributed Architecture
4.4.1. Graph Theory Knowledge
The graph theory knowledge involved in this project: Assume that there is a network of intelligent agents composed of energy storage systems of the same type, where represents the node set; represents the edge set; represents the adjacency matrix of the network, indicates that node and node can communicate, and indicates that node and node cannot communicate. Additionally, let denote the in-degree matrix of network , where , if , then ; let denote the Laplacian matrix of network , then , and let denote the smallest non-zero eigenvalue of matrix .
The leadership constraint model used in this project: considering the above system composed of intelligent agents, which contains only one virtual leadership intelligent agent, i.e., the aggregator communicates directly with this node (energy storage system), and the remaining nodes (energy storage nodes) communicate indirectly with the aggregator through this node, the dynamic equation for each follower intelligent agent is
In the equation, represents the state of the agent; denotes the control protocol of the agent.
The dynamic equation of the leader node is expressed as
In the formula, and represent the state and input of the leader node, respectively.
Lemma 1
(Proof of Fixed-Time Convergence Upper Bound). if is a positive definite function and satisfies the following condition:
In the formula, , , , and . Then, the upper bound of the convergence time Tmax can be expressed as
Lemma 2
(two important inequalities). let , , and , then the following two inequalities hold:
Definition 1.
For systems (36) and (37), if the following condition is satisfied under any initial state :
then the multi-agent system described in (39) is said to achieve consensus within a fixed time .
4.4.2. Fixed-Time Consensus Algorithm and Proof
By designating a node i within the set of identical energy storage systems as the leader node, and assigning its value xk to represent the power command that the system should undertake based on the total number of identical storage units, the following fixed-time consensus algorithm protocol is proposed for node i:
In the formula, and are fixed control parameters, while , , and are sign functions.
Agreement proof:
If , then
Order: , , . Since is always true, therefore is true, is a constant, therefore
Furthermore, since is always true, we have
That is
According to Lemma 2, we have
Similarly, if we set
then we have
According to Lemma 1, it follows from the above derivation that, within time Tf, where
for , both
that is and .
The value remains constant during system operation under the distributed architecture. Based on this design, the proposed fixed-time consensus algorithm enables each node to obtain the required power adjustment command within a finite time, ensuring that the battery energy storage systems can promptly respond and complete the adjustment. Figure 2 illustrates the leader–follower communication topology that supports this coordination mechanism.
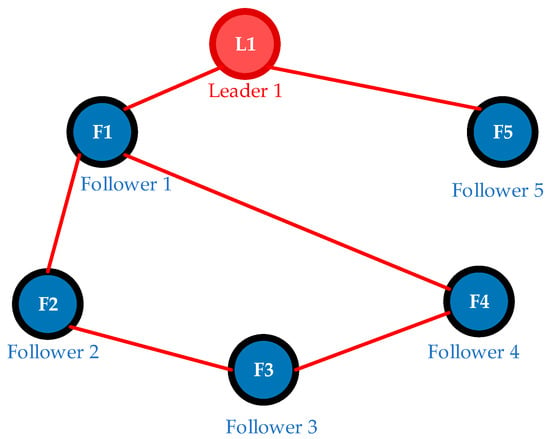
Figure 2.
Communication topology structure of distributed energy storage systems.
As shown in Figure 2, the communication topology of the distributed energy storage system consists of one leader node and multiple follower nodes. The leader acts as the reference node interacting directly with the grid, while the follower nodes exchange coordination signals through communication links.
Building on the communication topology shown in Figure 2, Figure 3 illustrates the convergence behavior of the fixed-time consensus algorithm. This figure provides a visual demonstration of how the proposed approach enables distributed energy storage units to coordinate power allocation effectively.
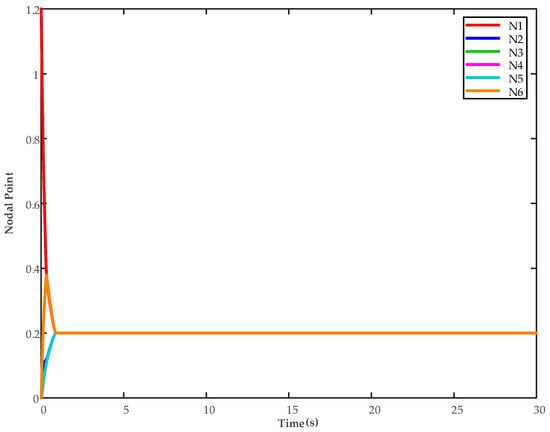
Figure 3.
Convergence performance of fixed-time consistency algorithms.
Simulation results demonstrate that the proposed fixed-time consistency algorithm exhibits excellent convergence performance in secondary power allocation among similar energy storage systems. The communication network topology consists of six nodes, with Node 1 serving as the leader node, and the connections between nodes representing communication links between adjacent nodes. Simulation verification confirms that all nodes can achieve consistency convergence within 3 s, unaffected by initial conditions. This convergence characteristic ensures that distributed energy storage units can obtain the required power regulation command values within the predefined timeframe, thereby guaranteeing the stability and reliability of the distributed control architecture. The algorithm’s fixed-time convergence property provides important theoretical support for real-time control of energy storage systems.
5. Simulation Results and Comparison
5.1. Simulation Data
Table 1 presents the key operational parameters of different categories of battery energy storage systems under study. These parameters reflect the heterogeneity in capacity, efficiency, and lifetime across various storage units and serve as the fundamental input conditions for subsequent simulation verification and performance comparison.

Table 1.
Various data of energy storage station.
As shown in Table 2, the comprehensive performance index of n2 is nearly three times higher than that of n1, which quantitatively supports the conclusion that n2 systems with superior performance and lower cost should be prioritized in dispatch.
Table 2.
Revenue coefficient of energy storage station.
Note 1: According to the Notice on Soliciting Opinions on the Implementation Plan and Trading Rules for Market-Based Demand Response in Guangdong Province, for directly controlled virtual power plants aggregated from energy storage resources, the daily dispatch schedule shall, in principle, follow a minimum arrangement of “two charges and two discharges.” In this paper, the service life is calculated based on two full cycles per day.
Note 2: According to estimates by Bloomberg New Energy Finance, the global EPC (Engineering, Procurement, and Construction) cost of electrochemical energy storage in 2022 was approximately 261 USD/kWh, equivalent to approximately 1.66 CNY/Wh. This cost is expected to decrease to 203 USD /kWh (approximately 1.29 CNY/Wh) by the end of 2025. The initial investment cost in this paper is calculated based on this projection.
Note 3: it is assumed that the investment cost of second-life battery energy storage systems equals the initial investment minus the accumulated past revenue.
Building upon the parameters summarized in Table 1, Table 2 provides the calculated revenue coefficients. These coefficients characterize the relative economic contributions of different storage systems during frequency regulation and offer a quantitative basis for evaluating the effectiveness of the proposed allocation strategy.
The study selects a specific M-BESS within the Guangdong power grid region as the research object. After expansion, there are two types of battery energy storage systems in the region, labeled as battery energy storage systems and , representing different categories of battery storage systems. To verify the effectiveness of the power allocation strategy proposed in this paper, a simulation test is conducted using actual 4 h continuous AGC frequency regulation power instructions. The various data of the battery energy storage systems are shown in Table 1. Based on Table 1, the various factors of the energy storage system can be calculated, as shown in Table 2.
As shown in Table 1 and Table 2, battery energy storage system outperforms battery energy storage system in terms of performance and lifespan. Battery energy storage system has a higher value for parameter than battery energy storage system , while its value for parameter is lower. This indicates that battery energy storage system achieves better performance when responding to the same commands compared to battery energy storage system .
5.2. Simulation Result Analysis
The following power allocation strategies commonly used in the field are selected for comparison, as outlined below:
(1) Scheme 1: the strategy proposed in this paper.
(2) Scheme 2: power proportional allocation strategy, which allocates power based on the rated charge and discharge power provided by the energy storage system.
(3) Scheme 3: energy proportional allocation strategy, which allocates power based on the proportion of remaining charge and discharge energy reported by the energy storage system.
(4) Scheme 4: revenue allocation strategy, which solves the allocation based on the average revenue per kilowatt-hour of the energy storage system, aiming to maximize the overall revenue.
(5) Scheme 5: SOC-balanced allocation strategy, which prioritizes allocation based on the SOC. Specifically, during discharge, the energy storage system with the highest SOC is selected for power allocation until its allocated power reaches its rated power. Then, the remaining energy storage systems are called in order of SOC from high to low. The process is reversed during charging.
5.2.1. Simulation Comparison with Initial SOC and SOH Being the Same
When delving into the scheduling strategies for battery energy storage systems, this paper comprehensively considers multiple factors to evaluate the effectiveness of different strategies. Economic benefits are the primary factor considered in this paper. When the initial state is the same, since the performance and investment costs of energy storage category are superior to those of another energy storage category, in this case, the energy storage system, characterized by superior performance and lower cost, should be prioritized for power output. This conclusion is quantitatively supported by the results in Table 2, where the comprehensive performance index of reaches 0.0435, nearly three times higher than the 0.015 of . Furthermore, the dispatch results in Figure 4 confirm that, under identical initial conditions, units undertake the majority of the power allocation, thereby substantiating the effectiveness of the proposed strategy.
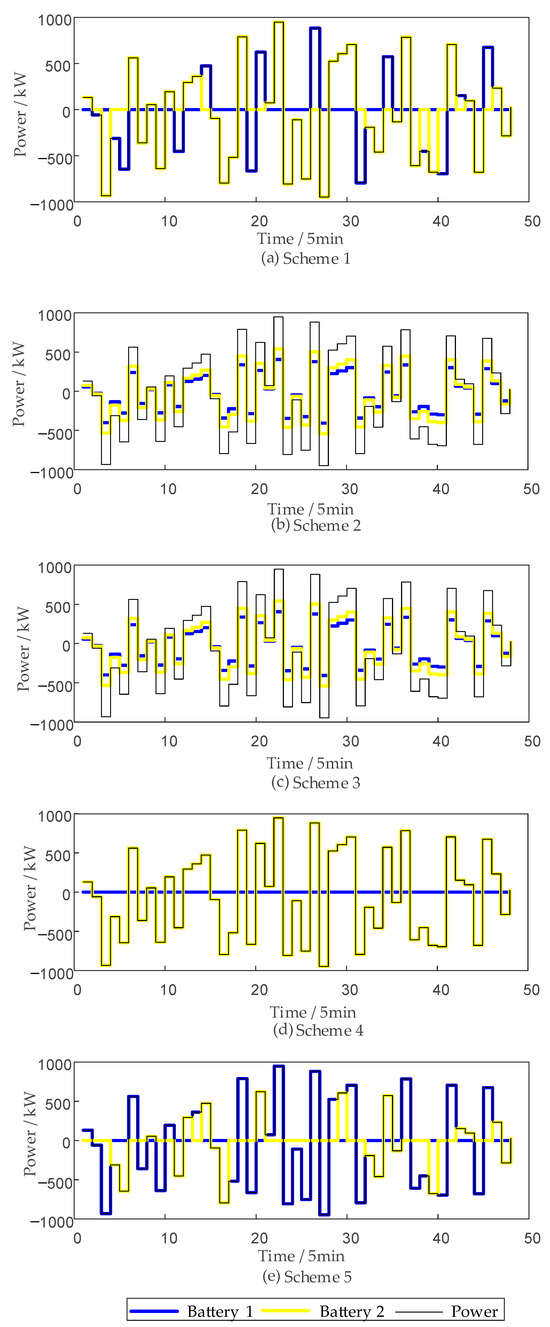
Figure 4.
Power distribution results of various strategies under the same initial state.
Figure 4 shows that Scheme 1 exhibits distinct allocation patterns compared with the other strategies, as it jointly accounts for lifetime and capacity factors rather than focusing solely on revenue maximization. Consequently, power is not continuously concentrated on the superior subsystem but is alternated between categories once the marginal lifetime cost rises. This allocation mechanism yields more balanced trajectories, directly enhancing SOC and SOH uniformity as illustrated in Figure 5 and Figure 6. Consistent with these results, Table 3 indicates that Scheme 1 incurs only a 2.37% revenue loss ratio, lower than the other baselines, thereby demonstrating a more favorable trade-off between economic efficiency and battery health.
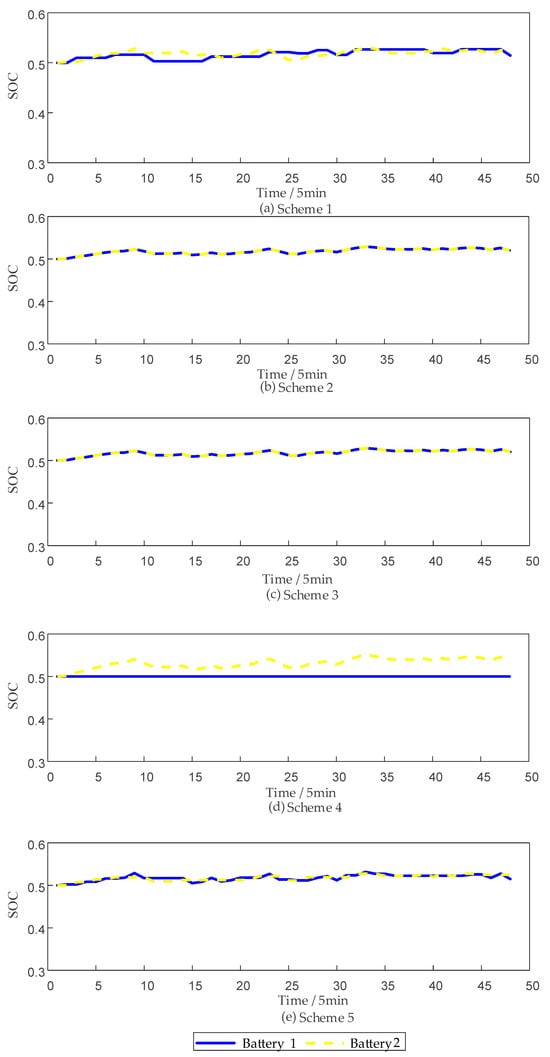
Figure 5.
SOC of various strategies under the same initial state.
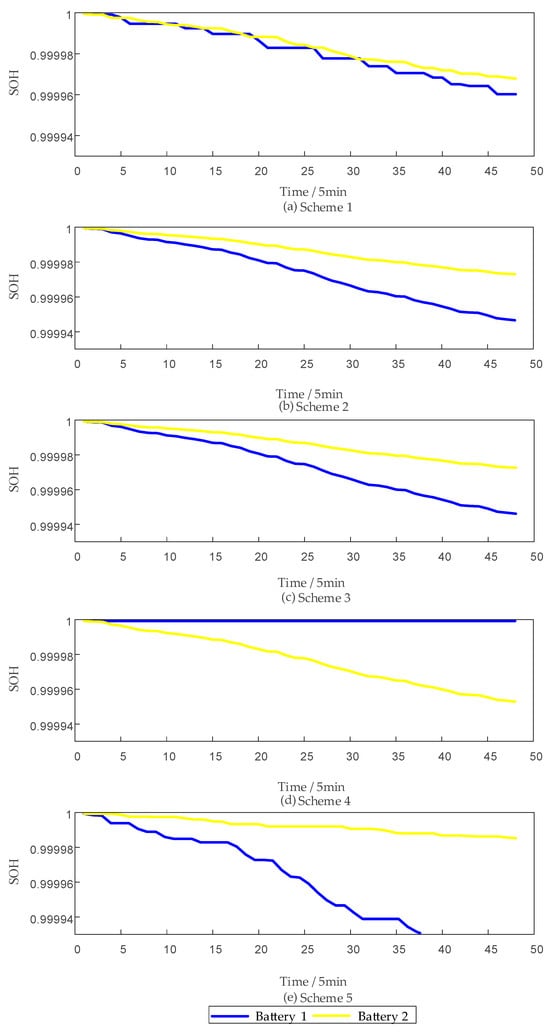
Figure 6.
SOH of various strategies under the same initial state.
Table 3.
Revenue under various strategies with same initial state.
As shown in Figure 5 and Figure 6, although the SOC balance among different categories of energy storage systems is somewhat reduced after implementing the strategy proposed in this paper, the degree of reduction is relatively limited. Moreover, in cases of lower SOC balance, the system gradually restores equilibrium over time. At the same time, the SOH balance results demonstrate that the proposed strategy can significantly enhance SOH uniformity. Compared to Scheme 4, which solely aims to maximize revenue and may result in poor SOH balance, the proposed strategy performs excellently in maintaining the long-term operational stability of the system and extending battery lifespan, effectively keeping the impact within an acceptable range.
Note 1: the revenue loss ratio is defined as
(Current strategy revenue − Maximum revenue strategy revenue)/Maximum revenue strategy revenue
As shown in Table 3, although the methods based on power allocation, energy allocation, and SOC-based allocation can indeed achieve relatively good SOC balance, they result in significant revenue reductions compared to the strategy proposed in this study and the revenue-maximizing strategy. This further validates the economic superiority of the proposed strategy in this research.
As shown in Figure 6, Strategy 2 and Strategy 3 allocate power solely based on the rated charge/discharge power of the storage systems and the proportion of their remaining chargeable/dischargeable energy, thereby neglecting both system revenue and dispatchability. Strategy 4 adopts the maximization of current revenue as its sole objective, assigning power only to the storage category with superior performance; however, as illustrated in Figure 7 and Figure 8, this method fails to consider the dynamic variations in SOC and RUL, which undermines the sustainable operation of the station. Strategy 5, although designed to promote SOC balance and thereby improve SOC uniformity to some extent, overlooks revenue generation and RUL balance, making it difficult to guarantee the long-term economic efficiency and reliability of the storage station.
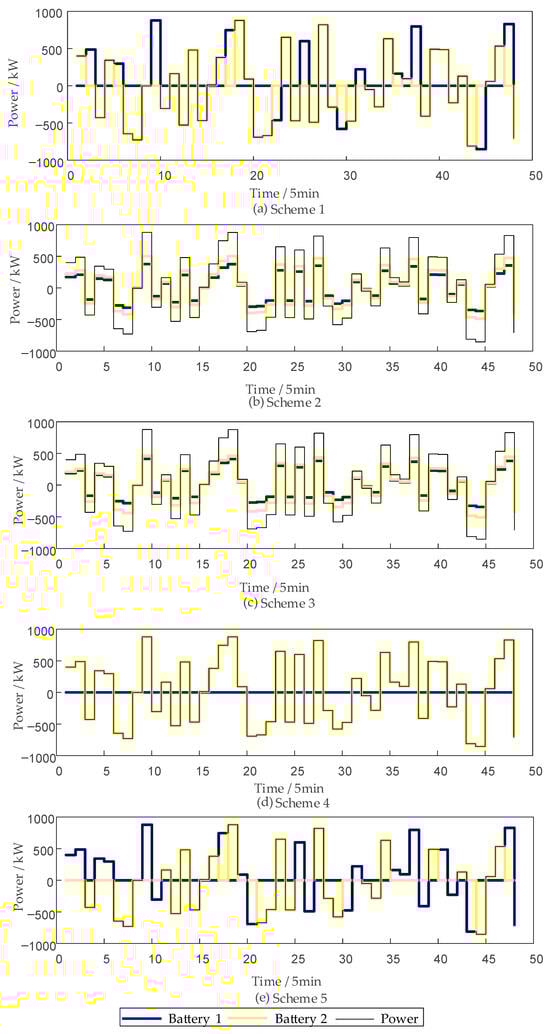
Figure 7.
Power distribution of various strategies at different SOC levels.
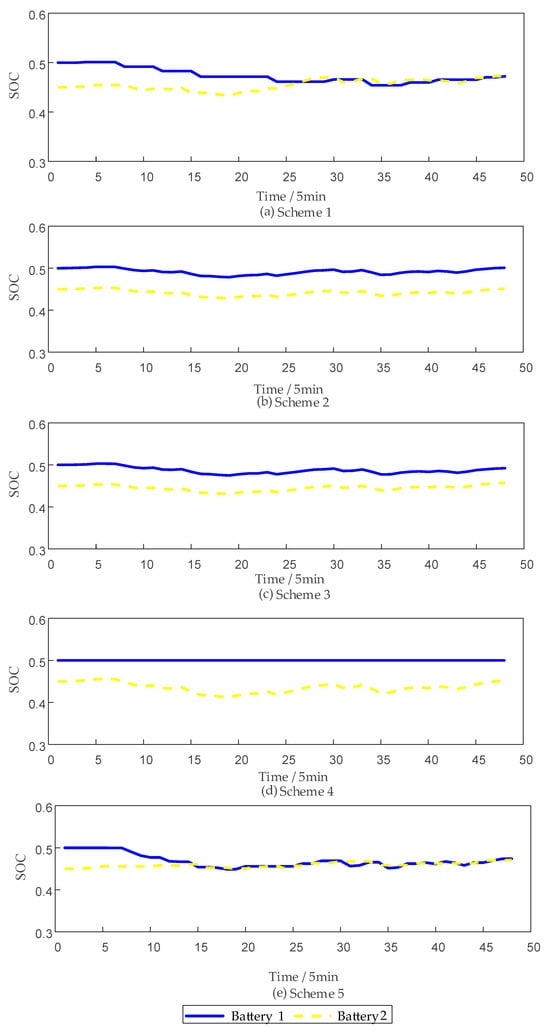
Figure 8.
SOC of various strategies at different SOC levels.
5.2.2. Simulation Comparison with Differing Initial SOC but Identical SOH
The revenue-maximizing baseline prioritizes short-term profit and does not explicitly control state balance across units. When initial SOC levels differ, units in category n2 still share part of the output even if n2 exhibits superior performance and lower cost than n1. This allocation preserves system-wide SOC balance and prevents premature saturation at unit limits. Simulation results, as presented in Figure 7, Figure 8 and Figure 9, further confirm that the proposed strategy effectively achieves this objective. In particular, Figure 8 demonstrates that, under the guidance of the proposed method, the SOC values of different categories gradually converge, indicating good balance.
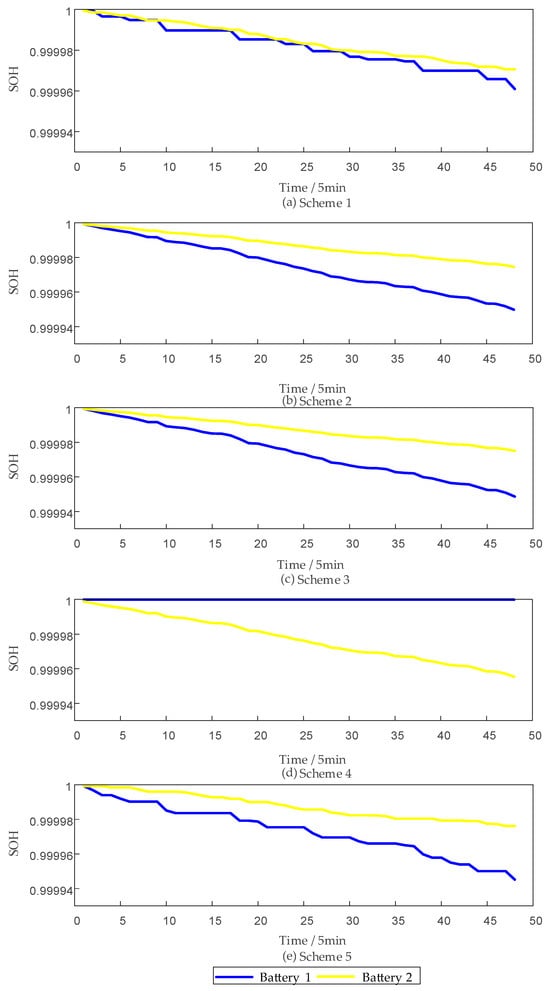
Figure 9.
SOH of various strategies at different SOC levels.
In contrast, allocation methods based solely on revenue may lead to poor SOC balance, which is detrimental to the long-term stable operation of energy storage systems. An imbalanced SOC can cause certain storage units to reach their charge or discharge limits prematurely, thereby shortening their service life and potentially undermining the long-term stability and sustainability of the battery energy storage system’s operation and dispatch strategy.
Furthermore, as shown in Table 4, under conditions of unbalanced initial SOC, the strategy proposed in this paper demonstrates better revenue performance compared to other strategies, including Scheme 5. This further confirms the superiority of the proposed strategy in comprehensively considering system performance, stability, and economic efficiency.
Table 4.
Revenue under various strategies at different initial SOC levels.
When evaluating storage power allocation strategies, revenue is an important indicator for comparative assessment. For instance, Arpit et al. [27,28] both employed revenue-based comparisons to highlight the advantages of their proposed methods. Typically, such evaluations rely on absolute revenue levels, which may not intuitively reveal the relative strengths and weaknesses across different strategies. To provide a clearer perspective, this study introduces the metric of “revenue loss ratio,” which enables a more direct quantification of the economic performance differences among allocation strategies. This indicator explicitly reflects the relative degree of economic loss incurred by each strategy compared with the maximum achievable revenue, thereby offering a robust tool for assessing and optimizing storage power allocation methods.
The superior performance of the proposed strategy can be attributed to the explicit incorporation of lifetime and capacity factors. The lifetime factor quantifies equivalent cycle consumption in real time, preventing high-performance units from premature degradation and thereby improving SOH uniformity. Meanwhile, the capacity factor captures the coupling between SOC and dispatchability, ensuring that no units lose their scheduling capability due to excessive charging or discharging. This dual-factor mechanism fundamentally explains the observed improvement in SOH balance and the controlled revenue loss.
In summary, the proposed SOC–SOH joint optimization strategy demonstrates superior operational allocation rationality compared with conventional methods under high-power discharge requests, while achieving a balanced trade-off between only a 2.37% reduction in short-term revenue and a significant improvement in SOH. By avoiding single-indicator bias at the operational level and incorporating the revenue loss ratio at the economic level, the strategy effectively reconciles short-term profitability with long-term reliability. These results provide strong evidence that the proposed approach offers both engineering feasibility and academic novelty under a multi-criteria optimization framework.
5.2.3. Simulation Comparison with Differing Initial SOH but Identical SOC
As shown in Figure 4, under the same operating conditions, the response primarily relies on energy storage category , which leads to a faster decline in the SOH of category . When the SOH of category becomes lower than that of category , although the performance and investment costs of category are superior to those of category , based on the SOH balancing principle, category should also contribute to part of the output. To address this, further simulations were conducted for scenarios with different initial SOH but identical SOC, and the results are shown in Figure 10, Figure 11 and Figure 12. As can be seen in Figure 12, under the strategy proposed in this paper, the SOH gradually approaches equilibrium, and the dispatchable capability is strong. This confirms that the proposed strategy can achieve the SOH balancing goal. Furthermore, further analysis of Figure 10 and Figure 11 shows that the strategy proposed in this paper can achieve SOH balance while maintaining SOC balance.
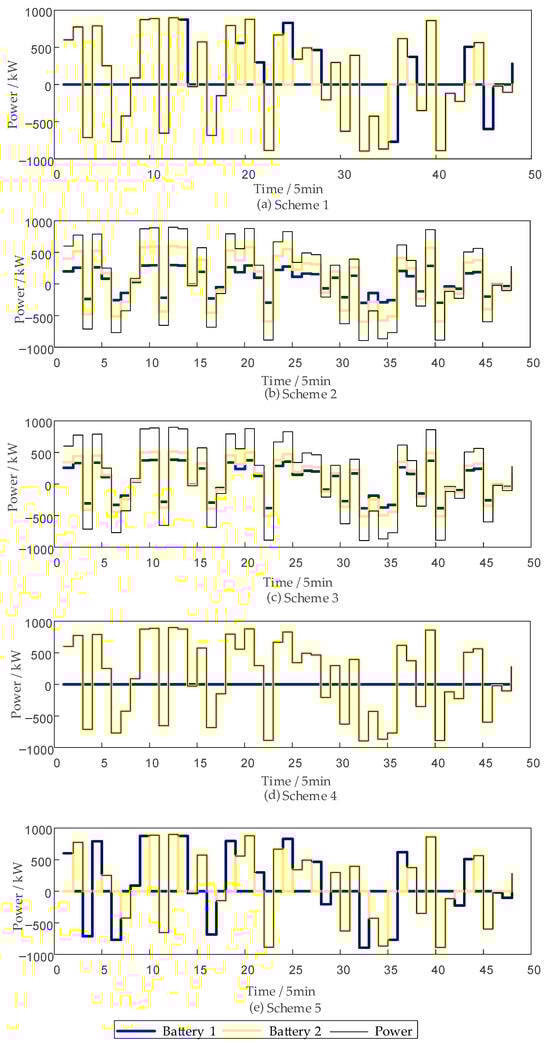
Figure 10.
Power distribution of various strategies at different SOH levels.
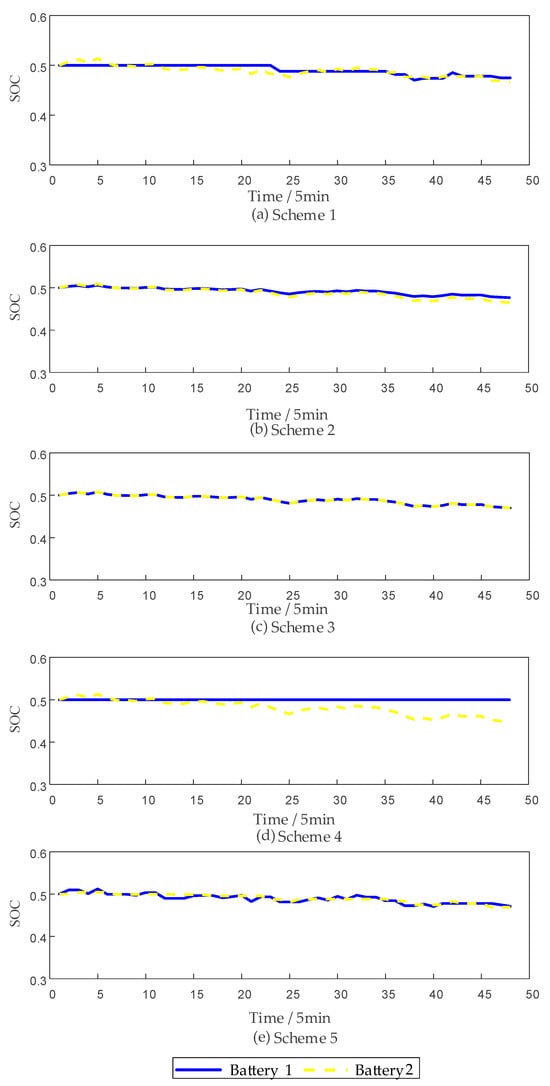
Figure 11.
SOC of various strategies at different SOH levels.
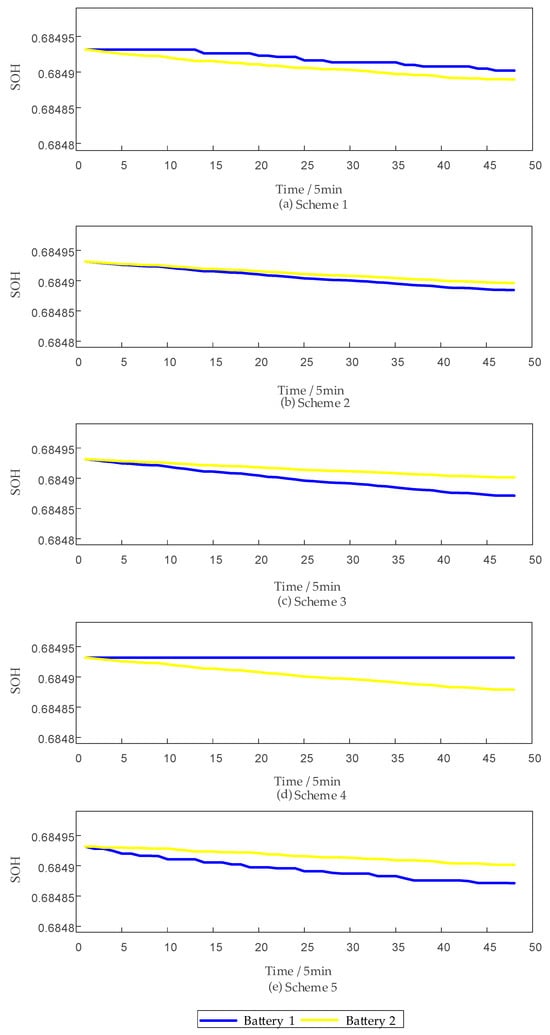
Figure 12.
SOH of various strategies at different SOH levels.
As shown in Table 5, under heterogeneous SOH conditions, the proposed strategy achieves only a 0.95% profit reduction compared with the maximum achievable revenue, which highlights its superior trade-off between economic efficiency and lifetime balance.
Table 5.
Revenue under various strategies at different initial SOH levels.
Further comparison shows that the proposed strategy yields only a 2.37% revenue loss under identical initial conditions and merely 0.95% under heterogeneous SOH conditions, both substantially lower than those of alternative strategies. This confirms the superiority of the proposed method in balancing profitability and lifetime uniformity.
A thorough analysis of Table 5 reveals that, with the exception of the revenue-sharing-based approach, other methods fall short in terms of economic efficiency when compared to the strategy proposed in this paper. In contrast, the dimension of SOH balance highlights significant drawbacks in the revenue-sharing-based method. The balance of SOH is crucial to ensuring the long-term stable operation of energy storage systems and effectively extending the lifespan of the equipment. While other methods may have economic advantages in the short term, their failure to manage SOH effectively can lead to accelerated wear of energy storage devices over time, potentially resulting in premature maintenance or replacement, thus increasing both costs and maintenance difficulties. Therefore, attention must be given to SOH balance to ensure the sustained, stable, and efficient operation of energy storage systems.
Comparison of the profits of each strategy under different scenarios.
A further comparison of the profits for each strategy under the three scenarios reveals that, under the allocation strategy proposed in this paper, the aggregator’s profit is only slightly reduced. Through a further comparison of economic benefits, it is found that, under the same initial conditions, although Scheme 4 locks in the maximum profit, the strategy proposed in this paper follows closely behind, with only a 2.37% loss in profit. In contrast, Scheme 2 and Scheme 3 exhibit a 2.96% reduction in profit compared to the optimal profit, while Scheme 5 shows a significant decline in profit, reaching 3.48%. Similarly, when the initial state of SOC differs, the strategy in this paper still maintains stable profit performance, outperforming other methods. Furthermore, when the initial state of SOH varies, the profit of the proposed strategy is only 0.95% lower than the optimal profit, which is far less than the losses incurred by other strategies, further demonstrating the superior economic performance of the proposed strategy under different conditions.
The superior performance of the proposed power allocation strategy stems from the combined regulation of lifetime and capacity factors. The lifetime factor quantifies equivalent cycle consumption in real time, preventing high-performance units from being excessively degraded under frequent dispatch. Meanwhile, the capacity factor preserves SOC balance during power distribution, ensuring that overall system dispatchability is not compromised. By acting together, these mechanisms enable the proposed strategy to achieve a better balance between profitability and health preservation, thereby delivering superior economic and stability performance across various scenarios.
In conclusion, the power distribution strategy proposed in this paper not only considers the long-term healthy operation of the battery energy storage system but also takes into account its economic benefits, providing an efficient and economical solution for aggregators with M-BESSs to participate in frequency regulation scheduling. The proposed method also shows good scalability, as the convergence characteristics of the fixed-time consensus algorithm depend mainly on control parameters and communication topology rather than the absolute number of nodes, so even with dozens or more units the increase in convergence time remains moderate, while the growth of communication and computational overhead is sub-linear and within acceptable limits.
6. Conclusions
Given the performance inconsistency of M-BESSs, and under the premise of ensuring power station revenue, this paper innovatively proposes an SOC and SOH balanced power distribution strategy for M-BESSs, achieving dynamic balance of SOC and SOH when responding to grid instructions. The research conclusions are as follows:
(1) The proposed SOC–SOH balancing strategy improves SOH uniformity and dispatching stability while limiting revenue loss to no more than 2.37%. This result indicates that the method effectively avoids the shortcomings of conventional SOC-based approaches that prioritize economic efficiency at the expense of lifetime management, thereby achieving a rational trade-off between short-term profitability and long-term operational reliability.
(2) By incorporating distributed communication and a fixed-time consensus algorithm, the method achieves convergence within 3 s, significantly enhancing scheduling accuracy and system robustness. This characteristic not only demonstrates the engineering feasibility of the proposed approach under real-time control conditions but also provides both theoretical and practical support for the rapid coordination of multi-node and heterogeneous energy storage systems.
Moreover, the results demonstrate that although the proposed strategy entails a short-term profit reduction of approximately 0.95%, it substantially improves lifetime consistency and mitigates premature degradation, thereby offering superior economic viability from a life-cycle perspective. In contrast to conventional approaches that focus solely on short-term profit maximization, the proposed method emphasizes a dynamic trade-off between revenue and health management, avoiding the “high short-term profit but high long-term cost” dilemma. This finding not only provides aggregators with new insights into designing dispatching and operational strategies but also lays a theoretical foundation for developing future optimization frameworks that jointly enhance economic efficiency and long-term reliability in heterogeneous energy storage systems.
Author Contributions
Conceptualization, L.W. and Y.W.; methodology, X.J.; software, Z.W.; validation, T.P., L.W., and Y.W.; formal analysis, T.P.; investigation, X.J.; resources, Z.W.; data curation, T.P.; writing—original draft preparation, L.W.; writing—review and editing, Y.W.; visualization, T.P.; supervision, Z.W.; project administration, X.J.; funding acquisition, Z.W. All authors have read and agreed to the published version of the manuscript.
Funding
This research was funded by Southern Power Grid Company Science and Technology Project, grant number ZBKJXM20240185.
Institutional Review Board Statement
Not applicable.
Informed Consent Statement
Not applicable.
Data Availability Statement
The original findings presented in this study are included in this article. Further inquiries should be directed to the corresponding author.
Acknowledgments
I would like to sincerely express my gratitude to China Southern Power Grid Science Research Institute Co., Ltd. for their strong support of this project. This project, funded by the China Southern Power Grid Corporation’s scientific research program, aims to address the “dual-high” and “dual-peak” challenges in the context of the new power system, focusing on the research of distributed source-load-storage resource demand response capability assessment and collaborative optimization technology, and the development of a cluster forecasting and self-regulated decentralized collaboration platform.
Conflicts of Interest
Authors Long Wang and Yi Wang were employed by the Marketing Department of Southern Power Grid Co., Ltd. Authors Xin Jin, Zongyi Wang, and Tingzhe Pan were employed by the Southern Power Grid Research Institute. The authors declare that this study was conducted without any commercial or financial relationships that could be construed as potential conflicts of interest. The funders had no role in the design of the study; in the collection, analyses, or interpretation of data; in the writing of the manuscript; or in the decision to publish the results.
Abbreviations
The following abbreviations are used in this manuscript:
| M-BESSs | Multi-type battery energy storage power stations |
| SOC | State of charge |
| SOH | state of health |
| PV | photovoltaic |
| BESS | battery energy storage power stations |
| LCOE | levelized cost of electricity |
References
- Huang, X.; Dong, P.; He, X.; Liu, M.; Deng, W. Research on Aggregation Flexibility Method of AC/DC Distribution Network Considering Flexibility Balance and Its Application. IEEE Syst. J. 2023, 17, 3635–3645. [Google Scholar] [CrossRef]
- Shu, H.; Dong, H.; Wang, G.; Chen, J.; Shi, B.; Tang, Y. Wind-Storage Coordinated Control Strategy for Inertia Enhancement of High Ratio Renewable Energy Power Systems. J. Energy Storage 2024, 97, 112998. [Google Scholar] [CrossRef]
- Liao, X.; Ma, J.; Jiang, Z.; Zhou, J. Many-Objective Optimization Based Mutual Feed Scheduling for Energy System of Integrated Energy Station. Appl. Soft. Comput. 2024, 161, 111803. [Google Scholar] [CrossRef]
- Gao, X.; Zhang, J.; Chang, J.; Wang, S.; Su, Z.; Mu, Z. Employing Battery Energy Storage Systems for Flexible Ramping Products in a Fully Renewable Energy Power Grid: A Market Mechanism and Strategy Analysis through Multi-Agent Markov Games. Energy Rep. 2024, 12, 5066–5082. [Google Scholar] [CrossRef]
- Hasan, M.M.; Haque, R.; Jahirul, M.I.; Rasul, M.G.; Fattah, I.M.R.; Hassan, N.M.S.; Mofijur, M. Advancing Energy Storage: The Future Trajectory of Lithium-Ion Battery Technologies. J. Energy Storage 2025, 120, 116511. [Google Scholar] [CrossRef]
- Qi, Y.; He, X.; Li, Z.; Ma, Q.; Lu, M.; Su, H.; Li, C.; Xu, Q. Material Selection and System Optimization for Redox Flow Batteries Based on Solid-Liquid Redox-Targeting Reactions: A Mini-Review. J. Energy Storage 2025, 107, 115014. [Google Scholar] [CrossRef]
- Csemany, D. Coupled Thermal-Electrical Lumped Parameter Modeling of High-Temperature Sodium-Sulfur Battery. J. Energy Storage 2025, 109, 115117. [Google Scholar] [CrossRef]
- Qiu, X.; Nguyen, T.A.; Crow, M.L. Heterogeneous Energy Storage Optimization for Microgrids. IEEE Trans. Smart Grid 2016, 7, 1453–1461. [Google Scholar] [CrossRef]
- Huang, C.; Yang, M.; Ge, H.; Deng, S.; Chen, C. DMPC-Based Load Frequency Control of Multi-Area Power Systems with Heterogeneous Energy Storage System Considering SoC Consensus. Electr. Power Syst. Res. 2024, 228, 110064. [Google Scholar] [CrossRef]
- Chen, S.; Sun, J.; Qiu, S.; Liu, X.; Lyu, K.; Chen, S.; Xing, S.; Guo, Y. Phased Control Reciprocating Airflow Cooling Strategy for a Battery Module Considering Stage of Charge and State of Health Inconsistency. J. Energy Storage 2023, 61, 106752. [Google Scholar] [CrossRef]
- Cao, Y.; Wu, Q.; Zhang, H.; Li, C.; Zhang, X. Chance-Constrained Optimal Configuration of BESS Considering Uncertain Power Fluctuation and Frequency Deviation Under Contingency. IEEE Trans. Sustain. Energy 2022, 13, 2291–2303. [Google Scholar] [CrossRef]
- Cruz-De-Jesús, E.; Martínez-Ramos, J.L.; Marano-Marcolini, A.; Gómez-Expósito, A. Economic Assessment of Battery Energy Storage Systems for Frequency Regulation Reserve Provision: A Case Study of the Dominican Republic. Energy Sustain. Dev. 2025, 88, 101749. [Google Scholar] [CrossRef]
- Liu, G.; Liu, W.; Shi, Q. Economic Evaluation of Battery Energy Storage System on the Generation Side for Frequency and Peak Regulation Considering the Benefits of Unit Loss Reduction. IET Gener. Transm. Distrib. 2023, 17, 5486–5497. [Google Scholar] [CrossRef]
- Shang, C.; Srinivasan, D.; Reindl, T. Generation-Scheduling-Coupled Battery Sizing of Stand-Alone Hybrid Power, Systems. Energy 2016, 114, 671–682. [Google Scholar] [CrossRef]
- Wang, Q.; Yang, P.; Buja, G. Design and Analysis on Different Functions of Battery Energy Storage System for Thermal Power Units Frequency Regulation. Energy Rep. 2022, 8, 11981–11991. [Google Scholar] [CrossRef]
- Elkholy, M.H.; Senjyu, T.; Metwally, H.; Farahat, M.A.; Irshad, A.S.; Hemeida, A.M.; Lotfy, M.E. A Resilient and Intelligent Multi-Objective Energy Management for a Hydrogen-Battery Hybrid Energy Storage System Based on MFO Technique. Renew. Energy 2024, 222, 119768. [Google Scholar] [CrossRef]
- Chennaif, M.; Zahboune, H.; Elhafyani, M.; Zouggar, S. Electric System Cascade Extended Analysis for Optimal Sizing of an Autonomous Hybrid CSP/PV/Wind System with Battery Energy Storage System and Thermal Energy Storage. Energy 2021, 227, 120444. [Google Scholar] [CrossRef]
- Oyewole, O.; Nwulu, N.; Okampo, E.J. Multi-Objective Optimal Sizing and Design of Renewable and Diesel-Based Autonomous Microgrids with Hydrogen Storage Considering Economic, Environmental, and Social Uncertainties. Renew. Energy 2024, 231, 120987. [Google Scholar] [CrossRef]
- Horrillo-Quintero, P.; García-Triviño, P.; Sarrias-Mena, R.; García-Vázquez, C.A.; Fernández-Ramírez, L.M. Model Predictive Control of a Microgrid with Energy-Stored Quasi-Z-Source Cascaded H-Bridge Multilevel Inverter and PV Systems. Appl. Energy 2023, 346, 121390. [Google Scholar] [CrossRef]
- Xiao, J.; Li, P.; Mao, Z.; Diao, H.; Li, J.; Tu, C. Multi-Layer Control Strategy to Enhance the Economy and Stability of Battery Energy Storage System in Wind Farms. Int. J. Electr. Power Energy Syst. 2025, 169, 110776. [Google Scholar] [CrossRef]
- Chang, F.; Li, Y.; Peng, Y.; Cao, Y.; Yu, H.; Wang, S.; Zhang, X.; Luo, L. A Dual-Layer Cooperative Control Strategy of Battery Energy Storage Units for Smoothing Wind Power Fluctuations. J. Energy Storage 2023, 70, 107789. [Google Scholar] [CrossRef]
- Li, Z.; Chen, G. Distributed Dynamic Weighted Average Consensus for Disturbed Multiagent Systems in Fixed Time. IEEE Trans. Netw. Sci. Eng. 2022, 9, 4277–4286. [Google Scholar] [CrossRef]
- Liu, L.-N.; Yang, G.-H. Distributed Fixed-Time Optimal Resource Management for Microgrids. IEEE Trans. Autom. Sci. Eng. 2023, 20, 404–412. [Google Scholar] [CrossRef]
- Obi, M.; Jensen, S.M.; Ferris, J.B.; Bass, R.B. Calculation of levelized costs of electricity for various electrical energy storage systems. Renew. Sustain. Energy Rev. 2017, 67, 908–920. [Google Scholar] [CrossRef]
- Werner, D.; Paarmann, S.; Wetzel, T. Calendar Aging of Li-Ion Cells—Experimental Investigation and Empirical Correlation. Batteries 2021, 7, 28. [Google Scholar] [CrossRef]
- Zeng, Y.K.; Zhao, T.S.; Zhou, X.L.; Zeng, L.; Wei, L. The Effects of Design Parameters on the Charge-Discharge Performance of Iron-Chromium Redox Flow Batteries. Appl. Energy 2016, 182, 204–209. [Google Scholar] [CrossRef]
- Maheshwari, A.; Paterakis, N.G.; Santarelli, M.; Gibescu, M. Optimizing the operation of energy storage using a non-linear lithium-ion battery degradation model. Appl. Energy 2020, 261, 114360. [Google Scholar] [CrossRef]
- Cheng, M.; Zhang, X.; Ran, A.; Wei, G.; Sun, H. Optimal dispatch approach for second-life batteries considering degradation with online SOH estimation. Renew. Sustain. Energy Rev. 2023, 173, 113053. [Google Scholar] [CrossRef]
- Ma, Y.; Wang, S.; Liu, G.; Tian, G.; Zhang, J.; Liu, R. State-of-charge balancing strategy of battery energy storage units with a voltage balance function for a Bipolar DC mircrogrid. Appl. Energy 2024, 356, 122367. [Google Scholar] [CrossRef]
- Lv, Y.; Sun, H.; Wang, T.; Guo, Z.; Li, Z.; Shi, Y.; Fang, F. A Frequency Modulation Capability Enhancement Strategy of Thermal Power Units by the Integration of a Hybrid Energy Storage System. Appl. Therm. Eng. 2025, 278, 127441. [Google Scholar] [CrossRef]
- Yang, H.; Hao, Z.; Chu, Y.; Ma, Y.; Zhang, D. Operation Scheduling Strategy of Battery Energy Storage System with the Integration of Differenced Power Constraint Factor. J. Energy Storage 2023, 74, 109348. [Google Scholar] [CrossRef]
- Liu, Z.; Liu, B.; Ding, X.; Wang, F. Research on Optimization of Energy Storage Regulation Model Considering Wind–Solar and Multi-Energy Complementary Intermittent Energy Interconnection. Energy Rep. 2022, 8, 490–501. [Google Scholar] [CrossRef]
Disclaimer/Publisher’s Note: The statements, opinions and data contained in all publications are solely those of the individual author(s) and contributor(s) and not of MDPI and/or the editor(s). MDPI and/or the editor(s) disclaim responsibility for any injury to people or property resulting from any ideas, methods, instructions or products referred to in the content. |
© 2025 by the authors. Licensee MDPI, Basel, Switzerland. This article is an open access article distributed under the terms and conditions of the Creative Commons Attribution (CC BY) license (https://creativecommons.org/licenses/by/4.0/).