Abstract
Advanced oxidation processes (AOPs) utilising a hydroxyl radical (•OH), a strong oxidant, are seen as a promising solution for removing hazardous and recalcitrant pollutants from waste streams. Among AOPs, non-thermal plasmas, especially pulsed corona discharge (PCD), enable the abatement of hazardous volatile organic compounds (VOCs) with high energy efficiency. This study demonstrates the viability of upscaling PCD technology with water sprinkling in degrading the VOC toluene using a semi-pilot scale plasma reactor. A toluene–air mixture was treated with varying gas-phase toluene concentrations (30–100 ppm) and pulse repetition frequencies (25–800 pps), achieving toluene removal of 5–55% in PCD and an additional 10–18% in PCO, as well as excellent toluene removal energy efficiencies from 9.0 to 37.1 g kW−1 h−1. The process design with water sprinkling provides additional advantages compared to dry reactors—the water surface serves as a source of hydroxyl radicals and scrubs the air from degradation by-products resulting from the incomplete oxidation of target pollutants. Transformation products of toluene were identified, and an oxidation pathway via hydroxylation of the aromatic ring was suggested as the major route towards ring-opening reactions. A photocatalytic oxidation reactor with TiO2 catalyst plates, following PCD as a post-treatment, enabled additional removal of residual contaminants, also converting residual ozone to oxygen. The PCD reactor with water sprinkling and post-plasma photocatalysis shows promising results for upscaling the process.
1. Introduction
The emission of volatile organic compounds (VOCs) is one of the five main air pollutants for which the European Union (EU) has set national reduction commitments for 2020–2029 EC [1]. The other four pollutants include nitrogen oxides (NOx), sulphur dioxide (SO2), ammonia (NH3), and fine particulate matter (PM2.5) emissions. Main pollution sources of VOCs in Estonia include the manufacturing and extractive industries, agriculture, residential areas, and transportation [2]. Concentrations of VOCs are often high indoors, posing adverse health effects for residents and workers [3,4]. Among the most widely used VOCs in industry, benzene, toluene, ethylbenzene, and xylene (BTEX) form a priority group. Long-term exposure to BTEX may cause asthma and other respiratory diseases, even at low concentrations [5]. Technologies for VOC removal from air include thermal oxidation, absorption and adsorption, condensation, membrane separation, and biological treatment processes. High energy consumption and cost, poor adaptability to low VOC concentrations, and secondary waste present challenges for conventional treatment methods [6]. Considering recent developments, VOCs are oxidised using photocatalysis in combination with activated carbon filters [7], catalytically in dark and low-temperature conditions [8], and thermocatalytically [9] with online sensor monitoring [10]. Moreover, the use of pulsed corona discharge (PCD) has potential as an energy-efficient, cost-effective, and chemical-free technology for VOC control [11]. Although several scale-up attempts of non-thermal plasma for gas purification exist [11], the application of water sprinkling systems in PCD plasma has not yet been studied on this scale.
Non-thermal PCD plasma in treated gas is generated by applying ultra-short voltage pulses between two electrodes. This method of non-thermal plasma generation avoids the formation of sparks and, thus, can be used in inter-electrode geometries with media disturbed by water droplets, films, and jets. Applying a high voltage between electrodes causes electric discharge, during which an electron avalanche escapes from the cathode toward the anode, producing ionisation and dissociation of molecules in the discharge zone [12]. As a result, reactive species such as a singlet oxygen (1O2) and hydroxyl radical (•OH) are formed. These species are known to be strong oxidants, possessing redox potentials as high as 2.42 V and 2.85 V for 1O2 and •OH, respectively [13]. Pollutants are degraded by means of radical attack, molecular oxidation, and electron impact. As water serves as a precursor for the formation of •OH, its presence affects the overall efficacy of the process. The concentration of reactive species at the plasma–liquid interface, which proves the dominant surface character of the reaction, was established earlier by Ajo et al. [14]. Therefore, the reactor concept with circulating water in the discharge zone creates optimal conditions for the formation of short-lived radicals and the subsequent degradation of pollutants [15].
The inevitable formation of ozone from air oxygen in a plasma environment turns out to be a drawback for air cleaning applications. Ozone is known to be a toxic gas, requiring subsequent removal from the reactor exhaust to avoid secondary pollution. The application of photocatalytic oxidation (PCO) for the abatement of residual VOCs and ozone could serve as a method for the given context [16,17].
The objective of this research is to assess the efficiency of airborne toluene degradation with water-sprinkled PCD followed by PCO by conducting experiments under controlled laboratory conditions, having initial toluene concentrations ranging from 30 to 100 ppm. Toluene distribution between the gaseous and aqueous phases, as well as its oxidation, is also followed. Ozone degradation in the PCO reactor is quantified, and toluene degradation products are identified in sprinkled water. The combination of PCD and PCO shows potential for toluene removal at a PCD energy efficiency of 9.0 g kW−1 h−1.
2. Materials and Methods
2.1. Chemicals and Reagents
All reagents were of analytical grade and used without further purification. For high-performance liquid chromatography (HPLC), Milli-Q water was obtained from a Millipore ultrapure water system (Simplicity®, EMD Millipore Corporation, Burlington, MA, USA). Other aqueous solutions were prepared using distilled water. Toluene (C7H8, ≥99.9%) was purchased from Sigma-Aldrich (St. Louis, MO, USA). Methanol (CH3OH ≥ 99.9%) was purchased from Honeywell (Charlotte, NC, USA). Dichloromethane (CH2Cl2 ≥ 99.8%) was procured from Fisher Scientific (Waltham, MA, USA), anhydrous sodium sulphate (Na2SO4, ≥99.9%) from Lach-Ner (Neratovice, Czech Republic), and powdery P25 titanium dioxide (AEROXIDE® TiO2 ≥ 99.5%) from Evonik (Essen, Germany).
2.2. Experimental Device
The schematic outline of the experimental device is shown in Figure 1. All experiments were conducted in a continuous flow regime. The Eco Air Pump PA200 (Jecod Co. Ltd., Zhongshan, China) fed the setup with air at a flow rate of 6 m3 h−1 (100 L min−1). For the artificial pollution of air, toluene was vaporised in a bubble column using a bypass flow configuration. A certain part (0.2–2.0 L min−1) of the main airstream passed through a bubble column (H = 700 mm; di = 50 mm) filled with liquid toluene (500 mL), saturating the air with vapours. The bubble column was thermostated at 22 °C, providing a toluene saturation pressure of 0.032 bars [18]. The initial toluene concentration in the main gas flow (influent) was measured using GC-MS to ensure stability throughout the experimental procedure. The toluene-polluted air was then passed through the PCD, followed by the PCO reactor, and the corresponding changes in concentration were monitored. The setup photo can be found in Appendix A, Figure A1. All experiments were performed at room temperature (22 ± 2 °C), atmospheric pressure, and a relative humidity of 35 ± 3%. Experiments were conducted in three replicates. Results are demonstrated as mean value ± standard deviation.
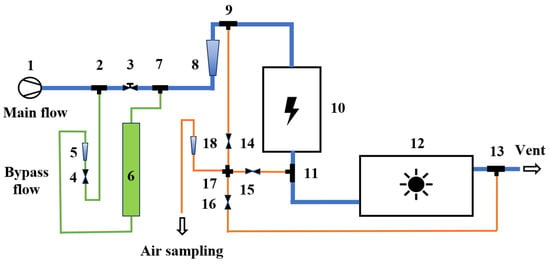
Figure 1.
Experimental setup flow chart: 1—air pump; 2, 7—T-pipes; 3—main valve; 4—bypass valve; 5, 8, 18—rotameters; 6—toluene bubbling column; 9, 11, 13—sampling tube connectors; 10—PCD reactor; 12—PCO reactor; 14, 15, 16—sampling valves; 17—quad pipe connector.
2.3. Reactors
Polluted air entered the PCD reactor (Flowrox Oy, Lappeenranta, Finland) (Figure 2a), which is composed of a circulation water tank and a 75.9 L chamber equipped with the electrode system. Electrode assembly consists of horizontal string electrodes made of stainless-steel wire (d = 0.55 mm) with a total length of 20 m and two vertical grounded stainless-steel parallel plates. A high-voltage pulse generator produces short 100 ns electrical pulses having a peak voltage and current of 20 kV and 380 A, respectively. Pulse repetition frequency varied between 25 and 800 pulses per second (pps), producing 3.0 to 100 W of output power, respectively. Continuous circulation of 5.0 L of water at a flow rate of 1.8 to 15.0 L min−1 from the water storage tank into the plasma zone was provided by a water pump (Iwaki Co. Ltd., Tokyo, Japan). Twenty-four holes with a diameter of 3.0 mm, made in the distribution plate, were used to sprinkle water into the plasma zone. Before plasma ignition, toluene-polluted air was passed through the PCD reactor for at least 20 min while sprinkled water was recirculated to achieve equilibrium between the air and liquid phases.
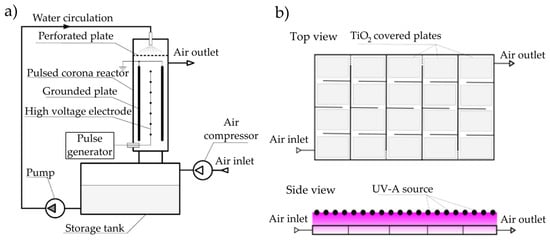
Figure 2.
Pulsed corona discharge (a) and photocatalytic oxidation reactor (b) outlines.
Photocatalytic treatment of air was conducted in a plug flow flat-bedded reactor, sized L = 996 mm, W = 534 mm, and H = 40 mm, made of stainless steel (Figure 2b). The reactor was equipped with a UV transparent window (2 mm thick PET plate) for external irradiation with UV-A generated by twenty lamps (Philips, Germany), with a wavelength range between 315 and 400 nm and a maximum intensity of 119 W m−2. Forty glass plates coated with powdery TiO2 were placed into the reactor, providing contact between the incoming air, UV radiation, and the photocatalyst. The air flow rate of 6.0 m3 h−1 corresponds to a residence time of 13 s in the PCO reactor.
2.4. Analyses
The concentration of gaseous toluene was assessed using a gas chromatograph equipped with a capillary column (30 m × 0.32 mm i.d. with a film thickness of 0.25 μm) (Phenomenex ZB-WAXplus, Zebron, Torrance, CA, USA) and a quadrupole mass spectrometer (GC-MS) (QP2010 Plus, Shimadzu, Kyoto, Japan). The temperature of the injection port was maintained at 50 °C, and the GC oven temperature was held at 30 °C. The mass spectrometer was adjusted to a selected ion monitoring regime at m/z = 92. Gaseous samples were collected in 20 mL glass vials and subjected to subsequent analysis by GC-MS. Fourier-transform infrared spectroscopy (FTIR, Interspec 200-X, Estonia) provided a reference for quantitative analysis in GC-MS. Samples for the FTIR analysis were collected in the Specac Atmos 20.0 m 3.68 L gas cell and analysed in the 500–4000 cm−1 wavelength range. The spectrum was taken for each gaseous sample and analysed using essential FTIR software version 2.00.045 (Operant LLC) equipped with a quantitative database (FDM, HiRes VPFTIR for Quant).
The concentration of O3 was measured using an ozone analyser (MP-6060, Anseros Klaus Nonnenmacher GmbH, Tübingen, Germany).
Concentrations of toluene in sprinkling water were determined using high-performance liquid chromatography (HPLC, Shimadzu, Kyoto, Japan), equipped with a PDA detector and a C18 column (Luna Omega, Phenomenex, Torrance, CA, USA, 100 Å pore size, 5 μm particle size, 150 mm length, and 2.1 mm inner diameter). The eluent flow rate was set to 0.2 mL min−1 throughout the 20 min sample run. Isocratic elution was achieved using ultrapure water and methanol in a 70:30 ratio. Toluene detection limits in water (HPLC) and air (GC-MS) were found to be 0.1 mg L−1 and 0.05 ppm, respectively. All measurements were repeated to ensure that the standard deviation was less than 5%.
Determination of phenolic compounds in sprinkling water was conducted using the colorimetric p-nitroaniline method [19]. The analysis included the addition of 2 mL of 5% Na2CO3 and 4 mL of diazotised 5 mM p-nitroaniline into 100 mL of the sample. Light absorbance at the wavelength of λ = 477 nm was measured using a UV-Vis spectrophotometer (Heλios Beta, Thermo Scientific, Waltham, MA, USA).
Samples for the identification of aqueous oxidation intermediates were prepared by liquid–liquid extraction with a three-step addition of dichloromethane. The extraction was conducted in a 250 mL separation funnel. An aqueous sample was mixed with dichloromethane in a 1/1 (v/v) ratio and thoroughly agitated for 3 min, followed by the separation of the extract. The extract was dried using anhydrous Na2SO4 and filtrated through ceramic filters with a pore size of 40 μm. For the identification of oxidation intermediates, the extract was concentrated (1/10, v/v) and subjected to GC-MS analysis. The temperature of the injection port was maintained at 260 °C; the GC temperature programme started at 80 °C for a one-minute hold, with a subsequent increase to 250 °C at 10 °C min−1. Total ion current mass spectra were obtained by scanning ions over an m/z range that varied between 40 and 340, with a scan speed of 1666 amu s−1.
3. Results and Discussion
3.1. Toluene Absorption
Toluene-containing air passes through the PCD reactor equipped with a water sprinkler. Toluene vapour is absorbed by water approaching gas–liquid phase equilibrium (Figure 3a). The equilibrium concentration was calculated using Henry’s law, as shown in Equation (1) [20]:
where —the molar concentration of the VOC in water; pi—partial pressure of the VOC in gas; and H—Henry’s law solubility constant, mol kg−1 bar−1. Henry’s law solubility constant depends on temperature, as given in Equation (2):
where H(T) is the Henry’s law solubility constant at temperature T, and H0 is the Henry’s law solubility constant at the reference temperature T0 (298.15 K), which, for toluene, is 0.173 mol kg−1 bar−1 [21].
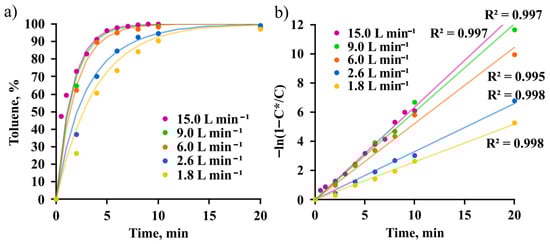
Figure 3.
Toluene aqueous concentrations relative to saturation (a) and their linearised logarithm forms vs. time at various circulating water flow rates (b): toluene concentration in air 36 ± 9 ppm; saturation toluene aqueous concentration 1.7 ± 0.4 mg L−1.
One can see from Figure 3a that the rate of toluene absorption is dependent on the water circulation rate: increased water flow enhances the dispersion of water droplets, expanding the interfacial contact surface and intensifying mass transfer. The mass-transfer rate is described by Equation (3):
where is a mass-transfer coefficient, s−1; is the toluene equilibrium concentration in liquid corresponding to the influent gas, mol m−3; and is the dissolved concentration of toluene in water. By solving differential Equation (3) in the concentration range from = 0 to , at times, from 0 to t, the equation acquires the linearised form of Equation (4) (Figure 3b):
In the range of circulation water flow rates studied, an asymptotic increase in was observed (Figure 4), making it evident that the intensified water flow results in increased mass-transfer parameters, with the interfacial surface area a on account of the increased number of droplets falling from the sprinkler per unit of time, and the turbulence in gas–liquid mixture summarised in the factor. Since the flow rate increased above 9 L min−1 has little effect on , the subsequent toluene degradation experiments were conducted at 9 L min−1, which was found to be optimal in terms of energy consumption for water recirculation, providing sufficiently high interfacial contact surface.
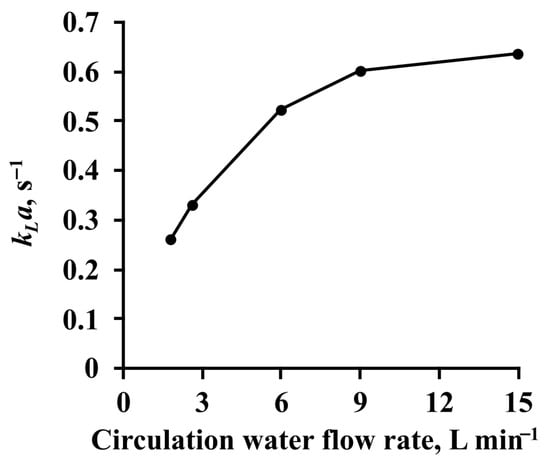
Figure 4.
Mass-transfer coefficient () dependent on the circulating water flow rate.
3.2. Toluene Oxidation in Gaseous Phase
The removal of toluene from the gaseous phase in the PCD reactor is illustrated in Figure 5. As expected, the increased pulsed power intensifies the toluene removal from 5% up to 55% at the powers of 3 and 100 W, respectively. Dependent on the applied pulsed power, the PCD air exhaust contained various concentrations of residual toluene and ozone undergoing the post-treatment with PCO in the downstream reactor. Removal of residual toluene in the PCO reactor was found to vary from 10% to 18% of incoming concentrations, reducing 4 to 12 ppm, depending on the toluene concentration. Such modest performance requires further development in, e.g., the increased catalyst’s surface area, and/or prolonging the contact time to provide an acceptable treatment result. Concerning the role of UV irradiance, the previous study by Altof et al. [22] demonstrated a minor effect on the 2-methoxyethanol degradation efficacy within 65 to 119 W m−2, explained by the diffusion limitation at the photocatalyst surface at high light intensities.
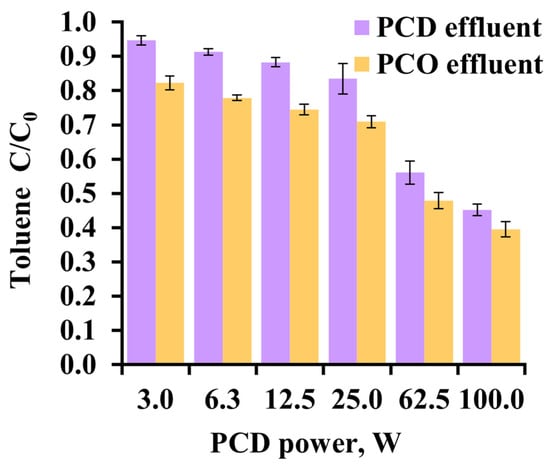
Figure 5.
Relative toluene vapour concentrations in (C/C0) PCD and PCO effluent, dependent on applied power in PCD: toluene initial concentration 82 ± 14 ppm, air flow rate 100 L min−1, circulation water flow rate 9 L min−1, and irradiance in PCO reactor 119 W m−2.
3.3. Aqueous Toluene Oxidation
Figure 6 presents data on the PCD oxidation of toluene in circulation water. Aqueous toluene concentration showed a rapid initial decrease due to the oxidation of toluene vapour, with subsequent balancing at a concentration determined by the applied PCD power: at 12.5 W, the aqueous toluene concentration reached 77% of the starting point, whereas at 100 W, the residual concentration comprised only 28% of the starting level. Ajo et al. [14] reported that •OH radicals formed at the plasma–liquid interface react in the gas–liquid boundary layer in the presence of molecular oxygen, known as a strong hydrogen radical (H•) scavenger. Preventing unproductive recombination of •OH and H• allows oxidation of dissolved species, thus making oxidation of aqueous toluene also highly probable.
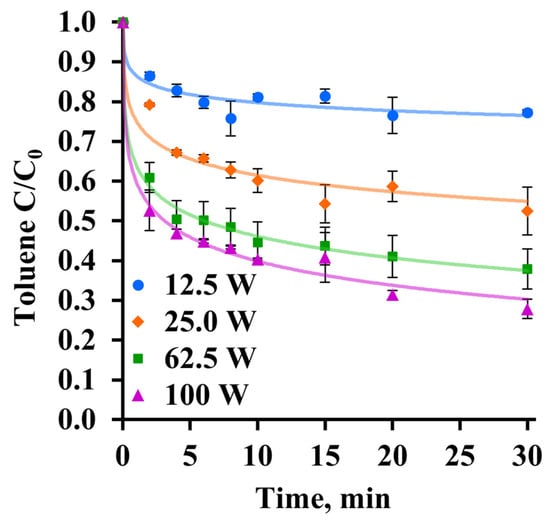
Figure 6.
Aqueous toluene concentration (C/C0) vs. time in PCD: water circulation flow rate 9 L min−1, air flow rate 100 L min−1, airborne influent toluene concentration 32 ± 2 ppm, and PCD ignition time 0 min.
3.4. Ozone Removal in Photocatalytic Reactor
Ozone is generated in PCD as a result of oxygen transformations (Equations (5)–(11)) induced by electron impact, radical attack, and interactions with other air components [15]:
O2 + e− → O+ + O• + 2e−
O2 + e− → 2O• + e−
O2 + e− → O− + O•
N2 + e− → 2N• + e−
N• + O2 → NO• + O•
N• + NO• → N2 + O•
O• + O2 + M → O3 + M
Although ozone possesses oxidative properties, it does little to remove, e.g., m-xylene in the gaseous phase [23]. Being a toxic gas, ozone contributes to secondary pollution of PCD-treated air, which is subjected to PCO, as air post-treatment is intended to eliminate both ozone and residual toluene.
Concentrations of ozone in the PCO reactor’s influent and effluent are given in Figure 7. One can see that its maximum concentration was observed in the absence of circulating water in the PCD reactor, denoted simply as air. A similar phenomenon was observed in the study by Lukeš et al. [24], which showed that water vapour absorbs a part of the electron energy that would otherwise contribute to ozone formation in plasma channels. Furthermore, ozone may decay in its reactions with H• formed from the dissociation of water molecules. It should also be noted that reduced ozone concentrations were also observed in experiments with toluene-polluted air, the reason for which likely lies in the competition between the formation of ozone and the oxidation of toluene. This effect is larger at higher powers and becomes negligible at lower pulse repetition rates, which is explained by the intensified oxidation of toluene at increased pulse repetition rates.
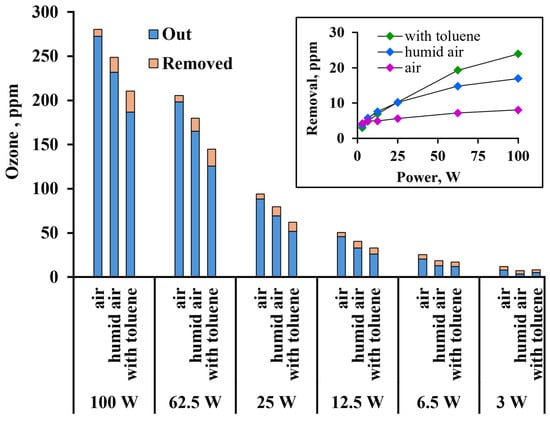
Figure 7.
Ozone concentration generated dependent on the applied power of the PCD and removed in the PCO reactor in air, humid air with water sprinkling, and in the presence of toluene. Experimental conditions are the same as those in Figure 6. The inset magnifies the orange parts of the columns (removed).
Ozone concentration decreases in the photocatalytic reactor, obeying zero-order reaction kinetics under the given experimental conditions, thus being irrelevant to its initial concentration but improving with a larger catalyst surface area and/or longer retention time [22].
The results show that the presence of a target compound for PCO improves the conversion of ozone. Possessing oxidising properties, ozone is prone to interact with electrons in the electron–hole pairs of the photocatalyst. The presence of a target to be oxidised by the positively charged hole prevents electron–hole recombination and thereby improves ozone conversion. Presumably, the reciprocal is also true: the scavenging of free electrons by ozone results in more active oxidation of an electron donor adsorbed at the photocatalyst’s surface.
3.5. Phenols in Circulation Water
The concentration of phenolic compounds detected in the circulating water increased during the 30 min experiment (Figure 8). The experiment showed the rate of toluene gas-phase oxidation exceeding that of aqueous phenolic compounds, with a presumable achievement of a balance, when these rates level out at a certain equilibrium, at which the rate of phenolic compound production will become comparable to their oxidation rate. This hypothesis is supported by the concentration of toluene vapours in treated air reaching constant levels (Figure 6). A similar tendency is seen in Figure 8, where at 100 W, the concentration of phenolic compounds demonstrates a slight decline. It is noteworthy that phenolic compounds exhibit approximately equal concentrations in water at different PCD powers, whereas airborne toluene concentrations vary greatly, indicating different oxidation rates not only of airborne toluene but also expected differences in the oxidation rates of aqueous phenols.
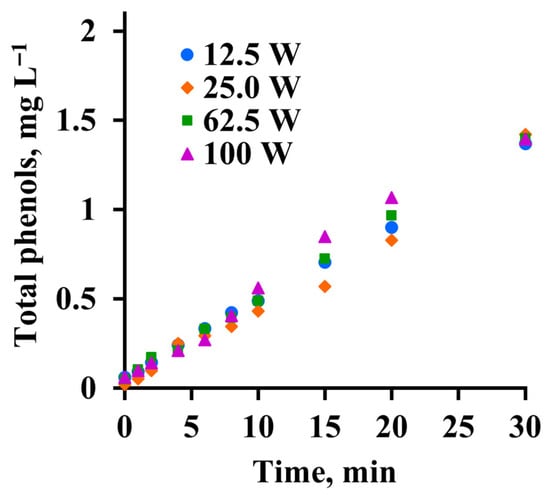
Figure 8.
Phenolic compound accumulation in PCD reactor circulation water over the course of a 30 min experiment; experimental conditions are the same as those in Figure 6.
3.6. Toluene Oxidation Products
Identification of aqueous toluene oxidation intermediates (Figure 9, Table 1) using GC-MS allowed outlining the rationale for PCD degradation through four major routes, including hydroxylation of the aromatic ring and methyl group, decarboxylation, ring-opening, and nitration reactions (Figure 10). The GC-MS chromatogram, with corresponding peaks for identified transformation products and retention times, is shown in Figure 9. Unmarked peaks in the chromatogram belong to impurities unrelated to the toluene degradation process.
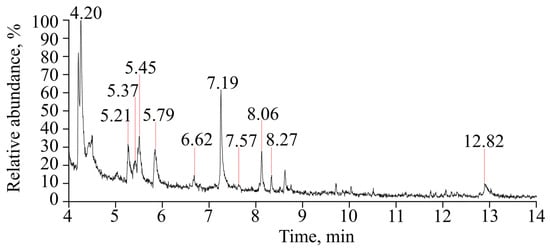
Figure 9.
Chromatogram of GC-MS analysis for the identification of toluene oxidation products found in the PCD reactor circulation water (temperature 22 ± 2 °C, gas flow rate 100 L min−1, water circulation rate 9 L min−1, toluene initial concentration in air 52 ± 8 ppm, and pulsed power 100 W).

Table 1.
List of toluene oxidation products identified by GC-MS.
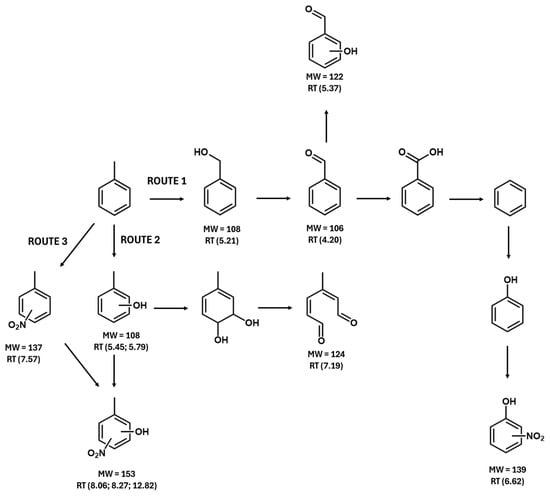
Figure 10.
Rationale of toluene PCD oxidation: MW—exact molecular weight of compound; RT—retention time in a chromatogram.
Hydroxylation of the methyl group (Figure 10, route 1) proceeds via a sequence of hydrogen abstractions induced by hydroxyl radicals, with subsequent reactions of the corresponding organic radicals with oxygen and/or water. The sequence follows the formation of hydroxyl, aldehyde, and carboxylic groups, producing benzoic acid as a result. The latter is involved in the decarboxylation process, forming carbon dioxide and benzene. Hydroxylation of benzene produces phenol.
Besides the hydroxylation of the methyl group, •OH is prone to react with the aromatic ring, producing phenolic compounds, including cresols (Figure 10, route 2). Further hydroxylation forms a precursor for the aromatic-ring-opening reactions, where a sequence of OH-group attachments leads to the C-C bond cleavage and the formation of diketone (Table 1, Figure 10, route 2).
Toluene and its oxidation by-products experience a nitration process initiated by nitrogen and oxygen ionisation and corresponding radical reactions in a plasma environment. First, ionisation of airborne nitrogen caused by electron impact produces active species, including N•, N2•, and N2+. Their interactions with oxygen result in the formation of nitrogen oxides. Interfacial reaction of NO2 with •OH produces nitric acid, the presence of which in the aqueous phase was reported earlier [23]. Organic nitrous compounds, although barely detected in the aqueous samples, may form in reactions of other reactive nitrogen species with toluene [15,25].
3.7. Energy and Cost Efficiency
Toluene energy yield, i.e., the energy efficiency of PCD oxidation, is calculated using Equation (12):
where E is energy efficiency, g kW−1 h−1; ΔC is the decrease in concentration, g m−3; Q is the air volumetric flow rate, m3 h−1; and P is the applied pulsed power, kW.
The results for energy efficiency are presented in Figure 11, which shows its dependence on the delivered pulsed power controlled by the pulse repetition frequency. One can see that the energy efficiency is highest at the lowest power, decreasing four times from 37.1 to 9.0 g kW−1 h−1 with the increased pulse repetition frequency from 25 to 800 pps, respectively. From Figure 11, two distinct trends in the oxidation rate are observed: from 3 to 25 W, during which the energy efficiency drops dramatically with increased power, and from 25 to 100 W, where the efficiency remains practically unchanged. The authors explain these trends by the proportion of reactants: toluene and oxidants. Once the instantaneous concentration of oxidants is low, their growth at a constant toluene concentration results in a disproportionately increased reaction rate. Conversely, once the oxidants’ concentration exceeds the point of equality with toluene, the further oxidation rate grows proportionally with the concentration of the oxidants. The reason for the disproportional growth at low powers is explained by the potential of longer-living oxidants realised in toluene oxidation during longer pauses between pulses.
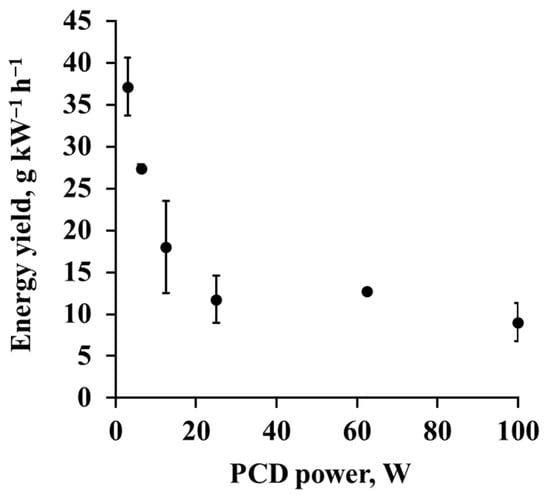
Figure 11.
Toluene oxidation energy yield with varying PCD powers; experimental conditions are the same as those in Figure 5.
The energy efficiency numbers observed in this study exceed the energy efficiencies reported earlier for various types of non-thermal plasma with similar initial toluene concentrations (Table 2). Higher energy efficiency of pulsed corona discharge compared to other types of non-thermal plasma was observed earlier [11].
Table 2.
Comparison of results obtained in toluene treatment by non-thermal plasma in selected studies.
The electricity cost for toluene removal with the current experimental equipment was calculated for the PCD treatment at pulsed power varying from 3.0 to 100 W. Figure 12 presents the electricity costs for toluene oxidation and ozone removal. The electric output-to-input ratio of the pulse generator, comprising 67%, is taken into account [33]. Electricity cost is assumed to be at EUR 0.13 per kWh, an average in Estonia in 2024 [34], making the toluene removal in the PCD reactor range from EUR 5.2 to 22.5 kg−1. For PCO, the cost is based on irradiance on the photocatalyst surface, 119 W m−2, which was provided by the luminescent lamps. Direct solar radiation, if used for photocatalyst activation, will dramatically reduce the cost.
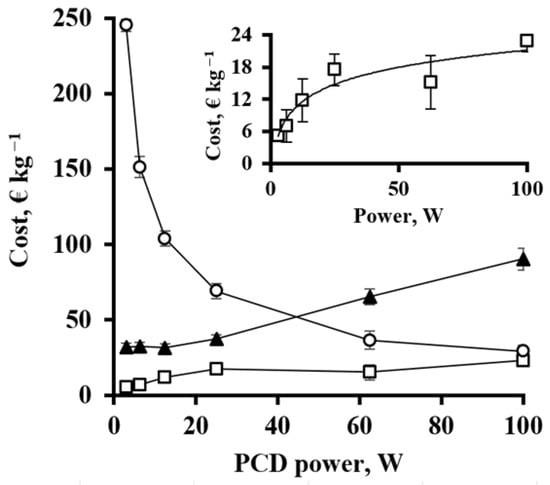
Figure 12.
Electricity cost for toluene and ozone removal with varying PCD reactor powers: ▲—toluene degradation in PCD; □—toluene degradation in PCO; ○—ozone conversion in PCO. Experimental conditions are the same as those in Figure 5. Inset: detailed outline of electricity cost in PCD.
4. Conclusions
Pulsed corona discharge combined with air post-treatment photocatalytic oxidation is proposed for the purification of polluted air containing hazardous volatile organic compounds. Airborne toluene was effectively oxidised in a medium-scale PCD reactor with water sprinkling. Higher pulse repetition rates increase toluene removal by up to 54.8%, with toluene removed by PCD alone from incoming air at an energy efficiency of 9.0 g kWh−1 (Ctoluene = 84 ± 14 ppm, Q = 100 L min−1, 800 pulses per second). Degradation intermediates of toluene include benzaldehyde, benzylalcohol, 3-methylhexa-2,4-dienedial, cresols, and nitrophenols. The main oxidation route of toluene proceeds through hydroxylation of either methyl group or aromatic ring, which eventually leads to ring-opening reactions. The concentration of phenolic compounds was quantified by the p-nitroaniline method, showing a steady increase in phenolic substances in the circulation water over time. Ozone generated in the PCD reactor is partly removed in a photocatalytic reactor with the TiO2 photocatalyst and artificial UV-A irradiation (I = 119 W m−2). Ozone removal is enhanced by the presence of water vapour and toluene in the exhaust gases of the PCD reactor.
Author Contributions
Conceptualisation, D.A.T. and J.B.; methodology, D.A.T. and J.B.; validation, D.A.T., J.B. and S.P.; formal analysis, D.A.T. and J.B.; investigation, D.A.T. and J.B.; resources, S.P.; data curation, D.A.T.; writing—original draft preparation, D.A.T.; writing—review and editing, J.B. and S.P.; visualisation, D.A.T. and J.B.; supervision, J.B. and S.P.; project administration, S.P.; funding acquisition, S.P. All authors have read and agreed to the published version of the manuscript.
Funding
This work was funded by the Ministry of Education and Research (Estonia) through the Centre of Excellence in Circular Economy for Strategic Mineral and Carbon Resources (1 January 2024–31 December 2030, TK228).
Data Availability Statement
The raw data supporting the conclusions of this article will be made available by the authors upon request.
Conflicts of Interest
The authors declare no conflicts of interest. The funders had no role in the design of the study; in the collection, analyses, or interpretation of the data; in the writing of the manuscript; or in the decision to publish the results.
Abbreviations
The following abbreviations are used in this manuscript:
| AOP | Advanced oxidation process |
| BTEX | Benzene, toluene, ethylbenzene, and xylene |
| CD | Corona discharge |
| DBD | Dielectric barrier discharge |
| DPBD | Dielectric packed-bed discharge plasma |
| FTIR | Fourier-transform infrared spectroscopy |
| GAD | Gliding arc discharge |
| GC-MS | Gas chromatograph–mass spectrometer |
| HPLC | High-performance liquid chromatography |
| PCD | Pulsed corona discharge |
| PCO | Photocatalytic oxidation |
| PDA | Photodiode array detector |
| PET | Polyethylene terephthalate |
| pm | Particulate matter |
| ppm | Parts per million |
| pps | Pulses per second |
| UV | Ultraviolet |
| VOC | Volatile organic compound |
Appendix A

Figure A1.
Experimental setup including an artificial air pollution system on the right, a PCD reactor in the middle, and a PCO reactor on the left.
Figure A1.
Experimental setup including an artificial air pollution system on the right, a PCD reactor in the middle, and a PCO reactor on the left.

References
- Council Directive 2016/2284/EU on the Reduction of National Emissions of Certain Atmospheric Pollutants. 2016. Available online: https://eur-lex.europa.eu/legal-content/EN/TXT/?uri=CELEX:02016L2284-20240206 (accessed on 6 October 2024).
- European Environment Agency. Air pollution in Europe. In EEA Briefing; Publications Office: Luxembourg, 2024; Available online: https://data.europa.eu/doi/10.2800/019282 (accessed on 6 October 2024).
- Geiss, O.; Giannopoulos, G.; Tirendi, S.; Barrero-Moreno, J.; Larsen, B.R.; Kotzias, D. The AIRMEX study—VOC measurements in public buildings and schools/kindergartens in eleven European cities: Statistical analysis of the data. Atmos. Environ. 2011, 45, 3676–3684. [Google Scholar] [CrossRef]
- Bolden, A.L.; Kwiatkowski, C.F.; Colborn, T. New Look at BTEX: Are Ambient Levels a Problem? Environ. Sci. Technol. 2015, 49, 5261–5276. [Google Scholar] [CrossRef]
- Sharma, N.; Agarwal, A.K.; Eastwood, P.; Gupta, T.; Singh, A.P. (Eds.) Air Pollution and Control. In Energy, Environment, and Sustainability; Springer: Singapore, 2018. [Google Scholar] [CrossRef]
- Khan, F.I.; Kr, A. Ghoshal, Removal of Volatile Organic Compounds from polluted air. J. Loss Prev. Process. Ind. 2000, 13, 527–545. [Google Scholar] [CrossRef]
- Schoofs, K.; Van Gastel, A.; Demuynck, M.; Baetens, D.; Vaes, K.; Denys, S. Closing the loop: A kinetic study on photocatalytic in situ regeneration of activated carbon filters for continuous indoor VOC removal. Chem. Eng. J. 2025, 518, 164590. [Google Scholar] [CrossRef]
- Vikrant, K.; Kim, K.-H.; Heynderickx, P.M.; Boukhvalov, D.W. Titanium carbide MXene/anatase titanium dioxide-supported gold catalysts for the low-temperature oxidation of benzene in indoor air. J. Colloid Interface Sci. 2025, 695, 137770. [Google Scholar] [CrossRef] [PubMed]
- Yang, H.; Wang, X.; Wang, J.; Liu, H.; Jin, H.; Zhang, J.; Li, G.; Tang, Y.; Ye, C. High-value utilization of agricultural waste: A study on the catalytic performance and deactivation characteristics of iron-nickel supported biochar-based catalysts in the catalytic cracking of toluene. Energy 2025, 323, 135806. [Google Scholar] [CrossRef]
- Fu, M.; Ma, Z.; Gao, C.; Ye, Y.; Li, W.; Hou, D.; Cao, Y. A Multi-Functional VOC Sensor Based on Cascaded Quartz Crystal Resonators. IEEE Electron Device Lett. 2025, 46, 476–479. [Google Scholar] [CrossRef]
- Kim, H. Nonthermal Plasma Processing for Air-Pollution Control: A Historical Review, Current Issues, and Future Prospects. Plasma Process. Polym. 2004, 1, 91–110. [Google Scholar] [CrossRef]
- Ono, R.; Oda, T. Dynamics of ozone and OH radicals generated by pulsed corona discharge in humid-air flow reactor measured by laser spectroscopy. J. Appl. Phys. 2003, 93, 5876–5882. [Google Scholar] [CrossRef]
- Wardman, P. Reduction Potentials of One-Electron Couples Involving Free Radicals in Aqueous Solution. J. Phys. Chem. Ref. Data 1989, 18, 1637–1755. [Google Scholar] [CrossRef]
- Ajo, P.; Kornev, I.; Preis, S. Pulsed Corona Discharge Induced Hydroxyl Radical Transfer Through the Gas-Liquid Interface. Sci. Rep. 2017, 7, 16152. [Google Scholar] [CrossRef]
- Parvulescu, V.I.; Magureanu, M.; Lukes, P. (Eds.) Plasma Chemistry and Catalysis in Gases and Liquids, 1st ed.; Wiley-VCH: Weinheim, Germany, 2012. [Google Scholar] [CrossRef]
- Feng, X.; Liu, H.; He, C.; Shen, Z.; Wang, T. Synergistic effects and mechanism of a non-thermal plasma catalysis system in volatile organic compound removal: A review. Catal. Sci. Technol. 2018, 8, 936–954. [Google Scholar] [CrossRef]
- Kask, M.; Bolobajev, J.; Krichevskaya, M. Gas-phase photocatalytic degradation of acetone and toluene, and their mixture in the presence of ozone in continuous multi-section reactor as possible air post-treatment for exhaust from pulsed corona discharge. Chem. Eng. J. 2020, 399, 125815. [Google Scholar] [CrossRef]
- Besley, L.M.; Bottomley, G.A. Vapor pressure of toluene from 273.15 to 298.15 K. J. Chem. Thermodyn. 1974, 6, 577–580. [Google Scholar] [CrossRef]
- Gan, E.V.; Haberman, H.F.; Menon, I.A. A simple and sensitive test for the determination of phenolic compounds in urine and its application to melanoma. J. Investig. Dermatol. 1975, 64, 139–144. [Google Scholar] [CrossRef]
- Sander, R. Compilation of Henry’s law constants (version 4.0) for water as solvent. Atmos. Chem. Phys. 2015, 15, 4399–4981. [Google Scholar] [CrossRef]
- Leighton, D.T.; Calo, J.M. Distribution coefficients of chlorinated hydrocarbons in dilute air-water systems for groundwater contamination applications. J. Chem. Eng. Data 1981, 26, 382–385. [Google Scholar] [CrossRef]
- Altof, K.; Krichevskaya, M.; Preis, S.; Tähemaa, T.; Bolobajev, J. Ozone-assisted degradation of 2-methoxyethanol in a prototype plug flow photocatalytic reactor. Chem. Eng. J. 2024, 481, 148488. [Google Scholar] [CrossRef]
- Altof, K.; Krichevskaya, M.; Preis, S.; Bolobajev, J. Oxidation of Airborne m-Xylene in Pulsed Corona Discharge: Impact of Water Sprinkling. ChemEngineering 2024, 8, 99. [Google Scholar] [CrossRef]
- Lukes, P.; Clupek, M.; Babicky, V.; Janda, V.; Sunka, P. Generation of ozone by pulsed corona discharge over water surface in hybrid gas–liquid electrical discharge reactor. J. Phys. Appl. Phys. 2005, 38, 409–416. [Google Scholar] [CrossRef]
- Ng, N.L.; Brown, S.S.; Archibald, A.T.; Atlas, E.; Cohen, R.C.; Crowley, J.N.; Day, D.A.; Donahue, N.M.; Fry, J.L.; Fuchs, H.; et al. Nitrate radicals and biogenic volatile organic compounds: Oxidation, mechanisms, and organic aerosol. Atmos. Chem. Phys. 2017, 17, 2103–2162. [Google Scholar] [CrossRef] [PubMed]
- Guo, Y.; Liao, X.; Fu, M.; Huang, H.; Ye, D. Toluene decomposition performance and NOx by-product formation during a DBD-catalyst process. J. Environ. Sci. 2015, 28, 187–194. [Google Scholar] [CrossRef] [PubMed]
- Korzekwa, R.A.; Grothaus, M.G.; Hutcherson, R.K.; Roush, R.A.; Brown, R. Destruction of hazardous air pollutants using a fast rise time pulsed corona reactor. Rev. Sci. Instrum. 1998, 69, 1886–1892. [Google Scholar] [CrossRef]
- Byeon, J.H.; Park, J.H.; Jo, Y.S.; Yoon, K.Y.; Hwang, J. Removal of gaseous toluene and submicron aerosol particles using a dielectric barrier discharge reactor. J. Hazard. Mater. 2010, 175, 417–422. [Google Scholar] [CrossRef]
- Du, C.M.; Yan, J.H.; Cheron, B. Decomposition of toluene in a gliding arc discharge plasma reactor. Plasma Sources Sci. Technol. 2007, 16, 791–797. [Google Scholar] [CrossRef]
- Ondarts, M.; Hajji, W.; Outin, J.; Bejat, T.; Gonze, E. Non-Thermal Plasma for indoor air treatment: Toluene degradation in a corona discharge at ppbv levels. Chem. Eng. Res. Des. 2017, 118, 194–205. [Google Scholar] [CrossRef]
- Harling, A.M.; Glover, D.J.; Whitehead, J.C.; Zhang, K. Novel Method for Enhancing the Destruction of Environmental Pollutants by the Combination of Multiple Plasma Discharges. Environ. Sci. Technol. 2008, 42, 4546–4550. [Google Scholar] [CrossRef]
- Mista, W.; Kacprzyk, R. Decomposition of toluene using non-thermal plasma reactor at room temperature. Catal. Today 2008, 137, 345–349. [Google Scholar] [CrossRef]
- Preis, S.; Panorel, I.C.; Kornev, I.; Hatakka, H.; Kallas, J. Pulsed corona discharge: The role of ozone and hydroxyl radical in aqueous pollutants oxidation. Water Sci. Technol. 2013, 68, 1536–1542. [Google Scholar] [CrossRef]
- Eurostat. Electricity Prices for Non-Household Consumers—Bi-Annual Data (from 2007 Onwards). 2024. Available online: https://ec.europa.eu/eurostat/databrowser/product/page/NRG_PC_205 (accessed on 16 January 2020).


Disclaimer/Publisher’s Note: The statements, opinions and data contained in all publications are solely those of the individual author(s) and contributor(s) and not of MDPI and/or the editor(s). MDPI and/or the editor(s) disclaim responsibility for any injury to people or property resulting from any ideas, methods, instructions or products referred to in the content. |
© 2025 by the authors. Licensee MDPI, Basel, Switzerland. This article is an open access article distributed under the terms and conditions of the Creative Commons Attribution (CC BY) license (https://creativecommons.org/licenses/by/4.0/).